





1. Introduction
Granular materials can be considered as complex fluids with a finite yield stress that is associated with the transition between solid- and liquid-like states (Jaeger, Nagel & Behringer Reference Jaeger, Nagel and Behringer1996; Andreotti, Forterre & Pouliquen Reference Andreotti, Forterre and Pouliquen2013). Because of the highly dissipative and heterogeneous nature of granular materials, a generally applicable description of granular materials as continuum is still lacking, despite continuous efforts over the past decades (Jenkins & Savage Reference Jenkins and Savage1983; Goldhirsch Reference Goldhirsch2003; Forterre & Pouliquen Reference Forterre and Pouliquen2008). Concerning widespread examples of handling granular materials in nature, industrial sectors and our daily lives (Duran Reference Duran2000; Aguirre et al. Reference Aguirre, Luding, Pugnaloni and Soto2021), it is essential to understand the response of granular materials to disturbance by rigid objects such as an auger (Imole et al. Reference Imole, Krijgsman, Weinhart, Magnanimo, Montes, Ramaioli and Luding2016). In this regard, there have been extensive investigations on, for instance, the impact of a granular jet on a rigid plane (Müller, Formella & Pöschel Reference Müller, Formella and Pöschel2014) or projectile impact on granular media (Brzinski & Durian Reference Brzinski III and Durian2010; Colaprete et al. Reference Colaprete2010; van der Meer Reference van der Meer2017; Huang et al. Reference Huang, Hernández-Delfin, Rech, Dichtl and Hidalgo2020), crater formation (Ruiz-Suárez Reference Ruiz-Suárez2013) and on bio-mechanical topics including drag reduction through self-propulsion used by organisms(Liu, Powers & Breuer Reference Liu, Powers and Breuer2011; Jung et al. Reference Jung, Choi, Kim and Kim2017; Texier, Ibarra & Melo Reference Texier, Ibarra and Melo2017) and locomotion in granular systems (Aguilar et al. Reference Aguilar2016).
From the application perspective, drilling into granular media by means of helical motion for sample collection, instrument installation or construction purposes finds applications in civil and chemical engineering as well as conventional energy sectors. As such, a wide variety of screw conveyors can be found in chemical and process engineering industries to enhance the transport and mixing of granular materials (Xiong et al. Reference Xiong, Aramideh, Passalacqua and Kong2015b; Pang et al. Reference Pang, Wang, Wang, Yang, Lu, Hassan and Jiang2018). In the new era of space exploration, the exploration of extraterrestrial regolith in terms of granular sample collection leads to the deployment of various types of granular samplers for exploring the geological evolution of extraterrestrial bodies, such as the Luna probe project from the former Soviet Union and America's Apollo project (Zacny et al. Reference Zacny2008). Due to the advantages of auger transport, various drill samplers have been developed for different space exploration projects, such as ESA's MOONBIT project (Poletto et al. Reference Poletto, Magnani, Gelmi, Corubolo, Re, Schleifer, Perrone, Salonico and Coste2015), NASA's ExoMars project (Zacny, Quayle & Cooper Reference Zacny, Quayle and Cooper2004; Firstbrook et al. Reference Firstbrook, Worrall, Timoney, Suñol, Gao and Harkness2017) and Japan's LUNAR-A mission (Nakajima et al. Reference Nakajima, Hinada, Mizutani, Saitoh, Kawaguchi and Akio1996; Nagaoka et al. Reference Nagaoka, Kubota, Otsuki and Tanaka2010). China's Chang'e lunar exploration project also used an auger drill sampler to collect and return subsurface lunar regolith (Quan et al. Reference Quan, Tang, Yuan, Jiang and Deng2017; Zhang & Ding Reference Zhang and Ding2017). Although auger transport has been widely implemented in the applications, modelling auger conveyance of granular materials is still a challenging subject (Imole et al. Reference Imole, Krijgsman, Weinhart, Magnanimo, Montes, Ramaioli and Luding2016).
In connection to the fundamental understanding of granular drag, continuous investigations have been devoted to auger conveyance of granular materials by means of constitutive models (Yu & Arnold Reference Yu and Arnold1997; Roberts Reference Roberts1999; Dai & Grace Reference Dai and Grace2008), experiments (Waje, Thorat & Mujumdar Reference Waje, Thorat and Mujumdar2006; Ramaioli Reference Ramaioli2008; Imole et al. Reference Imole, Krijgsman, Weinhart, Magnanimo, Montes, Ramaioli and Luding2016) and numerical simulations using either computational fluid dynamics (Xiong et al. Reference Xiong, Aramideh, Passalacqua and Kong2015a; Duan et al. Reference Duan, Feng, Michaelides and Mao2017) or discrete element methods (DEM) (Shimizu & Cundall Reference Shimizu and Cundall2001; Ramaioli Reference Ramaioli2008; Owen & Cleary Reference Owen and Cleary2009) in the past decades. Most of the studies show that operating conditions, such as the rotational speed of the auger, the inclination of the auger conveyor and the initial filling fraction of the bulk materials, significantly affect the performance of an auger conveyor. It was found that both the intruder's configuration (Gravish, Umbanhowar & Goldman Reference Gravish, Umbanhowar and Goldman2010; Guillard, Forterre & Pouliquen Reference Guillard, Forterre and Pouliquen2014) and velocity (Uehara et al. Reference Uehara, Ambroso, Ojha and Durian2003; Katsuragi & Durian Reference Katsuragi and Durian2007) significantly affect the drag force. In particular, recent experiments revealed configurations for a rotating cylinder to drill inside granular materials with surprisingly low torque (Guillard, Forterre & Pouliquen Reference Guillard, Forterre and Pouliquen2013; Liu et al. Reference Liu, Wan, Wang and Wu2017). This is in agreement with the weakened resistance of soil against penetration by a spinning cone (Jung et al. Reference Jung, Choi, Kim and Kim2017) or a rotating helix (Liu, Powers & Breuer Reference Li, Jiang, Tang, Xu, Ma, Zhang, Qin and Deng2011) found in experiments.
More recently, the drill used in China's Chang'e lunar exploration project has been a subject of series investigations, particularly on the interactions between the soil and the auger. Zhang & Ding (Reference Zhang and Ding2017) numerically and experimentally investigated the penetration force and rotational torque of the drill, and found that the penetration force can be reduced due to self-propulsion. Quan et al. (Reference Quan, Tang, Yuan, Jiang and Deng2017) proposed an index to characterize the condition for the occurrence of choking, a phenomenon in which the cuttings build up in the auger flight and cause the rotational torque to increase sharply (Statham, Hanagud & Glass Reference Statham, Hanagud and Glass2012). Zhao et al. (Reference Zhao, Tang, Hou, Jiang and Deng2016) found a maximal removal capability for the cutting conveyance. Tang et al. (Reference Tang, Quan, Jiang, Li, Bai, Tang and Deng2018a,Reference Tang, Quan, Jiang, Liang, Lu and Yuanb) illustrated the coupling between the granular flow in the auger flight and that in the coring tube. Specifically, these experimental results revealed that the coring results crucially depend on the drilling conditions, characterized by an index called the penetration per revolution (PPR). If the PPR value is not suitable, the drill may either enter into a failure mode due to choking or only sample a small amount of soil. For a successful soil sampling, a proper PPR value should be selected according to the physical properties of the soil.
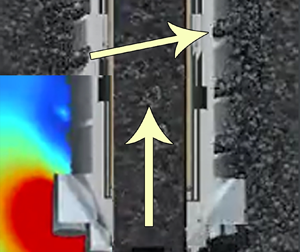
Here, we focus on auger conveyance of granular materials relevant to the drill tool shown in figure 1. The drill tool consists of a drill bit, a helical and right-handed auger and a hollow coring tube. In the drilling platform, soil is displaced in the following three processes (Li et al. Reference Li, Jiang, Tang, Xu, Ma, Zhang, Qin and Deng2017; Zhang et al. Reference Zhang, Zhang, Wang, Gao, Hou, Ji and Ding2017): (i) the cutting process, in which the stiff soil is loosened by the drill bit (Perneder, Detournay & Downton Reference Perneder, Detournay and Downton2012); (ii) the discharging process, in which the cuttings are removed from the bottom of the borehole to the ground surface; (iii) the coring process, in which the soil is sampled into the hollow coring tube. Generally speaking, the three processes are coupled together to affect both drilling loads and coring results. This investigation aims at modelling the latter two processes as the efficiency of soil sampling relies predominantly on them.
Schematic of the experimental apparatus (a) and the drill tool (b) with geometrical variables defined. Inset of (a) is a snapshot of the drill bit detached from the coring tube used in the experiments. (c,d) Correspond to the experimental set-up and snapshots of the two lunar simulants with their angles of repose marked. Note that plot (b) is not to scale.

Experimental results suggest the ratio between the penetration and rotation speeds to be an important dimensionless parameter controlling sampling efficiency. Theoretically, a one-dimensional continuum model is established to describe granular flow in both coring and discharging channels. Quantitative comparisons with the experimental results indicate that our model successfully captures the essential role played by the ratio between the penetration and rotational speed in determining the coring results. Finally, steady-state analysis of granular flow yields an analytical prediction of sampling efficiency, providing a practical way to control sample collection with auger drilling.
The remainder of this article is organized as follows: § 2 briefly introduces the experimental set-up and presents the experimental results obtained from different drilling conditions and different types of soils. The governing equations describing granular flows in the coring and discharging channels are developed in § 3. We compare experimental results with numerical ones from the theoretical model in § 4 and analyse the steady-state solution of the model in § 5. Finally, we conclude with an outlook for further investigations in § 6.
2. Experiment
As illustrated in figure 1, the experimental apparatus mainly consists of a drill platform, a drill bit, a helical and right-handed hollow auger, a sampling device and a soil container. The sampling device contains a coring tube inside the hollow auger. The cylindrical container has a diameter and height of  $0.52$ m and $2.5$ m, respectively. The geometric profile of the auger can be defined by four parameters: auger flight radius $r_o=1.75$ cm, coring tube radius $r_i=1.55$ cm, pitch $b=1.20$ cm, blade thickness $t_c=0.10$ cm and groove depth $a=r_o-r_i=0.20$ cm. For sample collection, a soft bag is attached to the inner surface of the coring tube. Throughout the entire drilling process, the coring tube, together with the sample collected, moves along with the auger without rotation.
Before drilling starts, the granular sample is compacted by vibration to create a reproducible initial condition. More specifically, we incorporate a five-stage sample filling and vibration process to ensure a dense initial packing. Based on the maximum packing density of a specific sample, we add each time  $1/5$ of the total mass (note that approximately one ton of sample is used in each experiment) into the container. Initially, the whole container is vibrated in the vertical direction against gravity at $30$ Hz for $5$ min. Subsequently, tri-axial vibrations are applied at the same frequency for $20$ min to further compact the sample. Based on a previous investigation Nowak et al. (Reference Nowak, Knight, Ben-Naim, Jaeger and Nagel1998), the number of taps through this process (close to $10^{5}$) is sufficient for the system to reach a steady state. Finally, the height of the granular layer is monitored to check whether the desirable packing density is achieved or not. If not, $10$ min tri-axial vibrations are applied additionally to compact the sample, before the whole process repeats for the next batch of sample.
Subsequently, the drill tool rotates and penetrates synchronously into the granular sample. The initially compacted soil surrounding the drill tool is then fluidized as the drill bit cuts through. As shown in figure 1(a), the drill bit includes four cutting edges organized symmetrically about the central axis. The diameter of the inner tube matches that of the coring tube to facilitate sample flow from the drill bit to the coring tube. The outer radius of the drill bit is slightly larger than that of the auger flight for effectively fluidized lunar simulants to flow through the outer channel. After fluidization, the soil is transported upwards through either the coring tube or the auger. Once the target depth is reached, both penetration and rotational motions stop simultaneously, meanwhile the coring tube is closed by a sealing device to complete the sample collection process.
Experiments have shown that the coring results are determined by the physical properties of the soil and the kinematic parameters of the drill tool (Zhang & Ding Reference Zhang and Ding2017; Tang et al. Reference Tang, Quan, Jiang, Li, Bai, Tang and Deng2018a,Reference Tang, Quan, Jiang, Liang, Lu and Yuanb). In the experiment, we use two types of simulated lunar soils (Carrier 2003) with grey basaltic pozzuolana as the main component. The grain size in the simulated Soil-I (SS-I) ranges from 0.1 to 1 mm, and that in the simulated Soil-II (SS-II) ranges from 1 to 2 mm. The bulk densities of the two simulated soils are  $\rho _{{I}}= 2.13\,{\rm g}\,{\rm cm}^{-3}$ and $\rho _{{II}}=1.85\,{\rm g}\,{\rm cm}^{-3}$, respectively. The packing fractions of the two soils are $\psi _{{I}}=0.71$ and $\psi _{{II}}=0.60$. As shown in figure 1(d), their internal friction angles are $\phi _{{I}}=35.7^{\circ }$ and $\phi _{{II}}=31.0^{\circ }$, respectively.
The motion of the drill is determined by two parameters: penetration speed  $v$ and rotational speed $\omega$. Feedback loop in motor control is employed to ensure constant $v$ and $\omega$ throughout the drilling process. The experiments are conducted under three different rotational speeds: $\omega =80, 120, 160$ r.p.m. For each $\omega$, the penetration speed ranges from $10$ to $360\,{\rm mm}\,{\rm min}^{-1}$. The target depth is set to $H=1.0$ m for all experiments.
In order to characterize the geometry and kinematics of the auger flights, we introduce the geometry-dependent helical angle  $\beta$ and the elevation angle $\alpha$ of the velocity vector for a point $P$ on the auger flight. As shown in figure 2, the geometry dependent helical angle $\beta$ is defined as
 \begin{equation} \tan\beta = \frac{b}{ 2{\rm \pi} r}, \end{equation}
with  $r$ the distance of $P$ to the rotation axis. Once drilling starts, $P$ undergoes a helical motion with fixed radial distance and an elevation angle $\alpha$, which can be estimated with
 \begin{equation} \tan\alpha = \frac{v}{\omega r}. \end{equation}
Note that, for the special case of  $\alpha =\beta$, point $P$ moves along the streamwise direction (flight direction), reminiscent of inserting a straight hollow tube into the granular sample. In this case, the grains in the auger remain static and cannot be discharged. Consequently, the sample height in the coring tube equals the drilling depth. If $\beta < \alpha$, the drill drives granular particles downward and the enforced compaction may lead to chocking at the bottom of the drill. When $\beta > \alpha$, the drill drives the sample upward. As such, the relation between $\alpha$ and $\beta$ is crucial in the drilling process. Thus, we define the speed ratio $\gamma$ as a control parameter
 \begin{equation} \gamma = \frac{\tan\beta}{\tan\alpha} = \frac{\omega b}{2{\rm \pi} v}. \end{equation}
Granular flow in a segment of the external channel with two boundaries (dashed line). Here,  $u_s$ and $u_\xi$ are the components of the absolute flow velocity along the $\hat {\boldsymbol {s}}$ and $\hat {\boldsymbol {\xi }}$ directions, respectively; $v$ and $\omega r$ are the penetration and rotation velocities for the point on the auger at radius $r$, and $\alpha \def \arctan {v/(\omega r)}$.

To quantify the sampling efficiency, we define another dimensionless number
 \begin{equation} \zeta=\frac{m_i}{m_{max}}, \end{equation}
where  $m_i$ denotes the mass of the sampled soil in the coring tube as it reaches target depth $H$, and $m_{{max}}= {\rm \pi}\rho H r^{2}_i$ corresponds to the maximum mass of the soil at $H$ with $\rho$ bulk density of the sample.
Figure 3 shows the relations between  $\zeta$ and $\gamma$ for two types of soils under different configurations. It shows that: (i) for both types of soils, the sampling efficiency decreases monotonically to $0$ as $\gamma$ grows; (ii) for sample II, a systematic variation of driving conditions yields a master $\zeta - \gamma$ curve;(iii) each sample type has its own $\zeta - \gamma$ curve. The experimental results suggest that the drilling process is determined by both properties of the granular sample and speed ratio $\gamma$. Note that the lower bound of $\gamma$ is higher for SS-I in comparison with SS-II. This is because a highly compacted granular sample with smaller particle sizes requires a higher torque to drill into than that with larger particle sizes, particularly for small $\omega$.
Sampling efficiency as a function of speed ratio for two different types of soil used in experiments. For Soil-I, there are three different rotational speeds of 80, 120 and 160 r.p.m. For Soil-II, there is only one rotational speed of 120 r.p.m. We use the same marker to represent the experimental data collected at the same  $\omega$ but different $v$. Based on initial test runs, the uncertainty of the sampling efficiency is ${\sim }10\,\%$.

3. Continuum model
In this section, we introduce a continuum model for granular flow in both internal (in the coring tube) and external (on the auger flight) channels, in order to shed light on the experimental results presented above. As the granular sample has to fluidize before being displaced, it can be considered as a fluid. Because its flow in either internal or external channel is confined to either the vertical or helical direction, we consider the sample collection process as one-dimensional flows of incompressible fluids. The packing density change during the fluidization process at the drill bit is not considered here, because the model describes the flow of granular fluids in both internal and external channels. In the future, further experimental analysis on the change of packing density during the initial fluidization process is needed to incorporate compressibility of the granular sample into the model.
In the subsequent parts of the section, we introduce the governing equations based on mass and momentum balance for both internal and external channels, as well as the coupling in between. Finally, we conclude with a summary of five governing equations to numerically solve for the time-dependent mass and velocity in both channels as well as the pressure at the bottom of the drill.
3.1. Flow dynamics in internal channel
The sampling process in the internal channel concerns a domain  $\mathcal {D}$ with its two moving boundaries: the bottom $\partial \mathcal {D}^{b}$ and the top $\partial \mathcal {D}^{t}$ surfaces (see figure 4); $\partial \mathcal {D}^{b}$ moves downward with penetration velocity $v$, whereas $\partial \mathcal {D}^{t}$ takes the same velocity $u_i$ as the granular sample, assuming collective motion of all grains in the internal channel. As sketched in figure 4(b), one end of the soft bag is held firmly via an attached string. During the drilling process, the sample is being collected in the soft bag as the coring tube penetrates deeper into the lunar simulant. Since the normal stress between the granular material and the bag is relatively small in comparison with that in the outer channel, we neglect the frictional force between the granular sample and the inner tube. Granular flow in the inner channel can be considered as a one-dimensional flow. More details on the functionality of the soft bag can be found in Tang et al. (Reference Tang, Quan, Jiang, Liang, Lu and Yuan2018b).
Schematic of the internal channel. The dashed line represents the boundary  $\partial \mathcal {D}$ of the domain $\mathcal {D}$ filled by the particles in the internal channel. (b) Defines various components of the coring tube, including the soft bag used to collect the soil sample.

The mass sampled in the internal channel  $m_i$ is also time dependent, and its rate of change is governed by
 \begin{equation} \frac{\mathrm{d} m_i}{\mathrm{d} t}=\frac{\mathrm{d}}{\mathrm{d} t}\int_{\mathcal{D}}\rho \,\mathrm{d} V = \oint_{\partial \mathcal{D}}\rho v_n \,\mathrm{d} S=\rho (v-u_i)S_i, \end{equation}
where  $v_n$ is the velocity normal to the surface $\partial \mathcal {D}$ of the domain $\mathcal {D}$, and $S_i={\rm \pi} r_i^{2}$ denotes the cross-sectional area of the internal channel.
As the rate of momentum change for fluid in volume  $\mathcal {D}$ must be balanced by body force and surface pressure, the integral momentum balance reads
 \begin{equation} \frac{\mathrm{d} }{\mathrm{d} t}\int_{\mathcal{D}}\rho {u_i}\, \mathrm{d} V=\int_{\mathcal{D}} \rho {g} \,\mathrm{d} V + \oint_{\partial \mathcal{D}} {p_i} \,\mathrm{d} S, \end{equation}
where  ${p_i}$ is the normal pressure on the surface $\partial \mathcal {D}$.
The left-hand side of (3.2) satisfies
 \begin{align} \frac{\mathrm{d} }{\mathrm{d} t}\int_{\mathcal{D}}\rho {u_i} \,\mathrm{d} V &=\int_{\mathcal{D}} \rho \frac{\partial{u_i}}{\partial{t}}\,\mathrm{d} V+ \oint_{\partial \mathcal{D}} \rho {u_i} v_n \,\mathrm{d} S\nonumber\\ &= m_i \frac{\mathrm{d} u_i}{\mathrm{d} t} + \rho S_i u_i(v-u_i). \end{align}
Here,  $P$ denotes the normal pressure exerted on boundary $\partial \mathcal {D}^{b}$. Note that the top boundary $\partial \mathcal {D}^{t}$ is a free surface. The second term of the right-hand side of (3.2) can be written as
 \begin{equation} \oint_{\partial \mathcal{D}} {p_i} \,{\rm d}S ={-}PS_i. \end{equation}
Thus, (3.2) can be expressed as
 \begin{equation} m_i \frac{\mathrm{d} u_i}{\mathrm{d} t} =m_i g-PS_i-\rho S_i u_i(v-u_i). \end{equation}
 In summary, granular flow in the internal channel is governed by the continuum equation (3.1) and the momentum balance equation (3.2) with three time-dependent variables:  $m_i$, $u_i$ and $P$.
$P$.
3.2. Flow dynamics in external channel
Figure 2 shows the central layer of the equivalent chute flow along the streamwise direction. Note that the helical motion of the granular sample in the external channel is similar to a granular chute flow with inclination angle  $\beta$, considering the auger flight being unwrapped. In the flowing layer, we establish a coordinate system with unit vectors $\hat {\boldsymbol {s}}$ and $\hat {\boldsymbol {\xi }}$ representing the streamwise and normal directions, respectively. We assume that the granular sample fills up the helix groove along the $\hat {\boldsymbol {\xi }}$ direction, but the flow thickness $\eta$ is smaller than the groove depth $a$ (see figure 1b) to account for the loss of materials due to mass exchange between the external channel and the surroundings. Therefore, the central layer of the flow has a radial distance $\bar {r}=r_i+\eta /2$, and an inclination angle $\beta =b/(2{\rm \pi} \bar {r})=b/[{\rm \pi} (2r_i+\eta )]$. Because the thickness of the coring tube is relatively small in comparison with $r_{i}$ or $\eta$, it is neglected in the current investigation. The width of the flowing layer is then computed as $\xi = b\cos \beta$, and the cross-sectional area of the external channel is given by $S_o=\xi \eta =\eta b\cos \beta$.
The discharging process of granular flow in the external channel is related to a time-dependent domain  $\mathcal {R}$ with two boundaries: the fixed boundary $\partial \mathcal {R}^{u}$ on the soil surface, and a moving boundary $\partial \mathcal {R}^{d}$ on the bottom surface of the drilling hole (see figure 2). Note that the boundary $\partial \mathcal {R}^{d}$ moves with the drilling velocity $v$ and the area of $\partial \mathcal {R}^{d}$ is $S_o/\sin \beta$ according to the geometrical relationship shown in figure 2. The mass of grains flowing into the external channel is $m_o$, and its rate of change is governed by
 \begin{equation} \frac{\mathrm{d} m_o}{\mathrm{d} t}=\frac{\mathrm{d} }{\mathrm{d} t}\int_{\mathcal{R}}\rho \,\mathrm{d} V = \oint_{\partial \mathcal{R}}\rho v_n \,\mathrm{d} S =\rho v \frac{S_o}{\sin\beta}, \end{equation}
which is a constant under the conditions of constant penetration velocity  $v$, cross-sectional area $S_o$ and bulk density $\rho$. Thus, we have $m_o = \rho S_o v t /\sin \beta$.
Similar to the case of the internal channel, we assume a homogeneous flow velocity  $u_s$ along the streamwise direction in the external channel. Momentum balance can then be expressed as
 \begin{equation} \frac{\mathrm{d} }{\mathrm{d} t}\int_{\mathcal{R}}\rho u_s \,\mathrm{d} V ={-}\int_{\mathcal{R}} \rho g \sin\beta \,\mathrm{d} V + \oint_{\partial \mathcal{R}} t_o(s) \,\mathrm{d} S, \end{equation}
where  $t_o(s)$ is the surface stress exerted on the boundary ${\partial \mathcal {R}}$. Note that the left-hand side of (3.7) can be written as
 \begin{align} \frac{\mathrm{d} }{\mathrm{d} t}\int_{\mathcal{R}}\rho u_s \,\mathrm{d} V &=\int_{\mathcal{R}} \rho \frac{\partial{u_s}}{\partial t}\,\mathrm{d} V + \oint_{\partial \mathcal{R}} \rho u_s v_n \,\mathrm{d} S\nonumber\\ &=m_o \frac{\mathrm{d} u_s}{\mathrm{d} t}+ \rho v u_s \frac{S_o }{\sin\beta}, \end{align}
with surface normal pressure  $P$ exerted on boundary $\partial \mathcal {R}^{d}$. Hence, (3.7) can be rewritten as
 \begin{equation} m_o \frac{\mathrm{d} u_s}{\mathrm{d} t}={-}m_o g\sin{\beta} - \frac{\rho S_o v u_s}{\sin\beta} + PS_o +F_r, \end{equation}
where  $F_r$ is the frictional force exerted on the lateral surfaces of the flowing layer. It plays an important role in determining the granular flow in the external channel, which is discussed in detail in the following.
3.3. Frictional force on the flow in external channel
The flowing layer enclosed in the domain  $\mathcal {R}$ of the external channel is subjected to gravity, centrifugal force and surface stresses. We need to consider internal stress and lateral friction in describing the flowing layer.
To analyse the frictional force on the lateral surfaces of the flowing layer, we select an infinitesimal hexahedron element  $(\xi \times \eta \times \mathrm {d} s)$, as illustrated in figure 5(b,c). There are four lateral surfaces designated by $\mathrm {d} A_j$ ( $j=1,2,3,4$); $\mathrm {d} A_1$ and $\mathrm {d} A_3$ are the lateral surfaces in touch with the surrounding static granular materials and the groove bottom, respectively. Their areas are computed as $\mathrm {d} A_1 =\mathrm {d} A_3 =\xi \times \mathrm {d} s$. Also, $\mathrm {d} A_2$ and $\mathrm {d} A_4$ are the lateral surfaces contacting the top and bottom surfaces of the auger flight, respectively, and $\mathrm {d} A_2 =\mathrm {d} A_4 =\eta \times \mathrm {d} s$. The magnitudes of shear and normal stresses on each lateral surface $A_j$, $j=1, 2, 3, 4$, are denoted as ${\tau _j}(s)$ and ${\sigma _j(s)}$, respectively.
(a) The profile of the pressure distribution along the external channel. (b) An infinitesimal element of the flow on the auger flight. (c) The surfaces of the infinitesimal element plotted in a local coordinate frame  $A-\hat {\boldsymbol {s}}\hat {\boldsymbol {\xi }}\hat {\boldsymbol {\eta }}$, where $\hat {\boldsymbol {\eta }}=\hat {\boldsymbol {s}}\times \hat {\boldsymbol {\xi }}$.

As the sample in the external channel moves upwards with a fixed elevation angle  $\beta$, it is reminiscent of a chute flow with additional centrifugal force in the radial direction. In this configuration, assuming the shear stress on surface $A_1$ satisfies the $\mu - I$ rheology introduced in Jop, Forterre & Pouliquen (Reference Jop, Forterre and Pouliquen2006); MiDi (Reference MiDi2004), we have
 \begin{equation} {\tau_1} (s) = \mu (I){\sigma_1}(s), \end{equation}
where  $\mu (I)=\mu _s+(\mu _2-\mu _s)/(I_0/I+1)$ with $I_0$, $\mu _s$ and $\mu _2$ model parameters. Inertial number $I$ is estimated with $I=\dot {\gamma _{s}}d/(\sigma _1(s)/\rho )^{1/2}$, where $d$ is the average grain diameter, and $\dot {\gamma _{s}}=\sqrt {u^{2}_{s}+u^{2}_{\xi }}/(N d)$ denotes the shear rate for a shear band with thickness $N d$. The granular friction coefficient $\mu (I)$ starts with a critical value $\mu _s$ at zero shear rate, increases with inertial number $I$ and eventually converges to a finite value $\mu _2$. Note that the variation of $\mu$ is not significant in the steady state because of the stable inertial number for the parameter range explored here, thus one may also assume a constant $\mu$ as a first approximation. Nevertheless, the fluctuation of $\mu$ with $I$ can be significant in the initial transient state. Here, the velocity of the flowing layer is $\boldsymbol {u} = u_s \hat {\boldsymbol {s}} +u_\xi \hat {\boldsymbol {\xi }}$.
As the direction of the shear stress  ${\tau _1} (s)$ is opposite to that of $\boldsymbol {u}$, we can decompose the shear stress on surface $A_1$ along the streamwise and normal directions as follows:
 \begin{equation} \boldsymbol{\tau_1} (s)
= {\tau_1^{s}} (s) \hat{\boldsymbol{s}} +
{\tau_1^{\xi}} (s)\hat{\boldsymbol{\xi}}
={-}(\cos\theta\hat{\boldsymbol{s}} + \sin\theta
\hat{\boldsymbol{\xi}}) \mu (I){\sigma_1}(s),
\end{equation}
\begin{equation} \boldsymbol{\tau_1} (s)
= {\tau_1^{s}} (s) \hat{\boldsymbol{s}} +
{\tau_1^{\xi}} (s)\hat{\boldsymbol{\xi}}
={-}(\cos\theta\hat{\boldsymbol{s}} + \sin\theta
\hat{\boldsymbol{\xi}}) \mu (I){\sigma_1}(s),
\end{equation}
with  $\theta =\tan ^{-1}(u_\xi /u_s)$.
The normal stress  $\sigma _1(s)$ on lateral surface $A_1$ arises from the hydrostatic pressure $p(s)$ and the pressure $p_c$ arising from the centrifugal force $F_c$
$F_c$
 \begin{equation} \sigma_1(s)=p(s)+p_c. \end{equation}
Note that the flow along the normal direction is constrained by the auger flight, which is subject to a compound motion of penetration and rotation. This means that, as the flow is considered to be incompressible, the component  $u_{\xi }$ equals the normal component of the auger's velocity $\boldsymbol {v}\boldsymbol {\cdot }\hat {\boldsymbol {\xi }}$. Hence, we have
 \begin{equation} u_{\xi}=\omega \bar{r} \sin{\beta}-v\cos{\beta}, \end{equation}
and  $u_\xi$ should be a constant when the auger's motion is given. The circumferential speed around the rotation axis of the flowing layer is expressed as $u_{h} = u_\xi \sin \beta - u_s \cos \beta$. Therefore, the centrifugal force per mass $\mathrm {d} m$ reads
 \begin{equation} F_c=\mathrm{d} m \frac{u_{h}^{2}}{\bar{r}} = \mathrm{d} m \frac{(u_\xi\sin\beta-u_s\cos\beta)^{2} }{\bar{r}}, \end{equation}
where  $\mathrm {d} m = \rho \xi \eta \mathrm {d} s$ and further $p_c=F_c/\mathrm {d} A_1$.
Suppose that the region around the drill bit has isobaric pressure. The normal pressure exerted on the boundary  $\partial \mathcal {R}^{b}$ has the same surface pressure $P$ as that on boundary $\partial \mathcal {D}^{b}$. Noting that boundary $\partial \mathcal {R}^{u}$ corresponds to a free surface of the soil, its surface pressure equals zero. Considering the Janssen effect (Duran Reference Duran2000), we assume that the surface pressure of the flowing layer along the streamwise direction is exponentially distributed with $s$, namely, the hydrostatic pressure at position $s$ is expressed as
 \begin{equation} p(s)=P\frac{1-\mathrm{e}^{-(({l-s})/{b})}}{1-\mathrm{e}^{-({l}/{b})}}, \end{equation}
where  $l$ is the total length of the external channel immersed in the soil at time $t$. Figure 5(a) shows the distribution of hydrostatic pressure $p(s)$, in which $p(s=0)=P$ and ${p(s=l)=0}$, at the bottom of the drill stem and at the free surface of the soil, respectively.
According to the equilibrium condition on surface  $A_2$, the normal stress ${\sigma _2}(s)$ can be estimated with
 \begin{equation} {\sigma_2}(s)= p(s)+\rho g b \cos^{2}{\beta} + {\tau_1^{\xi}} (s)\frac{\xi}{\eta}. \end{equation}
It is composed of hydrostatic-like pressure  $p(s)$, gravity and the normal component ${\tau _1^{\xi }} (s)$ of the friction force on surface $A_1$.
The normal stresses on surfaces  $A_3$ and $A_4$ are induced by the hydrostatic-like pressure $p(s)$, i.e. ${\sigma _3}={\sigma _4}=p(s)$. Note that the flowing layer takes a relative motion along the streamwise direction $\hat {\boldsymbol {s}}$ with respect to the lateral surfaces $A_2$, $A_3$ and $A_4$. Assuming that the shear stresses on these three surfaces satisfy the Coulomb friction law, we have
 \begin{equation} {\tau_j}(s)={-}\mu_0 {\sigma_j}(s), \quad j= 2, 3, 4, \end{equation}
where  $\mu _0$ is the friction coefficient between granular materials and the drill stem surface.
Finally, we integrate the four shear stresses along the streamwise direction  $\hat {\boldsymbol {s}}$ to obtain the frictional forces exerted on the flowing layer
 \begin{equation} F_r = \int_0^{l} (\tau_1^{s} (s) + {\tau_3}(s)) \xi \,\mathrm{d} s + \int_0^{l} (\tau_2(s) + \tau_4(s)) \eta \,\mathrm{d} s. \end{equation}
 It shows that frictional force  $F_r$ primarily arises for the hydrostatic pressure, geometry and friction coefficient $\mu$ that depend on the inertial number.
3.4. Coupling between internal and external channels
The granular material generated by the drill bit either flows into the internal channel or is conveyed by the external channel. The mass increase rate is given by  $\mathrm {d} m_b/\mathrm {d} t=S_bv$, with $S_b$ the cross-sectional area at the bottom of the drill, where granular flow is generated by the bit. Here, $S_b$ is estimated with a summation of the bottom areas of both internal and external channels
 \begin{equation} S_b = S_i + \frac{S_o}{\sin\beta}. \end{equation}
 The increased mass of granular materials in the internal and external channels are given by (3.1) and (3.6), respectively. Meanwhile, part of the granular material is removed to the soil surface through the external channel. The velocity of the removed soil on the top boundary  $\partial \mathcal {R}^{u}$ of the flowing layer can be computed as $u_{{up}} =u_{\xi }\cos \beta +u_s\sin \beta$. Thus, the rate of mass removal by the external channel is given by $\mathrm {d} m_{{rem}}/\mathrm {d} t = \rho S_o u_{{up}}/\sin \beta$. According to mass conservation in both channels, we have
 \begin{equation} S_b v = (v-u_i)S_i + \frac{v + u_{{up}}}{\sin\beta}{S_o}. \end{equation}
Together with the definition of  $u_{\xi }$, the second term can be written as known variables. Subsequently, the above equation for the mass conservation in the two channels can be transformed into the following form:
 \begin{equation} S_b v= S_o (v\sin\beta + \omega \bar{r} \cos\beta + u_s) + S_i (v-u_i). \end{equation}
Equation (3.21) can also be considered as a kinematic constraint that couples the flow in the internal and external channels.
3.5. Summary of the continuum model
The above analysis yields five governing equations with five time-dependent variables  $m_i$, $m_o$, $u_i$, $u_s$ and $P$. More specifically, there are two mass balance equations ((3.1) and (3.6)), two momentum balance equations ((3.5) and (3.9)) and a coupling equation shown in (3.20). Note that $F_r$ can be represented as a function of $P$. Given certain model parameters and initial conditions, the granular flow in both channels can be described numerically.
Differentiating (3.21) leads to
 \begin{equation} \frac{\mathrm{d} u_s}{\mathrm{d} u_i} = \frac{S_i}{S_o}. \end{equation}
 Combining the above equation with (3.5) and (3.9) allows us to write an analytical expression of the hydrostatic-like pressure  $P$
$P$
 \begin{equation} P=\frac{m_i S_o C_1+m_o S_i C_2}{m_i S_o^{2}+m_o S_i^{2}}, \end{equation}
where  $C_1 \equiv m_o g\sin {\beta } + \rho S_0 v u_s/\sin \beta - F_r$ and $C_2 \equiv m_i g-\rho S_i u_i(v-u_i)$.
Suppose  $m_i(t_0) =0$ and $m_o(t_0) = 0$ at time $t_0=0$. The two continuum equations in both channels can be written in the following integral forms:
 \begin{equation} \left. \begin{aligned} & m_i = \rho S_i \left(v t -\int_0^{t} u_i\,\mathrm{d} t\right),\\ & m_o = \frac{\rho S_ov}{\sin\beta}t. \end{aligned} \right\} \end{equation}
The dynamics of the granular flow in both channels is governed by (3.5) and (3.9), which are reorganized here for clarity as
 \begin{equation} \left. \begin{aligned} & \frac{\mathrm{d} u_i}{\mathrm{d} t} = g-\frac{P}{ m_i}S_i-\rho S_i \frac{u_i(v-u_i)}{m_i},\\ & \frac{\mathrm{d} u_s}{\mathrm{d} t}={-} g\sin{\beta} - \frac{u_s}{t} + \frac{P\sin\beta}{\rho v t}+ \frac{F_r\sin\beta}{\rho S_o vt}. \end{aligned} \right\} \end{equation}
Note that the two equations are subject to the kinematic constraint given by (3.21). Therefore, the initial values of  $u_i(t_0)$ and $u_s(t_0)$ cannot be specified arbitrarily, but they should satisfy the kinematic condition. For instance, if we set $u_i(t_0)=0$, then the value of $u_s(t_0)$ should be computed by (3.21) such that the condition of mass conservation can be satisfied at time $t_0$. This clearly suggests that gravity plays an important role in $u_i$, and consequently in the sampling efficiency. Based on the initial values of $u_i(t_0)$ and $u_s(t_0)$, together with (3.23), (3.24) and (3.25), we can numerically obtain the solutions of $u_i$, $u_s$, $m_i$, $m_o$ and $P$.
$P$.
4. Validation of the continuum model
In this section, we verify the continuum model through a comparison with experimental results shown in § 2. Parameters used to numerically solve the governing equations described above are listed in table 1. They are chosen based on experimental conditions, as discussed below.
Parameters used in the theoretical model are selected to match experimental conditions, including  $\beta\, (^{\circ }) ={180 b}/({{\rm \pi} ^{2}(2r_i+\eta )})$, $r_i = 1.55\,(\textrm {cm})$, $b=1.2\,(\textrm {cm})$, $\xi =b\cos \beta$, $S_i={\rm \pi} r_i^{2}$, $S_o=\xi \eta$.

The bulk density  $\rho$ is chosen to match the experimentally measured ratio of sample weight over volume occupied. The internal friction coefficient $\mu _s = \tan \phi$ is determined from the angle of repose $\phi$ of the granular sample obtained after the drilling process to reflect properties of the granular sample in the fluidized state. We assume that the granular flow satisfies the Mohr–Coulomb yield criterion (Kang et al. Reference Kang, Feng, Liu and Blumenfeld2018; Feng, Blumenfeld & Liu Reference Feng, Blumenfeld and Liu2019). The frictional coefficient between the granular sample and the surfaces of the auger groove, $\mu _o$ is measured using standard slip testing method (GB/T 22895-2008). In order to estimate $\mu (I)$ with (3.10), we need three parameters: the asymptotic frictional coefficient $\mu _2$, the thickness of shear band $Nd$ and the material-dependent constant $I_0$. We set $N=10$ and use $I_0= {0.206}/{\sqrt {\psi \cos \beta }}$ with $0.206$ a material-dependent constant and $\psi$ the packing fraction of the granular sample to estimate the inertial number, following previous investigations (Forterre & Pouliquen Reference Forterre and Pouliquen2003; Jop, Forterre & Pouliquen Reference Jop, Forterre and Pouliquen2005). For Soil-I and Soil-II, we have $I_0= 0.42$ and 0.58, respectively.
Parameters  $\xi$ and $\eta$ correspond to the width and thickness of the flowing layer in the inclined external channel. Note that granular flow in the external channel is confined to a shallow auger groove and presumably limited to a few grain diameters (MiDi Reference MiDi2004; Jop et al. Reference Jop, Forterre and Pouliquen2005; Wang et al. Reference Wang, Lu, Xu, Guo and Liu2019). As the flow takes place at the interface between sample being displaced by the drill and surrounding soil underground, it is challenging to measure it experimentally. Instead, we obtain $\eta$ through fits to the experimental data. As shown in table 1, fitting shows that $\eta$ is of the order of one or two particle diameters, in agreement with the above analysis.
Based on the parameters listed in table 1, we employ (3.23), (3.24) and (3.25) to simulate the process of the auger penetrating into the two types of soils under different driving conditions. All the simulations are terminated at the time when the penetration depth  $H=1.0$ m is achieved. Numerically, we obtain the mass $m_i$ of sampled granular materials at the end of each drill process. Subsequently, (2.4) is used to estimate $\zeta$. How the sampling efficiency $\zeta$ varies as a function of $\gamma$ is investigated by variations of the penetration speed $v$ and rotational speed $\omega$ following experimental conditions. As shown in figure 6(a), the $\zeta - \gamma$ curves for Soil-I under different rotational speeds overlap with each other well, clearly demonstrating that the sampling efficiency $\zeta$ depends on the speed ratio $\gamma$ instead of specific rotational speeds. Figure 6 also shows good agreements between numerical and experimental results for both types of soils within the parameter range explored here. In the future, down-scaled experiments capable of exploring a wider range of $\gamma$ with finer steps are needed to further validate the model. Note that $\zeta$ decays asymptotically to zero as $\gamma$ grows to infinity for both types of lunar simulants. This extreme case corresponds to infinitely large $\omega$ at given $b$ and $v$, consequently the centrifugal force induced by the rotation of the drill effectively enhances the normal forces applied on the walls of the external channel. Thus, the effective friction is large to prohibit the flow of granular sample, and the percentage of sample being filled in the inner tube decreases asymptotically to 0. Nevertheless, it cannot reach 0 for the limited parameter range explored here, and the pressure on the bottom of the drill $P$ is always positive (see figure 8b).
Comparison between the numerical and experimental results for the relationships between sampling efficiency  $\zeta$ and speed ratio $\gamma$ when the auger drills in Soil-I (a), and Soil-II (b).

Based on the above comparison with experimental data, we further analyse the granular flow dynamics in both the internal and external channels of the auger drill. As shown in figure 7, numerical results for the case of drilling in Soil-II with a fixed  $\omega$ and three different penetration speeds $v$ clearly suggest that both flow speeds in internal and external channels converge to a constant value as the penetration depth $h$ increases (see figure 7), suggesting the existence of a steady state with constant granular flow speeds in the internal and external channels as time evolves. Qualitatively, figure 7 also reveals that larger penetration speeds lead to quicker convergence into the steady state.
Dimensionless flow speed  $u_i/v$ in the internal channel (a), as well as the corresponding dimensionless velocity $u_s/v$ in the external channel (b), as a function of the penetration depth $h = vt$. Here, $u_s/v$ is negative because the granular surface of the fluidized sample moves upwards along the external channel, i.e. in a different direction from the drill. Simulations are performed for drilling into Soil-II with fixed $\omega =120$ r.p.m. and three penetration speeds $v=72, 144 \text{ and } 288\,\textrm {mm}\,\textrm {min}^{-1}$. Inset of (b) shows a close-up view of the velocity change at the very beginning of the penetration process.

In addition to granular flow along the streamwise direction  $u_s$, (3.13) indicates the other flow component $u_\xi$ generated from the helical motion of the drilling tool. As shown in figure 8(a), the direction of granular flow $\tan \theta$ evolves quickly into a constant value as $h$ grows, despite of the peaks emerging at small $h$ (see the inset). Within the parameter range explored, $\tan \theta$ is independent of the driving conditions and becomes steady at the very initial stage of penetration ( $h\le 50$ mm). Moreover, the corresponding evolution of the bottom pressure $P$ during the penetration process under different driving conditions is plotted in figure 8(b). It shows that $P$ grows linearly with the penetration depth in the steady state, in which both $u_s$ and $\theta$ become stable. In the steady state, the growth rate increases at larger $v$.
$v$.
Direction of external flow velocity  $\tan \theta =u_\xi /u_s$ (a), and pressure $P$ (b) as a function of penetration depth $h$ for the corresponding conditions shown in figure 7. Inset of (a) is a close-up view of the angle change at small $h$.
$h$.

According to (3.18), we analyse the friction force  $F_r$ exerted on the flowing layer in the external channel as a function of drilling depth $h$ under three different penetration speeds. Figure 9(a) shows that the frictional force decays initially to a negative value as $h$ increases, owing to the non-monotonic behaviour of $u_s$ in the initial stage of penetration. As the system approaches the steady state with constant $u_s$, $F_r$ grows approximately linearly with penetration depth, in relation to the growth of $P$ with $h$. Notably, frictional force decreases with increasing penetration speed. From the previous analysis, we know that the granular flow direction in the external channel is opposite to the vector $\hat {\boldsymbol {s}}$ (i.e. negative $u_s$) and tends to be constant as $h$ increases. From (3.9), we know that the right-hand side approaches $0$ in the steady state. Consequently, the increase of both the second ( $-\rho S_o v u_s/\sin \beta$) and third terms $P S_0$ with $v$ in the steady state leads to the decrease of $F_r$ as penetration speed $v$ grows.
(a) The friction force  $F_r$ exerted on the flowing layer, and (b) the resistant torque arising from the friction between the flowing layer and the surrounding static granular material, vary with the penetration depth $h$. The same driving conditions as shown in the caption of figure 7 are employed in the simulations for drilling into Soil-II.

As granular sample is being conveyed upwards through the external channel, there exists a torque  $T$ arising from the frictional force between the sample and surrounding granular materials
 \begin{equation} T=\int_0^{l} r_o \hat{\boldsymbol{\eta}} \times \boldsymbol{\tau_1} b \cos\beta \,\mathrm{d} s \boldsymbol{\cdot} \hat{\boldsymbol{k}}, \end{equation}
where  $l$ is the length of granular layer in the external channel and $\hat {\boldsymbol {k}}$ is the axial unit vector of the drill stem. As shown in figure 9(b), the torque $T$ increases with the depth and the penetration speed. Given a fixed $\omega$, increasing $v$ leads to the decrease of soil discharging capacity, which in turn results in an increase in $P$ and consequently larger $\tau _1$ and $T$.
$T$.
5. Steady-state analysis
The above numerical investigations show that the drilling process converges to a steady state, in which the internal and external granular materials flow with constant speeds. In this section, we derive explicitly the relationship between  $\zeta$ and $\gamma$ in the steady state. Additionally, we investigate how $\zeta$ is affected by the drill's geometry and the properties of the granular materials.
In the steady state with  $\mathrm {d} u_i/\mathrm {d} t=0$ and $\mathrm {d} u_s/\mathrm {d} t=0$, (3.25) can be re-formulated as
 \begin{equation} \left. \begin{aligned} & P = \rho h_i g -\rho u_i^{s} (v-u_i^{s}),\\ & P = \rho h g\sin{\beta} + \frac{\rho v u_s^{s}}{\sin\beta} - \frac{1}{S_o}F_r, \end{aligned} \right\} \end{equation}
where  $h_i=m_i/(\rho S_i)$ and $h=l\sin \beta =vt$ represent the sampling height and the drilling depth at time $t$, respectively. Also, $u_i^{s}$ and $u_s^{s}$ represent $u_i$ and $u_s$ in the steady state. By eliminating the term $P$, (5.1) yields
 \begin{equation} \rho g (h_i-h\sin\beta)-\left[\rho u_i^{s} (v-u_i^{s})+\frac{\rho v u_s^{s}}{\sin\beta}\right]={-} \frac{F_r}{S_o}. \end{equation}
 In the steady state,  $I$ remains unchanged so that $\mu (I)$ can be replaced by a constant $\bar {\mu }$. Additionally, figure 8(a) shows that $\tan \theta$ remains unchanged as the drill process enters the steady state. We denote $\theta ^{s}$ as the constant angle. According to (3.18), together with (3.11), (3.16) and (3.17), the right-hand term of (5.2) can then be expressed as
 \begin{equation} -\frac{F_r}{S_o}=k_1\int_0^{l}p(s)\,\mathrm{d} s +k_2 p_c l+\mu_0 \rho g l \cos\beta, \end{equation}
with
 \begin{equation} \left. \begin{aligned} & k_1\equiv\frac{\mu_0+\bar{\mu}\cos\theta^{s}+\bar{\mu}\mu_0 \sin\theta^{s}}{\eta}+\frac{2\mu_0}{b\cos\beta},\\ & k_2\equiv\frac{\bar{\mu} \cos\theta^{s}+\bar{\mu}\mu_0\sin\theta^{s}}{\eta}. \end{aligned} \right\} \end{equation}
 According to the pressure distribution  $p(s)$ shown in (3.15), we get
 \begin{equation} \int_0^{l}p(s)\,\mathrm{d} s=\frac{Pl}{1-\mathrm{e}^{-({l}/{b})}}-Pb. \end{equation}
Finally, combining (5.2), (5.3) and (5.5) leads to the criterion for the steady state
 \begin{equation} k_1 \frac{Pl}{1-\mathrm{e}^{-({l}/{2b})}}=G-C, \end{equation}
where
 \begin{equation} \left. \begin{aligned} & G\equiv\rho g (h_i-h\sin\beta)-\mu_0 \rho g l \cos\beta+k_1Pb-k_2p_cl,\\ & C\equiv\rho u_i^{s} (v-u_i^{s})+\frac{\rho v u_s^{s}}{\sin\beta}. \end{aligned} \right\} \end{equation}
 Clearly, coefficients  $k_1$, $k_2$ and $C$ are constants in the steady state. We have $G\sim O(t)$ because $h$,
$h$,  $h_i$, $l$ and $P$ are all $\propto t$. Similar scaling analysis shows that ${Pl}/({1-\mathrm {e}^{-({l}/{b})}}) \sim O(t^{2})$. For a steady state to be achieved, (5.6) needs to be always satisfied at large $t$. In other words, it should be valid for all time in the steady state, or on the asymptotic limit of $t$. This condition is true only if $k_1=0$, i.e.
 \begin{equation} k_1\equiv \frac{\mu_0+\bar{\mu}\cos\theta^{s}+\bar{\mu}\mu_0 \sin\theta^{s}}{\eta}+\frac{2\mu_0}{b\cos\beta} =0, \end{equation}
which can be reformulated as
 \begin{equation} \cos\theta^{s}+\mu_0\sin\theta^{s}={-}\frac{\mu_0}{\bar{\mu}}\left(\frac{2\eta}{b\cos\beta}+1\right). \end{equation}
 Equation (5.9) shows that  $\theta ^{s}$ depends on both geometric parameters of the auger drill ( $b$ and $\beta$) and properties of the granular sample ( $\eta$, $\bar {\mu }$ and $\mu _0$). It is irrelevant to the driving conditions of the drilling tool, in agreement with the numerical results shown in figure 8(a).
Equation (3.21) also suggests a relationship between  $u_s^{s}$ and $u_i^{s}$
 \begin{equation} u_s^{s}=\frac{S_b v-S_i(v-u_i^{s})}{S_o}-(\omega \bar{r} \cos\beta+v\sin\beta). \end{equation}
 Noting that  $u_\xi =\omega \bar {r} \sin \beta -v\cos \beta$, together with the definition $\tan \theta ^{s}\equiv {u_\xi }/{u_s}$, we get
 \begin{equation} \cot\theta^{s} =\frac{\dfrac{S_b}{S_o\cos\beta } -\dfrac{S_i}{S_o\cos\beta}\dfrac{v -u_i^{s}}{v}-\left(\dfrac{\omega \bar{r}}{v}+ \tan\beta\right)}{\dfrac{\omega \bar{r} \tan\beta}{v}-1}. \end{equation}
 We know from (3.1) that  $\textrm {d}m_i = \rho {\rm \pi}r_i^{2} (v-u_i) \,\textrm {d}t$. Therefore, the sampling efficiency $\zeta$ becomes
 \begin{equation} \zeta= 1-\frac{1}{H}\int_0^{H} \frac{u_i}{v}\,\mathrm{d} h. \end{equation}
 In the steady state with constant  $u_i$, (5.12) can be simplified as
 \begin{equation} \zeta^{s} = 1-\frac{u_i^{s}}{v}. \end{equation}
 Plugging in  $\gamma ={\omega b}/{2{\rm \pi} v}=({\omega \bar {r} \tan \beta })/{v}$ and $S_b=S_i + S_o/\sin \beta$, (5.11) can be written as
 \begin{equation} \zeta^{s}={-}\frac{S_o \cos\beta}{S_i}\left(\cot\beta+\cot\theta^{s}\right)\left(\gamma-1\right)+1\equiv \varGamma. \end{equation}
This equation provides a convenient way to predict analytically the sampling efficiency under different conditions. It suggests that  $\zeta ^{s}$ decreases linearly as $\gamma$ increases, in agreement with figure 6. Moreover, we find a fixed point $(\gamma =1, \zeta ^{s}=1$), which is consistent with our aforementioned speculation for $\alpha =\beta$ that it is similar to inserting a straight tube into a granular material. In this case, the materials in the auger flight will not be discharged and the sampling efficiency will be 100 %.
Figure 7(a) indicates that a higher penetration velocity leads to a faster convergence of  $u_i$ to the steady-state value $u_i^{s}$, and consequently a faster convergence of $\zeta$ to $\zeta ^{s}$ because $\zeta \propto u_i/v$. That means a higher penetration speed, or a smaller $\gamma$, yields a better agreement with the analytical prediction of the $\zeta$– $\gamma$ relation shown in (5.14). Therefore, the $\zeta$– $\gamma$ relation in figure 6 becomes closer to the line predicted by (5.14) as $\gamma$ decreases. Reciprocally, as $\gamma$ becomes larger, convergence of $\zeta$ takes more time (or larger depth), thus a deviation of the $\zeta - \gamma$ curve from a straight line, as illustrated in both experimental and numerical results, can be expected.
Finally, we compare the analytical model with experimental data directly. The right-hand term of (5.14) is denoted by  $\varGamma$; $\varGamma$ for the experimental data is computed after the parameters presented in table 1. We plot the experimental and numerical results together in figure 10 for a direct comparison.
The  $\zeta ^{s} - \varGamma$ relation of the prediction model in the steady state (dashed line) and the experimental results (markers).

Equation (5.14) indicates that the linear relation between  $\zeta ^{s}$ and $\gamma$ depends on parameters (e.g. $\mu$, $\mu _0$, $\eta$, $b$ and $r_i$) that are gravity independent. In other words, despite the fact that the evolution of $u_i$ into the steady state is gravity dependent (see (3.25)), the sampling efficiency $\zeta ^{s}$ in the steady state is independent of gravitational acceleration, clearly suggesting that auger drilling yields the same sample collection efficiency, regardless of whether we are drilling on Earth, Moon or another extraterrestrial object. This can be understood through an analysis on the evolution of the gravity-dependent terms. For instance, we know that the frictional term in the governing equations increases with drilling depth quadratically, while the gravitational acceleration term is linear with drilling depth. Therefore, as the depth increases, the role of the gravitational acceleration term becomes increasingly weaker, whereas the friction term dominates the dynamics.
6. Conclusions
To conclude, we experimentally investigate the sampling efficiency of a standard auger drill tool under different drilling conditions and soil properties. The experimental results show that the sampling efficiency decreases monotonically with the growth of the ratio between the rotational and penetration speeds. In addition, the sampling efficiency of the drilling tool is found to be sensitive to the soil properties, such as the granular internal friction angle, packing fraction, size distribution and grain scale. We speculate that the influence of granular friction dominates that arising from other relevant properties, or the influence of granular friction contains that from other soil properties, as previously demonstrated in Kang et al. (Reference Kang, Feng, Liu and Blumenfeld2018).
In the drilling process, under the cutting effect of the drill bit and the rotation of the drill tool, the soil around the drill tool is fluidized. Therefore, we assume the flowing soil is an incompressible fluid and build the governing equations based on the mass conservation and momentum equations of fluid dynamics. Because the flowing soils in the external channel cannot be completely discharged to the ground surface, we introduce an effective thickness of the flowing layer  $\eta$ that is smaller than the geometrical groove depth $a$. The numerical solutions of the governing equations show the same features as the experimental results: the sampling efficiency decreases with the ratio of the rotation to penetration speed and does not depend on their specific values. By setting a smaller $\eta$ for Soil-I with higher granular friction than Soil-II, the theoretical results of both types of soils can agree well with the experimental results.
Note that the numerical solutions of the theoretical model converge as drilling deepens, leading to a steady state under which the governing equations can be solved analytically. Consequently, we analyse the theoretical model in the steady state and find that the ratio of the normal and streamwise velocity components of granular flow in the external channel is a constant being independent of the penetration speed, explaining why the sampling efficiency is independent of  $v$ and $\omega$ individually. Moreover, we obtain an analytical prediction for the sampling efficiency. The outcome shows that the sampling efficiency decreases linearly with the speed ratio $\gamma$ and it goes through $(\gamma,\zeta _s)=(1,1)$, consistent with the qualitative analysis in § 2. Importantly, this prediction shows that the sampling efficiency is irrelevant to gravity in the steady state, which has important significance for widespread applications. Note that gravity indeed plays a role before the steady state is established.
Future work will be devoted to using DEM simulations for further analysis on granular flows in both channels, particularly the pathway towards steady states, along with a characterization of the pressure distribution in both channels to assist in further development of the model, as well as in guiding verification experiments. In addition, it is also important to investigate the granular flow profile in the helical external channel during the drilling process within the framework of the  $\mu - I$ rheology and to explore the possibility of instabilities induced by shear flow (Börzsönyi, Ecke & McElwaine Reference Börzsönyi, Ecke and McElwaine2009; Cortet et al. Reference Cortet, Bonamy, Daviaud, Dauchot, Dubrulle and Renouf2009; Brodu, Richard & Delannay Reference Brodu, Richard and Delannay2013).
Acknowledgements
We thank R. Blumenfeld for fruitful discussions and the help of X. Lai from Beijing Spacecrafts, China Academy of Space Technology.
Funding
This work has been supported by the National Natural Science Foundation of China (NSFC: 11932001). K.H. acknowledges the Startup Grant from Duke Kunshan University.
Declaration of interests
The authors report no conflict of interest.


 Open access

