

The distribution of the gains from capitalism, globalization, and technological progress preoccupies academic and popular economics (Ricardo Reference Ricardo1821; Marx Reference Marx1867; Piketty Reference Piketty2014). Within countries, the driving force behind the twentieth century’s drop in inequality were the declines in the wealth shares of the top 1 percent (Alvaredo, Atkinson, and Morelli Reference Alvaredo, Atkinson and Morelli2018; Saez and Zucman Reference Saez and Gabriel2016; Piketty Reference Piketty2014).Footnote 1 From this, a “patrimonial (or propertied) middle class” arose (Piketty Reference Piketty2014, p. 260).
This article shows that for the ownership of capital in Britain, it was not the rise of a broad “middle” class that characterized the twentieth century wealth distribution but a reshuffling of wealth away from the top 1 percent to the rest of the top 20–30 percent. The majority die with nothing.
I introduce and analyze a new individual level dataset of every English adult death and probate (60m and 18m, respectively) from 1892–1992, a period which captures the secular decline of wealth inequality in Britain. The top 1 percent share declines from 73 to 20 percent. Despite this “Great Equalization,” the relative gains from the decline of the elite are limited to the top 30 percent after 1950. The median English person dies with no significant wealth, throughout the entire period. Inferring via Pareto power law extrapolations that the decline of the 1 percent led to a rise in median wealth is mistaken.
This article utilizes a unique resource for understanding English wealth holding—the annual calendars of the Principal Probate Registry (PPR). This resource has comprehensive, population-wide coverage of the estate values of those dying with wealth above a threshold level (£10 in 1900, £5,000 in 1992). While the wealth estimates are imperfect, as detailed in the first section, it is our single best source for the evolution of English wealth holding over the twentieth century. While samples have been used in previous research, the complete database has never been analyzed. This is due to the scale of the task of digitizing the millions of individual records. Modern computing technology now makes the analysis possible. I document the principles behind the mass digitization of archival records and their conversion to structured data.
The article uses the PPR Calendars to track quantitatively the wealth of the English 1892–1992, and tracks the rise of a new wealth “middle class.”
What Is the “Middle Class?”
There is no single, widely accepted definition of “middle class.”Footnote 2 There are a universe of competing and contradictory definitions, invoking elements of occupation, social networks, cultural taste, the keeping of servants, and even fashion, accent, and word choice. In the tradition of Weber, contemporary sociology interprets “class” as a multidimensional construct.Footnote 3 Many economists’ definition of the middle class are typically based on absolute quantitative thresholds of income, expenditure, or wealth.Footnote 4 An alternative to this is to take a relative approach: for example, Piketty defines his “patrimonial middle class” as the 50th–90th percentile (Reference Piketty2014, pp. 347–8). Wolff, who has characterized the evolution of “middle class” wealth in the United States defines the “middle class” as the middle three quintiles of the wealth distribution (Reference Wolff2017, p. 6).
Among economic and social historians, there are also no consistent demarcation of the concept of “middle class.” It is often left undefined, based on occupational title or an income or wealth threshold.Footnote 5 However, in the historiography, it is clear that many scholars envisage the middle class as not being a middle of society categorization but rather an intermediate, newly ascendant class, in between the landed gentry and aristocracy, and the laboring population. In this conceptualization, the “middle class” could entirely be located within the top 10 percent of the population.Footnote 6
This analysis requires a definition of the wealth “middle class” that is valid for the entire sample period, from the time of Queen Victoria to Brexit. Thus, the definition I employ here is simple. I define the wealth “middle class” as the even middle of the wealth distribution, the middle 33 percent, containing the median English decedent. This definition can speak to both a relative interpretation of what “middle class” is and an absolute: I estimate the percentile shares of the wealth distribution below the top 10 percent and evaluate that change over time (Figure 6). However, I also report the proportion of any English with any significant wealth (Figure 4 Panel (b)). This simple measure captures the median English decedent and gives us a sense of the absolute position of the middle of the distribution. It should be stressed that this “middle class” definition is very different from that of historians of early-modern and nineteenth-century Britain. These definitional debates aside, one feature unique to the individual level data is the ability to redefine the measures used here into whatever percentile threshold one desires.
The Level of Analysis
The PPR Calendars utilized here report individual wealth holding. An alternative unit of analysis is the household, which is often employed in wealth surveys (such as the modern Wealth and Assets Survey Office for National Statistics (2018b)).
Which level is preferable? The household level is perhaps best suited for understanding the underlying distribution of consumption and investment that is related to wealth. The individual level is better suited for understanding the underlying political economy of wealth holding, both between and within households.
In order to consolidate these two levels, I propose in the fourth section a simple adjustment to the individual level data that generates estimates of household level wealth. I assume that each individual observation represents a household of two people. It is a crude calculation and must be interpreted carefully. Yet it helps us understand how the individual data connects to the household level. As it is always essential to triangulate data with available sources, we can then examine whether the PPR Calendar data is consistent with existing household level data. This is done in the fifth section, which compares the PPR Calendar data with existing estimates of top wealth shares, home-ownership trends, wealth survey distributions, aggregate wealth, and the wealth Gini coefficient.
Tracking the “Middle Class,” 1892–1992
This article follows existing empirical work on the historical English wealth distribution by Lindert (Reference Lindert1986), Atkinson and Harrison (Reference Atkinson1978), Atkinson, Gordon, and Harrison (Reference Atkinson, Gordon and Alan1989), and Atkinson (Reference Atkinson2013). It complements recent work, using a different but related source, by Alvaredo, Atkinson, and Morelli (Reference Alvaredo, Atkinson and Morelli2018) for wealth, and by Scott and Walker (Reference Scott and Walker2020) for top incomes. The individual level data developed here allows for broader claims about the wealth distribution outside the top 10 percent.
There are three principal contributions of this article. First, I detail the construction of the probate and wealth database. The process involved the transformation of more than 1.5 million scanned images into a set of text files. Next the text was algorithmically parsed and formed into a database suitable for economic analysis. This largely automated data-building methodology has the potential to be applied to many other scanned historical sources. Any historical document with a standard structure can be converted in this way.
Second, I contribute new estimates of the top wealth shares. They closely match recent estimates from separate sources, validating the constructed data. For the first time wealth shares beyond the top 20 percent are estimated.Footnote 7
Third, I combine the probate data with all English deaths, 1892–2018, to calculate the probate rate. By analyzing the probate rate and the changes in the wealth shares of the top 30 percent, I am able to characterize the relative “winners” from the twentieth century’s “great equalization” of wealth. The “winners” are not a broad “middle class.” The distributional gains are exclusively confined to the top 30 percent of the wealth distribution. This stark finding has been missed by previous studies of the English wealth distribution who were restricted by the available data to estimating top wealth shares. For example, Alvaredo, Atkinson, and Morelli (Reference Alvaredo, Atkinson and Morelli2018) say nothing on the distribution of wealth beneath the top 10 percent (see their figure 7, p. 34).Footnote 8
Using the individual PPR Calendar data, I also calculate the implied household level estimates of wealth inequality. As many modern wealth surveys are executed at this level, it is important to do this to triangulate the results with existing estimates. The PPR individual level results are consistent with most households having at least one wealth holder who is probated. Yet, even at this level, the bottom 60 percent of households hold only 12 percent of all wealth, at their peak wealth-holding level, in the early 1990s.
The PPR Calendar data used in this article is consistent with existing estimates of top wealth shares, home-ownership trends across the twentieth century, wealth surveys from the 1950s on, aggregate wealth estimates for the economy, and the wealth Gini coefficient from the 1970s.
This article consists of seven sections. The first section discusses the source for the probate data, the PPR Calendars, 1892–1992. The second section describes the many stages behind the data construction. The third section presents new estimates for the evolution of wealth inequality at the individual level in England, 1892–1992, and the fourth section presents an alternative synthetic household level analysis of inequality. The fifth section triangulates the results with existing estimates and the sixth section discusses the implications and interpretation of these results. The seventh section provides conclusions.
THE SOURCE
The Principal Probate Registry Calendars
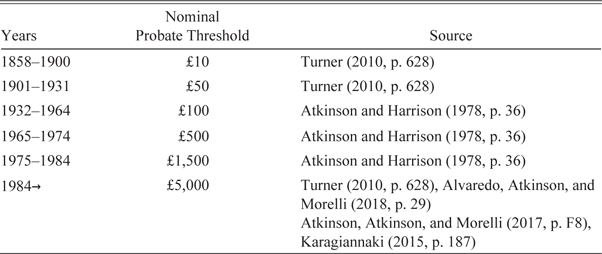
The data for analysis is a complete digitization of the PPR Calendar for England and Wales from 1892–1992. In order for a will to be executed and assets transferred, an act of probate must be granted. The probate index records all those who died with wealth above a minimum threshold (see Table 1).
Together with the name, address, and date of death of the deceased were details of the executor of the estate and an estimate of the estate value. Not everyone who dies has assets. Therefore the probate data is supplemented with complete death registers, 1838–2006. The centralized, national, printed Calendars begin in 1858 and extend (in microfiche form after 1979) until 1996—the index is now in digital form. The data was only extracted between 1892 and 1992 as the format of entries is consistent during this interval. (In 1993 the format of the entries was changed to all capital letters; this made the relative extraction of individual information, as described in the second section, impossible after 1992.)
THE MINIMUM PROBATE THRESHOLD, 1858–2017
Source: Author’s compilation.
Table 2 summarizes the type of assets included in the probate valuations. The values in the index are “gross”—where the net value accounts for debts and funeral expenses.Footnote 9 The biggest consistent omission is “settled personalty”—for example, trust funds (Rubinstein Reference Rubinstein1974, p. 70). Also, there is no information on inter-vivos gifts.Footnote 10 It is also worth noting that transfers to spouses or charity were never subject to inheritance tax, reducing the incentive to mis-report estates (Alvaredo, Atkinson, and Morelli Reference Alvaredo, Atkinson and Morelli2018, p. 39). As noted by Rubinstein:
Although imperfect in several respects the probate valuations offer comprehensive and objective information on the personal wealth of the entire British population in the modern period. They are, moreover, probably unique among advanced industrial nations in presenting probate valuations for the whole population… It is a mystery why so little use has been made of them (1977b, p. 100–1, my emphasis).
It is important to note that existing work on the distribution of wealth in England and Wales, such as Atkinson and Harrison (Reference Atkinson1978), Atkinson, Gordon, and Harrison (1989), Atkinson (Reference Atkinson2013), and Alvaredo, Atkinson, and Morelli (Reference Alvaredo, Atkinson and Morelli2018) use a different data source; aggregated summary data from the Inland Revenue. There, estates are aggregated into sizes and types, and published in tabulations in the Annual Reports of the Inland Revenue.Footnote 11 The key difference between the PPR Calendar valuations and the Inland Revenue data is that the latter are anonymous and grouped (and will be closed to the public for the next 150 years), while the former are not (Rubinstein Reference Rubinstein1974, Reference Rubinstein1981; Harbury Reference Harbury1962; Harbury and Hitchens Reference Harbury and Hitchens1979). This allows the direct individual, family, and surname analysis of wealth in England. The Inland Revenue estate valuations are also different from the probate valuations: they include the property that is excluded from the Calendar valuations (Table 2) (Rubinstein Reference Rubinstein1974, p. 70).Footnote 12
THE PROBATE VALUATIONS

Notes: Based on information from Rubinstein (Reference Rubinstein1974, Reference Rubinstein1977b) and Turner (Reference Turner2010). “Unsettled” refers to cash from the sale of an asset where as “settled” refers to assets that are unsold but held in trust for successive beneficiaries (see https://www.gov.uk/guidance/inheritance-tax-manual/section-8-settled-property for more details on the legal definitions).
Source: Author’s compilation.
Previous work directly using the individual probate valuations includes Wedgwood (Reference Wedgwood1928), Harbury (Reference Harbury1962), Perkin (Reference Perkin1978), Rubinstein (Reference Rubinstein1977a, Reference Rubinstein1977b, Reference Rubinstein1981), Nicholas (Reference Nicholas1999), Rothery (Reference Rothery2007), Turner (Reference Turner2010), and Clark and Cummins (Reference Clark and Neil2015a, Reference Clark and Neil2015b). All of these articles are based on relatively small samples. This article presents estimates from the universe of English probates, 1892–2018.
Only estates at death above a specified minimum value required an act of probate to transfer the assets. Estates below the threshold were known as “small estates.” Table 1 reports the changing definition of a “small estate” from 1858–2020.Footnote 13 The treatment of non-probated wealth is described in the next section. In Online Appendix Section C, I examine whether these changes in the probate threshold result in structural breaks in wealth inequality. There are no systematic deviations from trend across the years when the definition changed.
Unfortunately, the probate valuations do contain significant flaws as measures of wealth. Non-transferable wealth such as defined-benefit pension entitlements and annuities that end with death are completely omitted (Harbury Reference Harbury1962, p. 849). Wealth held in joint bank accounts and housing held in joint ownership is also exempt from probate (GOV.UK 2020b; Harbury Reference Harbury1962, p. 847).Footnote 14 However, as death is inevitable, wealth will still be observed for the couple once. Despite these omissions, Alvaredo Atkinson, and Morelli (Reference Alvaredo, Atkinson and Morelli2017) report that “the ‘small estate’ category probably accounts for the large majority of estates that do not go through probate” (p. F9).
The probate valuations also exclude human capital, health capital, and rights to health-care, and other public services such as parks, clean air, and protection from crime, among many other elements.Footnote 15 As Wedgwood (Reference Wedgwood1928) states: “generally speaking, the probate valuations are restricted to property within the free disposition of the deceased … at the time of his death” (p. 42). In other words, the probate valuations refer to controllable financial capital.Footnote 16 Despite these considerable flaws, the PPR Calendar valuations remain the best and most consistent, systematically collected estimates of individual English wealth holding over the twentieth century.
Estimated Probated Wealth at Death and Its Relationship to Actual Wealth during Life
The PPR Calendar valuations record a portion of wealth at death (see Table 2). There are a number of conceptual problems extending the patterns and trends of the probated wealth of the dead to the total wealth of the living.
First the dead are not randomly sampled. Older people die in greater proportions than younger people. Therefore any claim about wealth inequality, for example, in 1980 based on probated wealth, really corresponds to those dying in 1980, born on average in 1910 and experiencing their young life during WWI and WWII, having families in the 1940s and 1950s, working and saving from the Great Depression to the Thatcher era. It does not tell us about the average experience of someone living in the 1980s. And, of course, death cohorts are mixtures of different birth cohorts. There is also a potentially large life-course pattern to wealth accumulation. Failing to account for these potential effects may lead to a substantial difference between a person’s probated wealth and their actual wealth during their life.Footnote 17 The traditional solution to these age-composition issues is to re-weight the observed wealth-at-death to match the age distribution of the living. Mortality multipliers (the inverse of the death rate by age) can be applied if age is available, as done in Atkinson and Harrison (Reference Atkinson1978).
Unfortunately, age at death is not reported in the PPR Calendars. But as Alvaredo, Atkinson, and Morelli (Reference Alvaredo, Atkinson and Morelli2018) show emphatically in their figure 6 (p. 33), there is no substantive difference in the level or trend of the wealth shares by the application of mortality multipliers to the Inland Revenue estate data. No attempt is made here to re-weight the PPR wealth data.
The PPR data used here end in 1992. However, there has been no change in the relative shares from 1980–1985 to 2015 (see Alvaredo, Atkinson, and Morelli Reference Alvaredo, Atkinson and Morelli2018, p. 29, figure 2). Whatever process has driven the huge shift in wealth shares over the past 100 years was complete in 1980.
BUILDING THE DATA
The Principal Probate Registry Calendar 1892–1992
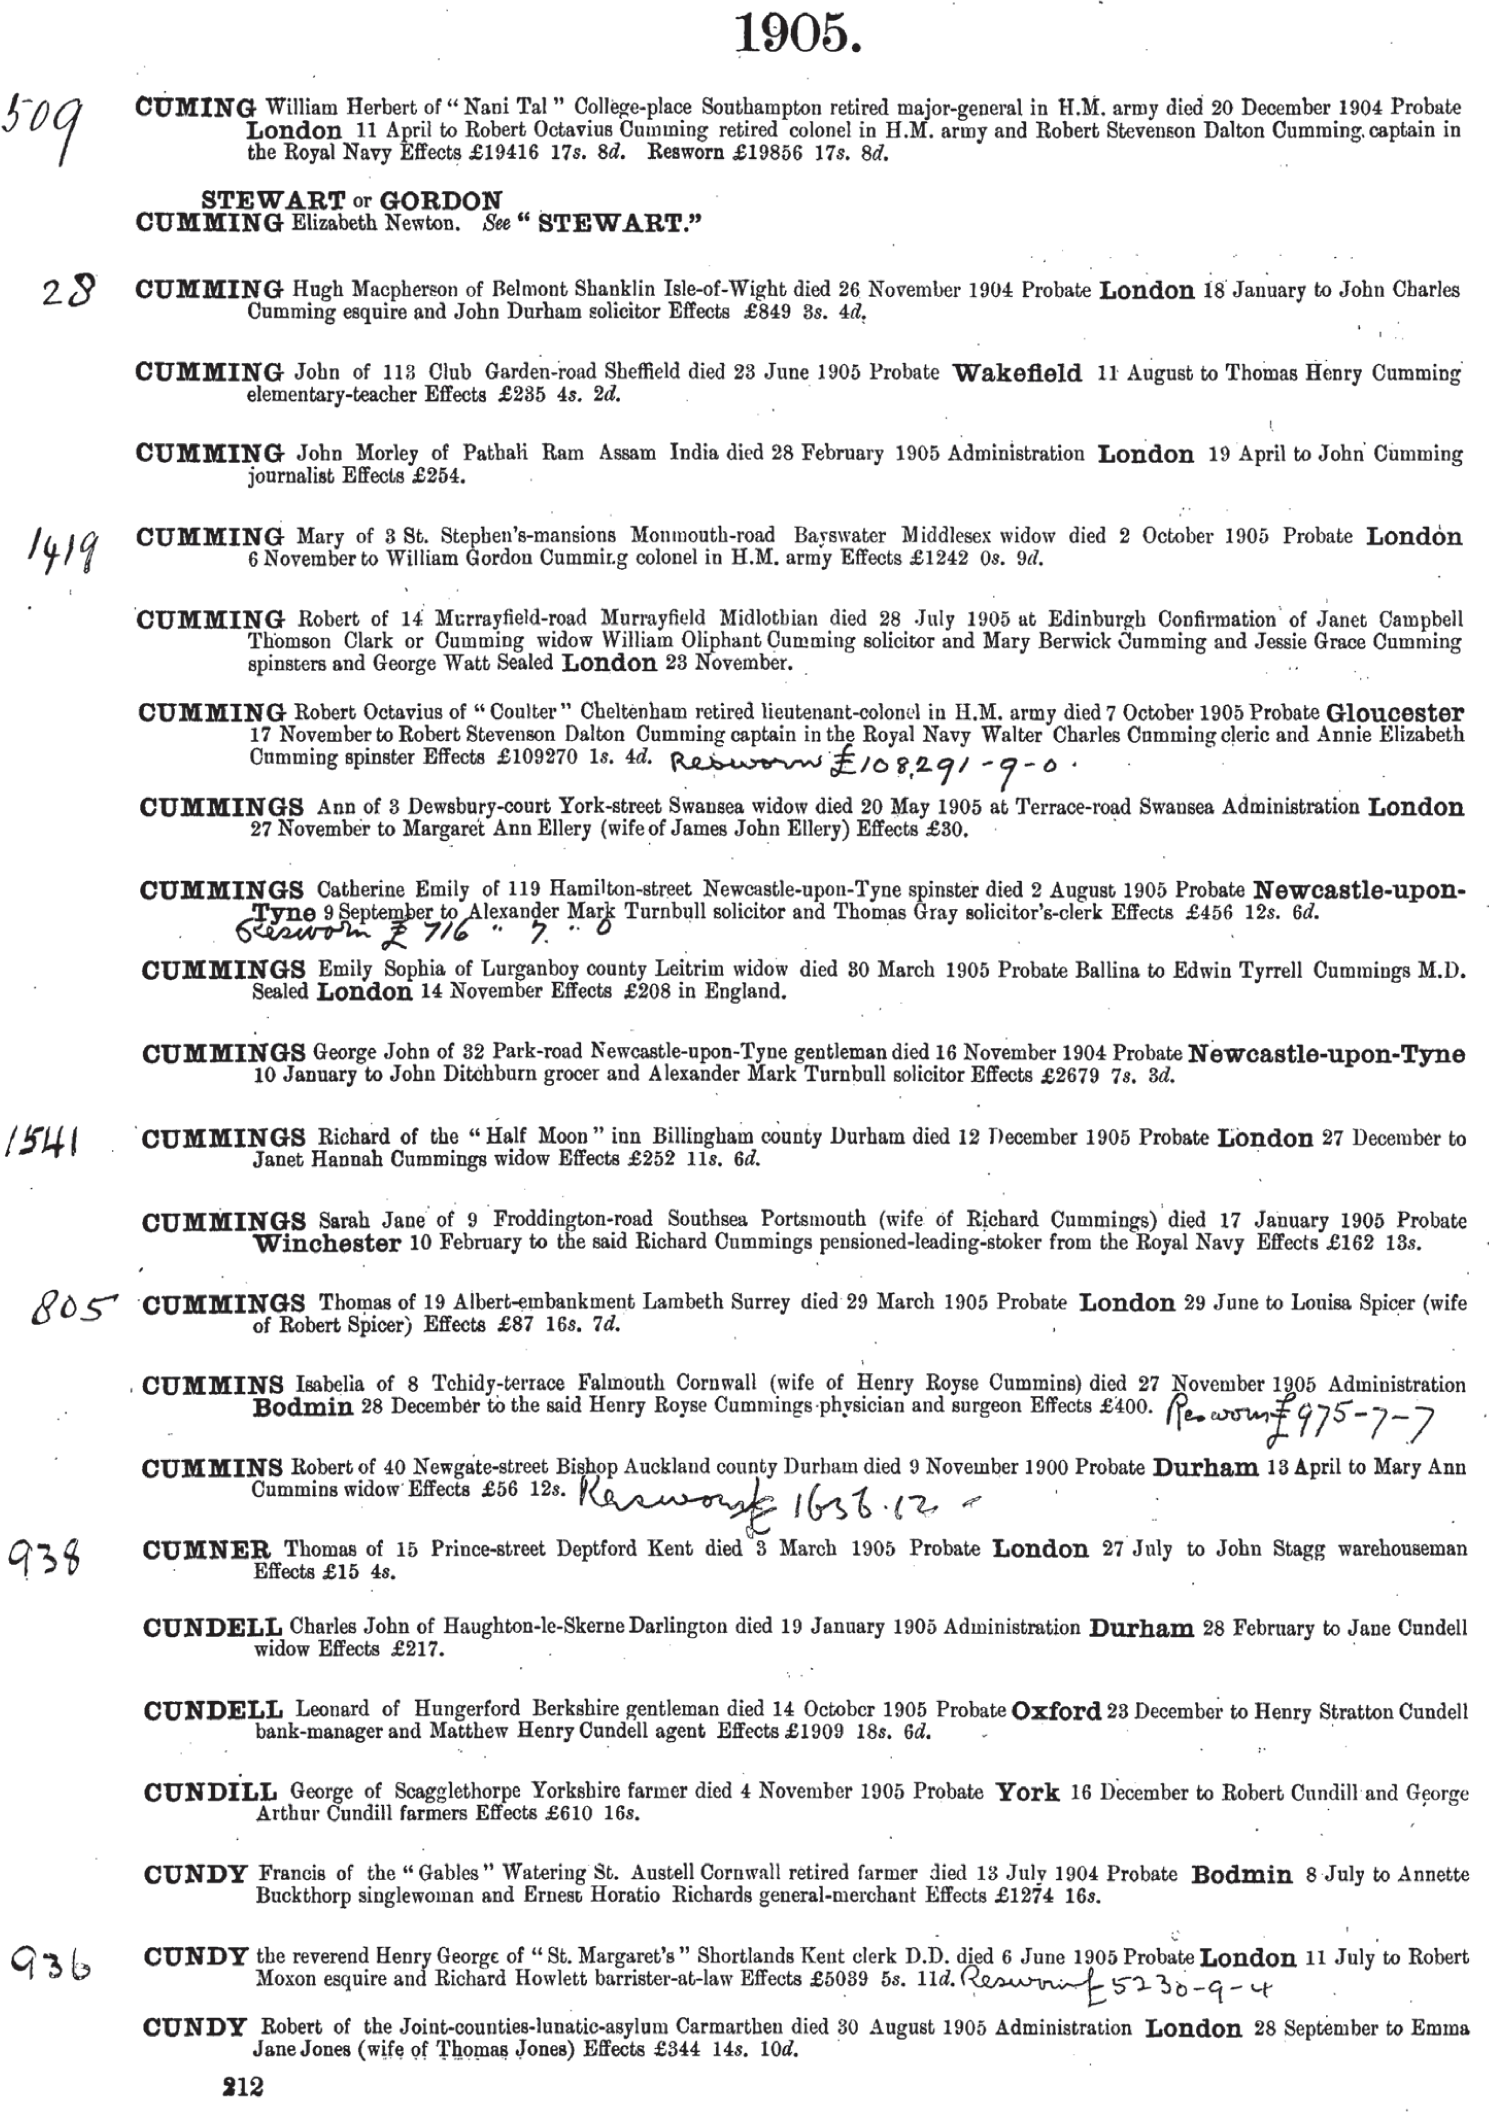
The original printed volumes of the PPR Calendars, from 1858 to 1996, have been digitized as scanned images and are made available at https://probatesearch.service.gov.uk (GOV.UK 2020) [last accessed 25 April 2016]. (However, the resulting data I extracted ends in 1992, due to the change in format in 1993 that made relative text extraction based on patterns impossible.) The data are free for academics to utilize (see the Open Government License for public sector information). Examples of the webpage interface and resulting images of the original index are shown in Figure 1.
In order to create a database of the PPR Calendar suitable for academic use, I created a script to mass download all the image files (e.g., Figure 1). The search engine had the feature that all results for a two letter string code starting sequence were returned: for example, searching for “SM” in 1850 returned all those with “SM” as the first two letters of their last name probated in 1850. I searched https://probatesearch.service.gov.uk for every two letter combination from “AA” to “ZZ” for every year from 1858 to 1996 inclusive, and recorded the number of result pages. This information allowed me to construct the base URLs that would lead me to each of the scanned images, for example, https://probatesearch.service.gov.uk/Calendar?surname=Cummins&yearOfDeath=1905&page=1#calendar directs to the image in Figure 1. This led to the creation of 1,013,056 URLs that were used to download the index images. This process was automated.
THE SCANNED IMAGES
Source: https://probatesearch.service.gov.uk/Calendar?surname=Cummins&yearOfDeath=1905&page=1#calendar. Contains public sector information licensed under the Open Government Licence v3.0.
Optical Character Recognition (OCR) was performed for each of the index pages using ABBYY fine-reader 12 software. This software performed by far the best in terms of fidelity and consistency (as compared to free software such as Google’s tesseract). Over one million images were collected into 504 PDF files of 2,000 pages each. This process was also automated.
The OCR process resulted in 504 “dirty” (unformatted, full of duplicates) text files. These files were merged into 10 larger text files. Next the text patterns underlying the PPR Calendar entry structure were deduced by inspection (as indicated by the bolded text in Online Appendix Figure A.1). The patterns are reported in Table 3. These features were found, marked, and parsed using regular expression in the Perl computing language (executed as command line.bat files). Following this, a set of touch-ups was conducted using macros in the text manager Ultra-edit.
GENERAL ENTRY PATTERNS

Note: Many variations of the above were employed.
Source: PPR Calendars, 1892–1992.
The resulting “semi-clean” text files were imported to R and marked patterns in the text were found using SQL language (via the R package sqldf). The code converted the text to a database of rows and columns. Unique entries were identified and duplicates discarded. After this, individual fields were constructed from the relative position patterns. Years and wealth were attributed. Much code was then devoted to cleaning the wealth measure as many entries had £ and shilling values conflated, and post 1970 many records had the effects value conflated with a 10-digit record number (resulting in many decedents with astronomical levels of wealth, for an for example see the last two entries in Online Appendix Figure A.1). This cleaning process was a combination of manual, by-eye, checking to discover patterns of problems and coding via SQL in R to clean the main data.
All nominal millionaires (over 4,000) were visually checked one by one, via www.ancestry.com and the probate service website.Footnote 18 Some examples of problematic and unusually rich entries are reported in Online Appendix Figure A.2.
This process, summarized in Figure 2, resulted in a database of N = 15, 152, 822, all with full name, street address, date of death, and wealth at death.
THE DATA-BUILDING PROCESS
Source: Author’s illustration.

BANDED PROBATE VALUATIONS AFTER 1980
After 1980 there was a change in the system for valuing probates in the PPR Calendars. As opposed to an exact valuation, which was the practice 1892–1979, a proportion of valuations appear as banded estimations. These are £25,000, £40,000, £70,000, £100,000, £115,000, and £125,000, with each entry listed as “Not Exceeding” the banded amount. Table 4 reports the overall incidence of the banded values, 1892–1992. It is clearly evident that these bands are loosely applied. The proportion of probated values that were entered as bands was about 60 percent in the 1980s and inspection of the data revealed that using these numbers for wealth distribution analysis was pointless. For example, Gini coefficients calculated using the banded values suggest a sudden, dramatic and large drop in wealth inequality in precisely 1980. Outside of war, revolution, and natural disaster, we would not expect such huge drops in inequality on a year to year basis. Further, the values of wealth necessary to enter the various top percentiles change dramatically after 1980. Occam’s Razor suggests that such a sudden change in the years immediately following a new valuation system is probably a direct result of that valuation system. Attributing a value based upon the average wealth of observed specific values also led to implausible drops in measured wealth inequality during the “banded” years. It was also clear by visually examining the entries, the “banded” entries did not transmit much information about the true wealth of the decedents. Therefore all banded values were dropped entirely and the post 1980 analysis relies on the distribution of specific, non-banded probated values only. (The “excluded” population post 1980 had to be adjusted by the proportion of those probated who have a banded value).
PROPORTION OF ALL DECEDENTS AND THOSE PROBATED WITH BANDED PROBATE VALUATIONS

Source: PPR Calendars, 1892–1992.
The critical assumption is that the distribution of specific probate estimates represent the population distribution of wealth above the probate threshold. This is probably incorrect. Using specific values instead of the bands is likely to oversample the rich—who can pay to have their deceased family member’s estate professionally valued. Caution must be therefore exercised when interpreting the post 1980 trends. The direction of the bias however can be gauged by considering who has been selectively purged from the data by dropping the wealth banded valuations. The rich are more represented as previously noted—the poor are still represented, but we are taking people out of the upper middle of the distribution—which other things being equal is likely to bias the inequality estimates upward. As the finding is of flat/declining inequality post 1980, I argue that the expected direction of the bias does not contradict this analysis’ post 1980 results.
CALCULATING THE COMPONENTS OF THE WEALTH DISTRIBUTION
Combining Probates and Deaths, Inferring Wealth
To understand the evolution of wealth inequality at death in England and Wales, it was necessary to combine the probate data with the complete death registers, also collected for this project. This process is described in the Online Appendix Sections G and H. Table 5 reports the number of probates and deaths over 20 by decade from 1892 to 1992. The proportion of adults receiving probate after death rises from 15 percent in the 1890s to 40 percent by 1992.
COUNTS OF PROBATES AND ADULT DEATHS, 1892–1992

Source: PPR Calendars, 1892–1992 and complete death registers 1892–1992.
As Alvaredo, Atkinson, and Morelli (Reference Alvaredo, Atkinson and Morelli2017, p. F9), I treat these non-probated estates as reporting “insignificant” wealth. For the analysis of overall wealth inequality, the wealth of these omitted decedents has to be inferred. Following the standard method of the Her Majesty’s Revenue and Customs (HMRC), I assigned each non-probated adult a wealth equal to half the level of wealth observed in the probate Calendars for the year of death that was below the threshold (Turner Reference Turner2010, pp. 628–9).Footnote 19 Figure 3 reports the total value of real wealth, 1892–1992 for the probated population and the inferred excluded population. Despite the fact that the probated population is a minority, only 15–49 percent of the total death population in any year, the application of an inferred minimum wealth to the remainder implies that on average 98 percent of all wealth is being captured by those probated. (Changes in wealth inequality over time can thus be captured by accounting for the changing probate rate and the shifting shares of the top wealth holders within the probated class.)
NOMINAL PROBATED AND NON-PROBATED (INFERRED) WEALTH IN ENGLAND AND WALES, 1892–1992
Sources: PPR Calendars, 1892–1992 and complete death registers 1892–1992.

The 30, 696, 529 observations, 1892–1992, representing the excluded population, were added to the probate data and assigned wealth as described earlier. Wealth shares were calculated by finding the percentile wealth at various cutoffs, assigning a dummy to each wealth observation indicating which percentile range it fell into, then summing wealth across these ranges, by year.
Descriptive Results
OVERALL INEQUALITY OVER TIME
Figure 4. Panel (a) reports the Gini coefficient of probated and total wealth by year of death and Figure 4 Panel (b) reports the proportion of English dead probated over the same period. There are three immediate facts that these two figures indicate about the evolution of the English wealth distribution. First, total wealth inequality declined significantly from a Gini of over .9 to .8, between 1892 and 1980.
OVERALL WEALTH INEQUALITY, ENGLAND 1892–1992
Sources: PPR Calendars, 1892–1992 and complete death registers 1892–1992.

Second, after the mid 1970s, inequality in probated wealth fell but total inequality plateaued.Footnote 20 These results are robust to different measures of inferring the wealth of non-probated population, as I investigate in Online Appendix Section D. There I compare the wealth Gini coefficients of Figure 4 (a) with those assuming (1) the non-probated all have zero-wealth and (2) the non-probated all have wealth £1 below the threshold. The trends and levels are broadly similar.
Third, and most importantly for the average English: the proportion of decedents that have wealth significant enough to merit probate rate has been flat since the end of WWII to 1992. This simple finding is quite stark. Despite the great equalization of wealth over the twentieth century, most English have no significant wealth at death. This is even more surprising considering the fact that the nominal threshold for probate (now £5,000) was only upwardly revised sporadically (see Table 1) and was the same from 1984 to 2018 (and is the threshold today in July 2020). A modest rise in the wealth of the “middle class,” the average English decedent, coupled with inflation, should have resulted in a rocketing probate rate and a far greater increase in the wealth share. Yet this is not evident.
As Figures 4 and 8 indicate, this is a story of a reshuffling of the share of the top .1 to 10 percent to the rest of the probated population. The bottom 60 percent of English have seen no increase whatsoever in their wealth share in the “great equalization.” Of course, inter-vivos bequests could obscure the true pattern of wealth holding. But if this is the case, we would expect the results to find a greater rise of the middle class. Given the “progressive” (confiscatory) nature of the top marginal rate of inheritance taxes after 1950, Figure 14 Panel (b), we would expect the rich and the very rich to have a greater proportional incentive to dispose of as much wealth as possible before death.
What of the reshuffling of wealth within the top 30 percent? Uniquely, the PPR data allow us to estimate wealth share below the top 10 percent.
PERCENTILE WEALTH SHARES OVER TIME, DETAILED BREAKDOWN
Figure 5 reports the shares of the top percentiles of the wealth distribution annually from 1892 to 1992. In contrast to Figure 8, these estimates are for non-overlapping percentiles (hence the top .1-1 percent do not include the top .1 percent and so on). The results for the top 10 percent mirror earlier work by Atkinson and Harrison (Reference Atkinson1978), Atkinson, Gordon, and Harrison (Reference Atkinson, Gordon and Alan1989), and Atkinson (Reference Atkinson2013).
The top .1 percent and top .1–1 percent, graphed in Figure 5 Panel (a) account for a consistently decreasing share of all wealth until about 1975. The top .1 percent hold 36 percent of all wealth in 1892 and the top .1–1 percent hold 38 percent—meaning that the top 1 percent hold 74 percent of all wealth in England and Wales. This declines to 22 percent by 1975 (7 and 15 percent of all wealth is held by the top .1 percent and the top .1–1 percent, respectively). Thereafter their shares are roughly constant to 1992.Footnote 21
TOP WEALTH SHARES, ENGLAND 1892–1992
Sources: PPR Calendars, 1892–1992 and complete death registers 1892–1992.

Two aspects of the decline of these very top shares are surprising. First, the decline is apparent well before 1940. Second, the plateaux in the decline of the share of the super rich coincide with the oil shocks of the 1970s and the end of the European “Golden Age” of post-war economic growth. The share of the top 5-1 percent, graphed in Figure 5 Panel (b) has held roughly constant over the observed century, as also noted by Atkinson, Gordon, and Harrison (1989, p. 319) (but does rise and decline in the series reported here), while the share of the top 10-5 percent has consistently risen, from 4 percent of all wealth in 1892 to 17 percent in 1992.
Figure 6 reports the dynamics of even 10 percent bins of the wealth distribution. What emerges here is that the decline of the share of the top 1 percent of wealth is entirely absorbed by the top 10-5 percent, the top 80–90 percent and the top 70–80 percent. Despite the choppiness of the estimates for the lower percentiles, it is clear that for the top 50–70 percent there is astonishingly little growth in the wealth share. Further, the rate of increase of the share of wealth held by all percentiles below the top 10 percent is negatively related to the percentile. For example, the 80–90th percentile increase their share from 1.5 percent in 1892 to 25 percent in 1992, and the 70–80th percentile go from <1 percent to 12 percent in 1992.
ENGLISH WEALTH HOLDING BY DECILE, 1892–1992
Sources: PPR Calendars, 1892–1992 and complete death registers 1892–1992.

In summary, over the century 1892–1992, the top 10 percent reduce their wealth share from 99 to 65 percent.Footnote 22 The relative winners are the 20 percent immediately below them. Where is the growth of the “middle class?” Below the top 30 percent, the bottom 70 percent go from around .02 percent of all English wealth to around 2 percent by 1992, a ten-fold increase, but tiny in absolute terms. These trends, while unprecedented and transformational, do not translate into a rise of a broad based “middle” class.
The 10 richest English who died in the sample period are reported in Table 6. As discussed in the first section, all extreme wealth values were also performed by a visual check. Further, all 40,074 of the top .1 percent, 1892–1992 were checked for duplicates by eye.Footnote 23 Of the top 10 listed in Table 6, all are known to be wealthy.Footnote 24 Eight of the 10 are listed on thepeerage.com as being connected to the British Peerage.
THE 10 RICHEST ENGLISH, 1892–1992

Note: 2015 prices.
Source: PPR Calendars, 1892–1992.
THE “SYNTHETIC” HOUSEHOLD LEVEL
The PPR Calendars report individual wealth holding at death. The household to which an individual belongs is not reported. It could be that wealth is held by specific individuals within households but these resources are available, for consumption, education etc., for the household as a whole. To examine this, I estimate the implied household level wealth distribution from the individual level PPR Calendars, for England 1892–1992.
I apply a simple transformation to the individual level data to generate an estimate of household level wealth holding. Let us assume that the population is composed of two-person households of which only one is ever observed in the probate process. In this world, the population of households is equal to the number of deaths divided by two, as:Footnote 25 $N_t^{HH} = {{N_t^d} \over 2}$
The number of probated households is equal to the observed number of individual probates:
 $$N_t^{pHH} = N_t^d,$$
where
 $$N_t^{pHH}$$
is the number of probated households in year t, and
$$N_t^{pHH}$$
is the number of probated households in year t, and
 $$N_t^p$$
is the number of probated individuals (e.g., Column 2 of Table 5). The number of missing, zero-wealth households, N
mHH
, is calculated as
$$N_t^p$$
is the number of probated individuals (e.g., Column 2 of Table 5). The number of missing, zero-wealth households, N
mHH
, is calculated as
 $$N_t^{mHH} = N_t^{HH} - N_t^{pHH} = {{N_t^d} \over 2} - N_t^p,$$
where
 $$N_t^d$$
is the number of deaths in a year. The idea is that the number of deaths that have zero wealth
$$N_t^d$$
is the number of deaths in a year. The idea is that the number of deaths that have zero wealth
 $$(N_t^d - 2*N_t^p)$$
also represent households of two people, on average (in this case both are not probated). The assumptions are strong, but this exercise is intended as an upper limit on the level of inequality we would observe if we interpreted the individual probate data, not as individual returns, but as households. Therefore the most equitable assumptions for these are employed.Footnote
26
$$(N_t^d - 2*N_t^p)$$
also represent households of two people, on average (in this case both are not probated). The assumptions are strong, but this exercise is intended as an upper limit on the level of inequality we would observe if we interpreted the individual probate data, not as individual returns, but as households. Therefore the most equitable assumptions for these are employed.Footnote
26
The resulting inequality calculations are then based on the implied number of households observed with wealth and those who receive an inferred wealth, due to holding wealth below the probate threshold, in year t.
 $$N_t^{HH} = N_t^{pHH} + N_t^{mHH}$$
Each probated observation represents an implied household of two adults and each inferred observation (assigned missing wealth as before) represents a household of two adults who are not probated. The exercise assumes that the population is only comprised of these two types of households and there are no households where both members of a couple make probate. It ignores the possibility that rich couples could both be probated. This is clearly not an accurate assumption, but is necessary without detailed couple level information. It should therefore be thought of as an upper bound on the household distribution of wealth implied from the individual level PPR Calendar data.
Figure 7 reports inequality at this synthetic household level.
The proportion of households reporting wealth sufficient to merit probate is close to 80 percent, 1945–1992 (Figure 7 Panel (a)). So while wealth holding at the individual level is still under 50 percent, even in 2010 to 2018, the implied household level consumption inequality is considerably lower. The vast majority of households have some wealth. There is a steeper decline in the wealth Gini coefficient from 1900 to 1975 at the household level compared to the individual level (Panel (b)). However, both series are flat after 1975.
INEQUALITY MEASURES AT THE INDIVIDUAL AND IMPLIED HOUSEHOLD LEVEL, 1892–1992
Sources: PPR Calendars, 1892–1992 and complete death registers 1892–1992.

The share of the top 1 percent is lower at the household level throughout 1892–1992 (compare Figure 7 Panel (c) with Figure 5 Panel (a)), but the trends in the decline are the same. At the wealth decile level, the top 10 percent of households hold the vast majority of all wealth (e.g., just under 50 percent in 1990, compared with about 62 percent of wealth held by the top 10 percent of individuals). However, the bottom wealth deciles report significantly more wealth at the household level than the individual wealth deciles (compare Figure 7 Panel (d) with Figure 6). However, the share of wealth held by the bottom 60 percent of households is still modest, at around 12 percent.
Of course, this synthetic household level calculation is perhaps best understood as a signal of the inherit difficulty in extracting true wealth inequality of consumption from individual inequality of capital ownership, as revealed by the PPR Calendars. Both patterns are important for our understanding of the evolution of wealth inequality across the twentieth century.
TRIANGULATING THE RESULTS
In this section, I triangulate the results of the analysis with existing studies. I compare the PPR Calendar data with estimates of top wealth shares, home-ownership trends, wealth survey distributions, aggregate wealth, and the wealth Gini coefficient.
The PPR wealth data analyzed in this article is measured at death. Typically, housing and wealth surveys concern the living. Lifecycle accumulation and dissaving patterns may result in peak wealth during life being very different to remaining wealth at death (see, e.g., Modigliani Reference Modigliani1986).Footnote 27 Yet, people do not know when they are going to die and it typically comes as a surprise (Dor-Ziderman, Lutz, and Goldstein Reference Dor-Ziderman, Lutz and Goldstein2019). However, when comparing different measures of wealth, the timing of observation over the course of life must always be kept in mind. Are the inequality patterns described by the PPR Calendars consistent with what we already know about wealth and inequality in England and Wales?
TOP PERCENTILE SHARES
Figure 8 compares my estimates of the top .1, 1, 5, and 10 percent shares of the wealth distribution with recent estimates from Alvaredo, Atkinson, and Morelli (Reference Alvaredo, Atkinson and Morelli2018). In general, my estimates for the share of the top 10 and 5 percent wealth shares appear to be over-estimated relative to Alvaredo, Atkinson, and Morelli (Reference Alvaredo, Atkinson and Morelli2018), but there is a striking correspondence for our estimates of the top .1 and 1 percent shares.Footnote 28 Further the trends in all series are the same, until the 1980s. The estimates agree that inequality stopped rising but my estimates show a higher share of wealth for the upper percentiles that is even, possibly, increasing. However, post 1980, the PPR Calendars increasingly use “banded” wealth estimates that are clearly loosely applied (this is discussed further in the Online Appendix).Footnote 29
COMPARING DIFFERENT ESTIMATES OF TOP WEALTH SHARES, ENGLAND 1892–1992
Notes: The solid lines are estimates from Alvardeo, Atkinson, and Morelli (2018) and the dashed lines are PPR estimates.
Sources: PPR Calendars, 1892–1992 and complete death registers 1892–1992.

The other significant difference between the series in Figure 8 is the trend in the top-wealth shares, 1900–1910. The PPR Calendar estimates show a significant decline, then rise, over this decade while the Alvaredo, Atkinson, and Morelli (Reference Alvaredo, Atkinson and Morelli2018) estimates shows a stable decline. Both estimates start and end the decade with approximately the same value. There are important differences in the composition of assets that form the basis for each of these wealth estimates (most importantly settled personalty (Rubinstein Reference Rubinstein1974, p. 70)). However, a closer analysis of this divergence reveals that the 1901 change in the minimum value of an estate requiring probate (from £10 to £50) results in a significant rise in the value of inferred wealth for the excluded population. This rises abruptly from £1.84 in 1901 to £14.55 in 1902. This sudden rise in the average wealth of the excluded population is not real and the resulting changes in the wealth-share trends in the PPR Calendar series are an artifact of this. Caution must therefore be exercised in interpreting the PPR Calendar estimate around the years where the probate minimum changed. In Online Appendix Section C, I examine this issue and conclude that the inequality trends based on the PPR Calendar data are robust to this concern.
Home Ownership
The most important asset for most English is the family home. However, housing needs vary across the life cycle. The tendency for individuals and couple’s to “downsize” as they enter retirement age ranges and older, to sell the family home and use the surplus for care needs will dilute wealth.Footnote 30 Unfortunately, the PPR Calendar data report neither age nor a specific estimate of housing wealth. However, we can still ask whether the well-known features of the English housing market in the twentieth century are consistent with the inequality trends presented in this article.
Home ownership rose across the twentieth century; the proportion of households that was designated owner-occupied was 23 percent in 1918, 51 percent in 1971, and was 69 percent by 2001 (a rise of 300 percent, Office for National Statistics (2013), with the pre 1971 numbers based on Holmans (Reference Holmans1987)).Footnote 31 This trend is plotted in Figure 9 Panel (a). However, the relevant comparison for assessing the plausibility of the PPR wealth data is the ownership rate, per adult.Footnote 32 I calculated this measure as the owner-occupied rate (which gives the proportion of houses that are occupied by an owner) divided by the number of adults per house (calculated from the number of adults and the number of households in census years, reported in Holmans (Reference Holmans2005, p. 14, table A1)).Footnote 33
I plot this measure, the proportion of adults owning a house, in Figure 9 Panel (a). This measure shows a proportionally higher rise than the owner-occupied rate, rising from 8 percent in 1918 to a peak of 38 percent in 2001 (a rise of approximately 500 percent, and falls after). However, this per adult estimate is entirely consistent with the results from the PPR Calendar wealth data where the spread of wealth over the twentieth century is limited to the top 30 percent of decedents (until 1992, Figure 6) and the proportion of English with “probatable” wealth is 40 percent from 1950–1992, and close to 50 percent 1996–2018 (Figure 4 Panel (b)).
THE HOUSING MARKET IN ENGLAND AND WALES, TWENTIETH CENTURY
Notes: Owner-Occupied rate from the Office for National Statistics (2013), with the pre 1971 data based on Holmans (Reference Holmans1987). The Ownership-Rate, the proportion of adults owning housing is calculated as the Owner-Occupied rate divided by the average number of adults per household, which is reported in Holmans (Reference Holmans2005). House prices calculated from the Bank of England (2020), which reports a nominal house price index 1840–2016. I applied a 2015 nominal house price of £290,000 (Office for National Statistics 2015b) to generate the implied nominal prices from the index. I then applied the CPI to give the real price series, also from the Bank of England (2020).
Source: National Statistics (2013, 2015b), Holmans (Reference Holmans1987, Reference Holmans2005), and the Bank of England (2020).

Another aspect of the housing market is the rise in average house values over the sample period, as plotted in Figure 9 Panel (b). In 1980, the average price of a house in England and Wales was £95,151 (2015 prices). By 2015, this had risen to £290,000.Footnote 34 This is captured by the probate data in Figure 4 Panel (b), which shows a simultaneous, dramatic rise in the amount of wealth subject to probate at death, from £5bn to 10bn, 1980 to 1990.
The “Right-to-Buy” scheme introduced by the 1980 Housing Act allowed tenants to purchase their council home (socially provided housing). This was associated with a rise in the proportion of owner-occupied housing, as in Figure 9 Panel (a). Other things being equal, we might expect this to also be associated with greater wealth equality. Surprisingly, it is not associated with any drop in the wealth shares of the top percentiles (Figure 8), overall inequality (Figure 4 Panel (a)), or the proportion probated (Figure 4 Panel (b)). The trend in all of these measures is flat during this period. However, it may be the case that without “Right-to-Buy,” inequality would have been even higher during the 1980s and 1990s. Since 1991, the proportion of housing that is rented has increased from 9 to 18 percent and the owner-occupancy rate has fallen from 68 to 64 percent, associated here with a flat probate rate of less than 50 percent (Figure 4 Panel (b)).
In the subsection discussing average wealth, as shown in Figure 12, I compare average levels of wealth from the PPR Calendar with existing estimates of net financial wealth, including housing wealth. There is an almost exact correspondence between the two measures. In sum, the existing evidence from the twentieth-century housing market is consistent with the wealth trends from the PPR Calendars.
Wealth Studies
In 2018, median household wealth, excluding pension wealth, is £170,900 (Office for National Statistics 2015b, table 2.4). However, person-level total wealth, excluding pension wealth, is estimated at £30,000 (Office for National Statistics 2019, Sheet “R6 Person Level”). However, the empirical base for historical wealth estimates are limited.Footnote 35 This subsection compares the PPR Calendar data to the Oxford Savings Surveys (OSS) of the 1950s and the Financial Research Survey (FRS) of 1991.
OXFORD SAVINGS SURVEYS
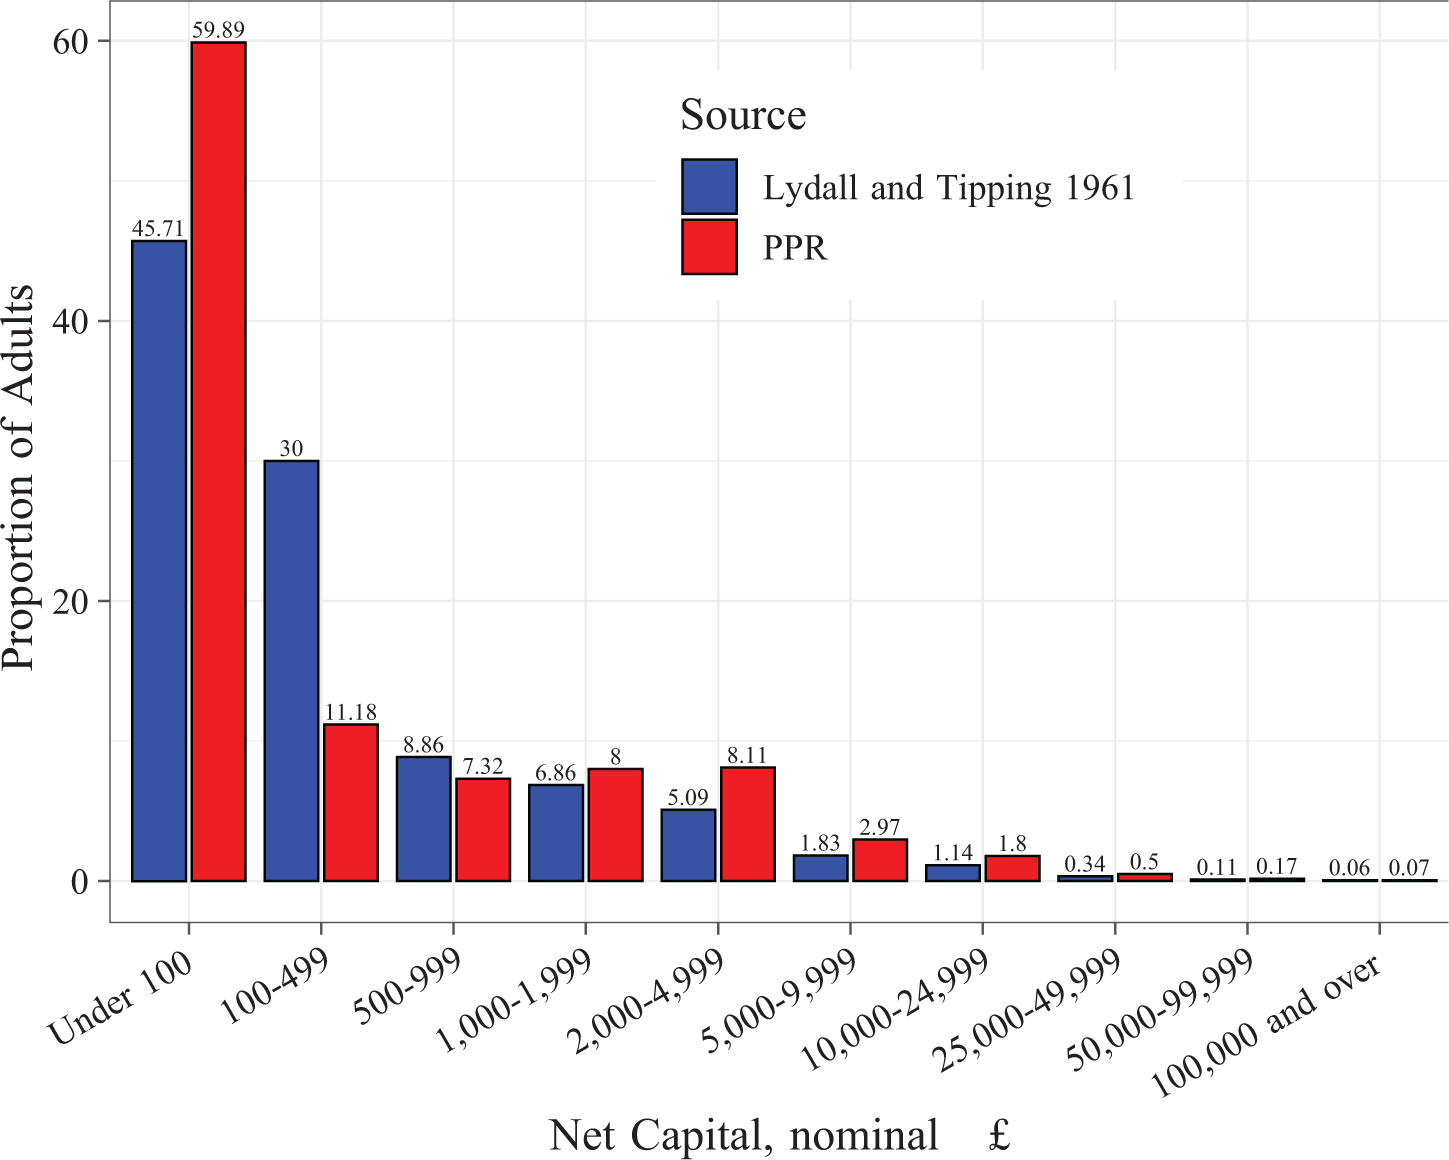
The OSS of the 1950s collected information on the income, savings, and net worth of respondents.Footnote 36 However, despite the representative aim of the OSS, the response rate to the surveys was only 67 percent (Lydall and Tipping Reference Lydall and Tipping1961). In addition, it was suspected that considerable underestimation of wealth was reported by the richest (Atkinson and Harrison Reference Atkinson1974, p. 125). Lydall and Tipping (Reference Lydall and Tipping1961) used the 1954 OSS to calculate a representative estimate of the individual wealth distribution below £2,000. Above £2,000, they used estate duty returns. Figure 10 reports their estimate of the proportion of individuals within each wealth band. For the proportions of individuals within the wealth groups richer than £500, the estimates of this article and those of Lydall and Tipping (Reference Lydall and Tipping1961) closely align. Above £2,000 the PPR Calendar consistently reports higher proportions of the population. However, given the sampling error, we should be careful not to over-interpret this. Below £100, it is clear that the PPR estimates assign a far greater share of individuals. Considering that death imposes a fixed cost (e.g., funeral and legal costs), the estimates are consistent with each other. This article estimates that in 1950s England, 71 percent of individuals have less than £500, Lydall and Tipping (Reference Lydall and Tipping1961) estimate for Great Britain 75 percent of individuals have less than £500. Considering that Scotland and Wales are poorer than England, these estimates are broadly in line.Footnote 37
COMPARISON OF NET CAPITAL WITH LYDALL AND TIPPING 1961, BY WEALTH BAND, 1950s
Notes: The PPR covers England and the Lydall and Tipping (Reference Lydall and Tipping1961) estimates cover Great Britain. Both estimates exclude pension wealth.
Sources: PPR Calendars and Lydall and Tipping (Reference Lydall and Tipping1961, p. 89).
THE FAMILY EXPENDITURE SURVEY AND THE FINANCIAL RESEARCH SURVEY
The FES, which was collected annually from 1961–2001, is the major source for the analysis of household income and expenditure for the period (Banks and Johnson Reference Banks and Paul1998a). However, the income data, and in particular the quality of the investment income data, have been severely criticized (see Atkinson and Micklewright (Reference Atkinson1983) for a detailed discussion).Footnote 38 Further, information on wealth was not systematically collected over the majority of the sample period.Footnote 39
Due to the problems of using the FES to measure wealth, I instead compare the PPR Calendar data to the more comprehensive FRS of 1991 and 1992 (Banks, Dilnot, and Low Reference Banks, Dilnot and Low1994). (Figure J.2 in the Online Appendix summarizes the existing surveys of wealth for the end of the sample period, the late 1980s-early 1990s.)
Banks, Dilnot, and Low (Reference Banks, Dilnot and Low1994) use the FRS and augment it with housing wealth from the British Household Panel Study to estimate median total (non-pension wealth by wealth decile for 1991–2 (p. 21) at the household level. Figure 11 compares the median value of wealth for the PPR data, 1991–2, by wealth decile, for households and individuals with that reported by Banks, Dilnot, and Low (Reference Banks, Dilnot and Low1994, p. 21, figure 3.6). The transformation of the individual level PPR data to a synthetic household, as described in the fourth section, results in a more egalitarian wealth structure and a greater level of median wealth at every decile. (The top 10 percent of household are richer than the top 10 percent of individuals.)
COMPARISON OF MEDIAN REAL WEALTH, BY WEALTH DECILE, PPR CALENDARS AND FINANCIAL RESEARCH SURVEY
Sources: PPR Calendars, 1892–1992 and complete death registers 1892–1992, and Banks et al. (Reference Banks, Dilnot and Low1994).

In comparison with the household level PPR estimates, the FRS estimates are considerably lower, at every decile. However, this may be due to the deficiency of the FRS: As Banks, Dilnot, and Low (Reference Banks, Dilnot and Low1994) note “the FRS identifies only about 40% of aggregate financial wealth” (p. 10). It is clear that the PPR data detect considerably more wealth than the FRS.Footnote 40
Supporting this assessment, that the FRS seriously underestimates true wealth is Disney, Johnson, and Stears (Reference Disney, Johnson and Stears1998). Using data from the Retirement Surveys of 1988 and 1994, they report a non-zero median wealth for English retirees of £177,700. This translates to £283,746 in 2015 prices. This compares with an average for the PPR synthetic households of £225,091 in 1992. In summary, assessing the quality of the PPR Calendar wealth data is complicated by the fact that there are few alternative and contemporary sources of wealth holding with accurate information. How does the PPR Calendar wealth compare with aggregate levels of wealth, calculated from other sources?
Average Wealth
Blake and Orszag (Reference Blake and Michael Orszag1999) use a wide variety of sources, including Inland Revenue data, building society deposits, life and annuity funds, the UK National Income accounts, and the Annual Abstract of Statistics (ONS), to calculate annual aggregate estimates of wealth holding in the United Kingdom, 1948–1994. I have taken their estimates for non-pension wealth (namely net financial wealth, housing wealth, and consumer durable assets) and calculated a per-adult measure of average wealth. Figure 12 reports this average and compares it with the average for the PPR wealth data used in this article.
COMPARING AVERAGE WEALTH WITH BLAKE AND ORSZAG (1999)
Sources: PPR wealth data, Blake and Orszag (1999, table 12) (sum of columns “net financial wealth,” “housing wealth,” and “consumer durable assets”). These aggregate sums were converted to a per adult measure using the population data from the Office for National Statistics (2018a).

There are important differences between the series; Blake and Orszag (1999) calculate a value for the United Kingdom, the PPR data is for England and Wales. Further, the average I have calculated for their data in Figure 12 is per living adult. The PPR wealth data is measured at death. Nevertheless there is a striking concordance between these series. This applies both to levels and trend; the elasticity of the measures to each other is .894.
Thus the PPR Calendar data matches well with what we know about aggregate level wealth in the economy.
Gini Coefficients in Wealth
Figure 13 compares the Gini coefficient calculated from the PPR wealth data, which refer to England, with existing estimates of the wealth Gini for the United Kingdom, 1966–2017. The Gini is calculated at both individual and synthetic household level.
COMPARISON OF DIFFERENT ESTIMATES OF THE GINI COEFFICIENT IN WEALTH, 1970–2017
Sources: PPR Calendars, IR: Inland Revenue 1987, 1996 as reported by Davies and Shorrocks (Reference Davies and Shorrocks2000, table 2) (all United Kingdom), Good (Reference Good1991) (estate-duty based estimates, United Kingdom, 1976–1986), HMRC (2005, table 13.5) (estate-duty based estimates, United Kingdom, 1976–2005), Office for National Statistics (2018b) (United Kingdom, 2006–2016; Wealth and Assets Survey).

The individual level PPR Calendar Gini coefficient lies midway between the existing individual level Gini wealth estimates of Good (Reference Good1991) and HMRC (2005a). Note that the PPR estimate corresponds exactly to the Inland Revenue (IR) estimates before 1980. After 1980, they diverge, with the IR series declining and the PPR individual series plateauing. HMRC (2005a) and Good (Reference Good1991) use the estate multiplier method, as do Atkinson and Harrison (Reference Atkinson1978), Alvaredo, Atkinson, and Morelli (Reference Alvaredo, Atkinson and Morelli2018), to calculate a Gini coefficient. The principle weakness is that these estimates are based on a sample of estates paying estate duty and inheritance tax.Footnote 41
The household level estimates of the wealth Gini coefficient unfortunately do not overlap in time but the levels are consistent and not wildly different.
There are reasons to believe that the PPR data is superior to alternatives for estimating Gini coefficients due to the large, non-sampled population level estate of wealth employed. Where wealth is distributed non-normally, this coverage matters a lot and may explain some of the discrepancies with alternative estimates in Figure 4. For the purpose of triangulating the PPR wealth data however, where available, the PPR Gini estimates are broadly consistent with those calculated by other studies.
DISCUSSION
This article has documented the rise of the English wealth “middle class” from 1892 to 1992 (Reference CumminsCummins 2021). From the individual PPR Calendar data, English wealth holding is surprisingly limited and has not changed much since 1945. The bottom 60 percent of English hold no significant wealth. However, from a synthetic household perspective, this probate rate is consistent with over 80 percent of households having some wealth, if we assume one wealth holder being probated per married couple. At this level, probate was already covering the vast majority of English households. It did not rise because it was already high, over 75 percent, by 1945. Yet, even with this, likely over-estimated, wealth-holding proportion, the bottom 60 percent of households hold only about 12 percent of all wealth.
The PPR Calendar wealth data do not record pension wealth; it could be that the vast majority of “middle class” wealth is held as such. As life expectancy has risen consistently over the twentieth century, there has been more retirement life to fund.Footnote 42 However, pension wealth and entitlements that end with death, do not represent controllable financial assets but deferred consumption.
The PPR Calendar data reflect the individual details of the distribution of controllable financial capital at death. This distribution is important for understanding the power dynamics in a capitalist democracy. Policies towards taxation and redistribution will conceivably be influenced by its distribution. Power dynamics within households, the economic status and position of women and children, will also be influenced by the pattern of wealth ownership. This analysis shows that this distribution is surprisingly skewed towards the top 30 percent of individuals. What forces explain the emergence of this pattern?
Piketty (Reference Piketty2014) proposes a new general law of capitalism: when the growth rate of the economy is greater than the rate of return on capital in the economy (r), the concentration of wealth is diluted. However, the role of taxation, which is not an automatic rule but a set of laws that are also related to political forces was also crucial. Figure 14 sketches the path of these forces over the twentieth century. The timing of the simple r − g model of wealth dilution does not match well the timing of the secular decline of the top wealth shares. For example, Figures 5 Panel (a) and 7 Panel (a) report a consistent decline of the shares of the top 1 percent and the top .01 percent from about 1914 to 1975. Moreover, r – g is positive for the entire twentieth century, as plotted in Figure 14 Panel (a). The effects of high inheritance taxes also have timing issues: when the decline of the top 1 percent begins around 1913, inheritance taxes are a small fraction of what they rise to by 1950.Yet, there is no acceleration on the rate of decline of the top 1 percent—it is constant throughout (again, see Figures 5 Panel (a) and 7 Panel (a)). However, once taxation is set at a flat 40 percent in the 1980s, as plotted in Figure 14 Panel (b), the share of the top 1 percent stops declining.
r, g, AND taxes IN THE “GREAT EQUALIZATION” OF ENGLISH WEALTH
Sources: Panel (a): Piketty (Reference Piketty2014, figure 6.3; Data on the rate of return to capital available from http://piketty.pse.ens.fr/en/capital21c2) and GDP per capita from the Maddison Project (http://www.ggdc.net/maddison/maddison-project/home.htm). Both rates are “Real” (see Piketty, pp. 209–11 on this point). Panel (b): Maximum inheritance tax plotted (HMRC 2005b).

It is clear that the decline of the top 1 percent drives the entire distribution of twentieth-century English wealth. One possibility is that WWI destroyed significant amounts of elite capital and a generation of elite inheritors were wiped out by the high mortality rate of the officer class during WWI (Winter Reference Winter1977). The concentrated wealth that would have been inherited had these men survived could then have been dissipated across an extended family. Another possibility is that elite dynasties are simply hiding their wealth, both legally and illegally. These avenues are explored in depth in a complementary paper (Cummins Reference Cummins2019).
What about the behavior of the “middle-classes” themselves? The late nineteenth and twentieth centuries saw a significant expansion of the role of human capital in the economy. It is possible that we do not see a greater accumulation of “middle class” wealth because all surplus income is invested both in pensions and in investment in the human capital of offspring. There were multiple acts of legislation from the Forster Education Act of 1870 to the Education Act of 1944 (only fully implemented in 1972) that raised the age of compulsory school attendance. However, the middle classes were already educating their children at high rates (these acts primarily affected the poor). In 1961, 5 percent of those age 18–19 attended university or another higher education institution. In 1995, this was 35 percent (the Dearing Report, officially known as the UK National Committee of Inquiry into Higher Education, 1997).Footnote 43
There is no doubt that there was a large increase in the fixed cost of raising a middle class child over the twentieth century. According to the economic theory of fertility, this cost is cited as one of the major reasons why family sizes are smaller today than a century ago (Becker Reference Becker1991).
There are a number of possible, complementary explanations for the path of twentieth-century wealth inequalities in England. However, if we compare England with other countries we see that precisely the same secular decline occurs everywhere we have estimates (see Piketty (Reference Piketty2014)). So whatever theory explains the decline of wealth inequality in England must also explain the international pattern too. As yet, this remains a mystery.
Families face constant trade offs. There are other things in life than the accumulation of capital. Some in society will have a preference for work. Others for non-monetary activities. Once immediate consumption needs are met, individuals can choose other non-market activities that benefit mental health, the quality and depth of their social ties and community, or their spiritual and religious life. Wealth is but one aspect that people value, and we can expect that individuals will trade off potential wealth for time doing activities that promote non-financial well-being. The current wealth distribution could also simply reflect individual innate differences in the preference for holding or spending capital.
CONCLUSION
Using novel population-scale data, this article has freshly characterized the English wealth distribution between 1892 and 1992; a period that captures the “Great Equalization” of wealth. When it comes to the ownership of capital, I find that r – g dynamics failed to create a broadly based wealth “middle” class England. Even in the post war years, the period of the massive drop in the wealth share of the top 1 percent from 73 to 20 percent, two-thirds of English decedents lived, worked, then died with nothing to their name.Footnote 44
This article is an opening salvo for a research agenda examining the determinants of the English wealth distribution over the past century and more. Future research that can fully exploit the rich individual level detail of the PPR entries has great promise. The data contain compelling surname information, for example, as well as exact street addresses of decedents. A population analysis, for example, of the controversial social mobility claims of Clark and Cummins (Reference Clark and Neil2015a) could be attempted. Why did the share of the top point 1 percent decline so dramatically? Every member of the top .1 percent is listed in the PPR data. Their family history, life choices, and demography can now be detailed and tracked. Theoretically, linking the wealth distribution to theories of social mobility that are consistent with the empirical facts, given by the PPR data, is another direction.
The methodology applied here to constructing a new dataset can be applied to any set of images of historical records that contain consistent formatting. There are millions of these images on website servers all over the world. As OCR software continues to become more accurate, there is now remarkable potential for new, big data analysis in economic history.


 Open access

