


Statement of Research Significance
Research Question(s) or Topic(s): This study explored the effect of dyslexia and age on King-Devick test performance in Finnish-speaking adolescent athletes to determine the clinically relevant change in seconds to help clinical interpretation of King-Devick test results. These thresholds were used to evaluate test performance of concussed athletes. Main Findings: Older athletes performed faster in King-Devick test while dyslexia slowed down test outcome times. We observed that the clinically significant increase in King-Devick test time was 4.4 sec. When tested on day 3 post-concussion, a portion of concussed athletes still showed declines in their King-Devick test. Study Contributions: These thresholds provided in this study help to clinically interpret King-Devick results in non-native English-speaking athlete populations. Because native language, age, and dyslexia affect reading times in the test, these factors should be taken into consideration when comparing outcome times to reference values during both baseline and post-concussion screening.
Introduction
Concussion is by definition a mild traumatic brain injury (mTBI) that can cause a variety of symptoms, including headache, nausea, and vision problems (Patricios et al., Reference Patricios, Schneider, Dvorak, Ahmed, Blauwet, Cantu, Davis, Echemendia, Makdissi, McNamee, Broglio, Emery, Feddermann-Demont, Fuller, Giza, Guskiewicz, Hainline, Iverson, Kutcher and Meeuwisse2023). Millions of children and adolescents are affected by mTBI each year (Bryan et al., Reference Bryan, Rowhani-Rahbar, Comstock and Rivara2016), and it is a common injury in contact sports like ice hockey. Concussion symptoms can be divided into subgroups representing cognitive, oculomotor, headache/migraine, vestibular, and anxiety/mood impairments (Lumba-Brown et al., Reference Lumba-Brown, Teramoto, Bloom, Brody, Chesnutt, Clugston, Collins, Gioia, Kontos, Lal, Sills and Ghajar2020). Approximately one third of concussion patients present with oculomotor symptoms, such as saccadic impairments (Master et al., Reference Master, Scheiman, Gallaway, Goodman, Robinson, Master and Grady2016), and understanding the effects of sport-related concussion (SRC) on visuo-sensory and visuomotor skills is of interest in sports medicine. Visual functions are in some form processed in over 80% of the brain, and concussions affect this complex 3-dimensional circuitry. Visual perception involves separate but interconnected cortical pathways from the ventral-to-temporal and dorsal-to-parietal visual pathways (Goodale, Reference Goodale2011). Early identification of a concussed athlete with oculomotor symptoms is important to allow for individualized follow-up and rehabilitation. Because cognitive and oculomotor systems mature throughout adolescence, age-related differences in the King-Devick (K-D) test performance are well documented (Galetta et al., Reference Galetta, Liu, Leong, Ventura, Galetta and Balcer2016; Heick et al., Reference Heick, Bay, Dompier and Valovich McLeod2016; Heick et al., Reference Heick, Edgerton and Raab2020). Although individuals do not develop on identical timelines, group-level age effects provide an empirically supported basis for structuring analyses in adolescent samples.
The K-D test is a rapid pseudo-reading task that measures processing speed, visual tracking, and saccadic eye movements in less than 2 minutes (Galetta et al., Reference Galetta, Liu, Leong, Ventura, Galetta and Balcer2016). It is generally accepted in the scientific literature that concussion leads to slowed K-D reading times, so this test may be useful in capturing impairment of eye movements, such as vestibular/ocular motor impairment and saccadic dysfunction (Gold et al., Reference Gold, Rizzo, Lee, Childs, Hudson, Martone, Matsuzawa, Fraser, Ricker, Dai, Selesnick, Balcer, Galetta and Rucker2021; Legarreta et al., Reference Legarreta, Mummareddy, Yengo-Kahn and Zuckerman2019; Russell-Giller et al., Reference Russell-Giller, Toto, Heitzman, Naematullah and Shumko2018). The demands on functional vision are especially high in sports. Our previous study showed that concussion history reflects an increase in the prevalence of vision deficits, highlighting the need for evaluating athletes’ functional vision routinely to decrease SRC risk (Leinonen et al., Reference Leinonen, Mikkola, Peltonen, Hokkanen and Laitala2024). As a saccadic eye movement test, the K-D might be used preventively to assess functional vision impairment in athletes.
In concussion assessment, post-injury performance can be interpreted by comparing post-injury outcome to either individual baseline performance or normative data. In the absence of individual baseline data, an athlete’s post-injury performance can be compared to normative reference values based on an equivalent study population. Previous studies have established baseline reference values for the K-D test in different sports and age groups, but these studies have been conducted in English (Alsalaheen et al., Reference Alsalaheen, Haines, Yorke and Diebold2016; Moran & Covassin, Reference Moran and Covassin2018). However, mean word lengths vary between different languages (Kalimeri et al., Reference Kalimeri, Constantoudis, Papadimitriou, Karamanos, Diakonos and Papageorgiou2014; Wichmann & Holman, Reference Wichmann and Holman2023), and this includes naturally also numbers. Reading out loud numbers, like in the K-D test, takes different times in different languages, and this affects K-D test outcome times (Dickson et al., Reference Dickson, Waddington, Terwiel and Elkington2019). Also other factors, like gender and age, affect the performance in the K-D test (Elbin et al., Reference Elbin, Schatz, Mohler, Covassin, Herrington and Kontos2021; Heick et al., Reference Heick, Bay, Dompier and Valovich McLeod2016; Moran & Covassin, Reference Moran and Covassin2017). There is a lack of K-D reference values for other languages than English, although this test is widely used also in non-native English-speaking countries. Normative values for adolescent Finnish-speaking populations are presented here. Given the documented age-related variability in K-D performance, age-stratified reference values are necessary to avoid misclassification when evaluating adolescent athletes.
Dyslexia is a neurodevelopmental disorder characterized by unexpected difficulty in reading despite typical cognitive ability and adequate reading opportunities (Shaywitz, Reference Shaywitz1998). In the DSM-5, all three learning disorders (reading, writing, and math) are combined into one diagnosis, Specific Learning Disorder (American Psychiatric Association & Association, 2013). Dysgraphia and/or dyscalculia was not studied here, and therefore we use the term dyslexia instead of Specific Learning Disorder. Several studies have shown that learning disabilities, including dyslexia, may impair performance on assessment methods commonly used in concussion management (Elbin et al., Reference Elbin, Kontos, Kegel, Johnson, Burkhart and Schatz2013; Peltonen et al., Reference Peltonen, Vartiainen, Laitala-Leinonen, Koskinen, Luoto, Pertab and Hokkanen2019; Syrydiuk et al., Reference Syrydiuk, Penner, Sick, Eliason, Galarneau, Leggett, Galea, Schneider and Emery2023; Zuckerman et al., Reference Zuckerman, Lee, Odom, Solomon and Sills2013). As the K-D test measures reading-related skills such as rapid naming, it is reasonable that individuals with learning disabilities have performed worse on the K-D test than healthy controls (Chrisman et al., Reference Chrisman, Harmon, Schmidt, Kaminski, Buckley, Kontos, Clugston, McCrea, McAllister, Broglio and Ortega2019; Mrazik et al., Reference Mrazik, Naidu, Borza, Kobitowich and Shergill2019). When the post-injury K-D performance of a dyslexic athlete is compared to normative reference values, there is a risk for misdiagnosing a concussion. Therefore, separate reference values for the athletes with dyslexia are clinically essential. Including dyslexic athletes as a distinct comparison group allows evaluation of whether post-injury changes differ from both non-concussed controls and athletes with dyslexia, thereby improving clinical interpretability.
Athletes performed better in weekly repeated K-D test trials, and median difference between the initial and best trial was 4.2 sec, indicating a learning effect (Gunasekaran et al., Reference Gunasekaran, Fraser and Hodge2020). In addition, there is always variation and measurement error in test performances, and sometimes this may challenge the interpretation of test results. To help clinical decision making by taking this learning effect and normal variation in the K-D test into consideration, reliable change estimates can be used to provide clinically relevant thresholds for declined performance. Reliable change index (RCI) is a statistical method, which minimizes the learning effect and measurement error by including test-retest reliability and mean change on the analysis (Chelune et al., Reference Chelune, Naugle, Lüders, Sedlak and Awad1993; Jacobson & Truax, Reference Jacobson and Truax1991). RCI helps to determine a clinically significant improvement or decline. It can be used to calculate exact cut-off values which helps in individualized decision making. Some researchers have calculated minimal detectable change (MDC) to evaluate thresholds for smallest clinically significant change (Alsalaheen et al., Reference Alsalaheen, Haines, Yorke and Diebold2016; Heick et al., Reference Heick, Bay, Dompier and Valovich McLeod2016), but this method does not account for learning effect. Reliable change index is particularly useful in small clinical samples, and it has been applied to concussion studies (Elbin et al., Reference Elbin, Schatz, Mohler, Covassin, Herrington and Kontos2021; Iverson et al., Reference Iverson, Lovell and Collins2003; Peltonen et al., Reference Peltonen, Vartiainen, Koskinen, Pertab, Laitala and Hokkanen2021). Furthermore, regression-based change scores are a common method in neuropsychology (Busch et al., Reference Busch, Lineweaver, Ferguson and Haut2015; Heaton et al., Reference Heaton, Temkin, Dikmen, Avitable, Taylor, Marcotte and Grant2001), but they have not been applied to K-D studies. In addition to RCI, we also report regression-based estimates to enhance transparency and clinical utility.
The objective of this study was to find the threshold for a clinically meaningful change in K-D test times in native Finnish-speaking elite adolescent athletes. We also wanted to explore the effect of age and dyslexia and their interaction on functional vision at baseline (preseason) and to establish Finnish reference values for the K-D test in healthy and dyslexic subjects. Our hypothesis is that age and dyslexia status affect test times, and therefore, specific reference values are needed. Additionally, we estimated test-retest reliability and reliable change parameters in healthy adolescent ice hockey athletes who completed two separate baseline assessments on consecutive years. These reliable change parameters were applied to those athletes who obtained a concussion during the course of this follow-up study. This allowed us to assess the sensitivity of the derived RCIs and to compare the formed thresholds with an absolute change in test time.
Methods
Participants and procedure
The data analyzed in this study was collected as a part of the nationwide, three-year concussion follow-up study “Heads in the game,” which included extensive baseline testing (e.g., ImPACT) and a structured program to identify concussions and monitor recovery in male adolescent elite ice hockey athletes in Finland. The athlete’s baseline performance in the K-D test was evaluated with the traditional card test before two consecutive ice hockey seasons. Currently the tablet version of the K-D test has replaced the traditional card version on the market, but either version can be used as a part of multifaceted concussion assessment (Hasanaj et al., Reference Hasanaj, Thawani, Webb, Drattell, Serrano, Nolan, Raynowska, Hudson, Rizzo, Dai, McComb, Goldberg, Rucker, Galetta and Balcer2018; Heick et al., Reference Heick, Edgerton and Raab2020). The K-D test is a rapid number-naming test, which consists of three increasingly difficult test parts. The number of mistakes made in reading out numbers, time spent for each part, and total time are recorded. According to manufacturer’s instructions, making a mistake or increase in test time is considered as a declined result. In our baseline assessment the K-D test was performed twice within a few minutes (K-D1 and K-D2). Self-reported background information was collected as part of the test procedure, including age and dyslexia status (yes/no).
In total 1506 athletes participated in baseline testing. All athletes were evaluated while healthy and without post-concussion syndrome. If the athlete participated in baseline assessments in both seasons, the first baseline assessment was used to analyze the effect of age and dyslexia. In addition, reference values for age and dyslexia groups were provided on the basis of these data. The age of athletes varied between 13 and 20 years. For analysis, athletes were divided into four age groups on the basis of brain maturity and cognitive development (13–14-, 15–16-, 17–18-, and 19–20-year-olds). This grouping reflects well-documented developmental differences in cognitive and oculomotor maturation across adolescence, which influence K-D performance (Galetta et al., Reference Galetta, Liu, Leong, Ventura, Galetta and Balcer2016; Heick et al., Reference Heick, Bay, Dompier and Valovich McLeod2016; Heick et al., Reference Heick, Edgerton and Raab2020). Although individuals mature at different rates, these group-level age effects provide an empirically supported structure for normative comparisons.
Athletes from four elite ice hockey clubs in Southern Finland (total of 570 athletes) were selected for a more intensive follow-up. Most of these athletes (n = 449) participated in the baseline assessment twice one year apart, which enabled us to evaluate the test-retest reliability. Dyslexia (n = 33) was used as an exclusion criterion in the reliable change analysis, because there were no concussed athletes with dyslexia in the study population. Therefore, the population for test-retest and reliable change analysis consisted of 416 healthy athletes.
The medical personnel of the four clubs were instructed to contact the research group in case of a suspected concussion. According to SCAT5 (McCrory et al., Reference McCrory, Meeuwisse, Aubry, Cantu, Dvořák, Echemendia, Engebretsen, Johnston, Kutcher, Raftery, Sills, Benson, Davis, Ellenbogen, Guskiewicz, Herring, Iverson, Jordan, Kissick and Turner2013), a concussion was suspected if the athlete (a) had received a direct blow to the head, face, neck, or elsewhere on the body and (b) showed symptoms (somatic-, cognitive-, and/or emotional), physical signs (e.g. loss of consciousness or amnesia), or behavioral change (e.g. irritability). A total of 55 concussions in 52 athletes were reported during the three studied ice hockey seasons. These athletes were invited to participate in a follow-up at day 3 post injury, after which they were followed by the research group until asymptomatic. A total of 28 athletes were assessed post injury with the K-D test, and their results were compared to their own baseline performance. In our study, the clinically significant changes were evaluated using RCI and regression-based change scores. Including both methods allow readers to evaluate change using complementary statistical approaches that account for measurement error, practice effects, and baseline performance.
Statistical analysis
IBM SPSS software version 29.0 (IBM Corp., Armonk, USA) was used in the data analysis. Significance levels were set at p < 0.05. The normality of main variables was checked with Q-Q-plot, histogram, skewness, kurtosis, and Kolmogorov-Smirnov-test. The effects of age and dyslexia were studied with two-way analysis of variance (two-way ANOVA) with post hoc Tukey’s. The changes in baseline K-D times between trials and between test and retest were studied using paired sample t-test. Effect sizes for the above-mentioned tests are shown as Cohen’s d or partial eta squared. Test–retest correlations were analyzed using intraclass correlation and Pearson’s correlation test.
Reliable change
RCI takes the reliability of the test into account, and it evaluates the clinically significant change, not only the statistically significant change. There are several ways to calculate RCIs (Chelune et al., Reference Chelune, Naugle, Lüders, Sedlak and Awad1993; Iverson, Reference Iverson2001; Jacobson & Truax, Reference Jacobson and Truax1991). In this study, we used formula $S_{diff}=\sqrt{{SEM_{1}}^{2}+{SEM_{2}}^{2}}$
(Square root of the sum of the squared SEMs for each testing occasion) that calculates the SEMs for baseline and retest (Iverson, Reference Iverson2001; Iverson et al., Reference Iverson, Lovell and Collins2003). The adjustment for mean change was made to take into account learning effect between test times (Chelune et al., Reference Chelune, Naugle, Lüders, Sedlak and Awad1993). The formula for RCI analysis was
$S_{diff}=\sqrt{{SEM_{1}}^{2}+{SEM_{2}}^{2}}$
(Square root of the sum of the squared SEMs for each testing occasion) that calculates the SEMs for baseline and retest (Iverson, Reference Iverson2001; Iverson et al., Reference Iverson, Lovell and Collins2003). The adjustment for mean change was made to take into account learning effect between test times (Chelune et al., Reference Chelune, Naugle, Lüders, Sedlak and Awad1993). The formula for RCI analysis was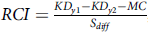 $RCI={KD_{y1}-KD_{y2}-MC \over S_{diff}}$
, where KD
y1=first year K-D, KD
y2=second year and MC=mean change in K-D in the sample of healthy athletes tested one year apart. The S
diff
is multiplied by z-scores to form 80% (z = 1.282) and 90% (z = 1.645) confidence intervals for possible measurement error. In addition, mean change needs to be considered in the calculation of thresholds for reliably declined or improved performance when there is a significant test-retest difference score (Iverson & Green, Reference Iverson and Green2001). Therefore, the thresholds for reliable changes in our sample were adjusted upward to account for mean change. Both 80% and 90% confidence intervals were shown and the percentage of individuals with reliable improvement or decline were analyzed in both healthy controls and concussed athletes. Confidence interval of 80% was used in calculating the odds ratio in the concussed athlete group.
$RCI={KD_{y1}-KD_{y2}-MC \over S_{diff}}$
, where KD
y1=first year K-D, KD
y2=second year and MC=mean change in K-D in the sample of healthy athletes tested one year apart. The S
diff
is multiplied by z-scores to form 80% (z = 1.282) and 90% (z = 1.645) confidence intervals for possible measurement error. In addition, mean change needs to be considered in the calculation of thresholds for reliably declined or improved performance when there is a significant test-retest difference score (Iverson & Green, Reference Iverson and Green2001). Therefore, the thresholds for reliable changes in our sample were adjusted upward to account for mean change. Both 80% and 90% confidence intervals were shown and the percentage of individuals with reliable improvement or decline were analyzed in both healthy controls and concussed athletes. Confidence interval of 80% was used in calculating the odds ratio in the concussed athlete group.
Regression-based change score
In addition to RCIs, regression-based equations were used to predict year 2 K-D results using the baseline test score and baseline age. The predicted values were compared to actual year 2 results or post-concussion results, which enabled the calculation of z-values (difference between predicted and actual score divided by standard error of estimate) (Busch et al., Reference Busch, Lineweaver, Ferguson and Haut2015). Based on these z-values, the athletes were classified as reliably declined or improved. In contrast to RCI, regression-based change score may account for baseline performance, regression to mean, and demographic factors. However, it does not provide exact cut-off scores (in seconds), as the z-values need to be calculated in more complicated manner. Predictive accuracy for both RCI and regression-based models are similar (Heaton et al., Reference Heaton, Temkin, Dikmen, Avitable, Taylor, Marcotte and Grant2001; Temkin et al., Reference Temkin, Heaton, Grant and Dikmen1999). Cut-off values provided by RCI are more convenient in sideline assessments, and therefore, in this study, we decided to focus mainly on RCIs. Full regression model specifications and coefficients are provided in the Supplementary Materials to allow independent evaluation or implementation.
Ethical considerations
This study was approved by the HUS Ethical Committee (Helsinki, Finland). Each participant and, if the athlete was younger than 16 years of age, a parent/guardian signed a voluntary informed consent. The study was conducted according to the Declaration of Helsinki.
Results
In total 1506 male athletes (aged 13–20 years) participated in preseason baseline assessments before the ice hockey seasons. Of these, 95 athletes reported having a dyslexia diagnosis. First, the difference between two consecutive K-D test trials, performed a few minutes apart, was explored to examine the learning effects within the baseline test. Paired t-test revealed that the athletes were statistically significantly faster in the second K-D trial (K-D2, M = 47.76, SD = 8.59), as compared to the first K-D trial (K-D1, M = 49.23, SD = 8.69); [t(1467) = 16.316, p < 0.001, CI95% 1.29–1.65, Cohen’s d = 0.426]. Therefore, results for both trials, K-D1 and K-D2, are reported separately.
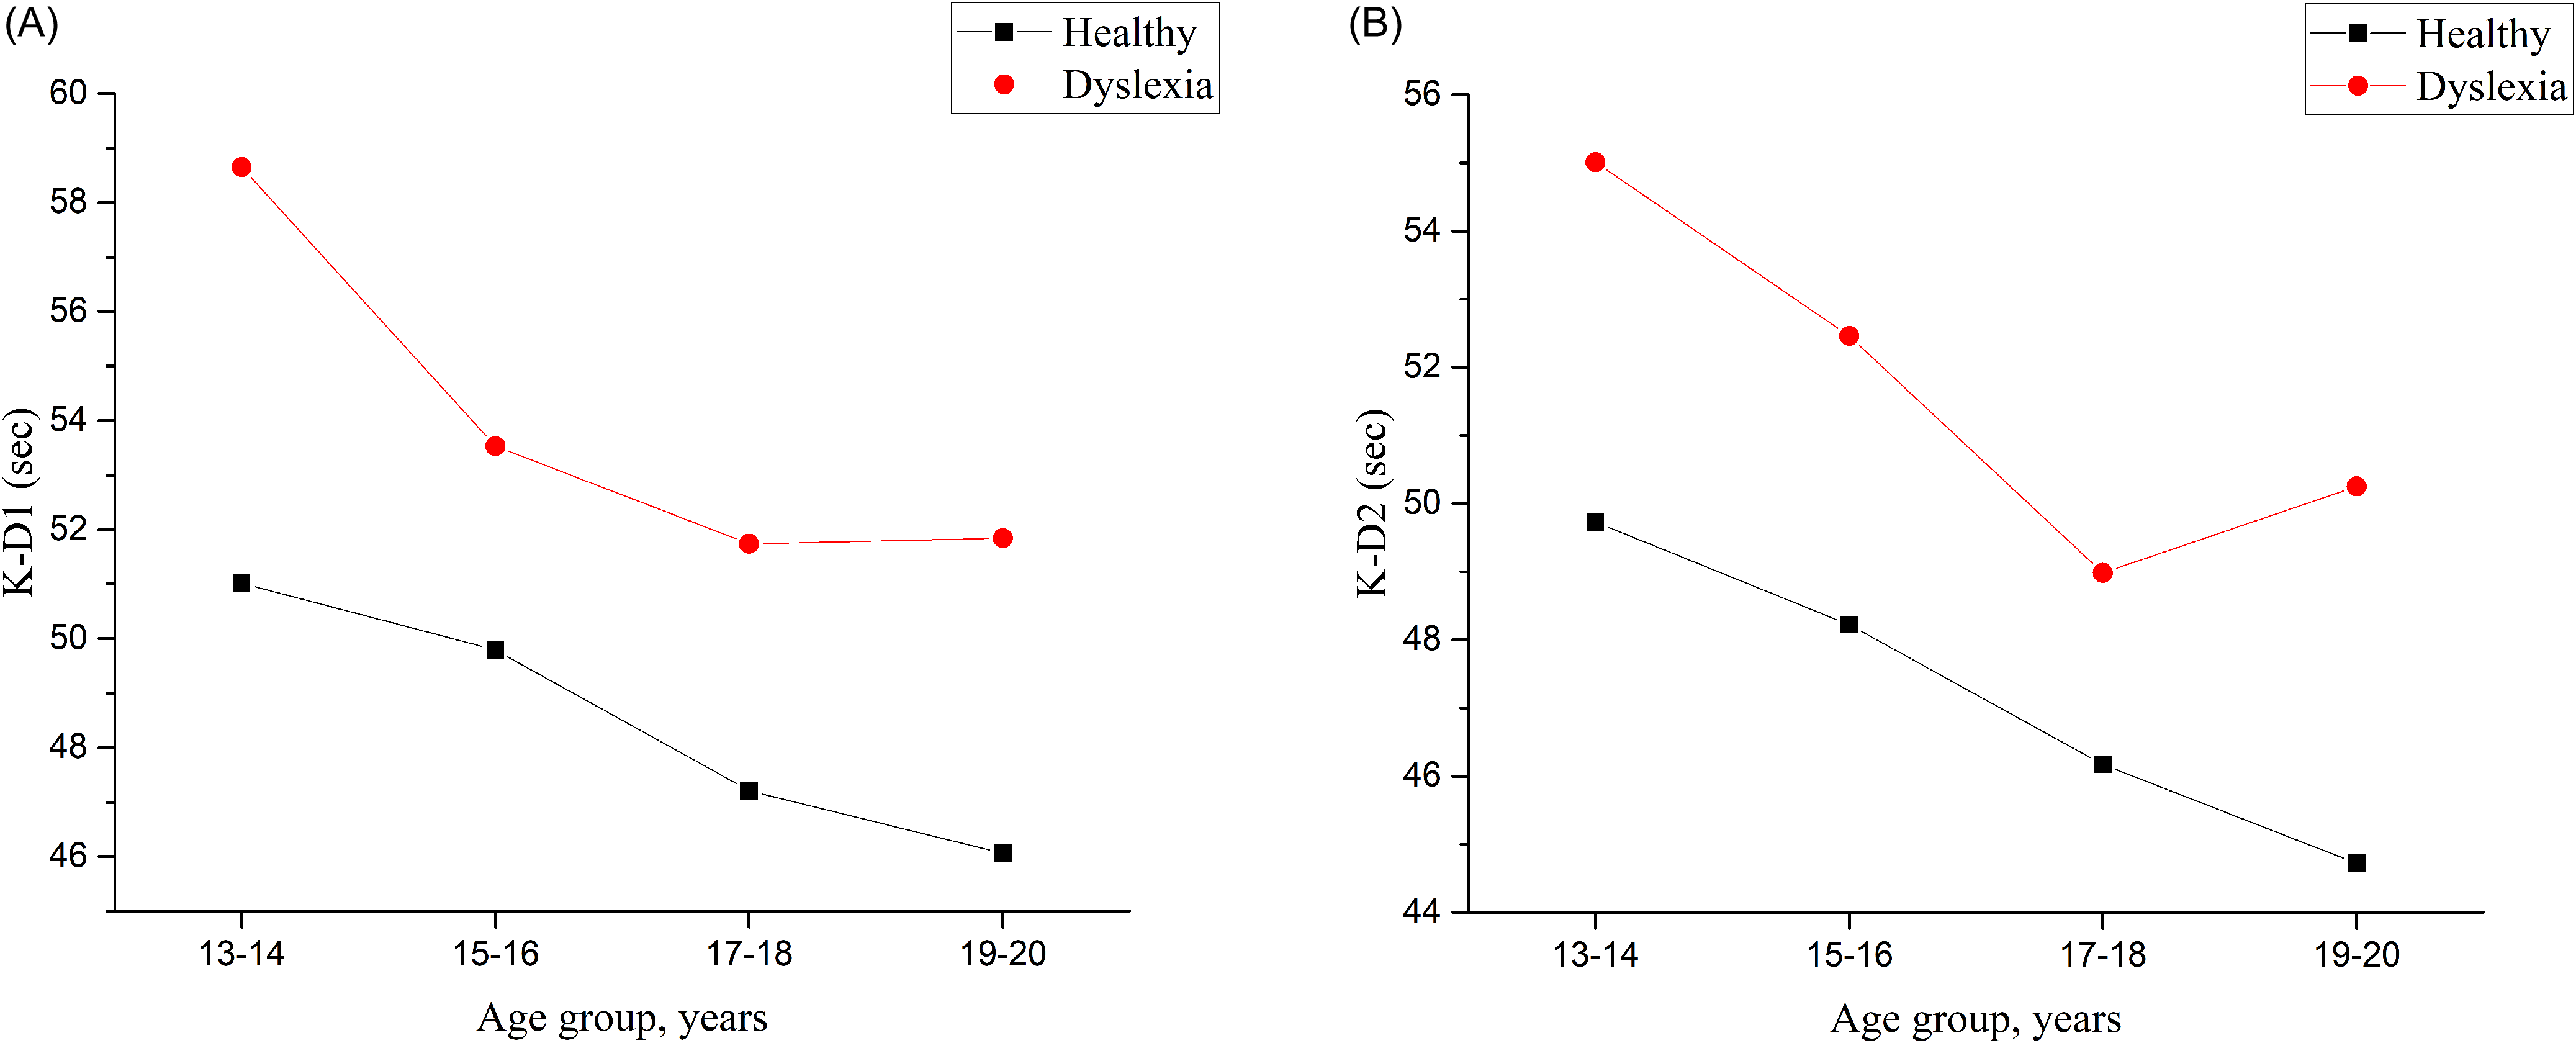
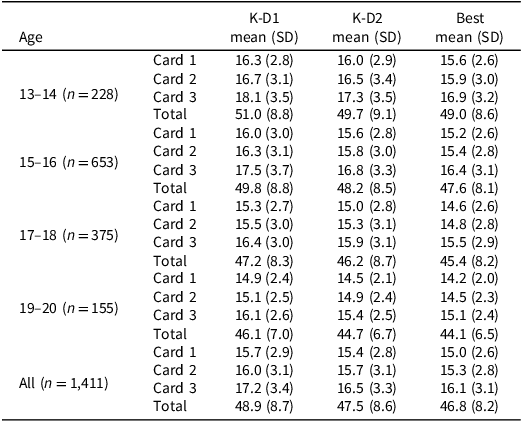
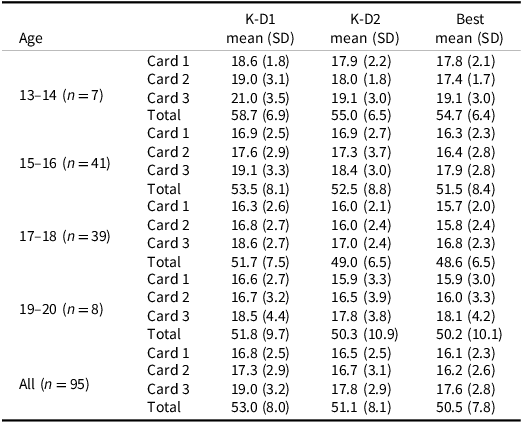
The effects of age and dyslexia were studied with a two-way analysis of variance. Based on these analyses, statistically significant models were formed for K-D1 (F7,1506 = 11.321, p < 0.001, η2 p = 0.050) and K-D2 (F7,1463 = 9.496, p < 0.001, η2 p = 0.044) test performance. Older athletes were faster in both K-D1 (Figure 1A) and K-D2 (Figure 1B). The difference was statistically significant between the two youngest (13–14 and 15–16) and the two oldest (17–18 and 19–20) age groups (p < 0.001). In addition, the athletes with dyslexia were slower than the healthy controls on both K-D1 (Figure 1A) and K-D2 (Figure 1B). We found no interaction between dyslexia and age in K-D1 (F3,1506 = 0.472, p = 0.702, η2 p = 0.001) or K-D2 (F3,1463 = 0.356, p = 0.785, η2 p = 0.001). These findings support the need for age-stratified and dyslexia-specific reference values, which are presented in Tables 1 and 2.
Mean time in the King-Devick test by age groups and dyslexia status for the first (A) and second trial (B) of the preseason baseline assessment. K-D1 = first trial, K-D2 = second trial. The effects of age [K-D1 (F3,1506 = 4.217, p = 0.006, η2 p = 0.008); K-D2 (F3,1463 = 4.293, p = 0.005, η2 p = 0.009)] and dyslexia [K-D1 (F1,1506 = 19.644, p < 0.001, η2 p = 0.013); K-D2 (F1,1463 = 12.804, p < 0.001, η2 p = 0.009)] were statistically significant in both trials. Partial eta squared (η2 p): 0.01 = small, 0.06 = medium, 0.14 = large effect.

Figure 1. Long description
The image consists of two line graphs labeled (A) and (B). Graph (A) shows the mean time in seconds for the first trial (K-D1) of the King-Devick test across different age groups (13-14, 15-16, 17-18, 19-20 years) for individuals with and without dyslexia. The data series for healthy individuals is represented by black squares connected by a black line, while the data series for individuals with dyslexia is represented by red circles connected by a red line. Graph (B) shows the mean time in seconds for the second trial (K-D2) of the King-Devick test across the same age groups and dyslexia status. The trends indicate that both age and dyslexia status have statistically significant effects on the test performance in both trials.
King-Devick test normative values for Finnish adolescent ice hockey players without dyslexia

Table 1. Long description
The table presents King-Devick test normative values for Finnish adolescent ice hockey players without dyslexia, organized by age groups and test cards. It includes mean scores and standard deviations for K-D1 and K-D2 tests across different age groups: 13-14, 15-16, 17-18, and 19-20 years. The table has four columns: Age, K-D1 mean (SD), K-D2 mean (SD), and Best mean (SD). Each age group is further divided into three cards, with corresponding mean scores and standard deviations. The total scores for each age group and test are also provided. Notable trends include higher scores with increasing age and differences in performance between the tests.
King-Devick test normative values for Finnish adolescent ice hockey players with dyslexia

Table 2. Long description
The table presents King-Devick test normative values for Finnish adolescent ice hockey players with dyslexia, organized by age groups and test types. It includes mean scores and standard deviations for K-D1, K-D2, and Best across different age groups: 13-14, 15-16, 17-18, and 19-20. The table has 10 rows and 10 columns, with headers for age groups, test types, and total scores. Notable trends include older athletes performing faster in both K-D1 and K-D2 tests, with statistically significant differences between the youngest and oldest age groups. Athletes with dyslexia show slower performance compared to healthy controls. The data supports the need for age-stratified and dyslexia-specific reference values.
In total 416 healthy and 33 athletes with dyslexia participated in baseline testing during two consecutive ice hockey seasons. The age, K-D scores or number of athletes with dyslexia did not differ between the athletes attending follow-up and the 1506 athletes tested only once. The outcome time in the K-D test was significantly faster in the test performed at baseline in season 2 both for healthy (Table 3) and athletes with dyslexia (Supplementary table 1). Mean change for the healthy athletes was 2.4 sec (SD = 5.3) for K-D1 and 3.0 sec (SD = 4.9) for K-D2. There was a high degree of reliability between test and retest measurements in the consecutive tests both in K-D1 (Interclass Correlation Coefficient (ICC) = 0.78, Confidence Interval (CI) 95% 0.74–0.82, F414,414 = 8.26, p < 0.001) and K-D2 (ICC = 0.826, CI95% 0.79–0.86, F382,282 = 10.49, p < 0.001). Pearson r correlations did not significantly differ from ICC. These test-retest values were used to calculate SEM1, SEM2, and Sdiff, which were eventually used to calculate RCIs, shown in Table 3. In this study population, the clinically significant change without adjusting for learning effects was 6.8 sec in K-D1 and 6.3 sec in K-D2 (CI 80%). When the learning effect was considered by adjusting the thresholds with mean change, the threshold for reliable decline was 4.4 and 9.1 sec for reliable improvement (CI 80%). These adjusted thresholds reflect expected learning effects in healthy adolescents and provide more accurate criteria for identifying meaningful individual change.
King-Devick test mean time and RCIs in two assessments performed one year apart

Table 3. Long description
The table presents data on the King-Devick test mean time and reliable change indices (RCIs) for two assessments conducted one year apart. It includes mean scores, standard deviations, p-values, Pearson’s r correlations, standard error of measurement (SEM), and confidence intervals. The table has four rows and nine columns, with headers such as Mean (SD), p, Pearson’s r, SEM1, SEM2, Sdiff, and Confidence intervals. Row 1 provides overall statistics with a mean of 0.80 and a confidence interval of 0.90. Row 2 details K-D1 scores for Year 1 and Year 2, showing a mean of 46.25 and 48.61 respectively, with a significant p-value of less than 0.001. Row 3 presents K-D2 scores for Year 1 and Year 2, with means of 47.52 and 44.52 respectively, and a significant p-value of less than 0.001. Row 4 summarizes the overall data with a p-value of less than 0.001, a Pearson’s r of 0.83, and various SEM and Sdiff values. The table highlights the reliability and significant changes in test performance over the two years.
The RCI values were used to classify the athletes as reliably improved or impaired both in the healthy and concussed groups (Figure 2). During the follow up, 28 athletes sustained a concussion and attended post-injury assessment with the K-D test at day 3 post injury (range 2–4 days, mean 3.24 days). The mean time from the baseline assessment was 25 weeks (SD = 10.6, range 1–39 weeks). The mean post-injury test time was 47.36 sec in K-D1 (SD = 10.67, range 30.56–86.94) and 45.95 sec in K-D2 (SD = 10.89, range 30.54–82.01). In comparison, the mean baseline test time in the concussed group was 45.02 sec in K-D1 (SD = 5.67, range 34.73–57.20) and 44.56 sec (SD = 7.07, range 32.96–58.80). When post-injury results were compared to these individual baseline times, 54% of the athletes were slower after SRC. Using RCIs derived from the healthy controls, 6 of 28 concussed athletes (21.4%) with a CI of 80% (Figure 2A) and 4 of 28 concussed athletes (14.3%) with CI of 90% (Figure 2B) were significantly slower in the K-D test and none of the athletes were reliably faster in post-injury assessment (Figure 2). Two concussed athletes made at least one mistake during testing in K-D1. When these mistakes were evaluated along with either absolute or reliable change, the percentage of athletes in the absolute change group remained unchanged (54%), while one athlete was added to the reliable change group. Thus, 7 of 28 concussed athletes (25.0%) were determined as declined in the post SRC test (CI 80%). In comparison, only 32 of 415 healthy athletes (7.7%) were significantly slower in the K-D test one year later (CI 80%). The calculation of odds ratio using RCIs (CI 80%) revealed that the risk to be reliably slower in the K-D test 3 days post SRC is 3.3-fold compared to these healthy controls (OR = 3.3, 95% CI = 1.2–8.6, p = 0.017).
Percentages of healthy (n = 416) and concussed athletes (n = 28) that would be classified as reliably faster or slower, in the K-D test, based on the 0.80 (A) and 0.90 (B) confidence intervals.

Figure 2. Long description
The bar graph compares the percentage of healthy and concussed athletes classified as reliably faster or slower in the K-D test based on the 0.80 and 0.90 confidence intervals. The x-axis represents the groups: healthy and concussed athletes, with subcategories K-D1 and K-D2. The y-axis represents the percentage of athletes. The graph uses two colors: light gray for faster and dark gray for slower. For the 0.80 confidence interval, healthy athletes show approximately 9.4 percentage for K-D1 faster, 7.7 percentage for K-D1 slower, 9.1 percentage for K-D2 faster, and 9.4 percentage for K-D2 slower. Concussed athletes show 21.4 percentage for K-D1 slower and 22.2 percentage for K-D2 slower. For the 0.90 confidence interval, healthy athletes show approximately 5.1 percentage for K-D1 faster, 3.6 percentage for K-D1 slower, 4.6 percentage for K-D2 faster, and 4.4 percentage for K-D2 slower. Concussed athletes show 14.3 percentage for K-D1 slower and 18.5 percentage for K-D2 slower. All values are approximated.
The RCIs derived from the healthy were implemented to athletes with dyslexia attending to two baseline assessments one year apart (Supplementary table 1). There was no increased risk to be reliably slower in the latter assessment when comparing to healthy (Supplementary Table 1). Additionally, regression-based change scores were calculated (Supplementary table 2). The analysis revealed that the results remained practically unchanged when comparing to RCIs (Supplementary table 3). Based on this regression-based model, the odds ratio for reliably slower K-D test after concussion was 4.4-fold compared to healthy controls (Supplementary table 3). Including regression-based change scores provide a complementary method that accounts for baseline performance and age, and the similarity of results across methods strengthens confidence in the observed post-injury changes. Furthermore, RCIs were calculated for dyslexic athletes and different age groups (Supplementary table 4).
Discussion
Functional vision plays an important role in sports as vision affects both sport performance and injury risk. Vision is neurally suppressed during saccadic eye movements to prevent visual blur, so from an injury prevention perspective, assessing the athlete’s functional vision could be an effective way to identify those athletes that are at a higher injury risk because of oculomotor dysfunction. K-D-test, a short pseudo-reading test, is often used in SRC evaluation. In this study, we aimed to find a clinically useful threshold for meaningful change in K-D, which could be used both in baseline and after SRC for screening for functional vision impairment. We also studied the effects of age and dyslexia status on K-D test performance. For these purposes, elite male adolescent athletes were evaluated with the K-D test during two consecutive seasons and the athletes sustaining concussion were tested post injury. Age and dyslexia status were found to affect baseline reading times in the K-D test. The analysis showed that athletes with dyslexia were slower in K-D as compared to non-dyslexic athletes. Also, younger athletes were slower in K-D as compared to older athletes, and therefore we formed the reference values separately in age groups for dyslexic and non-dyslexic individuals. The K-D test showed a high degree of reliability between test-retest baseline measurements when performed on two consecutive years. The reliable change parameters that were obtained from these baseline data were then applied to those athletes who obtained a SRC during this follow-up study. The post-SRC evaluation by K-D was performed on day 3 after the injury. This analysis revealed a 3.3-fold risk to show a slower performance in the post-injury K-D test, as compared to healthy controls. No athletes were classified as reliably improved, which is expected when concussion shifts the post-injury score distribution downward relative to baseline.
In our study, the mean reading time in the baseline K-D test varied in trials between 47.8 and 49.2 sec. In comparison to earlier published data, our measured performance times in Finnish were slower than in native English-speaking individuals, where the mean reading time was 44.55 sec (Elbin et al., Reference Elbin, Schatz, Mohler, Covassin, Herrington and Kontos2021). The native language of the studied individuals therefore seems to be one explaining factor for a slower reading time in our study group. Finnish words for numbers are longer than English, and thus it takes more time to accomplish the test because numbers are read out loud. For example, the mean word length in Finnish is 7.66 letters and in English it is 4.86 letters (Kalimeri et al., Reference Kalimeri, Constantoudis, Papadimitriou, Karamanos, Diakonos and Papageorgiou2014). This difference between Finnish and English, when used as the test language, highlights the need for language-specific normative values. It may also be possible that baseline performance in the K-D test varies between different sports, although such evidence remains to be published.
Multiple previous studies have shown that older adolescents are faster in the K-D test (Elbin et al., Reference Elbin, Schatz, Mohler, Covassin, Herrington and Kontos2021; Heick et al., Reference Heick, Bay, Dompier and Valovich McLeod2016; Weise et al., Reference Weise, Swanson, Penix, Hale and Ferguson2017) and such a difference was observed also here, even though the effect size was small. We observed previously a similar difference in another widely used concussion assessment tool, ImPACT, where reaction times and visual motor speed were faster in older athletes (Peltonen et al., Reference Peltonen, Vartiainen, Laitala-Leinonen, Koskinen, Luoto, Pertab and Hokkanen2019). Cognitive processes like processing speed, voluntary response suppression and working memory reach adult-type maturity in adolescence (Luna et al., Reference Luna, Garver, Urban, Lazar and Sweeney2004), so multiple factors may explain the faster performance in older individuals. Although the maximal acceleration of structural and functional maturation of the brain occurs before puberty in a posterior-to-anterior direction, development of neural functions continue through adolescence and into early adulthood (Gerván et al., Reference Gerván, Soltész, Filep, Berencsi and Kovács2017). These developmental effects further support the use of age-specific reference values and annual baseline testing in adolescent populations. Thus, from the clinical perspective, it is utmost important to repeat the baseline measurements each year (Galetta et al., Reference Galetta, Liu, Leong, Ventura, Galetta and Balcer2016).
The K-D test was originally developed to assess dyslexia or impaired saccadic eye movements in children. The test has later been applied to concussion evaluation (Legarreta et al., Reference Legarreta, Mummareddy, Yengo-Kahn and Zuckerman2019). Consequently, it is well-known that individuals with dyslexia are slower in this test than their non-dyslexic controls. There are to date only a few studies in sports medicine that have explored the effect of dyslexia on baseline reading times in the K-D test. In a cohort of professional football players, dyslexic athletes were 6.9 sec slower than non-dyslexic (Mrazik et al., Reference Mrazik, Naidu, Borza, Kobitowich and Shergill2019). In a large student-athlete study reading times for the dyslexic athletes were 3.3 sec slower than for the non-dyslexic athletes (Chrisman et al., Reference Chrisman, Harmon, Schmidt, Kaminski, Buckley, Kontos, Clugston, McCrea, McAllister, Broglio and Ortega2019). Like in the previous studies that were performed in English, in this study performed in Finnish, the effect of dyslexia was clear and the effect size was small. Our results are consistent with the fact that the K-D test measures rapid number naming, which has been shown to be impaired in dyslexia (Araújo & Faísca, Reference Araújo and Faísca2019). Other contributing factors may be the differences in saccadic function between athletes with and without dyslexia. Some studies have shown that dyslexic children have abnormal and inefficient saccades (Lukasova et al., Reference Lukasova, Silva and Macedo2016; Seassau et al., Reference Seassau, Gérard, Bui-Quoc and Bucci2014), which may lead to a decreased performance on the K-D test. Our findings further emphasize the need for separate normative values for athletes with dyslexia. To avoid SRC misdiagnosis, the dyslexia status of an athlete should therefore always be determined, preferably already at baseline before start of the competition season. In this study the athletes self-reported their dyslexia status, as they were asked whether they have a dyslexia diagnosis or not. It was not possible in this study to obtain a definite confirmation concerning dyslexia diagnosis from the athlete’s medical records. It is thus possible that some individuals refused to disclose dyslexia, which resulted in statistically less stringent outcomes in our analysis.
The RCIs for the K-D test published thus far, obtained from a native English-speaking athlete population, showed reliable change times of 11.44 (CI 90%) and 13.67 (CI 95%) sec (Elbin et al., Reference Elbin, Schatz, Mohler, Covassin, Herrington and Kontos2021). When comparing to the RCIs we describe here (CI 80% 4.4/9.1 sec, CI 90% 6.3/11.1 sec), the previously reported limit values are much higher. This may be explained by the improved test-retest reliability of the current study, longer evaluation time after initial injury, longer period between test and retest, and by our use of lower confidence intervals. Additionally, our thresholds were adjusted for mean change and therefore reliable change times were different for decline (4.4 or 6.3 sec) and improvement (9.1 or 11.1 sec). When researchers calculated minimal detectable change for the K-D test and adolescent athletes, MDC has been between 6.10 and 10.2 sec (Alsalaheen et al., Reference Alsalaheen, Haines, Yorke and Diebold2016; Elbin et al., Reference Elbin, Schatz, Mohler, Covassin, Herrington and Kontos2021; Heick et al., Reference Heick, Bay, Dompier and Valovich McLeod2016). Mean detectable change does not, however, take into account test-retest reliability, and therefore the RCI used in our study presents a more reliable tool for evaluating the clinically significant change after SRC. Another reliable way of interpreting the K-D test results is using regression-based models, which are also presented in this study. Regression-based change scores incorporate baseline performance and age, and their close agreement with RCI findings strengthens confidence in the robustness of the observed post-injury changes.
A meta-analysis and systematic review by Galetta and others showed that the K-D test has a high degree of sensitivity (86%) and specificity (90%) in the sideline assessment of concussion (Galetta et al., Reference Galetta, Liu, Leong, Ventura, Galetta and Balcer2016). However, some studies have found much lower values for sensitivity and specificity among professional ice hockey athletes (Echemendia et al., Reference Echemendia, Thelen, Meeuwisse, Comper, Hutchison, Rizos and Bruce2022), Canadian football league athletes (Naidu et al., Reference Naidu, Borza, Kobitowich and Mrazik2018), and Rugby Union athletes (Molloy et al., Reference Molloy, Murphy and Gissane2017). It has also been reported that the diagnostic accuracy of the K-D test is acceptable only at the 0-to 6-hour and 24-to 48-hour post-concussion time points (Le et al., Reference Le, Ortega, Chrisman, Kontos, Buckley, Kaminski, Meyer, Clugston, Goldman, McAllister, McCrea, Broglio and Schmidt2023). In this study, when the concussed athletes were evaluated on day 3 after SRC, they were slower in the K-D test (absolute change 54%, reliable change 25.0%). Thus, at this time point, the sensitivity of the K-D test in detecting concussions remained relatively low. None of the athletes were classified as improved, which is expected after SRC. This suggests that concussion disturbs normal performance in K-D test although within 3 days, many of the athletes may have recovered from saccadic dysfunctions that are evaluated by the K-D. Such recovery has also been observed in individuals that were evaluated approximately 8 days post injury (Galetta et al., Reference Galetta, Liu, Leong, Ventura, Galetta and Balcer2016). Furthermore, not all athletes suffer from visual symptoms after SRC (Lumba-Brown et al., Reference Lumba-Brown, Teramoto, Bloom, Brody, Chesnutt, Clugston, Collins, Gioia, Kontos, Lal, Sills and Ghajar2020; Master et al., Reference Master, Scheiman, Gallaway, Goodman, Robinson, Master and Grady2016). According to these results, the K-D should not be used as a standalone tool for the evaluation of SRC. Instead, together with our Functional Vision Questionnaire (Leinonen et al., Reference Leinonen, Mikkola, Peltonen, Hokkanen and Laitala2024), it may act as a feasible screening tool to identify those athletes who have impaired functional vision. When assessed at baseline, the observed impairments can be addressed in a preventive manner. After a SRC, these tools allow for detection of those athletes that exhibit persistent oculomotor problems that often lead to prolonged symptoms and delayed recovery from SRC. There are also other functional tools to evaluate visual functions, like Vestibular Ocular Motor Screening and focus-of-attention maintenance. For athletes especially in rapid contact sports, the precise functions of the visual system are mandatory, and after a SRC individualized treatment and follow-up plans should be implemented to increase the possibilities for a rapid and full recovery from SRC.
Our study is not without limitations. Dyslexia diagnosis was self-reported; the question asked from the athletes was: do you have a dyslexia diagnosis? In such an elite athlete population the individuals more likely declined to report their dyslexia than made up a learning disorder diagnosis, so confirming the diagnoses from the athlete´s medical records might have altered the number of diagnoses a bit. Although all athletes were evaluated while healthy and without post-concussion syndrome, we could not confirm that our healthy athletes did have other diagnosis than dyslexia (e.g., anxiety, depression). Baseline testing was carried out on seasons 1 and 2, one year apart, so age-related / cognitive improvement between assessments also occurred. Thus, the improvements in K-D test we observed between the baseline test from season 1 to season 2 were not only due to learning effects but multifactorial. The RCI methodology used here is based on a “one size fits all”-principle, as it does not include individual baseline performance in the analysis. However, when we evaluated the data using a regression-based method (Supplementary tables 2 and 3), the results remained similar. The biggest strength of this study was the test population: Finnish elite junior ice hockey teams nationwide attended the K-D baseline assessment, which provided us with a large and homogeneous study population. Normative reference values and reliable change values created in this study help clinical professionals to recognize impaired performances in the K-D test both in baseline measurements and after SRC. The results presented here strongly suggest that the clinically relevant use of the K-D test requires language-specific normative values. Combining the K-D test that addresses saccadic eye movements with our Functional Vision Questionnaire (Leinonen et al., Reference Leinonen, Mikkola, Peltonen, Hokkanen and Laitala2024) could provide cost-efficient and clinically relevant evaluation of functional sports vision. A slower performance in K-D and/or positive replies in the Functional Vision Questionnaire by a healthy athlete would most probably be signs for an underlying vision problem, which should be addressed before it results in impaired sport performance or increased injury risk, or both. The RCIs provided in this study help to clinically interpret K-D results in non-native English-speaking athlete populations. Because native language, age, and dyslexia affect reading times in the K-D test, these factors should be taken into consideration when comparing outcome times to reference values during both baseline and post-SRC screening.
Supplementary material
The supplementary material for this article can be found at https://doi.org/10.1017/S1355617726102094.
Funding statement
This study was funded by the Ministry of Social Affairs and Health Finland, Academy of Finland and Turku Finnish University Foundation.
Competing interests
The authors declare no conflict of interests.



 Open access

