

Pulses are the edible seeds of legumes or pod-bearing plants and include beans, chickpeas, yellow peas and lentils. Regular consumption of pulses (half cup per d) has been related to higher-quality diets, including higher intakes of fibre, protein, folate, Zn, Fe and Mg, and lower intakes of saturated fat and total fat(Reference Mitchell, Lawrence and Hartman1). Bean consumption is also associated in epidemiological studies with reduced body weight, waist circumference and risk of overweight and obesity(Reference Papanikolaou and Fulgoni2).
Currently, the world is experiencing an obesity epidemic and a rapid increase in prevalence of chronic diseases such as type 2 diabetes. Overweight and obesity characteristically result when energy intake exceeds energy expenditure. One potential countermeasure to the current obesity epidemic is to identify and recommend foods that reduce energy intake by inducing satiation and increasing satiety. Satiation and satiety are complementary events related to the sensation of fullness, but differ in timing and outcome. Satiation is the termination of food intake (FI) during a meal due to fullness(Reference Gerstein, Woodward-Lopez and Evans3). Thus, satiation can reduce hunger and limit energy intake at that meal(Reference Blundell, Lawton and Cotton4). Satiety is a postprandial sensation of fullness that can delay the onset and/or reduce energy intake of a second meal(Reference Blundell, Lawton and Cotton4). Consequently, identifying foods that are satiating (eat less at that meal) and prolong satiety (extend the time to the next meal and reduce FI at that next meal) would be beneficial in the prevention and treatment of obesity.
Pulses are possible foods that could be used in dietary strategies for the control of body weight as well as blood glucose (BG). Short-term studies have shown that pulses, when consumed alone, are high satiety(Reference Wong, Mollard and Zafar5) low glycaemic(Reference Wong, Mollard and Zafar5–Reference Nestel, Cehun and Chronopoulos7) foods that have the ability to lower the BG response to a later meal(Reference Jenkins, Wolever and Taylor8). This effect on postprandial BG following a later meal has been termed the ‘second meal effect’(Reference Wolever, Jenkins and Ocana9).
Pulses are commonly consumed with high-carbohydrate foods such as pasta, rice and bread, and eaten to satiation (until full). However, it is unclear whether the incorporation of pulses into a high-carbohydrate meal affects how much is eaten at that meal (satiation). It is also unknown how consuming a pulse meal to satiation would affect FI at a subsequent meal, as well as the first and second meal effects of pulses on appetite and BG. It was hypothesised that pulses would reduce FI at the treatment meal and at the later meal, while maintaining their first and second meal effects on appetite and BG. Therefore, the objective of this study was to examine the effects of ad libitum pulse meals (lentils, navy beans, chickpeas and yellow peas) compared to a non-pulse meal on treatment meal FI (satiation), FI at a second ad libitum pizza meal, as well as appetite (satiety) and BG responses following both meals.
Methods
Subjects
Healthy males aged 20–30 years with a BMI of 20–24·9 kg/m2 were recruited through advertisements around the University of Toronto (Toronto, ON, Canada) campus. Females, smokers, breakfast skippers, individuals with diabetes or other metabolic diseases and those scoring ≥ 11 on an Eating Habit Questionnaire(Reference Velangi, Fernandes and Wolever10) were excluded from the study. A total of twenty-seven subjects began the study and twenty-four completed all sessions. In all, three subjects did not complete all five sessions because of reasons unrelated to the study. A sample size of twenty-six was determined by a power analysis for a within-subject design from previous studies(Reference Wong, Mollard and Zafar5, Reference Hamedani, Akhavan and Samra11) to be sufficient to detect a treatment effect on FI of 628·0 kJ, with a power of 0·80 and an α of < 0·05. This study was conducted according to the guidelines laid down in the Declaration of Helsinki, and all procedures involving human subjects were approved by the University of Toronto Health Sciences Research Ethics Board. Written informed consent was obtained from all subjects.
Study design
A within-subject, balanced, repeated-measures design was followed in which subjects received four treatments or control over 5 weeks, approximately 1 week apart. The pulse treatments contained: (1) chickpeas (Primo, Toronto, ON, Canada); (2) lentils (Primo); (3) navy beans/haricot beans (Ferma, Toronto, ON, Canada); or (4) yellow peas (Nupak, Toronto, ON, Canada). The pulse treatments and control were made the day before the session and the recipe was calculated to provide 6280·2 kJ at each session. All meals had the same energy density (approximately 322·4 kJ/100 g) to control for differences in FI due to variations in energy or weight among treatments. Energy derived from pulses was consistent among all pulse treatments (44 %). The pulse treatments and control all contained macaroni pasta and homemade tomato sauce. To account for the energy from pulses, the control contained more pasta (138·0 v. 323·4 g per 6280·2 kJ portion; Kraft Canada, Inc., Donmills, ON, Canada). The tomato sauce was made on the premises and contained diced tomatoes (433·9 g, no salt added, President's Choice, Loblaws, Toronto, ON, Canada), parmesan cheese (33·3 g, La Lila, Silani Brand, Schomberg, ON, Canada), garlic (5·4 g), onion (119·7 g), chili powder (3·0 g, Selection, Metro, Toronto, ON, Canada), salt (4·28–8·17 g; Sifto Canada, Inc., Mississauga, ON, Canada) and rapeseed oil (11·4 g, Canola Harvest, Richardson Oilseed Limited, Lethbridge, AB, Canada) per 6280·2 kJ portion. Garlic and onions were bought fresh from a local supermarket. The tomato sauce was prepared as follows. Onions and garlic were cooked for 3 min over medium heat in rapeseed oil and then the additional tomato sauce ingredients and water were added. Water was added (50–300 ml) to account for differences in weight to ensure that they were matched for energy density. For the treatments, pulses were then added and then the mixture was left to simmer on low heat for 20 min. The macaroni was cooked separately in boiling water for 8 min and then drained. Varying amounts of salt were added to match the Na content among the treatments and the control to ensure that they were equally palatable. All meals were homogenised with a food processor to make them similar in texture and prevent participants from selecting specific contents within the treatment meal, as this would obscure energy intake based on weight and confound the effects of treatments on dependent variables. Pulses were analysed for nutritional composition by proximate analysis. Proximate analysis was conducted by Maxxam Analytics (Mississauga, ON, Canada) using standard methodology (Food Core analysis). Only one sample was analysed for each pulse. However, there were multiple steps taken to ensure that the results were accurate, including running blanks, checking the instrument calibration daily using EDTA, verifying that results are consistent by running a continuous calibration verification several times a day, monitoring the results of an standard reference material by daily control charting and analysing one duplicate per batch of twenty samples (the duplicate sample is chosen at random). If any of the above quality controls are outside the tolerance quality control range, Maxxam Analytics re-runs the whole batch after identifying and fixing the root cause. Composition of non-pulse ingredients were provided by the manufacturer. Pulse treatments and control were served as an ad libitum meal during which subjects were instructed to eat until comfortably full. The nutritional composition of the treatments and control is shown in Table 1.
Protocol
Before each session, subjects were instructed to refrain from alcohol and unusual physical activity. As previously reported(Reference Akhavan and Anderson12–Reference Akhavan, Luhovyy and Anderson15), following a 10–12 h overnight fast, subjects were asked to consume a standardised breakfast (1256·0 kJ) in the morning (06.00–09.00 hours) and arrive at the laboratory 4 h later (10.00–13.00 hours) to start the session. The standardised breakfast included 26 g of Cheerios (General Mills, Mississauga, ON, Canada), 250 ml of Beatrice 2 % milk (Parmalat Canada, Toronto, ON, Canada) and 250 ml of Tropicana orange juice (Tropicana Products, Inc., Bradenton, FL, USA) and, if desired, either tea or coffee without additions. In addition, 500 ml of Canadian Spring water (Canadian Springs, Mississauga, ON, Canada) was provided to consume between breakfast and 1 h before commencing the session.
BG concentrations were measured by a glucose meter (Accu-check Compact-Plus glucose monitor; Roche Diagnostics Canada, Laval, QC, Canada) and blood samples were obtained by finger prick by a Monojector Lancet Device (Sherwood Medical, St Louis, MO, USA), as previously described(Reference Anderson, Cho and Akhavan14). The first drop of blood was wiped due to contamination with alcohol and interstitial fluid and the second drop was placed on the testing strip. Each subject used the same glucometer throughout the study to minimise intra-subject variation.
On arrival for the sessions, subjects completed questionnaires assessing their sleep, stress and compliance with fasting and pattern of activity. If they reported significant deviations from their usual pattern, they were asked to reschedule. The session protocol is presented in Fig. 1. Before treatment consumption, subjects completed Motivation to Eat visual analogue scales questionnaire to measure subjective appetite(Reference Flint, Raben and Blundell16), as used in previous studies(Reference Wong, Mollard and Zafar5, Reference Hamedani, Akhavan and Samra11, Reference Akhavan and Anderson12, Reference Samra and Anderson17). A baseline BG measurement was then taken. A value >5·5 mm was interpreted to suggest that the subject had not fasted and the session was rescheduled. After taking the baseline measures (0 min), subjects were given either one of the treatment or control meals in random order. Subjects ate in isolation in the feeding room and were instructed to eat until comfortably full and to pace themselves over 18 min. Pulse/control meals were served in excess to enable subjects to reach satiation. Previous studies have also measured satiation by determining ad libitum FI at one meal(Reference Porrini, Santangelo and Crovetti18, Reference De Graaf, De Jong and Lambers19) and across the day at multiple meals(Reference Bell, Castellanos and Pelkman20–Reference Blatt, Roe and Rolls22). Three portions of the meal (2093·4 kJ per bowl) were served fresh in 6-min intervals. Additionally, 250 ml of water was provided, which subjects had to consume within the 18 min. The weight of each treatment portion before and after consumption was measured to calculate FI. Pleasantness, taste and texture of the treatment were measured using a Palatability visual analogue scales(Reference Wong, Mollard and Zafar5, Reference Hamedani, Akhavan and Samra11, Reference Akhavan and Anderson12, Reference Samra and Anderson17) questionnaire to ensure that the subject's FI and appetite were not affected by treatment fondness or dislike.
Session protocol. Both the treatment and the pizza meals were ad libitum.
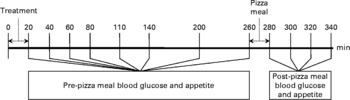
Following treatment meal consumption, BG and appetite were measured at 20, 40, 60, 110, 140, 200 and 260 min and are reported as pre-pizza meal (before pizza) values. At 140 min, subjects were provided with 250 ml water to drink within 5 min to compensate for physical discomfort arising from thirst.
FI was measured at an ad libitum pizza test meal provided at 260 min in isolation in our feeding room. Subjects were instructed to eat until they were ‘comfortably full’. Three varieties (Pepperoni, Deluxe and Three Cheese) of Deep ‘N Delicious pizza (McCain Foods, Florenceville, NB, Canada) were offered to subjects according to their preference determined at screening, and the same choices were provided at all sessions. The pizzas averaged 10·0 g of protein, 7·6 g of fat, 26·6 g of carbohydrate and 946·2 kJ/100 g. Each cooked pizza (8 min at 227°C and cut in quarters) was weighed before serving. Fresh pizza trays replaced the previous tray at 8-min intervals until the subjects declined further trays. Each tray contained two pizzas of their first choice and one each of their second and third choices. Following the pizza meal, palatability of the pizza was assessed by visual analogue scales questionnaire.
Following the pizza meal, BG and appetite were measured at 280, 300, 320 and 340 min and are reported as post-pizza meal (after pizza) values.
Statistical analysis
The average subjective appetite score was calculated from the Motivation to Eat visual analogue scales questionnaire as follows: appetite score = (desire to eat+hunger+(100–fullness)+prospective consumption)/4(Reference Anderson, Cho and Akhavan14, Reference Flint, Raben and Blundell16, Reference Woodend and Anderson23–Reference MacLeod, Clayton and van Calcar26). Energy intake at the satiation treatment meal and pizza meal was calculated based on weight consumed and compositional information obtained by either proximate analysis or provided by the manufacturer. Cumulative, pre- and post-pizza meal net incremental area under the curve (AUC) for BG and cumulative, pre- and post-pizza meal net area above the curve for average appetite were calculated for 0–340 min, 0–260 min and 260–340 min, respectively.
SAS version 9.2 (Statistical Analysis Systems; SAS Institute, Cary, NC, USA) was used for statistical analysis. All ANOVA included session as a repeated measure to control for within-subject variability. Three-way (time, treatment and session) repeated measures ANOVA determined the effects of treatments, time and the time × treatment interaction on BG and average appetite scores over the session. A statistically significant interaction between time and treatment was followed by two-way (treatment and session) repeated measures ANOVA at the individual time points. The effect of treatments on FI at the meal and on BG AUC and average appetite area above the curve were determined by two-way (treatment and session) repeated measures ANOVA. Tukey–Kramer post hoc test was used to describe mean differences among treatments. All results are presented as mean values with their standard errors of the mean. The statistical significance was concluded with the P value < 0·05.
Results
Subject characteristics
Subjects had a mean age of 24·3 (sem 3·6) years, weight of 72·4 (sem7·8) kg and BMI of 22·8 (sem1·4) kg/m2.
Food intake and palatability
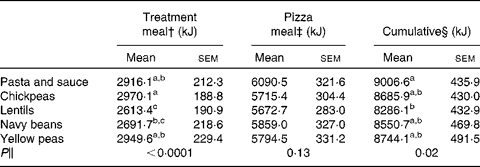
There was an effect of treatment on FI at the treatment meal (P < 0·0001; Table 2), with lentils exhibiting the strongest satiating properties. The lentil treatment led to lower FI compared to chickpeas and pasta and sauce, whereas navy beans led to lower FI compared only to chickpeas. Despite no significant differences in FI at the pizza meal 4 h following ad libitum treatment consumption (P = 0·13), lentils reduced cumulative FI compared to pasta and sauce (P = 0·02). There were no significant differences observed in palatability ratings among treatment meals (P = 0·28). Palatability ratings for the control and treatment meals were as follows: 53·8 (sem 4·8), 61·7 (sem3·4), 58·1 (sem3·8), 58·5 (sem3·5) and 57·0 (sem4·0) mm for the pasta and sauce, chickpeas, lentils, navy beans and yellow peas, respectively. There was also no difference in palatability ratings of the pizza among the five sessions (P = 0·50; data not shown).
Nutritional composition of treatments and control*
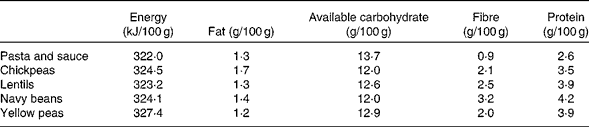
* Composition of the pulses were determined by proximate analysis. The composition of the non-pulse ingredients were provided by the manufacturers.
(Mean values with their standard errors)
a,b,c Mean values within a column with unlike superscript letters are significantly different (P < 0·05).
* Two-way ANOVA, followed by Tukey–Kramer post hoc test (n 24).
† Measured at an ad libitum treatment meal consumed following baseline measures (0–20 min).
‡ Measured at an ad libitum pizza meal 260 min following the consumption of the treatment meals.
§ Cumulative equals the amount consumed at the treatment meal plus the pizza meal.
∥ P value for the effect of treatment on study outcomes.
Subjective appetite
Pre-pizza meal appetite was affected by time (P < 0·001), but there was no effect of treatment (P = 0·23) and no time × treatment interaction (P = 0·59; Fig. 2). Regardless of treatment, appetite was highest when subjects first arrived (72·5 (sem 1·7) mm), but immediately decreased at 20 min on completion of the treatment meal (17·4 (sem 1·3) mm) and gradually returned to baseline levels by 260 min (68·5 (sem 1·6) mm). Average appetite scores over the pre-pizza meal period for the control and treatment groups were as follows: 40·4 (sem 1·7), 38·6 (sem 1·6), 39·6 (sem 1·7), 39·0 (sem 1·6) and 36·5 (sem 1·6) mm for the pasta and sauce, chickpeas, lentils, navy beans and yellow peas, respectively.
The effect of pulses consumed to satiation on appetite ratings over time. Treatments were pasta and sauce (![]() ), chickpeas (
), chickpeas (![]() ), lentils (
), lentils (![]() ), navy beans (
), navy beans (![]() ) and yellow peas (
) and yellow peas (![]() ). Effects were identified for time (pre-pizza meal: P < 0·0001; post-pizza meal: P < 0·0001), treatment (pre-pizza meal: P = 0·23; post-pizza meal: P = 0·23) and time × treatment interaction (pre-pizza meal: P = 0·59; post-pizza meal: P = 0·11) using three-way ANOVA, n 24.
). Effects were identified for time (pre-pizza meal: P < 0·0001; post-pizza meal: P < 0·0001), treatment (pre-pizza meal: P = 0·23; post-pizza meal: P = 0·23) and time × treatment interaction (pre-pizza meal: P = 0·59; post-pizza meal: P = 0·11) using three-way ANOVA, n 24.
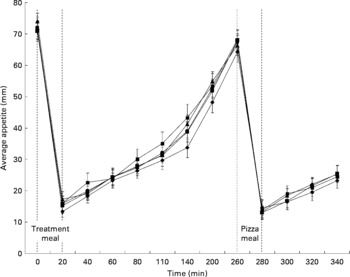
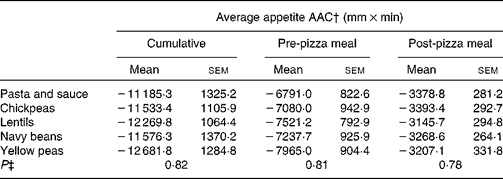
Similarly, post-pizza meal appetite was affected by time (P < 0·001), but there was no effect of treatment (P = 0·23) and no time × treatment interaction (P = 0·11; Fig. 2). Immediately after the pizza meal, regardless of treatment, appetite sharply decreased to 16·0 (sem 1·3) mm and gradually increased over the next hour to 27·4 (sem 1·8) mm. Average appetite scores over the post-pizza meal period for the control and treatments were as follows: 32·6 (sem 2·2), 34·3 (sem 2·3), 34·3 (sem 2·5), 34·1 (sem 2·4) and 35·3 (sem 2·3) mm for the pasta and sauce, chickpeas, lentils, navy beans and yellow peas, respectively. There was no effect of treatment on cumulative (P = 0·82), pre-pizza meal (P = 0·81) or post-pizza meal (P = 0·78) appetite area above the curve (Table 3).
(Mean values with their standard errors)
* Two-way ANOVA (n 24).
† Cumulative: 0–340 min; pre-pizza meal: 0–260 min; post-pizza meal: 260–340 min.
‡ P value for the effect of treatment on study outcomes.
Blood glucose
Pre-pizza meal BG was affected by time (P < 0·0001) and treatment (P < 0·0001), with a time × treatment interaction (P < 0·0001) that was explained by variation in the response to treatments over time. Thus, to further investigate the response to the treatments over time, the effect of treatment was assessed at each time measurement. There was a significant effect of treatment on all pre-pizza meal BG time points over the 260-min period (Fig. 3). Immediately following their consumption (20 min), all treatments resulted in a lower BG response compared with pasta and sauce; also, navy beans led to lower BG relative to chickpeas. At 40 min, all treatments led to lower BG compared to pasta and sauce. At 60 min, lentils and navy beans resulted in lower BG concentrations compared to the yellow peas. At 80 min, chickpeas and lentils led to lower BG compared to yellow peas and pasta and sauce, whereas navy beans led to lower BG compared only to yellow peas. At 110 min, navy beans led to lower BG compared to pasta and sauce. At 140 min, although there was a significant effect of treatment, the post hoc test was unable to identify differences between the treatments and control. At 200 min, lentils and navy beans led to lower BG compared to pasta and sauce, whereas at 260 min, only navy meals led to lower BG concentrations compared to chickpeas and pasta and sauce.
The effect of pulses consumed to satiation on blood glucose concentrations over time. Treatments were pasta and sauce (![]() ), chickpeas (
), chickpeas (![]() ), lentils (
), lentils (![]() ), navy beans (
), navy beans (![]() ) and yellow peas (
) and yellow peas (![]() ). Effects were identified for time (pre-pizza meal: P < 0·0001; post-pizza meal: P < 0·0001), treatment (pre-pizza meal: P < 0·0001; post-pizza meal: P = 0·31) and time × treatment interaction (pre-pizza meal: P < 0·0001; post-pizza meal: P = 0·03) using three-way ANOVA followed by a two-way ANOVA; Tukey–Kramer post hoc test indentified differences among treatments (P < 0·05). a,b,c Values with unlike letters are significantly different at each time point (a>b>c), n 24.
). Effects were identified for time (pre-pizza meal: P < 0·0001; post-pizza meal: P < 0·0001), treatment (pre-pizza meal: P < 0·0001; post-pizza meal: P = 0·31) and time × treatment interaction (pre-pizza meal: P < 0·0001; post-pizza meal: P = 0·03) using three-way ANOVA followed by a two-way ANOVA; Tukey–Kramer post hoc test indentified differences among treatments (P < 0·05). a,b,c Values with unlike letters are significantly different at each time point (a>b>c), n 24.
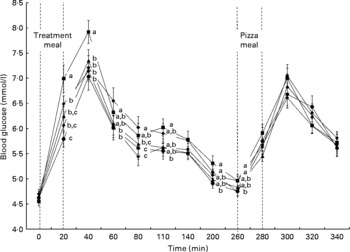
Post-pizza meal BG was affected by time (P < 0·0001), but not by treatment (P = 0·31). However, there was a time × treatment interaction (P = 0·03). Although there was a time × treatment interaction on post-pizza meal BG, there was only a significant effect of treatment at 300 min and the post hoc test did not identify differences between the treatments and/or control (Fig. 3).
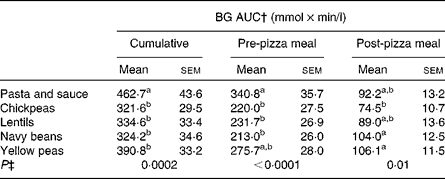
There was an effect of treatment on cumulative (P = 0·0002), pre-pizza meal (P < 0·0001) and post-pizza meal (P = 0·01) BG AUC (Table 4). Cumulative BG AUC was lower following all the treatments compared to pasta and sauce. Chickpeas, lentils and navy beans reduced pre-pizza meal BG AUC relative to pasta and sauce, whereas yellow peas led to intermediate concentrations. Despite no effect on the post-pizza meal BG identified by three-way ANOVA, chickpeas led to lower post-pizza meal BG AUC compared to navy beans and yellow peas, whereas lentils and pasta and sauce led to intermediate values.
(Mean values with their standard errors)
a,b,c Mean values within a column with unlike superscript letters are significantly different (P < 0·05).
* Two-way ANOVA, followed by Tukey–Kramer post hoc test (n 24).
† Cumulative: 0–340 min; pre-pizza meal: 0–260 min; post-pizza meal: 260–340 min.
‡ P value for the effect of treatment on study outcomes.
Discussion
This study shows that incorporating pulses into a high-glycaemic meal results in lower FI at that meal and lowers the BG response. However, the effects on satiation at the treatment meal and BG after the second meal were dependent on pulse type. Specifically, at the treatment meal, lentils exhibited the strongest satiating properties, resulting in lower FI compared to chickpeas and pasta and sauce, whereas navy beans also resulted in lower FI compared to chickpeas. Despite no differences in FI at the pizza meal 4 h later, lentils were the only pulse to significantly reduce cumulative FI (treatment plus pizza meal) compared to pasta and sauce. As expected, all pulse treatments lowered BG following the treatment meal compared to pasta and sauce, but in contrast to the hypothesis, not after the pizza meal. Following the pizza meal, only differences among the pulse treatments were observed. Chickpeas lowered the post-pizza meal BG AUC response compared to navy beans and yellow peas.
To our knowledge, this is the first report on the effects of different pulse type consumed within a meal on satiation and how eating to satiation affects first and second meal BG and appetite responses and FI at a subsequent meal. In this trial, pulses were added to a meal with another carbohydrate source (pasta) because they are usually consumed with high-glycaemic index (GI) foods and thus would reflect a typical pulse meal. Also, pulses accounted for 44 % of the energy in the meal and contributed approximately half of the available carbohydrate. The average amount of pulses consumed at the treatment meal was 1235·1 kJ, which is approximately two cups and provides an average of 44·5 g of available carbohydrate. This amount is similar to the quantity provided in previous studies (1046·7 kJ) investigating the effects of pulses consumed alone on BG, appetite and FI control(Reference Wong, Mollard and Zafar5). The pulse treatments and control were provided ad libitum in the first meal to allow for measurement of their effects on satiation within the meal and an ad libitum pizza meal was provided 4 h later to determine if the content of the first meal impacted FI at a subsequent pizza meal and BG following the meal. Both meals were provided ad libitum to reflect normal eating conditions and because a previous study found that the incorporation of one cup of pulses into the daily diet five times a week for 8 weeks resulted in lower daily energy intake and improved glycaemic control in overweight/obese subjects(Reference Mollard, Luhovyy and Panahi27). The time between treatment meal consumption and the subsequent ad libitum test meal was based on previous studies that investigated the second meal effects of foods or food components on BG(Reference Jenkins, Wolever and Taylor8, Reference Liljeberg, Akerberg and Bjorck28, Reference Nilsson, Ostman and Granfeldt29).
Neither palatability nor composition was responsible for the satiating effects of the navy beans and lentils at the treatment meal. Lentils and navy beans led to the lowest FI and chickpeas and yellow peas led to the highest during the treatment meal, yet the pulse treatments and control were found to be equally palatable (P = 0·28). In addition, there was no relationship between the palatability of the treatment and control meals and the amount eaten at either the treatment meal (r 0·12, P = 0·20) or the pizza meal (r 0·11, P = 0·21). Also, all the pulse treatments tended to contain more protein, fibre and less available carbohydrate compared to the control; however, the macronutrient content among the pulse treatments were similar.
Additional observations within the present study demonstrate that pulses are satiating foods. First, despite not statistically significantly lowering FI at the pizza meal, lentils led to 8 % (720·1 kJ) lower cumulative intake compared to pasta and sauce. Second, subjects ate the most during the chickpea and yellow pea treatments, but these treatments did not lead to higher cumulative FI and, thus, subjects compensated for those extra energy at the pizza meal. Lastly, despite eating less at the treatment meals containing lentils and navy beans, there were no differences in appetite ratings over the session, indicating that they are high-satiety foods.
When consumed to satiation within a meal containing high-glycaemic carbohydrate, pulses maintain their low glycaemic properties. It was expected that the amount eaten at the treatment meal would be associated with BG AUC response (r 0·42, P < 0·0001) over the 4 h preceding the pizza meal, indicating that greater FI at the meal results in a higher BG response to the meal. However, the BG responses immediately following pulse consumption (20 min), at peak (40 min) and cumulative AUC were lower following all the pulse treatments compared with pasta and sauce, indicating that meal size alone was not the only determinant of BG.
As expected, replacing 44 % of energy from high-GI pasta with low-GI pulses lowered the pre-pizza meal BG AUC (19–37·5 %) and cumulative BG AUC (15–30·5 %). Pulses consumed alone are known to be low-GI foods(Reference Foster-Powell, Holt and Brand-Miller30) and their consumption has been suggested for improving BG control(Reference Sievenpiper, Kendall and Esfahani31); however, this study shows that pulse type is a factor, with yellow peas being the least effective.
Differences in macronutrient content between the pulse treatments and pasta and sauce may provide an explanation of the differences in pre-pizza BG responses. The pulse treatments tended to be higher in protein and fibre and lower in available carbohydrate content compared to pasta and sauce, components involved in BG control. However, unlike the other pulses, yellow peas did not lower pre-pizza meal BG AUC relative to pasta and sauce and this lack of an effect was observed at all time points during the pre-pizza meal period following BG peak (60–260 min). This is most likely due to the fact that yellow peas are the highest in available carbohydrate and lowest in fibre among the pulses.
The present study, supports the hypothesis that lower FI within the pulse meals is associated with a lower glycaemic response(Reference Roberts32), but found that FI intake at a later meal was not predicted from the glycaemic response to foods in the earlier meal. BG immediately before the pizza meal (260 min; r 0·17, P = 0·07) and pre-pizza meal BG AUC (r 0·23, P = 0·01) were positively associated with amount eaten at the pizza meal, which indicates that a higher and not lower BG response following a previous meal and BG concentrations immediately before eating are associated with higher FI at the meal. Which measure of BG is more predictive of meal intake is uncertain, but may mediate pre-meal concentrations because, although the pulse treatment meals led to a lower pre-pizza meal BG AUC of 19–34 %, they did not reduce FI at the pizza meal compared with the pasta and sauce meal.
Despite the lack of a suppression of FI after the treatment with chickpeas, it led to lower post-pizza meal BG AUC compared to navy beans and yellow peas, whereas lentils and pasta and sauce led to intermediate values. These second meal effects of chickpeas on BG were not in response to a higher FI at the pizza meal. Chickpeas resulted in higher FI at the treatment meal compared to lentils and navy beans, but did not reduce FI at the pizza meal. In support of this interpretation, higher FI at the treatment (r − 0·45, P < 0·0001) and pizza meals (r − 0·23, P = 0·01) were associated with lower post-pizza meal BG AUC, suggesting that when subjects ate more at the treatment and pizza meals, there was a lower second meal BG response. Whether this association is due to the amount eaten at the meals or is in response to components having opposing effects on FI and second meal BG responses requires investigation.
The post-pizza meal BG effects are not in response to a lower pre-meal BG response observed after the pulse meals. It has been proposed that the second meal effect on BG occurs in response to the lente carbohydrate features of low-GI foods(Reference Jenkins, Wolever and Taylor8, Reference Liljeberg, Akerberg and Bjorck28, Reference Nilsson, Ostman and Granfeldt29). On the basis of the higher pre-meal BG response and the fact that pulses are a source of lente carbohydrate, it was expected that the pasta and sauce would lead to the highest post-pizza meal BG response and the response among the pulse treatments would be similar. However, it was navy beans and yellow peas that led to the highest post-pizza meal BG AUC, which was significantly higher compared to chickpeas. In support of our conclusions, pre-pizza meal BG AUC was not associated with post-pizza meal BG (r 0·04, P = 0·65). In contrast, BG immediately before consumption of the pizza meal (260 min) was negatively associated with post-pizza meal BG (r − 0·66, P < 0·0001), suggesting that a higher pre-pizza meal BG is a predictor of a lower BG response to a meal. The current literature is limited beyond the lente carbohydrate hypothesis, and thus, an explanation for the second meal effect of chickpeas requires further investigation.
In conclusion, when incorporated into a meal with high glycaemic carbohydrates, pulses maintain their low glycaemic properties, indicating that regular inclusion in the diet can be beneficial for BG control. In addition, meals with pulses can lead to greater satiation, lower cumulative FI and lower post-pizza meal BG responses compared to a pulse-free meal, but these effects are dependent on pulse type. Thus, the addition of pulses to a high-glycaemic meal contributes to earlier satiation, the reduction of BG both following the meal and again after a later meal, but these effects are specific to pulse type.
Acknowledgements
This study was funded by Agriculture and Agri-Food Canada under the Pulse Research Network. The authors would also like to acknowledge the assistance of Yudan Liu and Chris Smith. R. C. M. was involved in the design of the study and treatments, coordination of the study, and was also responsible for data analysis and writing of the manuscript. A. Z. was responsible for treatment development, subject recruitment, running sessions, data collection and reviewing of the manuscript. B. L. L. was involved in design of the study and responsible for managing students and research assistants, communication with the funding agency and reviewing the manuscript. M. F. N. was involved in managing students and research assistants, data analysis and reviewing of the manuscript. C. L. W. was responsible for design of the study and reviewing of the manuscript. G. H. A. was the principal investigator responsible for conceptualisation and design of the study, coordination of the research team and reviewing of the manuscript. The authors declare no conflict of interest.


