


Introduction
The European native oyster Ostrea edulis L. has seen a dramatic decline in abundance and distribution throughout its range (Beck et al., Reference Beck, Brumbaugh, Airoldi, Carranza, Coen, Crawford, Defeo, Edgar, Hancock and Kay2009; Fariñas-Franco et al., Reference Fariñas-Franco, Pearce, Mair, Harries, MacPherson, Porter, Reimer and Sanderson2018; Pogoda, Reference Pogoda2019). Historically O. edulis was found throughout European coastal regions, from the Norwegian Sea, around the British Isles, to northern Spain and the Mediterranean (Pogoda, Reference Pogoda2019), with the geographic range influenced by factors such as temperature, water depth, shelter and tidal exchange (Laing & Spencer, Reference Laing and Spencer2006). Formerly widespread throughout the European and north African Atlantic seaboard, Mediterranean and Black Seas (Olsen, Reference Olsen1883), Ostrea edulis underwent major declines from the mid-1800s due to over-exploitation and the impact of reduced population sizes on recruitment and survival (Thurstan et al., Reference Thurstan, Hawkins, Rady and Roberts2013; Fariñas-Franco et al., Reference Fariñas-Franco, Pearce, Mair, Harries, MacPherson, Porter, Reimer and Sanderson2018). Ostrea edulis is now only found in a fraction of its former geographic region (Thurstan et al., Reference Thurstan, Hawkins, Rady and Roberts2013; Helmer et al., Reference Helmer, Farrell, Hendy, Harding, Robertson and Preston2019; Pogoda, Reference Pogoda2019), and at much-reduced population densities. The long history of harvesting means it is difficult to determine the original extent and abundance of Ostrea edulis, with the species now extinct in estuaries and coastal regions where it was once common (Thurstan et al., Reference Thurstan, Hawkins, Rady and Roberts2013). Current wild populations in Europe fall into three main geographic clusters with distinct regional genetic structure, separated by oceanic fronts (Vera et al., Reference Vera, Carlsson, Carlsson, Cross, Lynch, Kamermans, Villalba, Culloty and Martinez2016).
Ostrea edulis and O. edulis beds are listed by OSPAR as a threatened species or declining habitat (OSPAR, Reference Haelters and Francis Kerckhof2009), with their status within UK waters categorized as functionally extinct. The few remaining populations left in the UK can be found in the Essex Estuaries, Solent and River Fal (England) , Strangford Lough (Northern Ireland) and Loch Ryan (Scotland), but due to low abundance, fragmentation of breeding populations, habitat loss and extraction for fisheries, these populations are considered vulnerable to loss (Thurstan et al., Reference Thurstan, Hawkins, Rady and Roberts2013; Helmer et al., Reference Helmer, Farrell, Hendy, Harding, Robertson and Preston2019).
Native oyster and native oyster beds have been associated historically with Essex estuaries from the period of the Roman occupation of Britain (Laver, Reference Laver1916). The value of the Colne estuary population was recognized in a charter of King Richard I in 1189 AD, granting the oyster fishery to the Borough of Colchester. While there is historical evidence for the presence of O. edulis within the Essex estuaries, there has not been any wide-scale assessment of populations since 1970 (Barnes & Coughlan, Reference Barnes and Coughlan1971). Stocks of O. edulis in the Essex estuaries were significantly reduced by the severe winter weather in 1962–1963 (Crisp, Reference Crisp1964), with conservative estimates of mortality being a 50–75% loss (Smyth et al., Reference Smyth, Roberts and Browne2009), leaving only remnant populations. Given the lack of any pre-1962–1963 quantitative baseline data on stock density and age profile, it is not possible to determine the level of recovery (or not) since then. Commercial oyster fisheries have existed in the Blackwater, Crouch, Roach and Colne estuaries for many years, but operating under different models of governance (Table 1). The Crouch and Roach native oyster fishery, active in the 1950s, and well-studied during that time (Knight-Jones, Reference Knight-Jones1952; Shellbourne, Reference Shellbourne1957; Waugh, Reference Waugh1957) is now not active. In the Blackwater estuary, some side creeks have had ‘oyster layings’ in private ownership since the 1800s, while in 1972 the Blackwater Oystermans Association (BOA), a limited-membership grouping of particular oyster fishers' family businesses, was granted exclusive fishing rights over the Blackwater oyster grounds in the form of a Several Order (Table 1). Between 1972 and 1997, the BOA translocated large numbers of O. edulis, predominantly from the Fal and the Solent in the UK, into the privately owned creeks adjoining the Blackwater Several Order. These O. edulis were maintained in the creeks over the summer period to provide an opportunity to spawn, before being removed and sold in the autumn/winter. The BOA have cultivated the oyster grounds by harrowing (a process of dredging sites in summer to disturb and redistribute bottom sediments and Crepidula fornicata colonies, and re-expose shell cultch; Bromley et al., Reference Bromley, McGonigle, Ashton and Roberts2016), and relaying shell cultch in large quantities within the area of the Several Order. The Colne Estuary oyster fishery owned by Colchester Borough Council is leased to a single tenant, Colchester Oyster Fishery Ltd (COF), who controls both the shellfish and finfish fishery in the Colne Estuary to a position offshore of Colne Point (Table 1, Figure 1). Local oystermen (A. Bird, R. Hayman, BOA; C. Kerrison, G. Larkin, COF) confirm that the fisheries have not recovered to pre-1962 levels, with subsequent challenges including TBT pollution in the 1970s (Rees et al., Reference Rees, Waldock, Matthiessen and Pendle1999, Reference Rees, Waldock, Matthiessen and Pendle2001), the accidental introduction of the protozoan parasite Bonamia ostreae (Laing et al., Reference Laing, Walker and Areal2005) and losses of suitable settlement substratum. The Colne estuary fishery (zone A) has seen some minor attempts at restocking and minimal harvesting, and no sustained aquaculture practices since the 1970s. The public grounds (zones B, C and D) have not been subject to any recent management or sustained fishery activity (Table 1).
Major estuaries of the Blackwater, Crouch, Roach and Colne (BCRC) Marine Conservation Zone (MCZ) in Essex, UK. Symbols indicate benthic dredge sampling locations in this study (Colne Estuary 2008, BCRC 2011–12). Estuary zones, Blackwater (A), Colne (B), Bench Head (C), Ray Sand (D) and Outer estuary (E) indicated.

Current and recent fishing and aquaculture practices in the five zones of the Blackwater, Crouch, Roach and Colne (BCRC) Marine Conservation Zone

In 2009, the Marine and Coastal Access Act (Marine Act) was passed in England and Wales. One of the main aims of this legislation was to establish a new type of Marine Protected Area (MPA) called a Marine Conservation Zone (MCZ). MCZs were envisioned to complement existing MPAs, filling some of the spatial gaps between existing MPAs to create the ecologically coherent network stipulated within the EU Habitats Regulations (European Commission, 2007). Designation of an area as an MCZ required the presence of qualifying species and habitats referred to as Features of Conservation Importance (FOCI) (JNCC, 2010). The status of O. edulis as rare or threatened under the OSPAR criteria (OSPAR, Reference Haelters and Francis Kerckhof2009) and the designation of O. edulis as a UK Biodiversity Action Plan Species and Habitat (UKBAP, 2009) resulted in O. edulis and O. edulis beds being designated as species and habitat FOCI respectively.
During the MCZ recommendation process the Blackwater, Crouch, Roach and Colne estuaries (BCRC) were proposed as a site for consideration for the protection of Ostrea edulis (Balanced Seas, 2012). The Ecological Network Guidance (JNCC, 2010) provided for areas to be considered for designation based on ‘local or lay knowledge’ but gave a higher weighting to up-to-date, scientifically robust data on presence and distribution of a FOCI. Extensive lay knowledge from local oystermen about distribution of native oysters (A. Bird, R. Hayman, BOA; C. Kerrison, COF), and reports of wild and cultivated populations of O. edulis in the Blackwater, Crouch and Roach estuaries and their creeks and tidal inlets (Hawkins et al., Reference Hawkins, Hutchinson and Devall2000; Rees et al., Reference Rees, Waldock, Matthiessen and Pendle2001) were not considered sufficient evidence of the presence of viable populations of O. edulis throughout the Essex estuary complex to support a decision on MCZ designation. For example, O. edulis was not included in species lists for the Colne estuary in a report on the Essex Estuaries Special Protection Area (Chesman et al., Reference Chesman, Burt and Langston2006), contradicting local lay knowledge.
Therefore the aim of this study was to (i) determine the presence, dredge abundance and distribution of O. edulis populations to support the proposed Essex BCRC MCZ application, and to relate the distribution of oysters to environmental abiotic factors; (ii) to determine the size structure of the populations to ensure appropriate conservation objectives for the site were set; and (iii) to set a clear baseline for future management and restoration practices within the BCRC MCZ.
Materials and methods
Study area
The Essex Estuaries complex lies on the east coast of Essex, in the south-east of England. The designation covers an area of ~282 km2. It is made up of four estuaries; the Blackwater, Crouch, Roach and Colne, as well as open stretches of coast along the Dengie Peninsula (Figure 1). The Blackwater Estuary is the largest estuary in this complex, extending to a length of 21.2 km, from its tidal limit at Maldon to the mouth. The dominant upper intertidal habitats along the estuaries are characterized by extensive areas of salt marsh while the lower intertidal area is dominated by extensive intertidal mud and sand flats. The area benefits from international designations including the Essex Estuaries Special Area of Conservation (SAC) (Chesman et al., Reference Chesman, Burt and Langston2006), the Blackwater Estuary, Colne Estuary, Crouch and Roach Estuary and Dengie Special Protection Area (SPA) (JNCC, 2016) and recently the Blackwater, Crouch, Roach and Colne Marine Conservation Zone (DEFRA, 2013).
The spatial distribution of O. edulis throughout the Essex Estuaries was obtained from a survey of the Blackwater and outer Colne estuaries undertaken from 2010 to 2012 (Allison, Reference Allison2019), and from a survey of the Colne estuary undertaken in 2008 to 2009 (Hardy, Reference Hardy2014).
Study design – Blackwater and Outer estuary
Using ESRI ArcMap GIS software (ESRI, Aylesbury, Buckinghamshire, UK) a 200 m × 200 m grid was created and mapped to the proposed MCZ boundary. Using Seazone mapping software (Seazone, Walllingford, Oxfordshire, UK) TruDepth data points were imported into the database and depths of between 0 and ≤4 m below chart datum within the boundary were selected. The MCZ fishnet grid was clipped to incorporate only these depths. Every 200 m grid square within these selection criteria was allocated a value between 1 and 4000 in consecutive order. Numbers were input into a random number generator to identify random locations, with local expert knowledge (A. Bird, R. Hayman, BOA) adding some additional sample points in known areas of oyster occurrence, resulting in 283 locations uploaded into the survey area geodatabase. This was the basis of the 2011–2012 survey (Figure 1).
Survey design – Colne Estuary
The study area located between Wivenhoe (51° 51.000′N) and the estuary mouth at Colne Point (51° 45.648′N), was conceptually divided into discrete sampling areas, comprising four sections of the main estuarine channel and three major tidal creeks; Geedons, Brightlingsea Creek and Pyefleet Channel (Hardy, Reference Hardy2014). A stratified sampling design was adopted in which sampling sites were assigned on the basis of known variations in salinity (euhaline and polyhaline regions), intertidal characteristics, composition of benthic substrata (Nedwell et al., Reference Nedwell, Underwood, McGenity, Whitby and Dumbrell2016), levels of disturbance through shipping and commercial activity, and positions and historical extent of O. edulis beds (C. Kerrison, COF) within each area. In total 118 locations were sampled (Figure 1).
Ostrea edulis sampling
Survey sites were located using GPS. Each sample location was surveyed using a 1.2 m wide standard oyster ladder dredge fitted with a 45 mm ring size. At each location a 100 m tow (determined by GPS linked sidescan sonar; Humminbird 698ci HD, Humminbird, Eufaula, Alabama) was taken at a speed of <1.5 m s−1. The contents of the dredge were discharged onto the sorting table and photographed. All O. edulis were removed, counted and shell heights (mm) of each oyster were measured from umbo to outer shell margin using callipers. Assessment of the dominant substratum characteristic in each dredge sample was recorded (noting that fine sediment may be underestimated), using eight broad substratum categories based on the Wentworth classification: (1) Clay, (2) Silt, (3) Fine Mud, (4) Muddy Sand, (5) Sand, (6) Gravel, (7) Shell, (8) Cobbles. All dredged material was returned to the same grid square. In total 401 locations throughout the Blackwater, Colne, Crouch and Roach MCZ were sampled (Figure 1).
Data analysis
All survey data were imported into ArcMap 10.2.2, including presence, number and sizes of O. edulis within each sample, and substratum type. The survey area was divided into five zones: (A) Blackwater, (B) Colne, (C) Bench Head, (D) Ray Sand, (E) Outer Estuary, based on present and historical management regimes (Table 1). Shell height data were used to group the total numbers of individual oysters sampled in separate 10 mm size classes; 0–9, 10–19, 20–29 mm, etc. for each zone.
Water column environmental variables (temperature (°C), salinity (ppt), suspended solids (mg l−1), Chl a (μg l−1), pH, oxygen (mg O2 l−1), NO3− (mg l−1 N) and NH4+ (mg l−1 N)) for these five zones were obtained from publicly -available data within the UK Environment Agency WIMS database. Mean values ± standard error, max and min values for the 5-year period from Jan 2008–December 2012 were calculated (Table 2). Variation in Environment Agency sampling regimes over this period at the different sampling stations resulted in varying data set sample sizes (Table 2).
Water column environmental variables for five zones within the Blackwater, Crouch, Roach and Colne Marine Conservation Zone for 5-year period from January 2008–December 2012, from UK Environment Agency WIMS database. Mean values ± standard error, max and min value, and sample size (N)
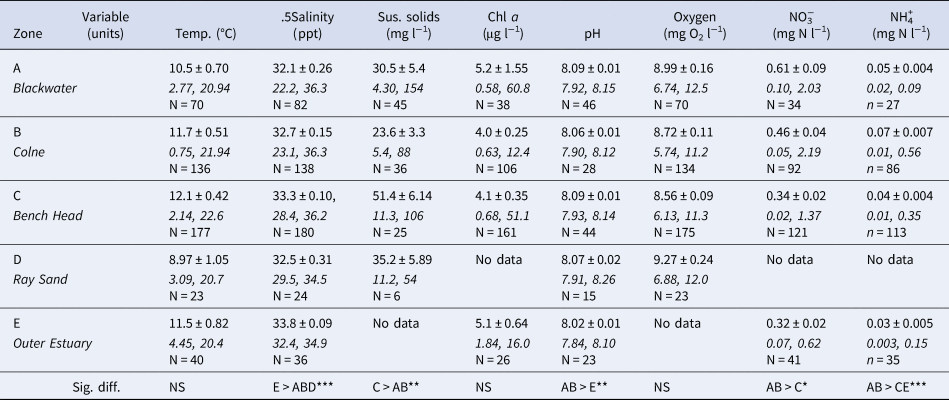
Significant differences between zones indicated, Kruskal–Wallis, *P < 0.05, **P < 0.01, ***P < 0.001.
Statistical analysis of O. edulis distribution data used Kruskal–Wallis one way analysis of variance on ranks, comparing zones and substratum groups followed by multiple comparison procedure (Sigmaplot v.12, Systat. Hounslow, London, UK). Principal component analysis of population size structures and estuary zones was conducted using MVSP v3.1 (Kolvec Ltd, N Wales, UK). Significant differences in water column environmental variables between each zone were determined using Kruskal–Wallis, followed by multiple comparison testing using Dunn's method.
Results
Distribution and density of O. edulis at different sites
Live O. edulis were sampled at 101 of the 401 dredge locations, with counts ranging from 1 to 150 individuals per 100 m dredge sample (Figure 2). Oysters had a highly patchy distribution across the sampling area, with highest numbers present in five spatially aggregated sub-populations; two located within the Blackwater (zone A), two in the Bench Head zone (zone C), and the fifth in the Ray Sand zone (zone D) (Figure 2). Highest numbers were recorded in the Blackwater and Ray Sand zones (Figures 2 and 3), while no live oysters were sampled in the Outer Estuary (zone E). There was significant spatial variability in sample point abundance of O. edulis between zones (H = 61.412, d.f. = 4, P < 0.001). Sample abundance of O. edulis was significantly higher in the Blackwater (A) and Ray Sand (D) zones, compared with the Colne (B), Bench Head (C) and the Outer Estuary (E) zones (Figure 3). There were no significant differences in O. edulis sample abundance between the Blackwater and the Ray Sand zones, or between the mean sample abundance between the Bench Head and Colne zones (Figure 3).
Dredge abundance of Ostrea edulis within the Blackwater, Crouch, Roach and Colne (BCRC) Marine Conservation Zone during 2008–2012. Abundance ranged from 1 to 150 O. edulis per 100 m dredge. Dredge locations (re. Figure 1) that returned zero oysters are omitted.

Number of O. edulis per 100 m dredge sample within the five estuary zones in the BCRC between 2008 and 2012. Box and whisker plot (solid line = median value, 25–75 quartiles, bar = 95% and outliers, dotted line = mean value). n = total number of dredge samples taken in survey zone. % = number of 100 m dredge samples containing one or more O. edulis. Densities in zones marked with same letters (a, b, c) are not significantly different from each other (P > 0.05).

Population shell-height frequency distribution of O. edulis
Size frequency data revealed differences in population structure between the four survey zones containing populations of O. edulis (Figure 4). Both the Blackwater (zone A) and Bench Head (zone C) samples contained a high frequency of oysters with shell heights less than 39 mm (Figure 4), but these size classes were not present (except at very low frequency) in the Ray Sand samples. Principal components analysis of the size distribution data of all samples containing oysters, clustered individual samples from the Blackwater and Bench Head zones together (Figure 5), characterized by the presence of a higher proportion of individuals in the smaller size classes. These clusters of samples were separate from samples from oysters in the Ray Sand and Colne estuary zones, which lack individuals of these smaller shell height size classes (Figure 4). The high dredge sample abundances of O. edulis in the Ray Sand (zone D), were characterized by a noticeable lack of any individuals below 39 mm shell height (Figure 4).
Ostrea edulis shell height size class distribution (frequency in each size class), in four estuary zones in the BCRC MCZ containing oysters between 2008 and 2012.

Scatter plot of Principal Components 1 and 2 (explaining 36% of total variance) from PCA of O. edulis size frequency (shell height classes in mm) in four zones within the Blackwater, Crouch, Roach and Colne (BCRC) MCZ between 2008 and 2012. Each symbol is a single dredge sample containing oysters. Vectors indicate contribution of different size classes to the PC scores.

Relationship between substratum type and Ostrea edulis abundance
Of the 401 survey locations sampled in the proposed BCRC, 104 were characterized by dominant substratum types of gravel, shell or cobble (Figure 6). Gravel was uncommon in samples across the region, whereas cobbles were present in the east of the area, mainly in the outer estuary zone (Figure 6). Shell and sand were widely distributed, except in the Colne estuary, where fine mud was the dominant substratum. Only four from a possible 118 survey locations within the Colne contained substratum >2 mm in size (shell). There were significant differences in population density of O. edulis in relation to substratum type within the survey zones (H = 84.1, d.f. = 6, P < 0.001), with shell associated with significantly higher numbers than any of the other substratum types. Ostrea edulis were also present on sand substrata, and, in the Colne Estuary, on fine muds (Figure 7).
Location and distribution of substratum types throughout the Blackwater, Crouch, Roach and Colne (BCRC) MCZ, recorded at each dredge site between 2008 and 2012. Substratum: (2) Silt, (3) Fine Mud, (4) Muddy Sand, (5) Sand, (6) Gravel, (7) Shell, (8) Cobble.

Number of O. edulis found per 100 m dredge on each sediment substratum type in the Blackwater, Crouch, Roach and Colne MCZ area. Box and whisker plot (solid line = median value, 25–75 quartiles, bar = 95% and outliers, dotted line = mean value). Densities on substratum types marked with similar letters (a, b, c) are not significantly different from each other (P < 0.05).

Differences in water column environmental variables
There were no significant differences in mean water column temperature, Chl a and oxygen concentrations across the study region (Table 2) over the period January 2008 to December 2012. Salinity in the Outer Estuary (zone E) was significantly higher (P < 0.001) than in zones A, B and D, though the differences in mean values were only between 33 and 32 ppt. Salinity values as low as 22 to 23 ppt were recorded on two occasions during winter months in the Blackwater (A) and Colne (B) zones, but this did not correspond with water temperature minima. The inner estuary zones A and B also had significantly higher mean nitrate and ammonium concentrations, with winter peaks in nitrate concentrations, and pH, whereas the highest suspended solid loads were found in the Bench Head zone (C) (Table 2). There were no significant associations between any of these water column environmental variables and the differences in density or population size structure of O. edulis.
Discussion
The spatial distribution of O. edulis across the study area was not uniform but centred around five distinct areas. The sub-populations of O. edulis located within the Blackwater Estuary were predominately contained within the BOA Several Order area. One cluster located within the Bench Head survey zone was contiguous with the sub-population within the Several Order area, while the other was located 5 km to the east, in the mouth of the Colne where substratum type is favourable for settlement. The fifth sub-population was geographically distinct, located 10 km to the South in the Ray Sand (Figure 2).
Two important factors in O. edulis recruitment are the presence of suitable substrata for settlement, and the presence of adult O edulis, given the propensity of the species for gregarious settlement (Bayne, Reference Bayne1969; Laing et al., Reference Laing, Walker and Areal2006; Rodriguez-Perez et al., Reference Rodriguez Perez, James, Donnan, Henry, Møller and Sanderson2019). Availability of suitable coarse sediment substratum is key to veliger settlement and recruitment (Rodriguez et al., Reference Rodriguez, Ojeda and Inestrosa1993; Smyth et al., Reference Smyth, Mahon, Roberts and Kregting2018). Ostrea edulis pediveligers show gregarious settlement behaviour, preferentially on shells of adult populations (Cole & Knight-Jones, Reference Cole and Knight-Jones1949; Bayne, Reference Bayne1969) or on subtidal mixed sediments (Waugh, Reference Waugh1972), with varying preferences for different substratum properties and shell species types (Smyth et al., Reference Smyth, Mahon, Roberts and Kregting2018; Rodriguez-Perez et al., Reference Rodriguez Perez, James, Donnan, Henry, Møller and Sanderson2019). We found higher abundance of O. edulis where bottom sediments were predominantly shell, but not exclusively so, in that O. edulis were also found on finer silty sediments in the Colne, when adults were present. It is likely that availability of suitable substrata in the BCRC MCZ will be a key element for successful settlement and further recovery of populations. However there were regions of suitable shell substrata that did not support O. edulis populations, indicating that successful recruitment and maintenance of O. edulis stocks at a site is not only dependent on substratum type. It should be noted that our use of a 45 mm ring dredge sample for defining substratum types may underestimate the prevalence of finer muds, silts, sands and gravels but retaining larger shell and rocks from within extensive mud-based habitats. Grab surveys across the BCRC MCZ by Hardy (Reference Hardy2014) and Allison (Reference Allison2019) confirm the general distribution of substrata reported here.
Highest dredge abundance of O. edulis were located in the Blackwater and Ray Sand zones. While the abundance was similar between these two sites, differences in size structure were observed. Size classes within the Blackwater had proportionally smaller size class individuals (10–39 mm shell height) when compared with the Ray Sand. Evidence of some recruitment was observed in the Ray Sand but the frequency of juveniles to the main adult size classes were lower than observed in the more highly managed Blackwater zone. Recent surveys of O edulis in Portsmouth, Langstone and Chichester Harbours in the Solent, UK, also found narrowing age structures, and no evidence of recent recruitment in the last 5–6 years for Langstone and Chichester Harbours, and the last 8–10 years in Portsmouth Harbour (Helmer et al., Reference Helmer, Farrell, Hendy, Harding, Robertson and Preston2019). The mean and maximum shell height sizes reported in Helmer et al. (Reference Helmer, Farrell, Hendy, Harding, Robertson and Preston2019), with no oysters smaller than 45 mm found in their study, are similar to those in the Ray Sand (zone D), and to a lesser extent in the Colne (zone B), indicating a potential lack of significant recruitment in those zones in the years prior to our study. It is possible that this lack of recruitment is in part the result of low adult oyster densities throughout the BCRC MCZ (Richardson et al., Reference Richardson, Collis, Ekaratne, Dare and Key1993), but also local density-dependent effects (Guy et al., Reference Guy, Smyth and Roberts2019). As male O. edulis broadcast spawn, low densities of adults can result in reduced fertilization of eggs within the females, reducing the reproductive viability as stock densities decline (Thurstan et al., Reference Thurstan, Hawkins, Rady and Roberts2013; Guy et al., Reference Guy, Smyth and Roberts2019). Ostrea edulis is known to exhibit sporadic breeding success (Helmer et al., Reference Helmer, Farrell, Hendy, Harding, Robertson and Preston2019), and low spat falls were reported in the Solent, and in Ireland in the years 2010–2011 (Kamphausen, Reference Kamphausen2012; Tully & Clarke, Reference Tully and Clarke2012). However, the size profiles of oysters in the Blackwater and Bench Head zones indicate that there has been recent successful recruitment in those zones of the BCRC in the years before 2010–2012, but not uniformly across the MCZ. In particular, there has been almost no recruitment in the Ray Sand, despite high densities of large adult O. edulis present at that location. Estimations of the total and sub-population sizes and realized densities would be an appropriate next step to inform future management.
The presence of substratum suitable for settlement but low actual densities of O. edulis, for example in some areas such as the Colne and Bench Head zones, may also indicate a potential limitation in larval supply. Ostrea edulis are sequential hermaphrodites, with fertilization of eggs occurring within the mantle cavity by sperm brought into the shell by feeding currents (Guy et al., Reference Guy, Smyth and Roberts2019). Ostrea edulis shows a high physiological plasticity to ambient environmental conditions in its reproductive strategy (Joyce et al., Reference Joyce, Holthuis, Charrier and Lindegarth2013), with temperature generally accepted to be the most important factor inducing reproductive activity (Laing et al., Reference Laing, Walker and Areal2005). Planktonic larval dispersal time ranges from 12–15 days depending on temperature and food availability (Hedgecock et al., Reference Hedgecock, Launey, Pudovkin, Naciri, Lapegue and Bonhomme2007; Marshall et al., Reference Marshall, McKinley and Pearce2010; Filgueira et al., Reference Filgueira, Brown, Comeau and Grant2015). Hardy (Reference Hardy2014) and Allison (Reference Allison2019) conducted surveys of O. edulis veliger densities in the Colne, Bench Head and Blackwater zones during the breeding season (June–September) in 2009 and 2010, and during 2016, respectively. Average O. edulis veliger densities ranged from 55–135 individuals m−3 in 2009–2010 (Hardy, Reference Hardy2014) and 75–95 individuals m−3 in 2016 (Allison, Reference Allison2019). These are comparable to densities between 18 and 54 individuals m−3 found in Strangford Lough in 1997 and 1998 (Kennedy & Roberts, Reference Kennedy and Roberts2006) and ~60 individuals m−3 in Strangford Lough by Smyth et al. (Reference Smyth, Roberts and Browne2009). Such densities are, however, an order of magnitude lower than those reported from the Crouch and Roach Estuaries (between 900 and 1360 individuals m−3) during the spawning seasons of 1948 and 1949 (Knight-Jones, Reference Knight-Jones1952), and between June to September 1950–1954 (between 10 and 10,000 individuals m−3, mean 1448) (Waugh, Reference Waugh1957). In Kilkieran Bay, Ireland, O. edulis peak larval densities of 840 individuals m−3 were recorded during the summers of 1984 and 1985 (Wilson, Reference Wilson1987). Given the dependence on short planktonic phases within the life cycle, broodstock density and hydrodynamics are important determinants of successful recruitment and maintenance of local populations of O. edulis (Kennedy & Roberts, Reference Kennedy and Roberts2006; Smyth et al., Reference Smyth, Mahon, Roberts and Kregting2018; Guy et al., Reference Guy, Smyth and Roberts2019). The shallow BCRC MCZ area is macrotidal (>5 m Spring tide range), with significant tidal flows and tidal volume exchanged across the region during tidal cycles, suggesting that hydrodynamic isolation of any particular location is unlikely. The low veliger densities, compared with earlier studies, would suggest a significant loss of breeding stock and hence veliger supply in the BCRC system since the 1950s, which would be a major contribution to lower spat fall and recruitment since then.
Siltation of the Colne and Ray Sand zones where O. edulis beds have been found historically may also be a contributing factor to the lack of recruitment in those areas. Higher silt loads have been negatively associated with larval settlement in the Solent (Barnes et al., Reference Barnes, Coughlan and Holmes1973) and Crouch (Shellbourne, Reference Shellbourne1957). Sidescan sonar surveys conducted by the Kent & Essex IFCA have shown that the substratum type is subtidal sand and subtidal mud and mixed sediments in these areas (KEIFCA, 2016). So even when shell was present in dredge samples, it may be buried or smothered in situ on the sea bed. Suspended solid loads are high in the southern North Sea, with highest suspended solid loads measured in the Bench Head zone of the BCCR during 2008–2012 (Table 2). However, there was no clear relationship between water column suspended solid loads and the presence of smaller shell height O. edulis in our survey; for example between the Blackwater and Ray Sand zones, which had similar water column suspended solid loads, but different O. edulis size and recruitment profiles.
There was no evidence of water quality (in terms of food availability, e.g. Chl a concentrations, oxygen levels, temperature or salinity; Table 2) being significantly associated with the observed distribution of O edulis in this study. Ostrea edulis is sensitive to low temperature in winter and low salinity during prolonged periods of freshwater inputs, and this can restrict distribution in the meso- and oligohaline portions of estuaries (Hutchinson & Hawkins, Reference Hutchinson and Hawkins1992; Gosling, Reference Gosling2003). Temperature and salinity differences between the five zones were not sufficient to be a cause of patterns of O. edulis distribution. For example, lower salinity and occasional low temperatures equally affected both the Blackwater (abundant and recruiting O. edulis populations) and Colne zones (low density, little recruitment of O edulis). The BCRC receives high loads of nutrients, particularly nitrogen, from both agricultural run-off and treated waste water (Nedwell et al., Reference Nedwell, Dong, Sage and Underwood2002), with declining loads in recent years (McMellor & Underwood, Reference McMellor and Underwood2014), although high suspended sediment loads generally prevent the occurrence of deleterious phytoplankton blooms (Kocum et al., Reference Kocum, Underwood and Nedwell2002) and there is no water column de-oxygenation. Despite differences in water column environmental variables between the five zones (Table 2), none of these corresponds to, or explains, differences in recruitment to O. edulis populations observed across the Ray Sand, Colne, Bench Head or Blackwater zones.
Habitat loss has been cited as one of the major factors contributing to the decline of O. edulis stocks across its range (Laing & Spencer, Reference Laing and Spencer2006). Over longer time periods (decades to centuries), changes to the benthic community in coastal waters due to anthropogenic activity is associated with changes in bottom sediments to less favourable conditions for O. edulis (Thurstan et al., Reference Thurstan, Hawkins, Rady and Roberts2013; Pogoda, Reference Pogoda2019). Modelling indicates that stocks of oysters from pre-harvesting periods would have been able to filter whole estuary volumes within estuary water residence timescales in US estuaries (Zu Ermgassen et al., Reference Zu Ermgassen, Spalding, Grizzle and Brumbaugh2013). The extensive beds of O. edulis in the North Sea reported in Olsen (Reference Olsen1883) would have had a significant effect as ecosystem engineers, including in the Essex estuaries before the industrial-scale removal of stocks. The removal of biogenic reef structures and repeated benthic dredging for finfish and shellfish can result in a decline in sediment grain size (Tully & Clarke, Reference Tully and Clarke2012; Thurstan et al., Reference Thurstan, Hawkins, Rady and Roberts2013; Pogoda, Reference Pogoda2019) and loss of shelled macrofauna (Eggleton et al., Reference Eggleton, Depestele, Kenny, Bolam and Garcia2018). Coupled with these effects, the spread of the non-native Crepidula fornicata, which produces significant quantities of fine particulate pseudofaeces that lowers functional grain size, and competes for space, could reduce O. edulis recruitment and survival (Orton, Reference Orton1912; Nehls et al., Reference Nehls, Diederich, Thieltges and Strasser2006; Helmer et al., Reference Helmer, Farrell, Hendy, Harding, Robertson and Preston2019). These factors may have a role to play in the long-term decline in O. edulis across the southern North Sea region and the Essex estuaries (Pogoda, Reference Pogoda2019). The Essex estuary region is now in an anthropogenically altered condition, distant from its historical ecological baseline (Zu Ermgassen et al., Reference Zu Ermgassen, Spalding, Blake, Coen, Dumbauld, Geiger, Grabowski, Grizzle, Luckenbach and McGraw2012; Thurstan et al., Reference Thurstan, Hawkins, Rady and Roberts2013; Pogoda, Reference Pogoda2019).
It is not yet clear whether closure of the open grounds (zones C, D, E, Figure 1) to commercial oyster fishing in 2012 (after our study was undertaken) will result in a recovery without other active interventions. Stocks in the Colne Estuary did not recover in the 40 years since the cessation of the commercial fishery after 1962–63, despite this being a private ground. Partial closures in the Solent area for periods of 5–10 years did not appear to increase O. edulis recruitment (Helmer et al., Reference Helmer, Farrell, Hendy, Harding, Robertson and Preston2019). Restocking of depleted fisheries has been a traditional approach to restore stocks (Table 1), often by taking stock from other, often geographically distant, locations, so not actually increasing stocks overall (Laver, Reference Laver1916; Thurstan et al., Reference Thurstan, Hawkins, Rady and Roberts2013; Fariñas-Franco et al., Reference Fariñas-Franco, Pearce, Mair, Harries, MacPherson, Porter, Reimer and Sanderson2018). In recent times commercial hatcheries have provided seed stock, and have been successful in re-establishing populations (Kennedy & Roberts, Reference Kennedy and Roberts2006; Smyth et al., Reference Smyth, Roberts and Browne2009) but such an approach raises concerns around pest and disease transfer, and loss of genetic diversity (Vera et al., Reference Vera, Carlsson, Carlsson, Cross, Lynch, Kamermans, Villalba, Culloty and Martinez2016; Fariñas-Franco et al., Reference Fariñas-Franco, Pearce, Mair, Harries, MacPherson, Porter, Reimer and Sanderson2018). High numbers of oysters remaining in the Blackwater Several Order area, managed by the Blackwater Oysterman's Association, may reduce the reliance on external sources of oyster stock for restoration in the wider BCRC MCZ.
Ostrea edulis populations face a range of associated challenges: sporadic recruitment, stock declines, invasive species, disease and altered benthic habitats. As such, active interventions are considered the most likely route to successful restoration of O. edulis with numerous initiatives in Europe (e.g. NORA; Pogoda et al., Reference Pogoda, Brown, Hancock and von Nordheim2018) and the USA (Zu Ermgassen et al., Reference Wilson2012; Fariñas-Franco et al., Reference Fariñas-Franco, Pearce, Mair, Harries, MacPherson, Porter, Reimer and Sanderson2018; Pogoda, Reference Pogoda2019). Most have focused on restoration either for the purpose of conservation, or for their value as a fisheries resource, with active management using traditional fisheries methods such as harrowing and dredging in conflict with some conservation values (Bromley et al., Reference Bromley, McGonigle, Ashton and Roberts2016). In the BCRC MCZ, the long history of oyster cultivation, expertise in traditional management methods, and the exclusion of common fisheries to some areas through private lease, was closely associated with areas where O. edulis was present and recruiting. Oyster cultivation practices by the BOA including relaying of shell cultch and harrowing of slipper limpet aggregations (‘cleaning the ground') prior to the spawning period (Laing et al., Reference Laing, Walker and Areal2006). This traditional practice is under scrutiny as a means to promote O. edulis settlement due to the reliance on dredging of the seabed. The use of harrowing to clean ground in Lough Foyle found no significant difference in settlement rate between harrowed and unharrowed test plots (Bromley et al., Reference Bromley, McGonigle, Ashton and Roberts2016), and harrowing could over long periods contribute to the deterioration of suitable substratum, by breaking shell into particles that are too small to receive veligers (Tully & Clarke, Reference Tully and Clarke2012). This, and other trials (KEIFCA, 2016), have been criticized by oyster fishermen as not fully replicating their overall management of oyster layings. A recent review looking at the effects of fishing on marine SACs concluded that interaction of fishing gear with certain subtidal biotopes can have a significant effect on the species present and community structure (DEFRA, 2014). Though there are concerns about the impact of harrowing, and of traditional dredge harvesting on the structure of the sea bed, and on biogenic reef formation in particular, harrowing is used by the BOA in the private lease areas of the Blackwater zone. It is important to note that these are areas where O. edulis sample abundance are highest and show evidence of sustained and relatively high recruitment, despite physical disturbance. While differences in opinion on the role of fisheries in active restoration of the European native oyster remain (Pogoda, Reference Pogoda2019), partnership working between local stakeholders, conversation bodies, government and academia was the required ethos of the UK Marine and Coastal Access Act 2009. In the BCRC MCZ, this has led to a conservation-led fisheries byelaw and management plan that acknowledges the role of private oyster aquaculture in securing stock and as a potential method for promoting initial recruitment of oyster spat in restoration zones (KEIFCA, 2018a, 2018b). If successful, this will support both the restoration of O. edulis as a species, and support the continuation of this important regional and traditional coastal heritage fishery.
The presence of recruiting aggregations of O. edulis in the period 2008 to 2012 provides evidence that the Essex estuaries are one of the last remaining strongholds of native flat oysters in the southern North Sea. Though further work is required to assess the densities of these oysters and the structure of the habitats they create, and to undertake an updated stock assessment, this clearly represents a significant population in comparison to other regional assessments (Helmer et al., Reference Helmer, Farrell, Hendy, Harding, Robertson and Preston2019; Pogoda, Reference Pogoda2019). This justified the designation of this site as a MCZ to protect and restore O. edulis populations and habitats in 2013 (Defra, 2013).
Acknowledgements
We acknowledge the significant technical support of Russell Smart, John Green, Tania Cresswell-Maynard (University of Essex), and from Graham Larkin, Kevin Gooch, Daniel French and Alan Bird, for their extensive support for field sampling and expert knowledge of the Essex Oyster fisheries. We thank two anonymous reviewers for their constructive comments.
Financial support
Sarah Allison was funded in part by the Essex Wildlife Trust. Malcolm Hardy was partly funded by Colchester Oyster Fishery Ltd. This work was partly supported by the UK Natural Environment Research Council, Coastal Biodiversity and Ecosystem Services programme (Ref NE/J01561X/1) to GJCU.


 Open access