


The thermic effect of feeding (TEF), the increase in energy expenditure (EE) above resting energy expenditure (REE) following energy intake, is a well-established component of total energy expenditure (TEE)(Reference Westerterp1). This increase in EE reflects the energy required for the digestion, absorption, transport and storage of nutrients(Reference Almeida, Galdino-Silva and Paula2). While TEF generally accounts for approximately 10–15 % of TEE(Reference Ho3,Reference Calcagno, Kahleova and Alwarith4) , it has been suggested that a blunted TEF response may contribute to the development or maintenance of obesity(Reference Westerterp1,Reference Schutz, Bessard and Jéquier5–Reference Katzeff and Danforth7) , raising questions about the factors that may contribute to the interindividual variability of the TEF response.
It is well documented that the main determinants of the variability of TEF are the energy content of meals and their macronutrient composition(Reference Quatela, Callister and Patterson8,Reference Raben, Agerholm-Larsen and Flint9) , with protein eliciting the highest thermic response, followed by carbohydrates and fat(Reference Westerterp1). However, unlike REE, for which key determinants such as body composition and age are well-established, no consistent physiological factors (e.g. insulin resistance) or personal characteristics (e.g. age and physical activity levels) have been identified as reliable predictors of TEF. Factors such as age(Reference Calcagno, Kahleova and Alwarith4,Reference Tzeravini, Anastasios and Alexander10) , physical activities(Reference Calcagno, Kahleova and Alwarith4,11) , insulin resistance(Reference Calcagno, Kahleova and Alwarith4,Reference Tzeravini, Anastasios and Alexander10) and body weight and composition(Reference Tzeravini, Anastasios and Alexander10) have been proposed, but findings are inconsistent, most likely due to methodological differences in TEF methodology(Reference Granata and Brandon12). In addition, sex and hormonal status may also influence TEF. Accordingly, a few studies have observed sex-based differences, with females exhibiting a lower TEF than men(Reference Gougeon, Harrigan and Tremblay13–Reference Leenen, van der Kooy and Deurenberg15). For example, Gougeon et al. found that, after a standardised mixed meal, weight-stable females living with obesity had a 20 % lower TEF than men, both in absolute terms and relative to meal energy content, independent of age and degree of adiposity(Reference Gougeon, Harrigan and Tremblay13). They suggested that this difference could result from lower meal-induced increases in catecholamines or reduced responsiveness to these hormones(Reference Gougeon, Harrigan and Tremblay13). What is more, menstrual cycle phase(Reference Piers, Diggavi and Rijskamp16,Reference Tai, Castillo and Pi-Sunyer17) , oral contraceptive use(Reference Duhita, Schutz and Montani18) and biological sex(Reference Duhita, Schutz and Montani18) have also been shown to exert effects on TEF, suggesting that interindividual differences in hormone levels, such as follicle-stimulating hormone (FSH), could be related to the interindividual variability of TEF.
Although studies suggest a between-subject coefficient of variability in TEF of approximately 20 %(Reference Houde-Nadeau, De Jonge and Garrel19,Reference Piers, Soares and Makan20) , possibly due to differences in digestive and metabolic efficiency(Reference Houde-Nadeau, De Jonge and Garrel19), individual differences remain incompletely understood. This raises the question: is TEF determined solely by what we eat, or also by physiological or individual characteristics? Based on the existing literature, we selected a set of predictors that have been previously proposed to influence TEF, including body composition, age, sex, hormonal status and metabolic factors, to explore which variables best account for interindividual variability in this population. In this secondary exploratory analysis, we took advantage of a well-phenotyped cohort of pre-menopausal females(Reference Duval, Prudhomme and Rabasa-Lhoret21) to examine the relative contribution of these predictors to TEF and identify factors that may help explain the observed between-subject variability.
Methods
The 5-year longitudinal MONET study investigated the impact of the menopausal transition on several outcomes measured at baseline (Year 1) and annually for 5 years. Details on the MONET study design and recruitment can be found elsewhere(Reference Abdulnour, Doucet and Brochu22). Eighty-six premenopausal females who had all necessary outcomes were included. These females were also included based on the following criteria: (1) confirmed premenopausal status, defined as having had at least two menstrual cycles in the past 3 months, no increase in cycle irregularity (menstrual cycles shorter than 21 d or longer than 35 d) in the 12 months prior to testing and a plasma FSH level < 30 IU/l for verification; (2) age between 47 and 55 years; (3) non-smoker; (4) BMI between 20 and 29 kg/m2 and (5) self-reported weight stability (±2 kg) for at least 6 months prior to enrollment. Non-inclusion criteria were (1) pregnancy or having plans to become pregnant, (2) medical problems that could have interfered with outcome variables, including cardiovascular and/or metabolic diseases, (3) taking oral contraceptives or hormone therapy, (4) high risk for hysterectomy and (5) history of drug and/or alcohol abuse. 91 Caucasian females completed the 5-year study. At baseline (year 1), TEF was measured in ninety-two premenopausal females, of whom eighty-six had complete data for all variables analyzed. This study received approval from the University of Ottawa and the Montfort Hospital ethics committees (H 06-03-07), and written consent was obtained from each participant. This study conformed to the principles of the Declaration of Helsinki.
Measurements
Full descriptions of each outcome measurements can be found elsewhere(Reference Duval, Prudhomme and Rabasa-Lhoret21,Reference Abdulnour, Doucet and Brochu22) .
Anthropometric measurements
Body weight and height were measured using a BWB-800AS digital scale and a Tanita HR-100 stadiometer (Tanita Corporation of America Inc.), respectively, with participants wearing a hospital gown and no shoes. Body composition (% body fat, fat mass, fat-free mass) was assessed using dual-energy X-ray absorptiometry with the GE-LUNAR Prodigy module (GE Medical Systems). In our laboratory, the coefficient of variation for percentage body fat measured in twelve healthy individuals was 1·8 %, with a correlation coefficient of r = 0·99.
Resting energy expenditure and thermic effect of feeding
REE and TEF were measured via indirect calorimetry using a Deltatrac II metabolic cart (SensorMedics, Yorba Linda) with a ventilated canopy (flow rate set at 42 l·min−1). REE was assessed over a 30-min period following a 12-h overnight fast, with participants resting quietly in a supine position for 20 min prior to the measurement. Participants were tested during days 1–8 of the follicular phase to minimise the impact of menstrual cycle phase. Participants were instructed to refrain from vigorous physical activity, alcohol and medications in the 24 h prior to testing. To ensure data stability, the first and last 5 min of the measurement were excluded, and only the values from minutes 6 to 25 were used in the final REE calculation. After REE measurement, participants consumed a standardised breakfast within 10 min. The meal provided 575 kcal (2400 kJ) and consisted of two slices of whole wheat bread (80 g), peanut butter (20 g), raspberry jam (20 g), cheddar cheese (27 % milk fat, 20 g) and orange juice (250 ml). The macronutrient distribution was 57 % carbohydrates, 13 % protein and 30 % fat, with a food quotient of 0·89. For postprandial EE, 15-min sampling periods were performed every 30 min for 3 h during the postprandial period (15–30, 45–60, 75–90, 105–120, 135–150 and 165–180 min) For each time point, the mean EE (kcal/min) was calculated. TEF was determined by subtracting REE from each of the six postprandial EE values. Total TEF was calculated by multiplying the mean EE at each time point by 30 min, then summing these six values to estimate TEF over the 180-minute postprandial period. TEF was also expressed as a percentage of the test meal’s energy content, representing the increase in EE above baseline REE. Energy expenditure was calculated using the Weir equation(Reference De V Weir23). The coefficient of variation and correlation for REE measurements in our laboratory using the Deltatrac II system were 2·3 % and r = 0·98, respectively, based on repeated REE assessments performed on separate days in 12 healthy subjects.
Cardiorespiratory fitness (VO2peak)
A progressive exercise stress test was performed to measure the participants’ VO2peak on a treadmill. The participants were asked to refrain from any vigorous exercise for 24 h and consumption of alcoholic beverages for 6 h before the test. They were also asked to abstain from eating and drinking coffee for 2 h before the test. The progressive test consisted of 3-minute stages on a treadmill with an increasing workload to the point of exhaustion. After a brief warm-up, participants performed the test protocol. The test was terminated when at least two of the following criteria were achieved: (1) predicted maximal heart rate was reached, (2) respiratory quotient was greater than 1·1, (3) oxygen consumption remained stable or decreased with an increase in workload or (4) rate of Borg-type scale reached 19 or higher. The highest oxygen consumption value attained during the test and meeting the criteria was considered as VO2peak reached during the test. Breath-by-breath samples of expired air were collected through a mouthpiece throughout the test while participants were also wearing a nose-clip. Measurements of oxygen consumption, carbon dioxide consumption and respiratory exchange ratio were made automatically using a Vmax 229 series metabolic cart (SensorMedics Corporation, Yorba Linda). Prior to each measurement, the flow meter was calibrated using a certified syringe, and gas analysers were calibrated using a two-point calibration with ambient air and certified references gases (16 % O2 and 4 % CO2).
Blood sampling
Fasting samples were taken after a 12-h overnight fast. Plasma insulin concentrations were determined by radioimmunoassay using 125I-labelled human insulin and a human insulin antiserum (Millipore, St. Charles). Plasma glucose levels were determined using spectrophotometric analysis after conversion of glucose to glucose-6-phosphate by hexokinase (Sigma-Aldrich Canada Ltd.; Fisher Scientific Limited). IR was estimated using homeostasis model assessment using the following equation: homeostasis model assessment-IR = (fasting glucose × fasting insulin)/22·5. Finally, FSH was measured on an automated immunoassay analyser, the Beckman Coulter DxI Unicell 800 (Beckman Coulter). All measures of blood profile presented a coefficient of variation of less than 15 %.
Dietary assessment – food diary
Habitual energy and macronutrient intakes were assessed with a 7-d food diary, following the laboratory testing session, as previously described(Reference Duval, Prudhomme and Rabasa-Lhoret24). The time and place of eating of food were also recorded. Participants received oral and written instructions on recording their food intake. Recorded data were carefully verified upon return of the food diary to obtain forgotten data or correct misreported data. The diaries were analysed with Food Processor SQL program (version 10.8; ESHA Research) using the 2007 Canadian Nutrient Data File.
Statistical analysis
Sample size calculations were performed with G*Power 3·1 software. Using a small effect size (f² = 0·02), an α = 0·05 and β = 0·80, with seven predictors yielded a total sample size of 80 participants.
Statistical analyses were performed using SPSS (Statistical Product and Service Solutions software, version 29.0), with the significance level set at α = 0·05. Stepwise multiple linear regression analyses were conducted to identify potential predictors of TEF in this cohort of premenopausal females.
Anthropometric variables (total fat mass, fat-free mass and BMI), VO2peak, markers of glycemic control (glucose, insulin and homeostasis model assessment), REE, daily protein intakes and FSH were examined as potential predictors, based on findings from the existing literature. Age was not examined as a predictor because eligibility criteria restricted participants to a narrow age range (47–55 years), resulting in a highly homogeneous cohort with limited age-related variability. Similarly, menstrual cycle phase could not be examined as a predictor because all women were tested during the same phase of the menstrual cycle (follicular phase, days 1–8), and oral contraceptive use was an exclusion criterion. Consequently, there was insufficient variability in these factors to assess their independent associations with TEF.
Prior to model building, assumptions of linearity, normality and homoscedasticity were checked, and multicollinearity was assessed using variance inflation factors. To minimise collinearity and improve interpretability, highly correlated variables (variance inflation factor > 5) were not included in the same model. Different statistical models were tested to explore the individual and combined contribution of each predictor to variance in TEF. Final model selection was guided by theoretical relevance, statistical significance and improvements in adjusted R². Final model selection was guided by theoretical relevance, statistical significance and improvements in adjusted R². Model fit was primarily evaluated using the proportion of variance explained (adjusted R²) and the overall F-test for significance. Stepwise regression using a backward elimination procedure was applied: at each step, the predictor with the highest P value was removed, and this process continued until all remaining predictors met the significance criterion of P < 0·05.
Results
Participant characteristics and the predictors included in the analyses are presented in Table 1. Additional details, including blood parameters, can be found in previously published articles(Reference Duval, Prudhomme and Rabasa-Lhoret21,Reference Abdulnour, Doucet and Brochu22,Reference Duval, Prudhomme and Rabasa-Lhoret24) .
Participant characteristics *
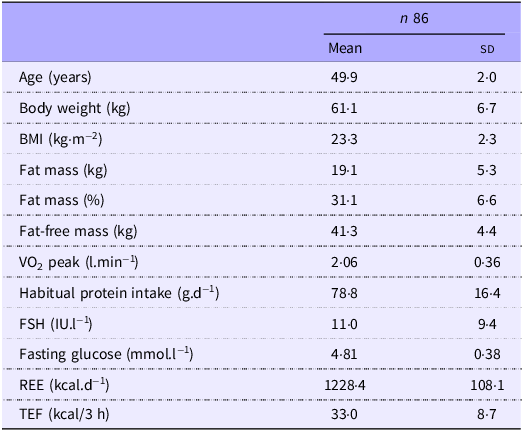
Results are mean (sd). VO2 peak, peak oxygen consumption; FSH, follicle-stimulating hormone; RMR, resting energy expenditure; TEF, thermic effect of food.
* Data presented in this table slightly differ from previously published papers on this study given the different number of individuals included in the analyses.
In this sample, TEF ranged from 14·3 to 66·1 kcal over 180 min, with a mean value of 33 (sd 8·7) kcal. This corresponded to an approximately 22 % increase above REE over the duration of the measurement.
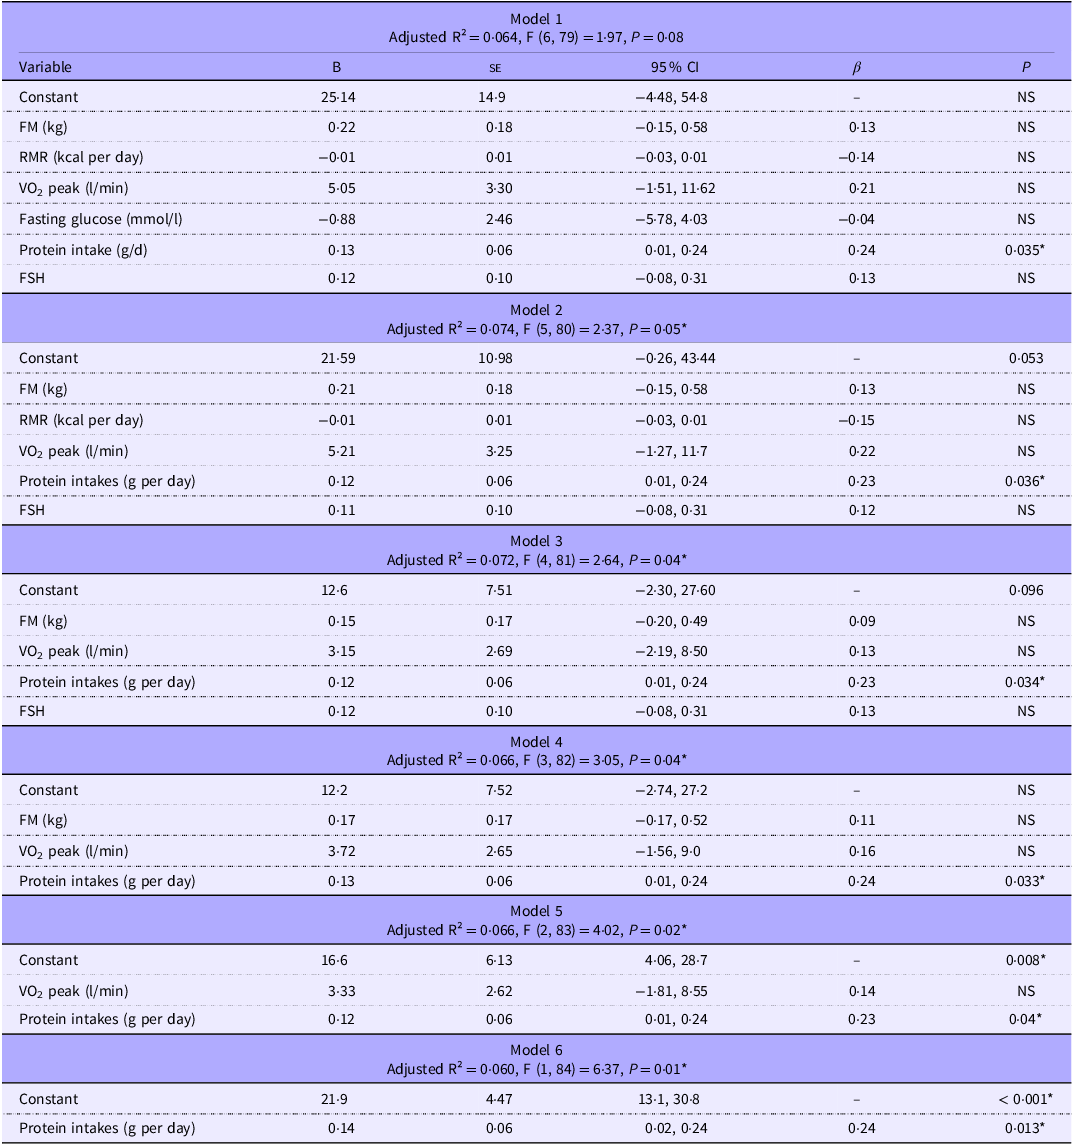
Because of multicollinearity among body composition variables, only total FM was retained in the multiple regression models, as it provided slightly better model fit than FFM (FM only: R square = 0·09, F (1, 90) = 0·85, P = 0·36 v. FFM only = R square: 0·08, F (1, 90) = 0·71), P = (0·40). Among glucose metabolism variables, fasting glucose was chosen over insulin and homeostasis model assessment-IR for the same reason. A backward elimination procedure was applied to remove non-significant predictors sequentially and improves model parsimony. Models are presented in Table 2.
Stepwise multiple regression models predicting the thermic effect of food

FM, fat mass; RMR, resting metabolic rate; VO2 peak, peak oxygen consumption; FSH, follicle-stimulating hormone *(P < 0·05). Dependent variable: TEF, thermic effect of Food; NS, non-significant.
Stepwise regression showed that daily protein intakes were the only consistent and statistically significant predictor of TEF across all models. Removal of non-significant predictors (FM, REE, VO2, fasting glucose and FSH) resulted in minimal changes to the proportion of explained variance (adjusted R² ranging from 0·060 to 0·074). The most parsimonious model, which included protein intakes alone, explained 6 % of the variance in TEF and demonstrated a positive association (β = 0·14, P = 0·013). Supporting this finding, Pearson correlation analysis revealed a moderate positive association between habitual daily protein intakes and TEF (r(88) = 0·24, P = 0·023), indicating that higher protein intakes were associated with greater TEF.
Discussion
Despite previous research suggesting different potential predictors of TEF, our study only found daily protein intakes from 7-d dietary records to be a statistically significant predictor of TEF. However, daily protein intakes alone explain only a small portion of the variance in TEF between subjects (∼6 %), suggesting that most of the variability in TEF is driven by other, unmeasured factors in the current study or random variations. Houde-Nadeau et al. found that between-subject variability in TEF was twice as high as within-subject variability (24·1 % v. 10·7 %, respectively) after a 6-h measurement(Reference Houde-Nadeau, De Jonge and Garrel19). However, it remains unclear where this between-subject variability stems from. Adding physiological variables, such as FM, VO2peak and FSH, slightly improves the model fit, but reported daily protein intakes remained the only consistent significant predictor. Variables such as REE and fasting glucose did not significantly improve prediction of TEF in this sample. Even in a well-phenotyped cohort of healthy premenopausal females, we did not identify meaningful predictors of TEF inter-individual variability.
In a review by Granata et al., it was reported that glucose tolerance and insulin resistance could be potential factors affecting TEF variability(Reference Granata and Brandon12). It has been shown that individuals with type 2 diabetes, glucose intolerance and/or compensatory hyperinsulinaemia exhibit a reduced TEF, possibly due to a reduced sympathetic response following food intake(Reference Granata and Brandon12) and reduced glucose uptake and storage(Reference Armellini, Zamboni and Mino25). The present work was conducted among healthy females, without diabetes or glucose intolerance, which may explain the lack of significant findings related to fasting glucose levels.
Another subject-related factor that may influence TEF is physical fitness(Reference Granata and Brandon12). Although findings are inconsistent, some studies report a positive association between TEF and maximal oxygen consumption(Reference Davis, Tagliaferro and Kertzer26,Reference Hill, Heymsfield and McMannus27) , while others have found the opposite. These discrepant results may again reflect methodological differences, such as participant age, duration of TEF measurement or meal composition. In addition, the intensity of habitual exercise may influence TEF differently, with moderate and high-intensity activity potentially having distinct effects. Tataranni et al. also reported a positive correlation between TEF and the level of spontaneous physical activity in a heterogeneous adult population of 471 individuals(Reference Tataranni, Larson and Snitker28). In their study, spontaneous physical activity and fasting plasma glucose concentration were the only significant determinants of TEF (explaining 15 % of variance). Interestingly, in the present analyses, VO2peak emerged as a significant predictor of TEF only when protein intakes were excluded from the model. This pattern suggests a degree of shared variance between VO2peak and dietary protein intakes, possibly reflecting underlying associations between cardiorespiratory fitness and nutritional habits, potentially reflecting that individuals with higher fitness may be more health conscious and prioritise protein to support performance, recovery or muscle gain, consistent with evidence that those shaping their diet for weight loss or athletic performance often focus on protein despite widespread confusion about what constitutes a healthy diet(Reference Vaccaro, Guarino and Danza29).
When both variables were included in the model, protein intakes remained a significant predictor while VO2peak did not, indicating that proteins consumption may exert a more direct or independent effect on TEF, albeit it must be reiterated that reported daily protein intakes still only explain less than 5 % of the variance. Participants had a mean VO2peak of 33·8 (sd 6·0) ml·kg−1·min−1 (range: 20·9–52·0 ml·kg−1·min−1), corresponding to absolute values of 2·05 (sd 0·36) l/min (range: 1·28–2·96 l/min; CV = 17·4 %). Despite some heterogeneity in fitness levels within the study population, VO2peak did not independently predict TEF.
Prior research highlights mixed findings regarding physiological determinants of TEF. For example, Armellini et al. (Reference Armellini, Zamboni and Mino25) reported that, in premenopausal females, TEF was explained (25 % of variance) by a combination of fasting insulin, FFM and visceral and subcutaneous adipose tissue. Fasting insulin and FFM were negative predictors, whereas both fat depots were positive predictors (standardised contributions: 26 %, 20 %, 31 % and 23 %, respectively). When adjusting for the joint influence of these variables, individual correlations were no longer significant, suggesting that TEF is determined by their combined effect rather than any single factor. Notably, participants with lower body fat and elevated fasting insulin (some of whom with insulin resistance) exhibited the lowest TEF, possibly due to reduced glucose uptake and storage associated with insulin resistance, whereas participants without insulin resistance showed more similar TEF values, likely reflecting differences in body composition and insulin sensitivity.
In contrast, Reed et al. reported a positive correlation between the area under the TEF curve and FFM and a negative correlation with FM(Reference Reed and Hill30). However, their analysis combined baseline TEF measurements from different studies with a wide range of subjects, where some meals were fixed and others were adjusted based on participants’ usual energy intake from dietary records. When meal size was scaled to energy requirements, individuals with higher FFM were likely to consume larger meals, which in turn elicited a greater TEF. In a study comparing lean adolescents to those with obesity, but matched for FFM, researchers found that the best predictor of TEF was body fat percentage (R = −0·53; P = 0·03)(Reference Salas-Salvadó, Barenys-Manent and Recasens Gracia31). Adolescents with obesity had a blunted TEF compared with their lean counterparts. Similar results were observed in a study comparing TEF in sedentary lean men v. those living with obesity(Reference Dabbech, Boulier and Apfelbaum32). Both groups had similar levels of FFM, but significant different levels of FM. TEF was found to be negatively correlated with percent and absolute FM. Conversely, Du et al. reported that FFM, age, sex, body fat and fat distribution were not independent predictors of TEF in 209 healthy adults after controlling for meal size(Reference Du, Rajjo and Santosa33).
The present study did not identify physiological markers as significant predictors and reported protein intakes explained only ∼5 % of TEF variance. These discrepancies may reflect differences in population characteristics. For instance, the heterogeneity of participant characteristics, including body composition or metabolic measures, may influence the ability to detect significant predictors of TEF. In populations with limited variability, some associations may be attenuated. Differences in participant profiles between studies may partly explain discrepancies in findings and highlight the importance of considering population characteristics when interpreting TEF analyses.
It is also plausible that TEF is driven by complex interactions among metabolic and body composition factors, such as fat mass distribution, fat-free mass and insulin sensitivity, rather than single predictors, as suggested by Armellini et al. (Reference Armellini, Zamboni and Mino25).
Protein intakes are known to elicit a greater postprandial energy expenditure (20–30 % of ingested energy) compared with carbohydrates (5–10 %) and fat (0–3 %)(Reference Jéquier34). Most evidences come from studies comparing meals with varying macronutrient compositions and measuring TEF immediately after consumption(Reference Raben, Agerholm-Larsen and Flint9,Reference Nagai, Sakane and Moritani35–Reference Petzke and Klaus37) . In the present study, all participants received the same standardised test meal; however, their habitual macronutrient and energy intake were assessed using a 7-d food diary. These findings suggest that individuals’ usual protein intakes may modulate TEF. This imply that the heightened thermogenic response to protein-rich meals could extend beyond the immediate postprandial period. A study looking at prolonged consumption (56 d) of high, normal and low protein diets (5 %, 15 % and 25 % of total energy intake, respectively) reported no difference in TEF following a standard test meal at the end of the study(Reference Sutton, Bray and Burton38). At the start of the study, TEF was moderately correlated with protein intakes (r = 0·53, P = 0·007), while after 56 d, TEF remained significantly higher in the high-protein group compared with the normal-and low-protein groups. TEF did not significantly change from Day 1 to Day 56 within any group, indicating no evidence of metabolic adaptation despite prolonged differences in protein intakes(Reference Sutton, Bray and Burton38). The authors suggest that TEF is primarily regulated by acute protein and energy intakes and does not correspond to a physiological response that can be permanently modified by changes in the diet. They also report that even though participants were consuming the same food and living in the same controlled environment, there was a 10 % variation in TEF response(Reference Sutton, Bray and Burton38).
Interestingly, Duhita et al. examined whether sex and oral contraceptive pill (OCP) use influence thermogenic response to a high-protein meal in twenty-one healthy young adults (seven men, seven females not using OCP and seven females using OCP)(Reference Duhita, Schutz and Montani18). They found differences among all groups. Males showed clear dose–response increases in PPEE with increasing meal protein intakes. In contrast, females not using OCP reached a plateau at < 23 % protein intakes, while females taking OCP showed no significant PPEE differences across meals, despite similar body size across groups. These results highlight the potential influence of sex and hormonal status on protein-induced PPEE, suggesting that TEF responses may not be uniform even among healthy adults. Physiological factors such as sex hormones or OCP use may modulate the sensitivity of TEF to protein intakes, highlighting interindividual variability. Thus, given the potential of hormonal status to influence TEF, FSH was included as a predictor, although it did not explain variability in TEF in this well-phenotyped cohort of women. In addition, although not examined in the present study because all participants were tested during the follicular phase, menstrual cycle phase may also influence TEF. A decrease in TEF during the luteal phase has been reported in eight healthy normal-weight women(Reference Tai, Castillo and Pi-Sunyer17), whereas an increase in TEF during the luteal phase was observed in a cohort of well-nourished Indian women(Reference Piers, Diggavi and Rijskamp16). The inconsistent findings suggest that the effect of menstrual cycle phase on TEF remains unclear, and future studies examining determinants of TEF should account for menstrual cycle phase. While this standardisation reduced hormonal variability in the present study, it may also have limited the ability to detect hormone-related contributors to interindividual variability in TEF.
Overall, the small amount of variance accounted for by the predictors indicates that TEF may represent a relatively stable physiological trait in healthy premenopausal females, or that factors not explored in this analysis explain the variance between individuals. Potential future avenues include investigating the influence of menstrual cycle phase on TEF in women, the role of the gut microbiota in TEF variability and further exploring the impact of habitual protein intakes on TEF responses.
Limitations and strengths
A limitation of this study is the potential sampling bias related to participant demographics. All participants were healthy females who were able and willing to take time off from work to complete the testing protocol annually for 5 years. This may reflect a population with higher socio-economic status, which can influence both lifestyle factors and metabolic health. As a result, our findings may not be generalisable to broader or more diverse populations. This lack of variation in participant characteristics may partly explain the absence of significant predictors of TEF in our study, whereas comparing metabolically distinct populations (e.g. individuals with obesity v. lean individuals) might reveal clearer associations. Second, participants’ meals on the day prior to testing were not standardised, which may have influenced TEF measurements. In addition, the TEF measurement period in this study was limited to 180 min. While this duration is commonly used(Reference Duhita, Schutz and Montani18,Reference Hill, Heymsfield and McMannus27,Reference Blundell, Cooling and King36) , data suggest that a 6-h measurement window is necessary to fully capture the total TEF response(Reference Granata and Brandon12,Reference Reed and Hill30,Reference Kunz, Klaus and Kallies39) . However, the present work represents a secondary analysis of an initial study with different starting hypotheses. Segal et al. reported that a 3-h measurement may capture only 60–70 % of the total TEF, but that a 3-h window may capture between-group differences in TEF(Reference Reed and Hill30,Reference Segal, Edaño and Tomas40) . However, as noted by Reed and Hill, shorter measurement durations may increase the likelihood of detecting differences between individuals with obesity and lean individuals, which often diminish or disappear with longer measurements(Reference Reed and Hill30,Reference Kunz, Klaus and Kallies39) . In the present study, the relatively homogeneous characteristics of participants could have limited the variability in TEF responses, potentially explaining the absence of significant predictors.
On the other hand, the well-phenotyped cohort also represents a strength of this study, as it reduces variability from confounding factors such as age, menopausal status and metabolic disease, enabling a more precise assessment of potential predictors of TEF in this population. The relatively large sample size (n 87 with complete data) and the use of rigorous, standardized methods (e.g. dual-energy X-ray absorptiometry, indirect calorimetry) allowed for comprehensive exploration of multiple predictors. Additionally, this secondary analysis leveraged a well-established cohort, facilitating the investigation of inter-individual variability in TEF within a controlled and highly phenotyped population.
Conclusion
In conclusion, protein intakes from dietary records emerged as the sole significant predictor of TEF in healthy females just before the menopausal transition. Nonetheless, it explained only a modest proportion of the variance and the inclusion of factors such as FM, REE, VO2peak and FSH offered little additional explanatory value, suggesting that TEF may be relatively stable and less influenced by these variables in a population of healthy females just before the menopausal transition.
Acknowledgements
We thank all participants for taking part in our study.
This study was funded by the Canadian Institutes of Health Research (Grant #63279).
É. D. and M. B.: conceptualisation and methodology and funding. É. D.: data collection. É. D. and N. B.: Data analysis and manuscript preparation. É. D., D. T., L. I. and M. B. manuscript review and editing. All authors read and approved the final version of the manuscript and accepted responsibility for the decision to submit for publication.
The authors declare no conflict of interest.


 Open access