


1. Introduction
Inequities in the distribution of environmental pollutants have been the focus of major studies in developed countries since the 1970s (Banzhaf et al., Reference Banzhaf, Ma and Timmins2019). Studies document systematic differences in exposure to air and water pollution and proximity to toxic sites based on income, race, i.e., minority populations (Ash and Boyce, Reference Ash and Boyce2018), and political activism (Currie et al., Reference Currie, Voorheis and Walker2023). Exposure to environmental hazards such as ambient air pollution has severe health impacts (Currie and Walker, Reference Currie and Walker2011; Landrigan et al., Reference Landrigan, Fuller, Acosta, Adeyi, Arnold, Basu, Baldé, Bertollini, Bose-O'Reilly, Boufford, Breysse, Chiles, Mahidol, Coll-Seck, Cropper, Fobil, Fuster, Greenstone, Haines, Hanrahan, Hunter, Khare, Krupnick, Lanphear, Lohani, Martin, Mathiasen, McTeer, Murray, Ndahimananjara, Perera, Potočnik, Preker, Ramesh, Rockström, Salinas, Samson, Sandilya, Sly, Smith, Steiner, Stewart, Suk, van Schayck, Yadama, Yumkella and Zhong2018; Deryugina et al., Reference Deryugina, Heutel, Miller, Molitor and Reif2019), the primary motivation for environmental regulation. Understanding the degree of inequality in the distribution of environmental hazards is thus an important step in understanding the well-being of disadvantaged communities and developing policies to alleviate hardships.
This paper provides the first comprehensive analysis of inequities in the distribution of air pollution in Mexico. Ambient air pollution studies are limited in developing countries despite its large disease burden and related income shocks. Our findings have important policy implications that cut across environmental regulation and disparities in health burden due to long-term exposure to particles less than 2.5 micrometers in diameter, known as PM2.5 pollution (Lopez-Feldman et al., Reference Lopez-Feldman, Heres and Marquez-Padilla2021). Recent evidence using air monitoring data for two years in Mexico City reports significant geographic and meteorological variability associated with air pollution exposure and its spatial relationship with socioeconomic characteristics (García-Burgos et al., Reference García-Burgos, Miquelajauregui, Vega, Namdeo, Ruíz-Olivares, Mejía-Arangure, Resendiz-Martinez, Hayes, Bramwell, Jaimes-Palomera, Entwistle, Núñez-Enríquez, Portas and McNally2022).Footnote 1 We build on this limited evidence base by investigating differential burden of locality-level air pollution based on socioeconomic status, for the entire country.
To explore our questions, we analyze 15 years of fine particulate matter, PM2.5, measured at a 0.01 degree by 0.01-degree resolution from 2001 to 2015. These data represent an important innovation in tracking environmental quality and regulation, especially for developing countries. Monitoring data on annual concentrations to study changes in pollution over several years is not available for Mexico. Prior studies either focus on Mexico City or conduct cross-sectional analysis on large metropolitan areas. We merge our detailed PM2.5 data with socioeconomic status of more than 116,500 localities. To capture racial disparities, we include a measure of the proportion of indigenous population. For each locality, we match air pollution with its socioeconomic status and racial composition.
We find evidence of inequity in the distribution of annual average PM2.5 concentrations. Our panel data models show that air pollution increased in areas that experienced a decline in socioeconomic status. A one standard deviation increase in the social lag index is associated with a 0.24 per cent increase in annual average PM2.5 concentrations.Footnote 2 For robustness, we utilize an alternative socioeconomic indicator called the marginalization index. The magnitude of the coefficient on marginalization index is almost fourfold, at 0.83 per cent. We do not find consistent evidence on racial disparities as the coefficient on the share of indigenous population switches sign from positive to negative upon inclusion of municipality-level yearly interactions.
We make three contributions to the environmental justice literature. First, we provide comprehensive evidence on discrepancies in distribution of local air pollution based on socioeconomic status, for a large developing economy. Second, the rich satellite data on particulate matter concentration provides direct empirical evidence on the disproportionate distribution of a local toxic pollutant that is severely detrimental to health. Third, we explore issues that are difficult to understand with less data, including possible mechanisms driving the environmental inequity in air pollution.
We find that an increase in political participation captured by municipality voter turnout reduces the magnitude of inequity in locality-level air pollution. Contrary to our expectations, we find that a higher share of manufacturing activities in the municipality somewhat drives down locality-level air pollution in poorer regions, and denser municipalities experience an increase in the magnitude of environmental inequity. We infer evidence of political engagement mechanisms; no evidence on more manufacturing firms locating in poorer localities; and no evidence on the Coasian bargaining mechanism or community pressure as densely populated urban municipalities experience higher pollution levels in poorer localities. Evidence points to an increased contribution of nonpoint sources of air pollution in highly dense areas.Footnote 3
2. Background on air pollution and environmental inequities
2.1 Air pollution and health in Mexico
Particulate matter pollution in Mexico is primarily due to emissions from numerous dispersed sources like agricultural land and cities (73 per cent), followed by fixed sources such as power plants and industrial plants (21 per cent) and transportation-related mobile sources (6 per cent) (SEMARNAT, 2013). The environmental law in Mexico, General Ecological Balance, and the Environmental Protection Act or LGEEPA (its Spanish acronym), require that urban areas monitor emissions through regular monitoring and improve citizen awareness through knowledge dissemination of adverse effects of air pollution (SEMARNAT, 2018). Between 2000 and 2015, sulfur dioxide, nitrogen oxides, and PM10 concentrations were significantly reduced (Silva Rodríguez de San Miguel, Reference Silva Rodríguez de San Miguel2019). However, secondary pollutants such as ozone and PM2.5 did not significantly decline in the same period. In 2014, 13 Mexican cities including the three largest metropolitan zones failed to meet standards for PM and ozone. PM pollution across different urban areas of Mexico remains high mainly due to a lack of coordination between various governmental agencies at the federal, state, and municipal levels (SEMARNAT, 2018).Footnote 4
Air pollution causes respiratory and cardiovascular diseases (Landrigan et al., Reference Landrigan, Fuller, Acosta, Adeyi, Arnold, Basu, Baldé, Bertollini, Bose-O'Reilly, Boufford, Breysse, Chiles, Mahidol, Coll-Seck, Cropper, Fobil, Fuster, Greenstone, Haines, Hanrahan, Hunter, Khare, Krupnick, Lanphear, Lohani, Martin, Mathiasen, McTeer, Murray, Ndahimananjara, Perera, Potočnik, Preker, Ramesh, Rockström, Salinas, Samson, Sandilya, Sly, Smith, Steiner, Stewart, Suk, van Schayck, Yadama, Yumkella and Zhong2018). The World Health Organization (WHO) publishes guidelines for air pollution thresholds to protect public health. The developing world bears more than half of this health burden. The PM2.5 ambient standard is ten micrograms per cubic meter. Most primary pollutants, such as NO2, SO2, ultrafine particles, toxic pollutants such as lead, and volatile organic compounds (VOCs), are positively correlated. These undergo chemical changes to determine secondary pollutants such as ozone and PM. Hence, focusing on PM2.5 is not limiting due to the severe health impacts of exposure to fine particulate matter. In Mexico, the ambient standard for annual PM2.5 concentrations is 12 micrograms per cubic meter (SEMARNAT, 2016).
Previous evidence on significant adverse impacts from exposure to air pollution in Mexico comes from various sources. According to the National Statistical Agency (INEGI, 2016), direct and indirect health impacts and productivity sum up to 3.2 per cent of its GDP. INECC (2014) reported that reducing PM2.5 exposure from the current standards to the WHO guidelines in the three largest metropolitan areas of Mexico City, Monterrey, and Guadalajara would have resulted in 853 premature deaths being avoided in 2010. The monetary estimate of social costs avoided was eight billion pesos (in 2010 prices). Another study conducted in multiple cities (CMM, 2015) reported that the same target would reduce premature deaths due to cardiovascular diseases by 17 per cent, ischemic heart diseases by 18 per cent, and pulmonary diseases by 12 per cent.
Hanna and Oliva (Reference Hanna and Oliva2015) find adverse effects of air pollution on labor supply in Mexico City. Arceo et al. (Reference Arceo, Hanna and Oliva2016) find differences in the dose-response between air pollution and infant mortality. More recently, Trejo-González et al. (Reference Trejo-González, Riojas-Rodriguez, Texcalac-Sangrador, Guerrero-López, Cervantes-Martínez, Hurtado-Díaz, de la Sierra-de la Vega and Zuñiga-Bello2019) found that reducing PM2.5 exposure to the WHO guideline of 10 micrograms per cubic meter would have prevented 14,666 deaths and 150,771 potential years of life lost in 2015. The costs of this disease burden were estimated at 64,164 and 5,434 million dollars, respectively. The authors use mostly cross-sectional data that include data from 62 monitoring stations from ten cities in 2013 (113 municipalities) and data from 71 monitoring stations from fifteen cities in 2015 (121 municipalities). They find that reducing PM2.5 concentrations in the Mexican cities studied would reduce mortality by 8.1 per cent.
2.2 Past studies on environmental inequities
Environmental inequities are studied extensively utilizing the Toxic Releases Inventory of North America (Banzhaf et al., Reference Banzhaf, Ma and Timmins2019). Recent studies document empirical evidence of inequities in exposure to pollution based on income and race. Currie et al. (Reference Currie, Voorheis and Walker2023) overcome the data limitations in previous environmental justice studies by considering ambient PM2.5 concentrations from satellite imagery and machine learning tools for the contiguous U.S. Colmer et al. (Reference Colmer, Hardman, Shimshack and Voorheis2020) utilize extensive fine-scale estimates of PM2.5 data using a combination of monitoring and satellite imaging data from Meng et al. (Reference Meng, Li, Martin, van Donkelaar, Hystad and Brauer2019).
The evidence from Mexico is mainly from the border regions, focusing on the maquiladoras (manufacturing plants that can import components and export assembled goods under special trade rules). Given data constraints, most provide indirect evidence of environmental inequities for border cities. Information on the distance to facility or density of industrial parks is used as proxies for exposure to pollution and finds no evidence of more marginalized communities living close to the plants (Grineski et al., Reference Grineski, Collins and Aguilar2015). As mentioned in Sullivan and Krupnick (Reference Sullivan and Krupnick2018), this kind of spatial information provides incomplete evidence on exposure as air transport and other mobile pollution sources determine ambient air pollution levels.
Ours is the first study that considers ambient air pollution and its relationship with socioeconomic status across the entire country. A recent study, limited to urban areas of Mexico (Chakraborti and Shimshack, Reference Chakraborti and Shimshack2022), utilizes self-reported toxic water pollutant discharges by major polluters. The only recent evidence on air pollution (García-Burgos et al., Reference García-Burgos, Miquelajauregui, Vega, Namdeo, Ruíz-Olivares, Mejía-Arangure, Resendiz-Martinez, Hayes, Bramwell, Jaimes-Palomera, Entwistle, Núñez-Enríquez, Portas and McNally2022) comes from spatial autocorrelations reported for Mexico City using monthly monitoring data from 2017–2019. Lome-Hurtado et al. (Reference Lome-Hurtado, Touza-Montero and White2020) investigate whether poorer residents in Mexico City have higher health burdens, but they do not include pollution.
3. Data
3.1 Air pollution data
We obtain air pollution data for Mexico from Hammer et al. (Reference Hammer, van Donkelaar, Li, Lyapustin, Sayer, Hsu, Levy, Garay, Kalashnikova, Kahn, Brauer, Apte, Henze, Zhang, Zhang, Ford, Pierce and Martin2020). This data contains annual average PM2.5 concentrations at a 0.01 degree by 0.01-degree resolution from 1998 to 2016. We spatially intersect this gridded, raster data with the boundaries of different administrative units (municipalities and localities) relevant for matching with census data in Mexico. This satellite-derived pollution data predicts ground-level pollution concentrations for out-of-sample locations where monitoring data is unavailable. See Fowlie et al. (Reference Fowlie, Rubin and Walker2019) for a detailed description of satellite derived PM2.5 estimates. The estimates combine observations of aerosol optical depth from several satellite instruments with ground-level observations of PM2.5 from monitors and a chemical air transport model in a geographically weighted regression setting.
We utilize remote sensing pollution data for the entire country of Mexico. We are not the first to utilize this type of data (Gutierrez, Reference Gutierrez2010). Lopez-Feldman et al. (Reference Lopez-Feldman, Heres and Marquez-Padilla2021) use municipality-level average exposure to PM2.5 for the Mexico City Metropolitan Area (MCMA). We project annual average PM2.5 estimates to the level of localities' administrative units of Mexico. Of more than 100,000 localidades (localities), about 4,000 are considered urban with well-defined boundaries of roughly 5 square km. By contrast, there are more than 2,000 municipalities roughly 800 square km on average.Footnote 5 We use PM2.5 data from 2001 to 2015, as socioeconomic status data are available every five years and we consider the following years: 2000, 2005, and 2010. To avoid reverse causality, we assign lagged socioeconomic data to three periods equally divided into five years: 2001–2005, 2006–2010, and 2011–2015.
In figure A1 in the online appendix, we examine long-term trends (2001–2015) for the entire country divided into six geographic regions. The annual average PM2.5 concentrations in the central region were double the WHO 2005 guidelines, around 20 micrograms per cubic meter. This region includes MCMA, recording among the highest air pollution levels, including PM2.5, in the world. The western and southern regions' annual averages were around 11 micrograms per cubic meter, with a somewhat downward trend for the West and no significant downward trend for the South. The Northeast region followed with PM2.5 concentrations of 8.6 micrograms per cubic meter from 2001–2015, and a downward trend. The Northwest and Southeast had the lowest regional average concentrations, near 4 and 5 micrograms per cubic meter, respectively, with no clear patterns.
3.2 Socioeconomic status
For robustness, we utilize two separate indices of socioeconomic status (SES) published by the Mexican government. First, we consider the social lag index or IRS (its Spanish acronym) to capture multidimensional poverty or SES published by the National Council for the Evaluation of Social Development Policy (or Consejo Nacional de Evaluación de la Política de Desarrollo Social in Spanish). Second, we use the marginalization index published by the Mexican National Population Council. A couple of other papers also utilize the marginalization index as an indicator of SES in Mexico (Escobar and Chavez, Reference Escobar and Chavez2013; Chakraborti and Shimshack, Reference Chakraborti and Shimshack2022). Both indices are estimated using principal component analysis. Both indices report five ordinal ranks of very high, high, medium, low, and very low. The range is from negative to positive numbers, with higher numbers indicating worse SES of the population.
The social lag index utilizes the following eleven indicators of SES, measured in percentages: population over 15 years of age that are illiterate, population over 15 without primary education complete, houses with mud floors, houses without drainage, houses without piped water, houses without electricity, houses without a refrigerator, houses without a washer, houses without sanitation services, population between 6 and 14 years old not attending school, and population without access to health services. The marginalization index includes only the first seven of the eleven variables used in the social lag index and the average household occupancy rate. Both indices are reported at the disaggregate spatial scale of localities.
We consider a second sociodemographic variable to capture variations in racial composition. The variable is the share of the population that speaks an indigenous language. The data are available for each of the census years 2000, 2005, and 2010. The data are available at the disaggregate spatial scale of localities.Footnote 6
Figures A2 through A4 in the online appendix present the trends in average social lag index, marginalization index, and indigenous population, by region for the three census years: 2000, 2005, and 2010. The average social lag index and marginalization index did not change notably for the most polluted Central region. In the South and West regions, the second and third most polluted regions, average social lag index and marginalization index also did not exhibit any trends with a small decline in 2005 followed by increases in 2010 to levels in 2000. The fourth most polluted region of Northeast exhibits somewhat of an increasing trend in both average social lag index and marginalization index. The only region with declining social lag index and marginalization index are in the Southeast where particulate matter pollution is one of the lowest in the country.
3.3 Other factors
We include controls for some time-varying factors correlated with pollution and SES, leading to omitted variable bias. We include a proxy for political participation to capture the level of community engagement. We include voter turnout that is available at the level of municipalities for presidential elections in 2000 and 2006 and mid-term elections in 2009.Footnote 7 We include population density available at the level of municipalities. This variable might capture urban/rural variations in air pollution and socioeconomic characteristics. The share of manufacturing activities is a proxy for local economic activities that could affect local pollution as well as SES through local labor force and employment effects. The share of manufacturing units is available from the Economic Censuses of 1999, 2004, and 2009.Footnote 8 This variable captures the number of economic units that belong to the manufacturing sector as a proportion of all economic activities (the other two sectors are services and businesses).
We include annual weather variables since the formation of some components of PM2.5 depends on temperature and precipitation levels. If there is significant variation in annual weather data, these controls capture changes in PM concentrations due to weather variations. Data on wind velocity is not available. Satellite weather data for municipalities is from Thornton et al. (Reference Thornton, Shrestha, Wei, Thornton, Kao and Wilson2020).
3.4 Summary statistics
Our final sample consists of 116,560 localities with information on annual mean PM2.5 pollution, social lag index, and population speaking an indigenous language. The controls and weather variables are available for 2,338 municipalities. These are population density, share of manufacturing activities, voter turnout, and annual temperature and precipitation.
Table A1 in the online appendix reports the average pollution levels from 2001 to 2015. The PM2.5 concentrations are for localities that cover the entire territory of Mexico. The annual average PM2.5 concentration was 11.6 micrograms per cubic meter for localities and 12.3 micrograms per cubic meter for municipalities. Both locality and municipality average concentrations were higher than the 2005 WHO guidelines for an annual mean PM2.5 of ten micrograms per cubic meter. However, annual mean pollution levels ranged from less than one microgram per cubic meter to over 30 micrograms per cubic meter, indicating considerable variability across localities and municipalities.
For the social lag index, table A1 reports average levels of −0.05 for localities and −0.10 for municipalities. According to this index, social lag was slightly higher in localities than in municipalities. For the marginalization index, socioeconomic deprivation was slightly higher in localities at 0.01 in contrast to municipalities at −0.09. Table A1 also includes descriptive statistics on the education, health, and living conditions related to census variables used to construct the social lag index. On average, social lag indicators for education, health, basic services, and housing and living conditions had higher percentages in localities when compared to the averages in municipalities. We note that small variations in the social lag index translate into substantially larger variations in the underlying socioeconomic variables.
For the racial composition indicator, on average, municipalities had a slightly higher share of the population that spoke an indigenous language, 21 per cent, in contrast to more disaggregate localities with 18.6 per cent of the population speaking an indigenous language.
On average, municipalities had a population density of 288 people per square km. The share of manufacturing was 19.5 per cent for municipalities in the sample. The average voter turnout was 54.6 per cent for the municipalities covered. The annual average temperature across municipalities was 20.5 degrees centigrade, and the average precipitation was 1010.7 mm.
4. Empirical strategy
Our empirical goal is to determine whether local air pollution increased in areas where SES deteriorated. We present the analysis at the disaggregated spatial scale of localities and exploit the availability of socioeconomic data at the aggregate scale of municipalities to address potential endogeneity concerns. We consider lagged socioeconomic and demographic indicators like race to control for the effects of reverse causality between pollution-poverty relationships. Since panel data models exploit within administrative unit variations, coefficients indicate that increases in neighborhoods' social lag index is associated with an increase air pollution. Identification comes from variations in SES and racial composition within localities.
We estimate a fixed-effects panel data model of annual mean PM2.5 pollution on lagged socioeconomic index and controls for annual weather variations and year fixed effects as follows:

In equation (1), the dependent variable is the log of annual mean PM2.5 concentrations for locality i in year t. The primary explanatory variable $\textrm{SE}{\textrm{S}_{it^{\prime}}}$ is the SES indicator of locality i in the census year prior to year t, denoted by $t^{\prime}$
 . Both the social lag index and the marginalization index are available for three census years that overlap with our pollution data: 2000, 2005, and 2010. We assign lagged SES to three five-year annual pollution bins (2001–2005, 2006–2010, and 2011–2015). A positive sign on the coefficient of SES index $\beta$
 would imply that an increase in the social lag index is linked to an increase in air pollution, on average. In other words, a decline in the SES of an average locality is associated with an increase in air pollution in that locality.
In equation (1), $\textrm{Rac}{\textrm{e}_{it^{\prime}}}$ is the percentage of the population speaking an indigenous language obtained from 2000, 2005, and 2010. A positive sign on its coefficient $\delta$
 would imply a disproportionate pollution burden in localities that witnessed a rise in indigenous populations.
The vector ${X_{it^{\prime}}}$ includes population density, the share of manufacturing activities, and voter turnout. Denser municipalities might be more polluted due to higher mobile emission sources or less polluted if regulation is more stringent where larger segments of the population live, or larger shares of the vulnerable population live. Data from the census years 2000, 2005, and 2010 represent $t^{\prime}$
 . The other time-varying factor is the measure of the lagged share of manufacturing activities from the economic census years 1999, 2004, and 2009 represented as $t^{\prime}$
 . We maintain consistency in applying the lag structure to both explanatory variables. It controls changes in municipality-level economic conditions that determine air pollution levels locally. The third variable is voter turnout, also available at the municipality level and from the presidential election years of 2000 and 2006 and midterm elections of 2009 that roughly correspond to the census years of our study.
The vector ${W_{it}}$ includes annual average temperature and cumulative precipitation of each municipality. These two variables allow us to control annual changes in local weather patterns within municipalities. In equation (1), ${\mu _t}$
 represents year fixed effects to control for time-varying changes that are not specific to the location but capture general trends in air pollution.
In equation (1), the ${\alpha _i}$ s are location fixed effects for localities. The fixed effects models control for time-invariant factors that influence long-term average pollution levels. They also control for location-specific factors, e.g., altitude, coastal, and other topographical aspects that influence ambient pollution, like temperature inversion effects in Mexico City (Molina and Molina, Reference Molina and Molina2004).
We know that ambient PM2.5 concentrations depend on local time-varying factors such as emissions from stationary and mobile sources of pollution, the stringency of regulations, and pro-environmental attitudes. We cluster standard errors within localities to account for correlations over time of PM 2.5 concentrations from the same locality.
5. Results
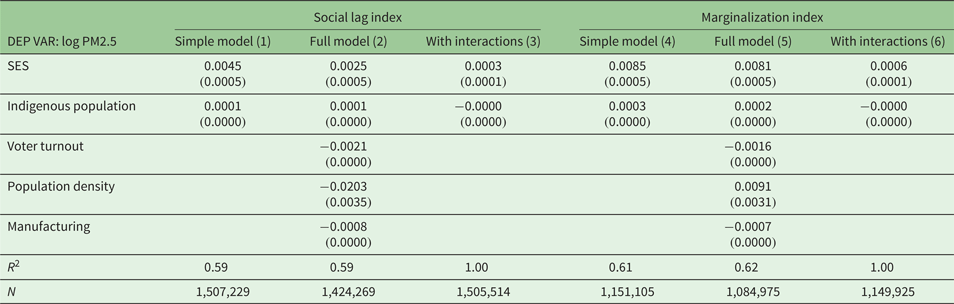
Overall, we find robust evidence of environmental inequity in Mexico. Our panel data results imply that a decline in SES is associated with increased pollution levels in these areas. In the first and third columns of table 1, we present the estimated coefficients of the relationship between air pollution and SES and racial composition of the local population. In the second and fourth columns, we present the estimates of the full specification as seen in equation (1). This allows us to decompose the share of overall observed disparities explained by urban/rural discrepancies as captured by population density, local economic activity as captured by share of manufacturing, and political participation as captured by voter turnout. Any residual variation in disproportionately high air pollution is then primarily due to variations in SES.
Main results
Notes: Clustered standard errors in parentheses.
The first three columns of table 1 present the results using the social lag index. A higher social lag index is associated with higher annual PM2.5 exposure.Footnote 9 The coefficient from the locality-level fixed effects model implies that a one standard deviation increase in the social lag index of the local population (standard deviation = 0.97) is associated with an increase in annual average PM2.5 exposure by 0.44 per cent (first column of table 1). This effect remains robust upon including population density, voter turnout, and the share of manufacturing activities, at the municipality level. The coefficient on the social lag index remains significant at 0.24 per cent in the full specification controlling for other factors. In the third column we include municipality by year interactions, to control for all time varying factors or trends within the municipality. Pollution continues to be higher in more marginalized localities, but the magnitude of SES falls to 0.02 per cent.
The last three columns of table 1 present the results upon including the marginalization index as an indicator of SES. We find similar evidence of environmental inequity, with disproportionate exposure to PM2.5 pollution in more marginalized localities. The coefficient implies that an increase in the marginalization index by one standard deviation (standard deviation = 1.03) is associated with an increase in annual average PM2.5 concentration by 0.9 per cent. In other words, a decline in the marginalization index is associated with an increase in PM2.5 concentrations on average. In the full specification controlling for other factors, the coefficient on the marginalization index remains positive and statistically significant at 0.83 per cent. As expected, upon inclusion of municipality by year interactions, the coefficient falls in magnitude to 0.06 per cent.
Among the other factors, a one standard deviation increase in voter turnout is associated with a decline in annual average pollution levels between 1.9 and 2.6 per cent. A one standard deviation increase in the share of manufacturing is also associated with a decline in annual PM2.5 levels between 1.1 and 1.3 per cent. Variations in the share of indigenous population are positively correlated with higher locality level pollution. However, indigenous population switches sign upon including municipality by year interactions. Population density also switches sign depending on the measure of socioeconomic indicator included.
In table 2, we explore sensitivity of the results to annual pollution levels versus longer-term (5-year) average pollution levels. We adopt this additional check as socioeconomic indicators are available every five years. Our hypothesis is that if annual pollution is higher in localities with declining SES, longer-term trends in pollution would give us a robust magnitude on the SES indicators. In other words, if poorer SES is linked with higher annual pollution levels (table 1), then we expect to see higher magnitudes on these indices in the longer-term pollution models. Results show that this is indeed the case for both socioeconomic indicators considered.
Five-year average pollution results

Notes: Clustered standard errors in parentheses.
In the full model specifications, controlling for time-varying municipality variables, a one standard deviation increase in the social lag index is linked to a 0.35 per cent higher 5-year average PM2.5 pollution. Upon including the marginalization index, we get similar results of a one standard deviation increase associated with a 0.88 per cent higher 5-year average pollution. We conclude that there is robust evidence on environmental inequity captured by disproportionately high PM2.5 concentrations with a decline in SES in localities. We do not find consistent racial disparities given the high concentration of indigenous populations in a few states of Mexico.
We carefully document correlations between air pollution and SES in Mexican localities. However, for policy it is important to identify causal channels that result in this relationship between pollution and poverty. One particular concern is that advantaged households move away from pollution nuisances due to environmental disamenities, and/or disadvantaged households move towards pollution nuisances due to lower rents or home prices spurred by environmental disamenities.
In our main specifications we include municipality-by-year fixed effects. Here, sorting attributable to trends in pollution common to all localities within a municipality does not contribute to identification in our models. Even though we cannot rule out residential sorting based on trends in pollution within a municipality; our panel estimates should be interpreted as net of sorting based on trends in pollution common to all localities within a municipality.
5.1 Reverse causality
Sorting is less likely in this specific analysis as households in Mexico would need to relocate due to short-run changes in environmental disamenities within the same municipality. Existing literature suggests that there are substantial disutility costs of migrating out of one's birth state, or even region (Rodríguez-Sánchez, Reference Rodríguez-Sánchez2014). States that are more populated, with higher life expectancy and with fewer firms are also preferred by Mexicans. However, the author does find that Mexicans prefer lower state-level pollution constructed from underlying municipality-level exposure from surrounding states to avoid biases from unobserved location specific attributes. In the more specific context of Mexico City, Fontenla et al. (Reference Fontenla, Goodwin and Gonzalez2019) find a compensating differential in wages of $81.31 per month in contrast to $2.65 per month in lower housing prices in response to an increase in zip code level pollution. We infer that differences in other amenities such as wages and major cities with economic opportunities likely predominate differences in environmental amenities.
We understand that temporally lagging socioeconomic indicators might not fully address reverse causality concerns of sorting based on exposure to local air pollution. Following Gray and Shadbegian (Reference Gray and Shadbegian2004), we utilize spatially lagged instruments of SES. If sorting is significant and the impact of pollution declines with distance, then we can expect that the location decisions of residents for larger geographical areas such as municipalities are not driven by pollution in the immediate vicinity. According to Banzhaf et al. (Reference Banzhaf, Ma and Timmins2019), ecological fallacy leads to upwards bias in magnitude on the pollution-poverty coefficient if sorting based on preferences for local pollution is a predominant phenomenon.
In addition, we explicitly address the possibility that relationships between changes in pollution and changes in SES are driven at least in part by the type of residual idiosyncratic sorting discussed above.Footnote 10 To account for endogeneity, we run a first-stage regression of the localities' SES indicator on the corresponding municipalities' socioeconomic indicator, percentage of indigenous population, the corresponding municipalities' voter turnout, population density, share of manufacturing activities, weather, and census year dummies and locality fixed effects. We then utilize the predicted values of localities' SES indicator as instruments in equation (1).Footnote 11
The results in table 3 show that the overall magnitude of the relationship between pollution and SES increases upon instrumenting localities' socioeconomic indices. We infer that the coefficients in the main results (table 1) are conservative estimates of the actual magnitude of disparities based on air pollution observed in these localities. The coefficient on the social lag index implies a one standard deviation increase in the social lag index associated with higher annual pollution by as much as 3.2 per cent annually. Similarly, utilizing the marginalization index, a standard deviation increase is associated with higher pollution levels by as much as 4.1 per cent. The magnitudes are about one order of magnitude larger than the estimates of the uninstrumented SES. Indigenous population is positive and statistically significant in three out of the four specifications, while voter turnout and share of manufacturing have negative and statistically significant coefficients, and population density is negative but significant only in the social lag index model. We acknowledge that residential sorting based on long-run average pollution – or trends in pollution common to broad areas – might be valid but does not contribute to identification in our models.
Instrumented socioeconomic status indicators

Notes: Clustered standard errors in parentheses.
5.2 Exploring drivers of environmental inequity
Identifying the causal channels that explain this relationship between poorer SES and higher air pollution levels is relevant for the design of appropriate policies. The prominent mechanisms are disproportionate siting, i.e., polluting industries locating near low income, minority neighborhoods (Wolverton, Reference Wolverton and Banzaf2012; Wang et al., Reference Wang, Deltas, Khanna and Bi2020); ‘coming to the nuisance’ or Tiebout sorting (Currie et al., Reference Currie, Davis, Greenstone and Walker2015; Depro et al., Reference Depro, Timmins and O'Neil2015); Coasian bargaining (Timmins and Vissing, Reference Timmins and Vissing2022); and political economy channels (Shadbegian and Gray, Reference Shadbegian, Gray and Banzhaf2012). We interact municipality-level voter turnout with SES to incorporate political participation channels. Pollution might be higher in locations with poor political participation as polluters anticipate poorer willingness to take collective action by the affected communities. Next, we interact the share of manufacturing activities with SES to incorporate polluters moving into poorer neighborhoods due to lower land prices, labor, etc. Last, we interact population density with SES to capture public pressure as denser municipalities imply more people are exposed to the pollution.
We interact each one of these variables with the socioeconomic index and indigenous population indicators. We include all the interactions in the fourth and eighth columns of table 4. Voter turnout and share of manufacturing consistently have a negative impact on higher air pollution in poorer areas, i.e., their interactions with the socioeconomic index are negative and statistically significant. Population density, on the other hand, maintains a positive sign and significance on the interaction term for both the measures of socioeconomic index considered.
Voter turnout, population density, and share of manufacturing as drivers of environmental inequity

Notes: Clustered standard errors in parentheses. All estimations include corresponding interactions with indigenous population.
We infer that higher voter turnout in municipalities is associated with lower air pollution levels due to direct or indirect (influencing regulatory officials) pressure from more politically active communities. The coefficient on the un-interacted social lag index +0.0189 (column (4) of table 4) is now interpreted as the magnitude of the coefficient on SES in a municipality with zero political participation, manufacturing activities, or community pressure channels. At the first quartile of the voter turnout variable, the coefficient on social lag index falls sharply to +0.0050. At the median voter turnout municipality, the coefficient on social lag index falls further to +0.0021. We interpret this as municipalities with higher political participation captured by voter turnout is a significant driver of improving inequity in air pollution.
Municipalities with a higher concentration of manufacturing industries reduce the magnitude of environmental inequity. The negative coefficient on the interaction term can be interpreted as a higher share of manufacturing activities linked to lower air pollution in socially lagged communities. The coefficient on social lag index falls to +0.0167 at the first quartile of the share of manufacturing activities variable. At the median, the coefficient falls slightly to +0.0160. We infer that municipalities with a higher concentration of these industries in peri-urban areas results in somewhat lower levels of air pollution in socially lagged communities.
Lastly, densely populated municipalities are significant drivers of environmental inequity. The interaction term is positive, implying that socially lagged communities in more densely populated municipalities experience higher PM2.5 levels. The coefficient can be interpreted as, at the first quartile of population density, the magnitude of the social lag index increases to +0.076, and at the median of population density, the magnitude increases substantially to +0.1725. We infer that high-density urban municipalities introduce increased variations in local land uses leading to higher pollution levels in socially lagged localities. This is contrary to our expectations of the community pressure through the Coasian bargaining mechanism due to higher exposure to pollution.
6. Conclusions
We find comprehensive evidence on environmental inequity in a large developing country. We fill a gap in the emerging literature on developing economies and carefully document the relationship between poor SES and high air pollution at the detailed scale of localities across Mexico. The remote sensing data allows us to not limit our analysis to border cities or urban areas near industrial sources of pollution.
We find robust evidence of disproportionately higher air pollution in poorer localities for the entire country. Our panel data results exploit within locality variations in SES and its relationship with changes in air pollution. In our main results, we report that a one standard deviation increase in the social lag index of a locality is associated with an increase in PM2.5 pollution of 0.24 per cent annually. For the marginalization index, results show that a one standard deviation increase is associated with an increase in PM exposure of 0.83 per cent annually. Controlling annual changes within municipalities through municipality by year interactions, the corresponding coefficients drop in magnitude by more than tenfold to 0.02 per cent for the social lag index and 0.06 per cent for the marginalization index. Utilizing five-year average pollution yields higher coefficients of 0.35 per cent on the social lag index and 0.88 per cent on the marginalization index. We note that even though the coefficients are economically meaningful, the magnitudes are quite small as a one standard deviation increase in either the social lag index or the marginalization index implies significant changes in the underlying census variables.
To account for idiosyncratic sorting due to changes in short-term pollution within a locality, we instrument locality-level SES with a broader municipality-level SES. Contrary to evidence on sorting, we find that the coefficients on the instrumented social lag index and the marginalization index are larger by an order of magnitude. A one standard deviation increase in the instrumented social lag index is linked to 3.2 per cent higher annual pollution levels. A one standard deviation increase in the instrumented marginalization index is linked to 4.1 per cent higher annual pollution. We infer our main results are conservative estimates and are less likely to be influenced by local sorting behavior of households.
From our explorations of mechanisms, we conclude that political economy channels are important to reduce air pollution in poorer localities through public engagement and collective action directly or indirectly through the regulators. The magnitude of the coefficient on social lag index falls substantially from +0.0189 to +0.0021 in a municipality with median voter turnout. The share of manufacturing activities seems to exert a smaller influence in reducing air pollution in poorer localities. The magnitude of the coefficient on social lag index reduces to only +0.0160 in a municipality with median share of manufacturing activities. Lastly, we find that population density is a significant driver of environmental inequity. The magnitude of the coefficient on social lag index increases substantially to +0.1725 in a municipality with median population density. We infer no evidence of community pressure mechanisms in highly dense municipalities and point to the prevalence of dispersed sources of pollution in cities and agricultural fires nearby.
For policy, we highlight the importance of targeting air quality control programs in the poorer localities across Mexico, particularly in the absence of a widespread monitoring network outside of the largest metropolitan areas. Lack of evidence of sorting to avoid short-term changes in locality specific pollution, implies significant co-benefits of air quality control programs through reductions in environmental health burden in the marginalized communities.
Supplementary material
The supplementary material for this article can be found at https://doi.org/10.1017/S1355770X24000251.
Acknowledgements
The authors would like to thank journal Co-Editor E. Somanathan, Associate Editor Shihe Fu, two anonymous referees, Alejandro Lopez Feldman, Jay Shimshack, Lala Ma, Max Melstrom, and participants at the AERE 2021 Summer Conference, June 2nd (online) and the 91st Annual SEA Conference, November 22nd, Houston. Yanning Wei with the GIS lab at the School of Environmental Sustainability, Loyola University Chicago, provided the maps.
Competing interest
The authors declare none.


 Open access