


1. Introduction
In many languages, speakers employ prosody to highlight focussed information or to attenuate information that is out of focus, in particular when this information follows the focus. In Italian, as in West Germanic languages such as English and German, highlighting is achieved by means of accentuation, which is reflected in acoustic parameters such as a dynamic f0 contour, local enhancement of spectral properties, and increases in periodic energy and duration. Conversely, attenuation can be achieved with deaccentuation, with a concomitant reduction in these parameters. However, Italian has been reported to have accents in post-focal position (Cruttenden Reference Cruttenden1993; Ladd Reference Ladd2008). It is this position that we concentrate on in the current study. In particular, we are concerned with how listeners rate the prominence of words that follow the focus of a sentence and how far they are guided by the linguistic system of their native language. To tap into the factors that affect native speaker perception of prominence, we collected ratings from native Italian listeners and compared them with ratings of the same utterances by learners of Italian with German as their first language.
1.1 Post-focal prominence in Italian and German
Ladd (Reference Ladd2008) describes Italian as strongly resistant to ‘contextual deaccenting’, the context being repeated words or phrases, or more generally given materials (Ladd Reference Ladd2008: 231). Experimental confirmation of this tendency in noun phrases (NPs) is provided by the study by Swerts, Krahmer & Avesani (Reference Swerts, Krahmer and Avesani2002), who found that in noun–adjective pairs (triangolo rosso, lit. triangle red), Tuscan Italian native speakers tended to produce a pitch accent on the adjective (rosso), i.e. the rightmost element in the phrase, regardless of whether the noun or the adjective was in focus. The resulting conclusion – that Italian does not mark focus structure in such NPs – has been called into question by Sbranna et al. (Reference Sbranna, Ventura, Albert and Grice2023), who have shown that prosodic marking of post-focal given material is realised through the modulation of phonetic parameters in the f0 trajectory and the amount of periodic energy (see section 1.2 below), rather than via a categorical presence versus absence of a pitch accent. Thus, Italian speakers do mark information status, but, crucially, they do not do it through deaccentuation.
Despite the ascribed general tendency for Italian to block deaccenting, several studies have shown that in sentence-length utterances, typically in narrow and/or contrastive focus declaratives, post-focal constituents can, in fact, be highly attenuated (this is also reported in Ladd (Reference Ladd2008: 233) as ‘metalinguistic corrections’). In this case, post-focal elements are characterised by a low flat f0 trace, yet they are still phonologically described as pitch accents, either low (L*) or low-falling (H+L*) in a greatly compressed pitch range (Grice et al., Reference Grice, Mariapaola D’Imperio, Avesani and Jun2005; Cangemi & D’Imperio, Reference Cangemi and D’Imperio2013; Gili Fivela et al., Reference Gili Fivela, Cinzia Avesani, Giuliano Bocci, Mariapaola D’Imperio, Marotta, Savino, Sorianello, Frota and Prieto2015, among others), as they reportedly bear some prominence cued by aspects of the signal other than f0, namely duration, formant trajectories and spectral emphasis (Bocci & Avesani Reference Bocci and Avesani2011, Reference Bocci, Avesani and Shlonsky2015).
In contrast to Italian, German has been described as a language that deaccents given materials (Ladd Reference Ladd2008), where deaccenting is acoustically marked by a low flat f0 (Féry & Kügler Reference Féry and Kügler2008). Interestingly, Kügler and Féry (Reference Kügler and Féry2017) detected a subtle f0 movement on post-focal material, which they accounted for as a pitch accent in a greatly compressed pitch range. In this respect, their analysis is similar to that of post-focal accents in Italian declaratives. Moreover, Kügler (Reference Kügler2008) found that words in post-focal position are longer than the same word in broad focus (all new), where the investigated word is the focus exponent. These results seem to suggest that, despite the fact that Italian and German are generally classified as having different post-focal structures, material in this position appears to have a similar degree of acoustic prominence in both languages. We return to this issue in the Discussion and Conclusion sections.
Although we are concerned with statements in our study, it is worth looking at the intonation of questions, as, in Italian, post-focal material can be acoustically more salient in questions than in statements. In fact, in polar questions in Bari Italian, a post-focal lexical item bears a clearly identifiable rising-falling pitch (analysed as L+H*, followed by a low edge tone; Grice & Savino Reference Grice and Savino2003; Grice et al. Reference Grice, Mariapaola D’Imperio, Avesani and Jun2005; Savino Reference Savino2012; Gili Fivela et al. Reference Gili Fivela, Cinzia Avesani, Giuliano Bocci, Mariapaola D’Imperio, Marotta, Savino, Sorianello, Frota and Prieto2015). This post-focal accent is linguistically important, as it can be used to distinguish between statements and questions, a feature shared with other (but not all) varieties of Italian (see Grice Reference Grice1995; Grice et al. Reference Grice, Mariapaola D’Imperio, Avesani and Jun2005; Savino Reference Savino2012; Cangemi & D’Imperio Reference Cangemi and D’Imperio2013; Gili Fivela et al. Reference Gili Fivela, Cinzia Avesani, Giuliano Bocci, Mariapaola D’Imperio, Marotta, Savino, Sorianello, Frota and Prieto2015, among others). This feature in Bari Italian is exemplified in Figure 1 (a–b), showing the f0 contour of the sentence Mamma è andata a ballare da Lalla (‘Mum went to dance at Lalla’s’) as a contrastive narrow focus declarative in (a), and as a narrow focus polar question in (b), with ballare as the focussed constituent in both cases (audio files and annotations taken from Grice et al. Reference Grice, Mariapaola D’Imperio, Avesani and Jun2005, and re-visualised with Praat (Boersma & Weenink Reference Boersma and Weenink2018)). Note that in the narrow focus declarative, the post-focal accent on Lalla is characterised by a flat f0 (here, the downstepped ‘!H+L*’ label is meant by the authors to indicate the post-focal H+L* within a very compressed pitch range), whereas in the narrow focus question, the post-focal accent on Lalla has a rise–fall f0 shape, similar to the focal accent on ballare, (analysed as L+!H*). This post-focal rise–fall is crucial for signalling interrogativity.
(a–b). Two renditions of the sentence Mamma è andata a ballare da Lalla (‘Mum went to dance at Lalla’s’), (a) as a statement, and (b) as a polar question, in both cases with narrow focus on ballare (from Grice et al. Reference Grice, Mariapaola D’Imperio, Avesani and Jun2005).

Figure 1 Long description
Two spectrograms illustrate the frequency and time analysis of the sentence Mamma andata a ballare da Lalla. The first spectrogram (a) represents the sentence spoken as a statement, while the second spectrogram (b) represents the sentence spoken as a polar question. Both spectrograms highlight the word BALLARE with a narrow focus. The x-axis of each spectrogram represents time in seconds, and the y-axis represents frequency in Hertz. The blue line in each spectrogram indicates the fundamental frequency (f0) contour. The words, syllables, and tones are annotated below each spectrogram. The statement version shows a dynamic f0 contour with peaks and valleys, while the question version shows a different f0 contour pattern. The spectrograms provide a visual representation of how prosody changes with different sentence types and focus.
1.2 Acoustic cues to post-focal prominence in Italian and German
In the previous section, we reported that, in the absence of f0 movements, other acoustic features can cue post-focal prominence, primarily duration (Bocci & Avesani Reference Bocci and Avesani2011, Reference Bocci, Avesani and Shlonsky2015 for Italian; Kügler Reference Kügler2008 for German). However, it has been recently shown that periodic energy mass (henceforth ‘Mass’), a measure selectively reflecting the intensity of pitch-bearing components in the acoustic signal, is a better cue to post-focal prominence than duration, as it takes both duration and intensity into account, employing a single scale for measuring prosodic strength (Albert et al. Reference Albert, Cangemi, Mark Ellison and Grice2022; Albert Reference Albert2023).
Evidence for the role of Mass as a reliable acoustic cue to prominence has been provided for both Italian and German. In the above-mentioned study by Sbranna et al. (Reference Sbranna, Ventura, Albert and Grice2023) on prosodic marking of information structure in Neapolitan Italian, it was found that in two-word NPs, under different information structure conditions, the stressed syllable of a given element in final position was produced with reduced Mass in comparison to that of a new element. A comparable trend has also been reported for German by Lorenzen & Baumann (Reference Lorenzen and Baumann2024), who found that Mass is a consistent cue to lexical and referential givenness, with higher Mass on new information than on given information.
1.3 Effects of linguistic structure on the perception of prominence
Experimental evidence has shown that what listeners perceive in the acoustic signal is not exclusively ‘signal-driven’. Instead, it could be partially influenced by their knowledge of the utterance’s linguistic structure (Eriksson, Thunberg, & Traunmüller Reference Eriksson, Thunberg and Traunmüller2001; Cole, Mo, & Hasegawa-Johnson Reference Cole, Mo and Hasegawa-Johnson2010; Bishop Reference Bishop, Elordieta and Prieto2012, Reference Bishop2016; Calhoun, Wollum, & Kruse Va’ai Reference Calhoun, Wollum and Emma Kruse Va’ai2021, among others). For example, Bishop (Reference Bishop, Elordieta and Prieto2012) found that prominence ratings of objects in SVO constructions by American English listeners were influenced by their language-based expectations of prominence patterns, and Calhoun et al. (Reference Calhoun, Wollum and Emma Kruse Va’ai2021) found effects of native linguistic knowledge on perceptual rating of prominence in New Zealand English and Samoan.
Notably, these ‘expectation-driven’ effects in Bari Italian have been recently investigated in an experiment based on Event Related Potentials (ERPs) by Ventura et al. (Reference Ventura, Martine Grice, Kolev, Brilmayer and Schumacher2020), who tested to what extent attentional resources are allocated to prosodically very prominent words marked by a narrow focal accent, compared to words in post-focal position in statements and polar questions. They found that attentional resources were directed not only to words in focal position, but also to words in post-focal position; this was attributed to the linguistic structure of the language, according to which prominent information is usually placed in final position in an utterance. Interestingly, despite the fact that post-focal target words are acoustically more prominent in questions than in statements (having a rise–fall f0 movement in questions as opposed to flat f0 in statements, as shown in Figure 1 above), attentional resources were reduced in the former context, since the rise–fall consumed attentional resources for processing sentence modality information, i.e. questioning, again as predicted by Bari Italian linguistic structure.
2. Motivation of this study and hypotheses
We have discussed that in both Italian and German statements, though post-focal prominence is not cued by f0 (post-focal elements having low flat f0), other acoustic cues appear to be available, such as duration and, more recently, Mass. Moreover, since the perception of prominence is not only ‘signal-driven’ but also ‘expectation-driven’, we ask whether the structure of listeners’ native language affects the perception of post-focal prominence, and how far Italian listeners take f0 and Mass into account in their prominence judgements.
To answer this question, we built a set of stimuli in Bari Italian with target words in statements produced under different focus conditions – (contrastive) narrow focus (NF), broad focus (BF) and post-focal (PF) – and we instructed two groups of listeners to rate their prominence, namely: (1) a group of Bari Italian native speakers, and (2) a group of German learners of Italian.
If prominence judgements by native listeners of Italian are based not only on the acoustic signal – bottom-up processing – but also on their knowledge of the language’s phonology and their expectations as a result of that knowledge – top-down processing, we might expect them to rate post-focal words differently from German learners. For the learners, the signal is expected to play a more important role than expectations resulting from a knowledge of the phonological distribution of accents in the language as a whole, and more importantly, of this variety in particular.
There are a number of reasons why learners of Italian might have less knowledge of the phonological distribution of accents in the language. First, our experiment uses a regional variety of Italian that is unlikely to be taken as a model for learners. Learners will be familiar with the lexical items and their phonological makeup (the consonants, vowels and lexical stress patterns) as well as the intonation pattern used in declaratives, which is strikingly similar across varieties (Gili Fivela et al. Reference Gili Fivela, Cinzia Avesani, Giuliano Bocci, Mariapaola D’Imperio, Marotta, Savino, Sorianello, Frota and Prieto2015; Cangemi & Grice Reference Cangemi and Grice2016). However, they will be unfamiliar with the intonation pattern used in polar interrogatives in the Bari variety and are unlikely to have been exposed to acoustically salient rising-falling post-focal accents in such questions. The mere presence of this functional distinction post-focally may affect the prominence ratings of native speakers as compared to the learners, who are likely to rely more on the signal.
3. Materials and methods
3.1 Participants
Two groups of listeners took part in the experiment: 16 native speakers of Bari Italian (13 F, 3 M; mean age: 26.47) and 18 German intermediate and upper-intermediate learners of Italian 14 F, 4 M; mean age: 24.72) who were not familiar with the variety spoken in Bari. Participants were all either university students or recent graduates. None of them had a background in phonetics or prosody. They participated in the experiment on a voluntary basis and gave written informed consent.
3.2 Stimuli
Stimuli consisted of 30 utterances (10 utterances × 3 conditions), all declaratives, elicited in a reading task as answers to questions. Stimuli were selected from recorded declarative sets produced by five different (female) native speakers of the Bari variety of Italian, all students at the local university without any background knowledge in prosody. In recording sessions, speakers were instructed to produce each target sentence as a response to a question read aloud by a confederate, with the text of each question/answer pair presented on a computer screen. Speakers were encouraged to read in a natural way, and to repeat any sentence if they were not satisfied with their production (in these cases, only the second rendition was considered as a potential stimulus).
One speaker’s set of utterances was selected based on fluency and naturalness, as judged by two Italian phoneticians. Fluency and naturalness were also taken into account when selecting 10 from 20 candidate sentences produced by that speaker for each condition. The preceding context consisted of questions, which elicited three different focal conditions in which the target word occurs as broad focus (henceforth BF), contrastive narrow focus (henceforth NF) or post-focally, i.e. after a contrastive narrow focus (henceforth PF). An example of each of the conditions preceded by context sentences are provided in examples (1)–(3), where the target word is indicated in bold and underlined, and the contrastive narrow focus condition is indicated with capital letters. Note that in (3) the verb preceding the target word is capitalised, signalling its contrastive narrow focus status, triggering a post-focal realisation of the target word.

The target word was always a noun (e.g. la maniglia, ‘the handle’ in the example above), preceded by a verb (e.g. girare, ‘to turn’) and followed by a prepositional phrase (e.g. sulla porta, ‘on the door’). Target nouns were always trisyllabic words with penultimate stress, verbs were trisyllabic with lexical stress in either penultimate or antepenultimate position, whereas nouns in the prepositional phrase could be either trisyllabic words with lexical stress in either penultimate or antepenultimate position or disyllabic words with penultimate stress. The text of all target sentences and context questions is provided in Appendix A. The audio files of all stimuli are available at https://osf.io/6kjxr/.
The selected stimuli were intonationally analysed by two trained transcribers using the autosegmental-metrical model for Italian described in Grice et al. (Reference Grice, Mariapaola D’Imperio, Avesani and Jun2005) using Praat (Boersma & Weenink Reference Boersma and Weenink2018). The target words were realised with a H+L* falling pitch accent in the BF condition, and with a H*+L (rising–)falling pitch accent in the NF condition, whereas in the PF conditions they were realised with a flat f0, analysed as L*. The verb preceding the object noun was realised with a falling H+L* pitch accent in BF, with either a falling H+L* or a peak H* pitch accent in NF, and with a H*+L (rising-)falling accent in PF, i.e. when the verb was marked by contrastive narrow focus.
The use of these pitch accents in BF and NF declaratives has been largely attested in the literature for most of the Italian varieties, including the one spoken in Bari (Grice & Savino Reference Grice and Savino1997, Reference Grice and Savino2003, Reference Grice, Savino, Gilles and Peters2004; Grice et al. Reference Grice, Mariapaola D’Imperio, Avesani and Jun2005; Gili Fivela et al. Reference Gili Fivela, Cinzia Avesani, Giuliano Bocci, Mariapaola D’Imperio, Marotta, Savino, Sorianello, Frota and Prieto2015; Grice, Savino, & Roettger Reference Grice, Savino and Roettger2019, amongst others).
Finally, the noun in PP was realised with a low-falling compressed pitch in BF and with a flat pitch in NF and PF, i.e. when occurring in post-focal position.
An example of the intonational realisations of the stimuli across the three prosodic conditions is offered in Figure 2(a–c).
(a–c). F0 contours of examples with the target phrase Bisogna girare la maniglia sulla porta (‘One needs to turn the handle on the door’) where la maniglia (‘the handle’) is the target word, in (a) narrow focus, (b) broad focus and (c) post-focal positions.

Figure 2 Long description
A line graph showing F0 contours of examples with the target phrase Bisogna girare la maniglia sulla porta. The graph displays three subplots labeled (a), (b), and (c), each representing different focus positions: narrow focus, broad focus, and post-focal positions respectively. The x-axis represents time in seconds, and the y-axis represents frequency in Hertz. Each subplot includes labeled words, syllables, and tones. The blue lines indicate the F0 contours, with variations in frequency over time. All values are approximated.
Note that, given the position of the target before a prepositional phrase, the mapping between syntactic structure and prosodic structure generally assigns an intermediate phrase boundary after the target (see Selkirk, Reference Selkirk1984, Reference Selkirk and Goldsmith1995; Nespor & Vogel Reference Nespor and Vogel1986; Dehé & Samek-Lodovici, Reference Dehé and Samek-Lodovici2009). In our stimuli, such an intermediate phrase boundary was always realised as an L tone in both NF and BF conditions. In the PF condition, we could not directly observe cues for an intermediate phrase boundary but assumed the analysis of Bocci and Avesani (Reference Bocci and Avesani2011, Reference Bocci, Avesani and Shlonsky2015), who provided acoustic and perceptual evidence for a boundary based on final lengthening cuesFootnote 1 . Therefore, we assumed the target word was realised, in all conditions, as the metrical head of the intermediate phrase in which it was located.
3.2.1 Acoustic measurements of the stimuli
We measured Mass on the stressed syllable of target words along with the f0 span between L and H tones associated with that word, and compared Mass and f0 values across BF, NF and PF conditions. Mass is calculated as the integral of duration and intensity, considering these two cues together in one variable. In particular, we measured relative Mass, i.e. the prosodic strength in terms of the area under the periodic energy curve of each syllable relative to the other syllables in the same utterance. The average relative Mass centres at zero, thus values lower than zero indicate a weak syllable (in terms both of duration and intensity), whereas values higher than zero indicate a strong syllable (weak < 0 < strong). The f0 span was calculated as the difference between the maximum and the minimum f0 values corresponding to the H and L tones (H* and L for NF; H and L* for BF, and the highest and lowest point within the stressed syllable in PF).
Mass and f0 span were analysed using two separate hierarchical linear regression models in the Bayesian framework (for details see section 3.4). Specifically, we modelled relative mass and f0 values (dependent variables) as a function of the treatment contrast coded predictor FOCUS (‘Narrow’, ‘Broad’, ‘Post-focal’), with broad focus serving as the reference level. Random intercepts for ITEM Footnote 2 were included. Random effects for PARTICIPANTS were not needed as only one speaker produced the speech stimuli. We used regularising (i.e. minimally informative) priors for all our parameters, allowing for a wide range of effect sizes, while discouraging implausibly large effects. The full prior and model specification can be found in the code provided in the OSF platform (https://osf.io/6kjxr/). Inferences were based on the posterior distributions of the parameters, reported in relation to the posterior mean, the 90% credible interval (CrI), and the posterior probability that the true parameter value lies on one side of zero and is close to one (Franke & Roettger Reference Franke and Roettger2019).
Four MCMC sampling chains were run for 8,000 iterations with a warm-up period of 2,000 iterations, yielding a total of 24,000 posterior samples. There was no indication for convergence issues of the model (all Rhat = 1.00). Model fit was also assessed by visual inspection of the predictive posterior checks.
3.2.1.1 Mass
Figure 3 illustrates the distribution of relative Mass on the stressed syllable of target words in narrow focus (NF), broad focus (BF) and post-focal (PF) condition. On the right side of the figure, the data is depicted in half violin plots, visualising the distributions as a kernel density plot. On the left side of the figure the data is depicted in dot plots, resembling a histogram as the data points are stacked into one bin. Lastly, the black dots indicate the mean of each distribution. Visual inspection of the distributions of relative mass values in Figure 3 shows a reduction in the proportion of stressed syllables that exhibit greater mass than utterances’ average strength (mass > 0) from NF to BF to PF, causing an increase of the overall mean from PF to BF to NF.
Distribution of relative Mass values associated with the stressed syllable of target words in NF (blue), BF (yellow) and PF (pink). For each condition, the data is depicted in two ways: to the right, in half violin plots, visualising the distributions as a kernel density plot; to the left the data is illustrated in dot plots, resembling a histogram as the data points are stacked. Black dots indicate the mean of each distribution.

Figure 3 Long description
A scatter plot with violin and dot plots illustrates the distribution of relative mass values associated with the stressed syllable of target words in three focus conditions: NF (blue), BF (yellow), and PF (pink). The x-axis represents the focus condition, while the y-axis represents the relative mass values. Each condition is depicted in two ways: to the right, in half violin plots visualizing the distributions as a kernel density plot, and to the left, in dot plots resembling a histogram as the data points are stacked. Black dots indicate the mean of each distribution. The plot shows that the NF condition has higher relative mass values compared to the BF and PF conditions. The data points are color-coded to represent different focus conditions, with blue for NF, yellow for BF, and pink for PF. The overall trend indicates variations in relative mass values across different focus conditions, with notable differences in the distribution patterns.
Estimated condition Mass means are presented in Figure 4, and posterior distribution of the estimated parameters are depicted in Figure 5. The model estimated that Mass on the stressed syllable of target words in the (baseline) BF condition was $\hat \beta $
= 0.36 (90%-CrI: [0.06, 0.67]), in PF
$\hat \beta $
= 0.36 (90%-CrI: [0.06, 0.67]), in PF $\hat \beta $
= 0.20 (90%-CrI: [−0.10, 0.51]) and in NF
$\hat \beta $
= 0.20 (90%-CrI: [−0.10, 0.51]) and in NF $\hat \beta $
= 0.79 (90%-CrI: [0.49, 1.09]). The model provided strong evidence for the stressed syllable of target words showing higher Mass values in NF than in PF (0.79 vs. 0.20,
$\hat \beta $
= 0.79 (90%-CrI: [0.49, 1.09]). The model provided strong evidence for the stressed syllable of target words showing higher Mass values in NF than in PF (0.79 vs. 0.20, $\hat \beta $
= 0.58, 90%-CrI: [0.48, 0.69], P(
$\hat \beta $
= 0.58, 90%-CrI: [0.48, 0.69], P( $\beta $
> 0) = 1), as well as than in BF (0.79 vs. 0.36,
$\beta $
> 0) = 1), as well as than in BF (0.79 vs. 0.36, $\hat \beta $
= 0.43, 90%-CrI: [0.32, 0.53], P(
$\hat \beta $
= 0.43, 90%-CrI: [0.32, 0.53], P( $\beta $
> 0) = 1), indicating that the stressed syllable of target words in NF is prosodically stronger (in terms of both duration and intensity) than in BF and PF conditions. In turn, Mass on the stressed syllable of target words exhibited lower Mass values in PF than in BF conditions (0.20 vs 0.36,
$\beta $
> 0) = 1), indicating that the stressed syllable of target words in NF is prosodically stronger (in terms of both duration and intensity) than in BF and PF conditions. In turn, Mass on the stressed syllable of target words exhibited lower Mass values in PF than in BF conditions (0.20 vs 0.36, $\hat \beta $
= −0.16, 90%-CrI: [−0.26, −0.05], ], P(
$\hat \beta $
= −0.16, 90%-CrI: [−0.26, −0.05], ], P( $\beta $
< 0) = 0.99), indicating that the stressed syllables of target words in PF are prosodically weaker in PF than BF conditions.
$\beta $
< 0) = 0.99), indicating that the stressed syllables of target words in PF are prosodically weaker in PF than BF conditions.
Estimated condition Mass means with 90% credible per focus condition (NF in blue, BF in yellow, PF in pink).

Figure 4 Long description
A line graph displays estimated relative mass means with 90% credible intervals for three focus conditions. The x-axis represents the focus conditions, labeled as NF in blue, BF in yellow, and PF in pink. The y-axis indicates the estimated relative mass, ranging from negative 0.5 to 1.5. The blue data point for NF is positioned around 0.75 with a credible interval extending from approximately 0.25 to 1.25. The yellow data point for BF is located around 0.5 with a credible interval spanning from approximately 0 to 1. The pink data point for PF is situated around 0.25 with a credible interval ranging from approximately negative 0.25 to 0.75. All values are approximated.
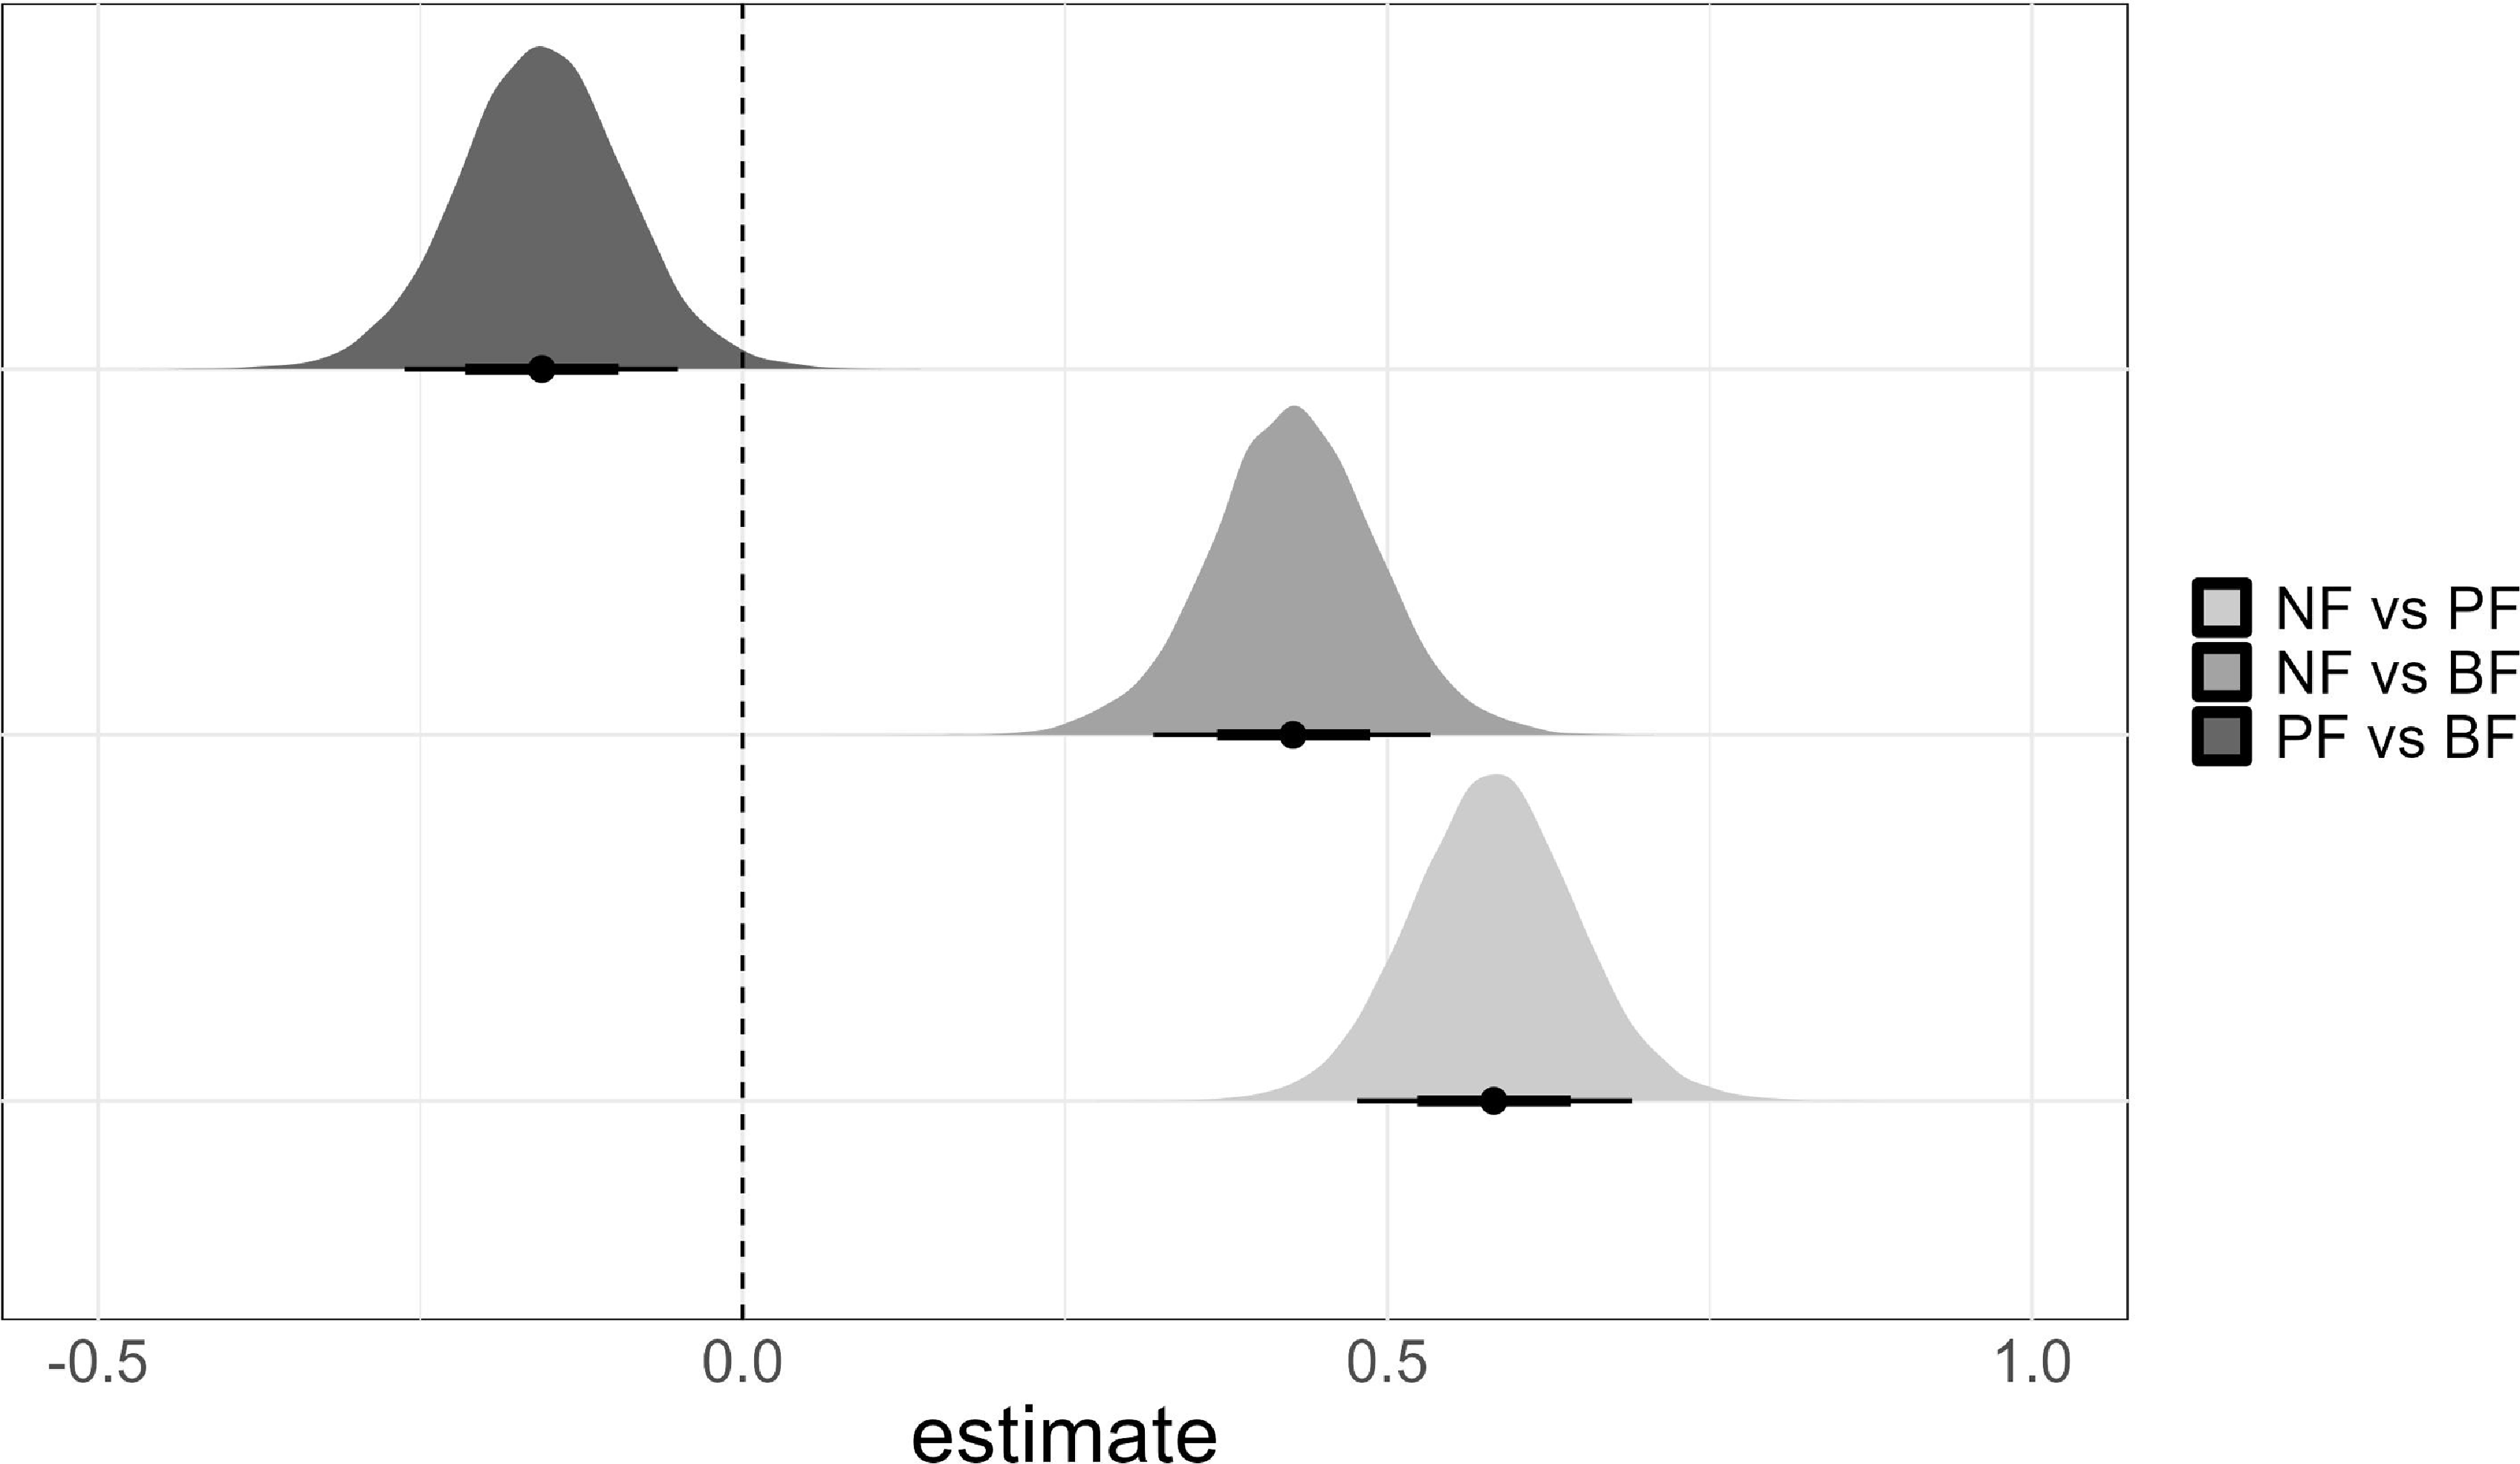
Posterior distributions for the focus effects on Mass. Error bars around the posterior means illustrate 66% (thick line) and 90% (light line) credible intervals.

Figure 5 Long description
The image presents three normal distribution curves, each representing the posterior distributions for the focus effects on Mass. The x-axis represents the estimate values ranging from negative zero point five to one, while the y-axis represents the frequency or probability density. The curves are color-coded: dark gray for NF versus PF, medium gray for NF versus BF, and light gray for PF versus BF. Each curve has error bars around the posterior means, illustrating sixty-six percent credible intervals with thick lines and ninety percent credible intervals with light lines. The dark gray curve is centered around zero, the medium gray curve is centered around zero point three, and the light gray curve is centered around zero point five. The curves are bell-shaped and symmetrical, indicating the distribution of the estimates. The shaded areas under the curves represent the credible intervals for the estimates. The legend on the right side of the image identifies the color coding for the different comparisons. All values are approximated.
These results suggest that the prosodic strength on target words increases from PF to BF and to NF, thus reflecting the different degrees of prosodic prominence of the target word in the different conditions.
3.2.1.2 F0 span
Figure 6 illustrates the distribution of f0 span associated with the stressed syllable of target words in narrow focus (NF), broad focus (BF) and post-focal (PF). On the right side of the figure, the data is depicted in half violin plots, visualising the distributions as a kernel density plot. On the left side of the figure the data is depicted in dot plots, resembling a histogram as the data points are stacked into one bin. Lastly, the black dots indicate the mean of each distribution. Visual inspection of the distributions of f0 span in Figure 6 shows that NF and BF exhibit f0 span of similar height whereas, as expected, it is considerably lower in PF.
Distribution of f0 span on the stressed syllable of target words in NF (in blue), BF (in yellow) and PF (in pink). On the right side of the figure, the data is depicted in half violin plots, visualising the distributions as a kernel density plot. On the left side of the figure the data is illustrated in dot plots, resembling a histogram as the data points are stacked into one bin. Black dots indicate the mean of each distribution.

Figure 6 Long description
The image presents a box-and-whisker plot with additional visualizations including violin plots and dot plots. The plot compares the distribution of f0 span on the stressed syllable of target words across three focus conditions: NF (in blue), BF (in yellow), and PF (in pink). The x-axis represents the focus conditions, while the y-axis measures the f0 span in Hertz, ranging from 0 to 150. Each box plot includes a median line, lower and upper quartiles, and whiskers indicating the range of the data. The violin plots on the right side of the figure visualize the distributions as kernel density plots, showing the density of the data points. The dot plots on the left side resemble histograms, with data points stacked into one bin. Black dots indicate the mean of each distribution. The NF condition shows a higher f0 span compared to the BF and PF conditions, with the PF condition having the lowest f0 span. The violin plots reveal the density and spread of the data, while the dot plots provide a histogram-like representation. All values are approximated.
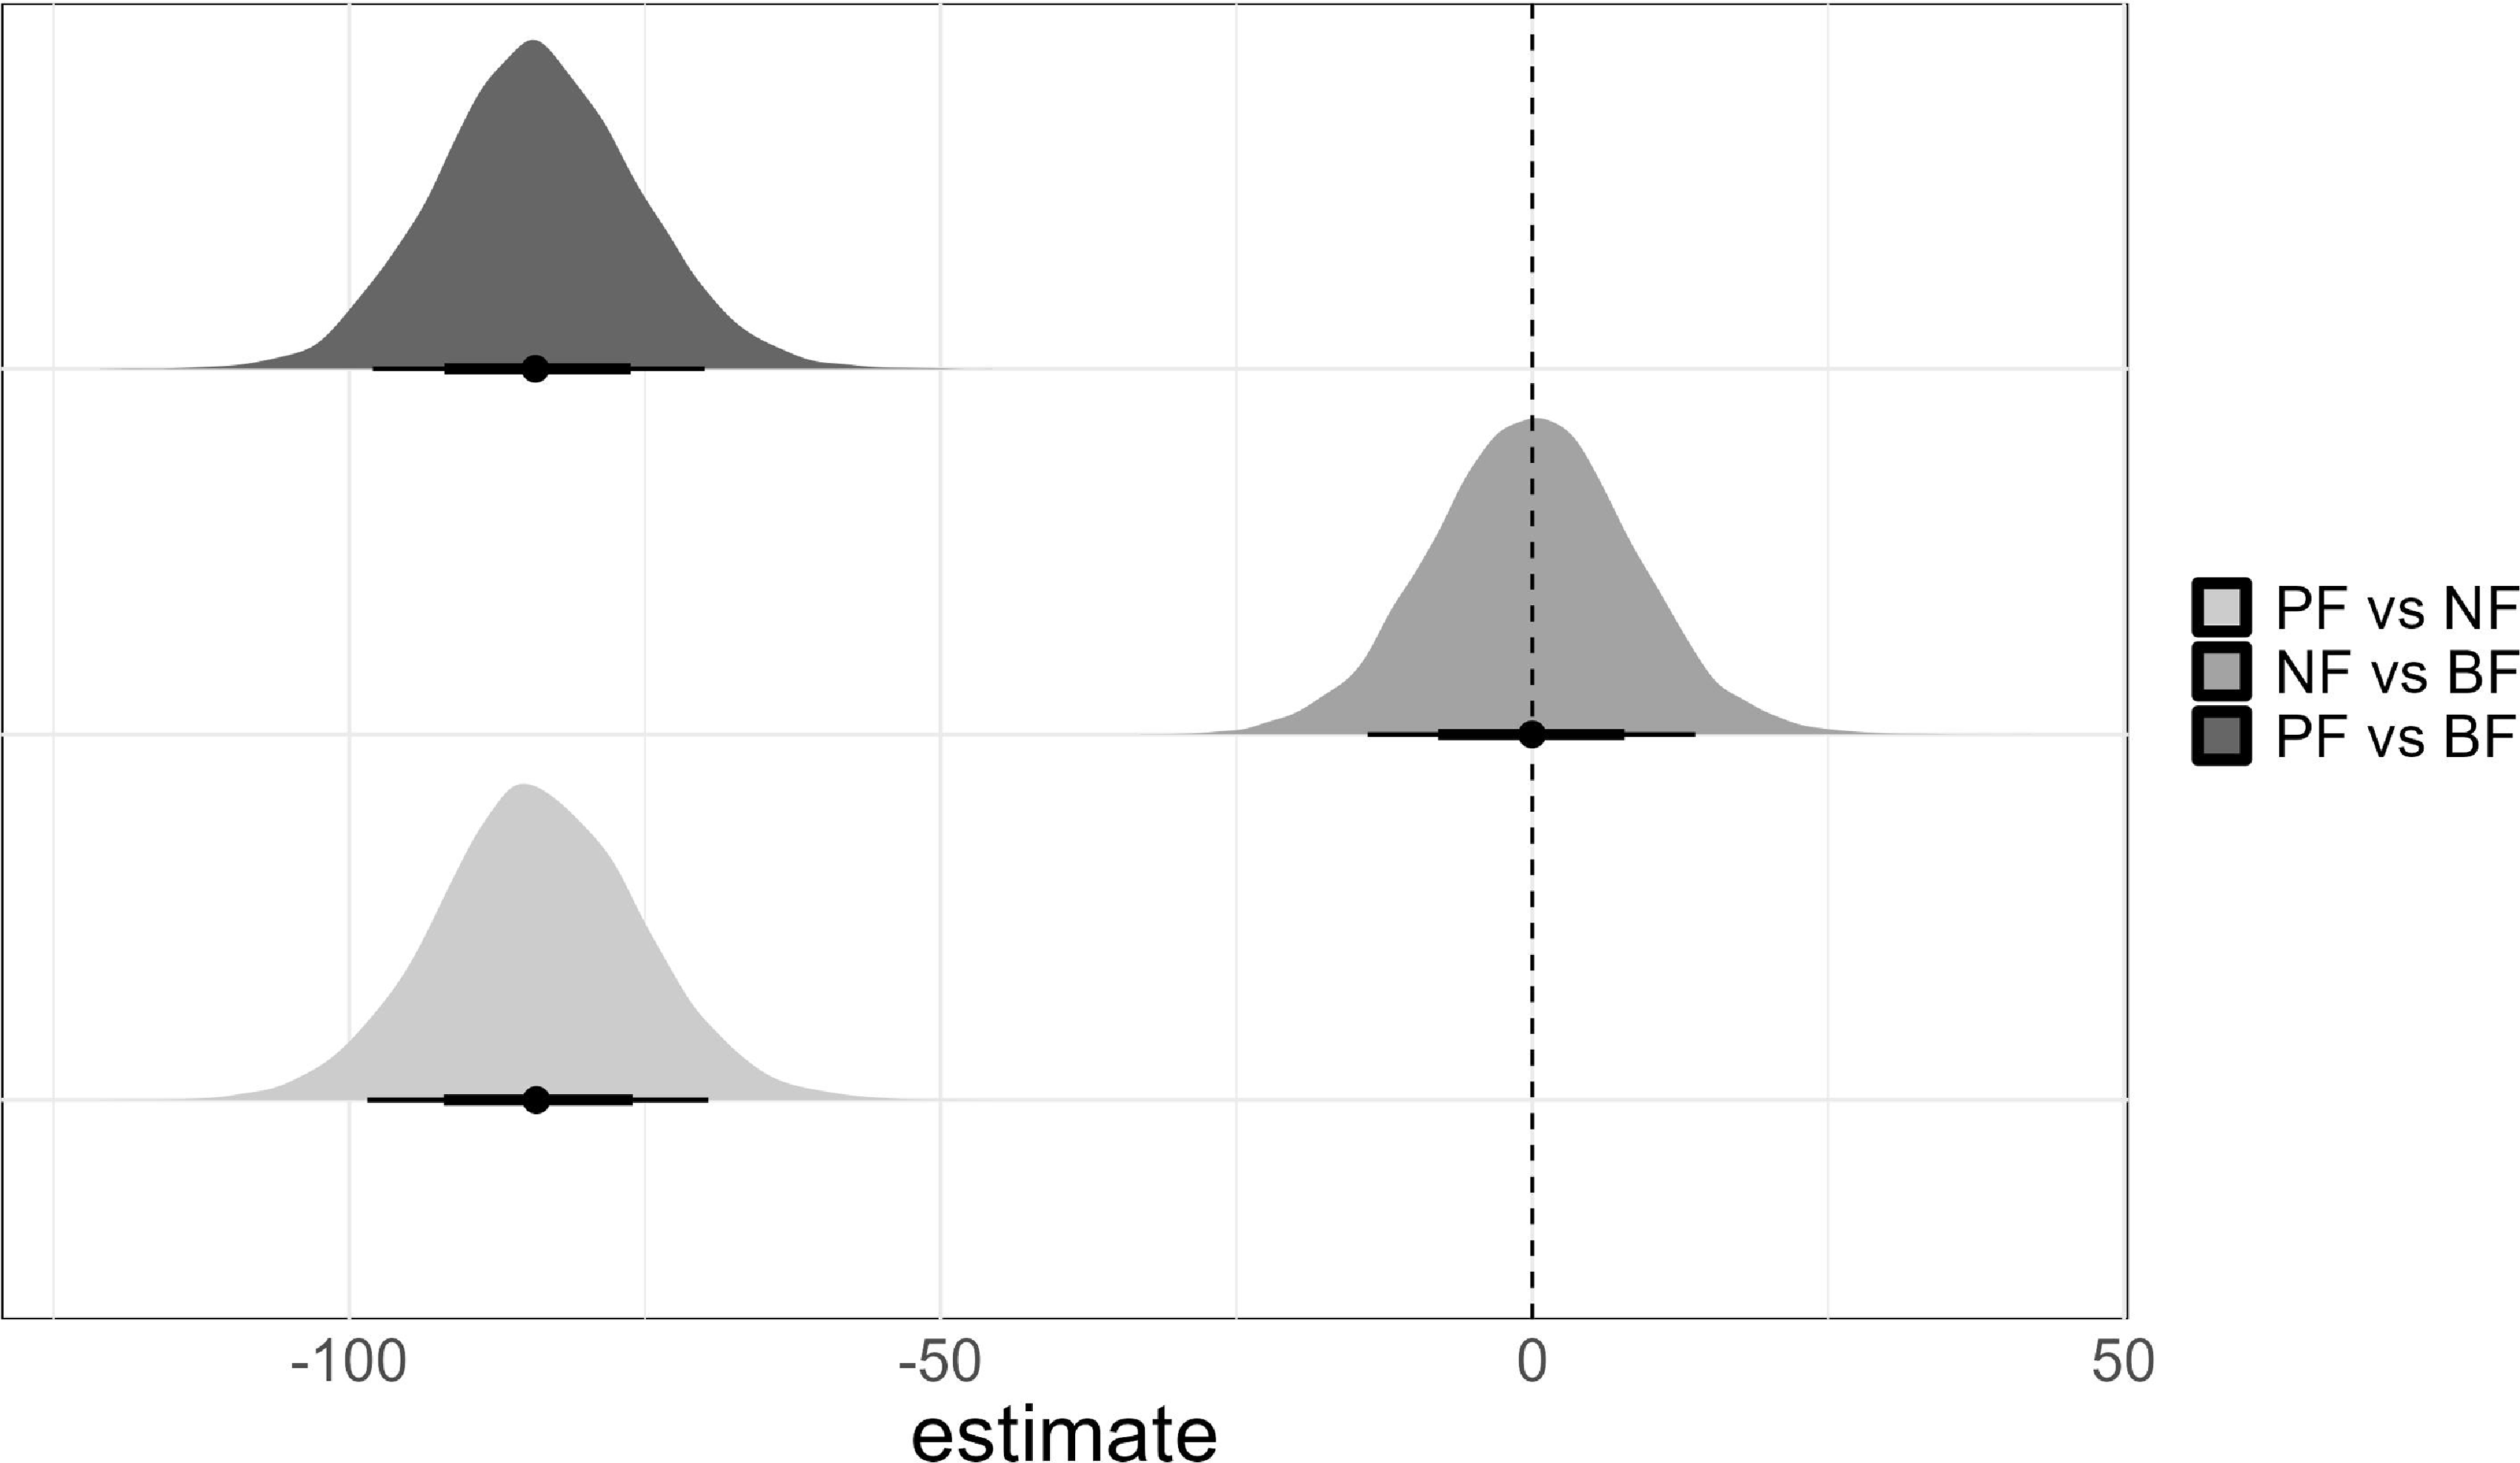
Estimated condition f0 span means are presented in Figure 7, and posterior distribution of the estimated parameters are depicted in Figure 8. The model provided strong evidence for the stressed syllable of target words showing lower f0 span values in PF than in NF ( $\hat \beta $
= −84.07, 90%-CrI: [−98.47, −69.64], P(
$\hat \beta $
= −84.07, 90%-CrI: [−98.47, −69.64], P( $\beta $
< 0) = 1) as well as than in BF (
$\beta $
< 0) = 1) as well as than in BF ( $\hat \beta $
= −84.12, 90%-CrI: [−98.02, −69.95], P(
$\hat \beta $
= −84.12, 90%-CrI: [−98.02, −69.95], P( $\beta $
< 0) = 1). In turn, the model did not provide evidence for an f0 span difference between NF and BF conditions (
$\beta $
< 0) = 1). In turn, the model did not provide evidence for an f0 span difference between NF and BF conditions ( $\hat \beta $
= −0.05, 90%-CrI: [−13.91, 13.79], P(
$\hat \beta $
= −0.05, 90%-CrI: [−13.91, 13.79], P( $\beta $
> 0) = 0.5). These results show not only the relative absence of f0 movement on the stressed syllable of words in the PF condition, but also that the f0 span in BF is similar to that in the NF condition.
$\beta $
> 0) = 0.5). These results show not only the relative absence of f0 movement on the stressed syllable of words in the PF condition, but also that the f0 span in BF is similar to that in the NF condition.
Estimated condition means for f0 span with 90% credible per focus condition (NF in blue, BF in yellow, PF in pink).

Posterior distributions for the focus effects on f0 span. Error bars around the posterior means illustrate 66% (thick line) and 90% (light line) credible intervals.

Figure 8 Long description
The image contains three density plots that compare posterior distributions for the focus effects on f0 span. Each plot features error bars around the posterior means, illustrating 66% credible intervals with thick lines and 90% credible intervals with light lines. The plots are labeled to distinguish between different comparisons: PF vs NF, NF vs BF, and PF vs BF. The x-axis represents the estimate values ranging from -100 to 50, while the y-axis indicates the density. The density plots show varying distributions, with one plot centered around a negative estimate, another around zero, and the third around a positive estimate. The error bars provide a visual representation of the uncertainty around the posterior means. All values are approximated.
3.3 Procedure
To run the perceptual rating task, we developed a web-based tool using a visual-analogue scale along the line of several studies dealing with similar types of tasks (e.g. Terken Reference Terken, Sagisaka, Campbell and Higuchi1997; Gussenhoven & Rietveld Reference Gussenhoven and Rietveld1998; Arnold, Wagner, & Möbius Reference Arnold, Wagner and Möbius2011). In our case, we represented degrees of prominence iconically by associating it with thickness and darkness of the scale (thicker and darker line indicating higher prominence, see Figure 9), as in Baumann & Röhr (Reference Baumann and Röhr2015). Our web-based rating task tool was implemented with the ‘SoSci Survey’ software (Leiner Reference Leiner2014); a screenshot of the Italian version is shown in Figure 9.
Screenshot of the web-based prominence rating task for the Italian participants for the sentence Bisogna pesare la farina con la bilancia (‘One needs to weigh the flour with the scales’). The target word is in the white row (here: farina, ‘flour’).

In the rating task, participants were asked to listen to each sentence and to rate the perceived prominence of three words contained in the sentence and selectively presented on the screen, by clicking on the corresponding position on the scale. These three words always corresponded to the verb preceding the target, the target noun and the noun in the following PP. So as not to ask the listeners to focus exclusively on the target word, they also rated the preceding verb and the following noun in the prepositional phrase (e.g. in Bisogna girare la maniglia sulla porta , the underlined words were rated).
For Italian listeners, the left pole of the visual analogue scale was labelled as ‘per niente saliente’ (‘not at all salient’) while the right pole was labelled as ‘al massimo saliente’ (‘maximally salient’). For German listeners, the labelling was ‘gar nicht hervorgehoben’ (‘not at all highlighted’) and ‘sehr stark hervorgehoben’ (‘very strongly highlighted’). We decided to use the Italian ‘saliente’ (‘salient’) and the German ‘hervorgehoben’ (‘highlighted’), as these terms were deemed less technical and thus more appropriate for listeners who are naïve to the purposes of the experiment.
Instructions were designed to direct listeners towards an acoustically based interpretation, specified by the formulation ‘how salient/highlighted the words sound to your ear ’. The instructions in each language are provided in Appendix B.
In the task, stimuli were presented both acoustically and orthographically, and participants were allowed to listen to each stimulus as many times as they wanted. The task was preceded by a short training session, during which no feedback was given to participants.
Stimuli were presented in a pseudo-randomised order, avoiding consecutive or close repetitions of the same utterance (independent of the prosodic condition), by ensuring repetitions were at least six stimuli apart. The same prosodic condition in different items never occurred consecutively, with a minimum of one other condition in-between. Different pseudo-randomised order-of-presentation lists were created and evenly distributed among participants.
As mentioned before, participants were allowed to listen to the stimuli as many times as they wanted before rating. However, to ensure homogeneity of the data, trials in which participants listened to a stimulus more than five times were excluded from further analyses, along with the corresponding items in the other two conditions. Moreover, one participant from the learner group was excluded from further analyses as this person listened to five trials more than five times, ranging from six to 13 times (the majority of participants listened to the stimuli less than five times: the median of the learner group = 2; the median of the native group = 1).
3.4 Statistical data analysis
All analyses (including those on Mass and f0 span measurements of target words across BF, NF and PF conditions as described in sections 3.2.1.1 and 3.2.1.2) were conducted in R 4.1.2 (R Development Core Team 2021) using the brms 2.17.0 package (Bürkner Reference Bürkner2018). For data processing we used the R package tidyverse 1.3.1 (Wickham et al., Reference Wickham, Mara Averick, Winston Chang, Romain François, Alex Hayes, Jim Hester, Thomas Pedersen, Stefan Bacher, Jeroen Ooms and Dana Seidel2019) and for visualisations we used the R packages ggplot2 3.3.5 (Wickham Reference Wickham2016) and tidybayes 3.0.2 (Kay Reference Kay2021). All data tables as well as scripts for the analyses are available at https://osf.io/6kjxr/ on the OSF platform.
4. Results
As mentioned in section 3.3 above, our prominence rating data were collected using a visual-analogue rating scale, known also as a slider scale, allowing participants to assign continuous degrees of prominence ratings. Yet, slider scales are unlikely to provide normally distributed responses as the scale consists of lower and upper bounds (Vuorre Reference Vuorre2018). Ratings were encoded as interval data from 0 (lower bound) to 100 (upper bound). For modelling purposes, the range was rescaled from 0–100 to 0–1 by dividing each value by 100.
Prominence ratings of the target words were analysed using a zero-one inflated Beta (ZOIB) hierarchical regression model in the Bayesian framework. The brms ZOIB family accounts for a continuous range between 0 and 1 as well as the actual presence of 0s and 1s in the data, i.e. data bounded at the end points of the scale (e.g. Liu & Kong Reference Liu and Kong2015). Treatment contrast was used to code two categorical predictors: focus (‘Narrow’, ‘Broad’, ‘Post-focal’) with broad focus being the reference level, and groupFootnote 3 (‘Natives’, ‘L2 learners’) with natives being the reference level. We estimated both the effects of these factors and their interaction. The model also included random effects for participants and items with full variance-covariance matrices (e.g. Barr et al. Reference Barr, Levy, Scheepers and Tily2013). We used regularising (i.e. minimally informative) priors for all our parameters, allowing for a wide range of effect sizes, discouraging though implausibly large effects. The full prior and model specification can be accessed in the code provided in the OSF platform (see section 3.4 for the link). Inferences were based on the posterior distributions of the parameters, reported in relation to the posterior mean, the 90% credible interval (CrI), and the posterior probability that the true parameter value lies on one side of zero and is close to one (Franke & Roettger Reference Franke and Roettger2019).
Four MCMC sampling chains were run for 8,000 iterations with a warm-up period of 2,000 iterations, yielding a total of 24,000 posterior samples. There was no indication for convergence issues in the model (all Rhat = 1.00). Model fit was also assessed by visual inspection of the predictive posterior checks.
Figure 10 depicts mean prominence ratings of the two groups, natives and L2 learners, on the target wordsFootnote 4 across the three focal conditions (NF, BF, PF) per participant. Visual inspection of this figure exhibits a pattern of higher ratings from NF to BF to PF conditions. Further, we can observe that target words in all three focal conditions have native prominence ratings of over 50% whereas many L2 learners’ ratings of target words in the broad and post-focal conditions are below 50%. Let us now move to the results of our model.
Mean prominence ratings on the target words across the three focal conditions (NF in blue, BF in yellow, PF in pink), as a function of group (left panel depicts natives, right panel depicts L2 learners), per participant.

Figure 10 Long description
The line graph displays mean prominence ratings on target words across three focus conditions: NF in blue, BF in yellow, and PF in pink. The graph is divided into two panels, with the left panel representing natives and the right panel representing L2 learners. Each participant's data is connected by lines, showing individual variations in ratings. The y-axis represents mean prominence ratings ranging from 0 to 1, while the x-axis represents the focus conditions. All values are approximated.
The model estimated that prominence rating of target words by native listeners in BF (baseline condition) was 64% ( $\hat \beta $
= 0.56, 90%-CrI: [0.29, 0.83]), in PF was 61% (
$\hat \beta $
= 0.56, 90%-CrI: [0.29, 0.83]), in PF was 61% ( $\hat \beta $
= 0.45, 90%-CrI: [0.16, 0.73]), and in NF was 80% (
$\hat \beta $
= 0.45, 90%-CrI: [0.16, 0.73]), and in NF was 80% ( $\hat \beta $
= 1.42, 90%-CrI: [1.11, 1.72]). Similarly, prominence rating of target words by L2 learners in BF was 47% (
$\hat \beta $
= 1.42, 90%-CrI: [1.11, 1.72]). Similarly, prominence rating of target words by L2 learners in BF was 47% ( $\hat \beta $
= −0.12, 90%-CrI: [−0.39, 0.15]), in PF was 41% (
$\hat \beta $
= −0.12, 90%-CrI: [−0.39, 0.15]), in PF was 41% ( $\hat \beta $
= −0.37, 90%-CrI: [−0.65, −0.08]), and in NF was 72% (
$\hat \beta $
= −0.37, 90%-CrI: [−0.65, −0.08]), and in NF was 72% ( $\hat \beta $
= 0.94, 90%-CrI: [0.64, 1.23]). The estimated means of prominence ratings (back transformed from log-odds to proportions) in each condition are shown in Figure 11.
$\hat \beta $
= 0.94, 90%-CrI: [0.64, 1.23]). The estimated means of prominence ratings (back transformed from log-odds to proportions) in each condition are shown in Figure 11.
Estimated condition means of prominence ratings with 90% credible intervals per group (left panel: natives; right panel: L2 learners) back transformed from log-odds to the original scale (proportions).

Figure 11 Long description
The line graph presents estimated condition means for f0 span with 90% credible intervals per focus condition. The graph is divided into two panels: the left panel for natives and the right panel for L2 learners. The x-axis represents the focus condition, categorized into NF (blue), BF (yellow), and PF (pink). The y-axis represents the estimated ratings, ranging from 0.00 to 1.00. In the natives panel, the NF condition shows the highest estimated ratings around 0.75, followed by BF around 0.60, and PF around 0.55. In the L2 learners panel, the NF condition also shows the highest estimated ratings around 0.70, followed by BF around 0.50, and PF around 0.45. Error bars around the posterior means illustrate 66% (thick line) and 90% (light line) credible intervals. All values are approximated.
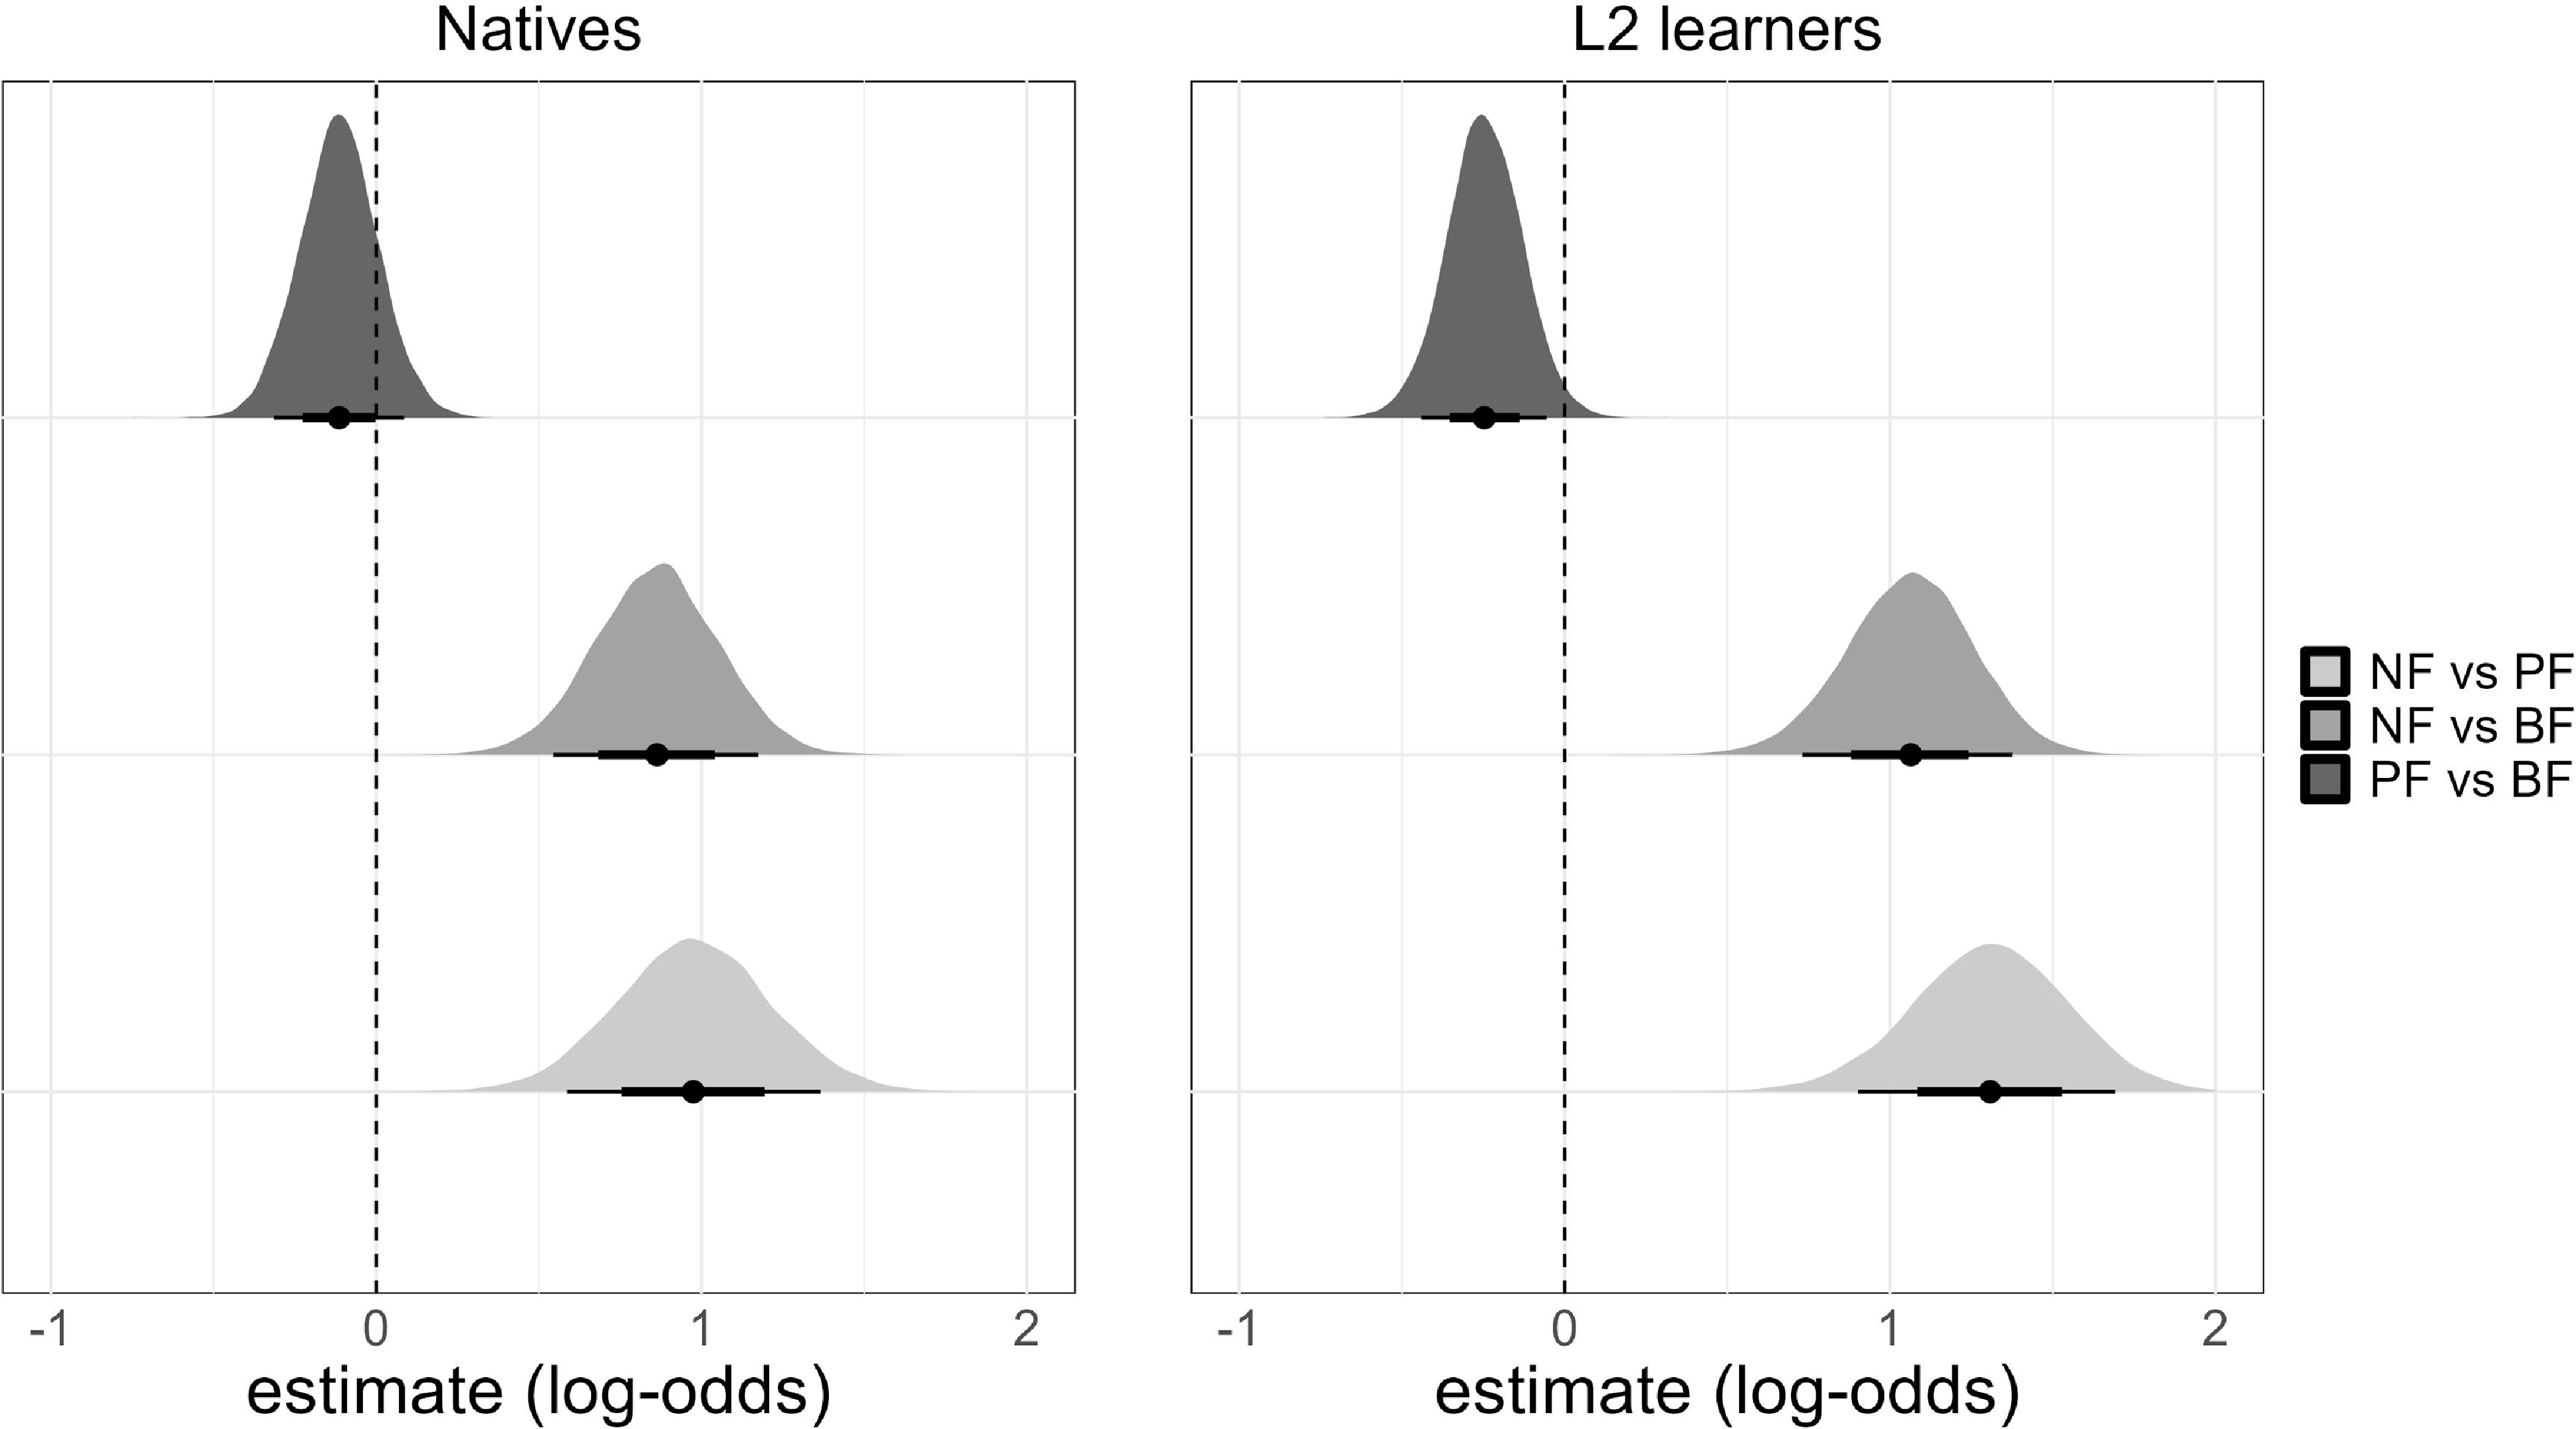
For the native group, the model does not provide robust evidence for target words in PF being rated much lower than target words in the baseline BF (61% versus 64%, $\hat \beta $
= −0.11, 90%-CrI: [−0.31, 0.09], P(
$\hat \beta $
= −0.11, 90%-CrI: [−0.31, 0.09], P( $\beta $
< 0) = 0.83). Yet, ratings in NF were reliably higher than both in BF (80% versus 64%,
$\beta $
< 0) = 0.83). Yet, ratings in NF were reliably higher than both in BF (80% versus 64%, $\hat \beta $
= 0.86, 90%-CrI: [0.54, 1.17], P(
$\hat \beta $
= 0.86, 90%-CrI: [0.54, 1.17], P( $\beta $
> 0) = 1), and in PF (80% versus 61%,
$\beta $
> 0) = 1), and in PF (80% versus 61%, $\hat \beta $
= 0.97, 90%-CrI: [0.59, 1.37], P(
$\hat \beta $
= 0.97, 90%-CrI: [0.59, 1.37], P( $\beta $
> 0) = 1). These results indicate that target words were perceived by native listeners as more prominent in narrow focus than in the other two focal conditions. Yet, target words in broad and post-focal conditions were perceived as equally prominent. Posterior distributions of the parameters are illustrated in the left panel of Figure 12.
$\beta $
> 0) = 1). These results indicate that target words were perceived by native listeners as more prominent in narrow focus than in the other two focal conditions. Yet, target words in broad and post-focal conditions were perceived as equally prominent. Posterior distributions of the parameters are illustrated in the left panel of Figure 12.
Posterior distributions for the focus effects on prominence ratings as a function of group. All parameters are on log-odds scale. Error bars around the posterior means illustrate 66% (thick line) and 90% (light line) credible intervals.

Figure 12 Long description
The image contains two sets of density plots side by side, comparing posterior distributions for prominence ratings between natives and L2 learners. Each set includes three density plots representing different comparisons: NF vs PF, NF vs BF, and PF vs BF. The x-axis represents the estimate in log-odds, ranging from -1 to 2. The y-axis is not labeled but represents the density of the estimates. Each density plot shows a distribution with a mean indicated by a black dot and error bars around the posterior means illustrating 66% (thick line) and 90% (light line) credible intervals. The density plots for natives are on the left, and those for L2 learners are on the right. The distributions show variations in prominence ratings for different comparisons, with the means and credible intervals providing insights into the differences between the groups.
For the L2 group, we find compelling evidence for a rating difference between BF and PF, with target words in PF being rated lower than in BF (41% versus 47%, $\hat \beta $
= −0.25, 90%-CrI: [−0.44, −0.05] P(
$\hat \beta $
= −0.25, 90%-CrI: [−0.44, −0.05] P( $\beta $
< 0) = 0.98). In the case of NF, target words were rated reliably higher than in BF (72% versus 47%,
$\beta $
< 0) = 0.98). In the case of NF, target words were rated reliably higher than in BF (72% versus 47%, $\hat \beta $
= 1.06, 90%-CrI: [0.73, 1.38], P(
$\hat \beta $
= 1.06, 90%-CrI: [0.73, 1.38], P( $\beta $
> 0) = 1) as well as in PF (72% versus 41%,
$\beta $
> 0) = 1) as well as in PF (72% versus 41%, $\hat \beta $
= 1.31, 90%-CrI: [0.9, 1.7], P(
$\hat \beta $
= 1.31, 90%-CrI: [0.9, 1.7], P( $\beta $
> 0) = 1). These differences suggest that L2 learners considered target words in NF as more prominent than in BF and PF, in a similar way to natives. However, contrary to natives, target words appear to have been perceived as less prominent in post-focal position than in broad focus. Posterior distributions of the parameters, for the L2 group, are illustrated in the right panel of Figure 12.
$\beta $
> 0) = 1). These differences suggest that L2 learners considered target words in NF as more prominent than in BF and PF, in a similar way to natives. However, contrary to natives, target words appear to have been perceived as less prominent in post-focal position than in broad focus. Posterior distributions of the parameters, for the L2 group, are illustrated in the right panel of Figure 12.
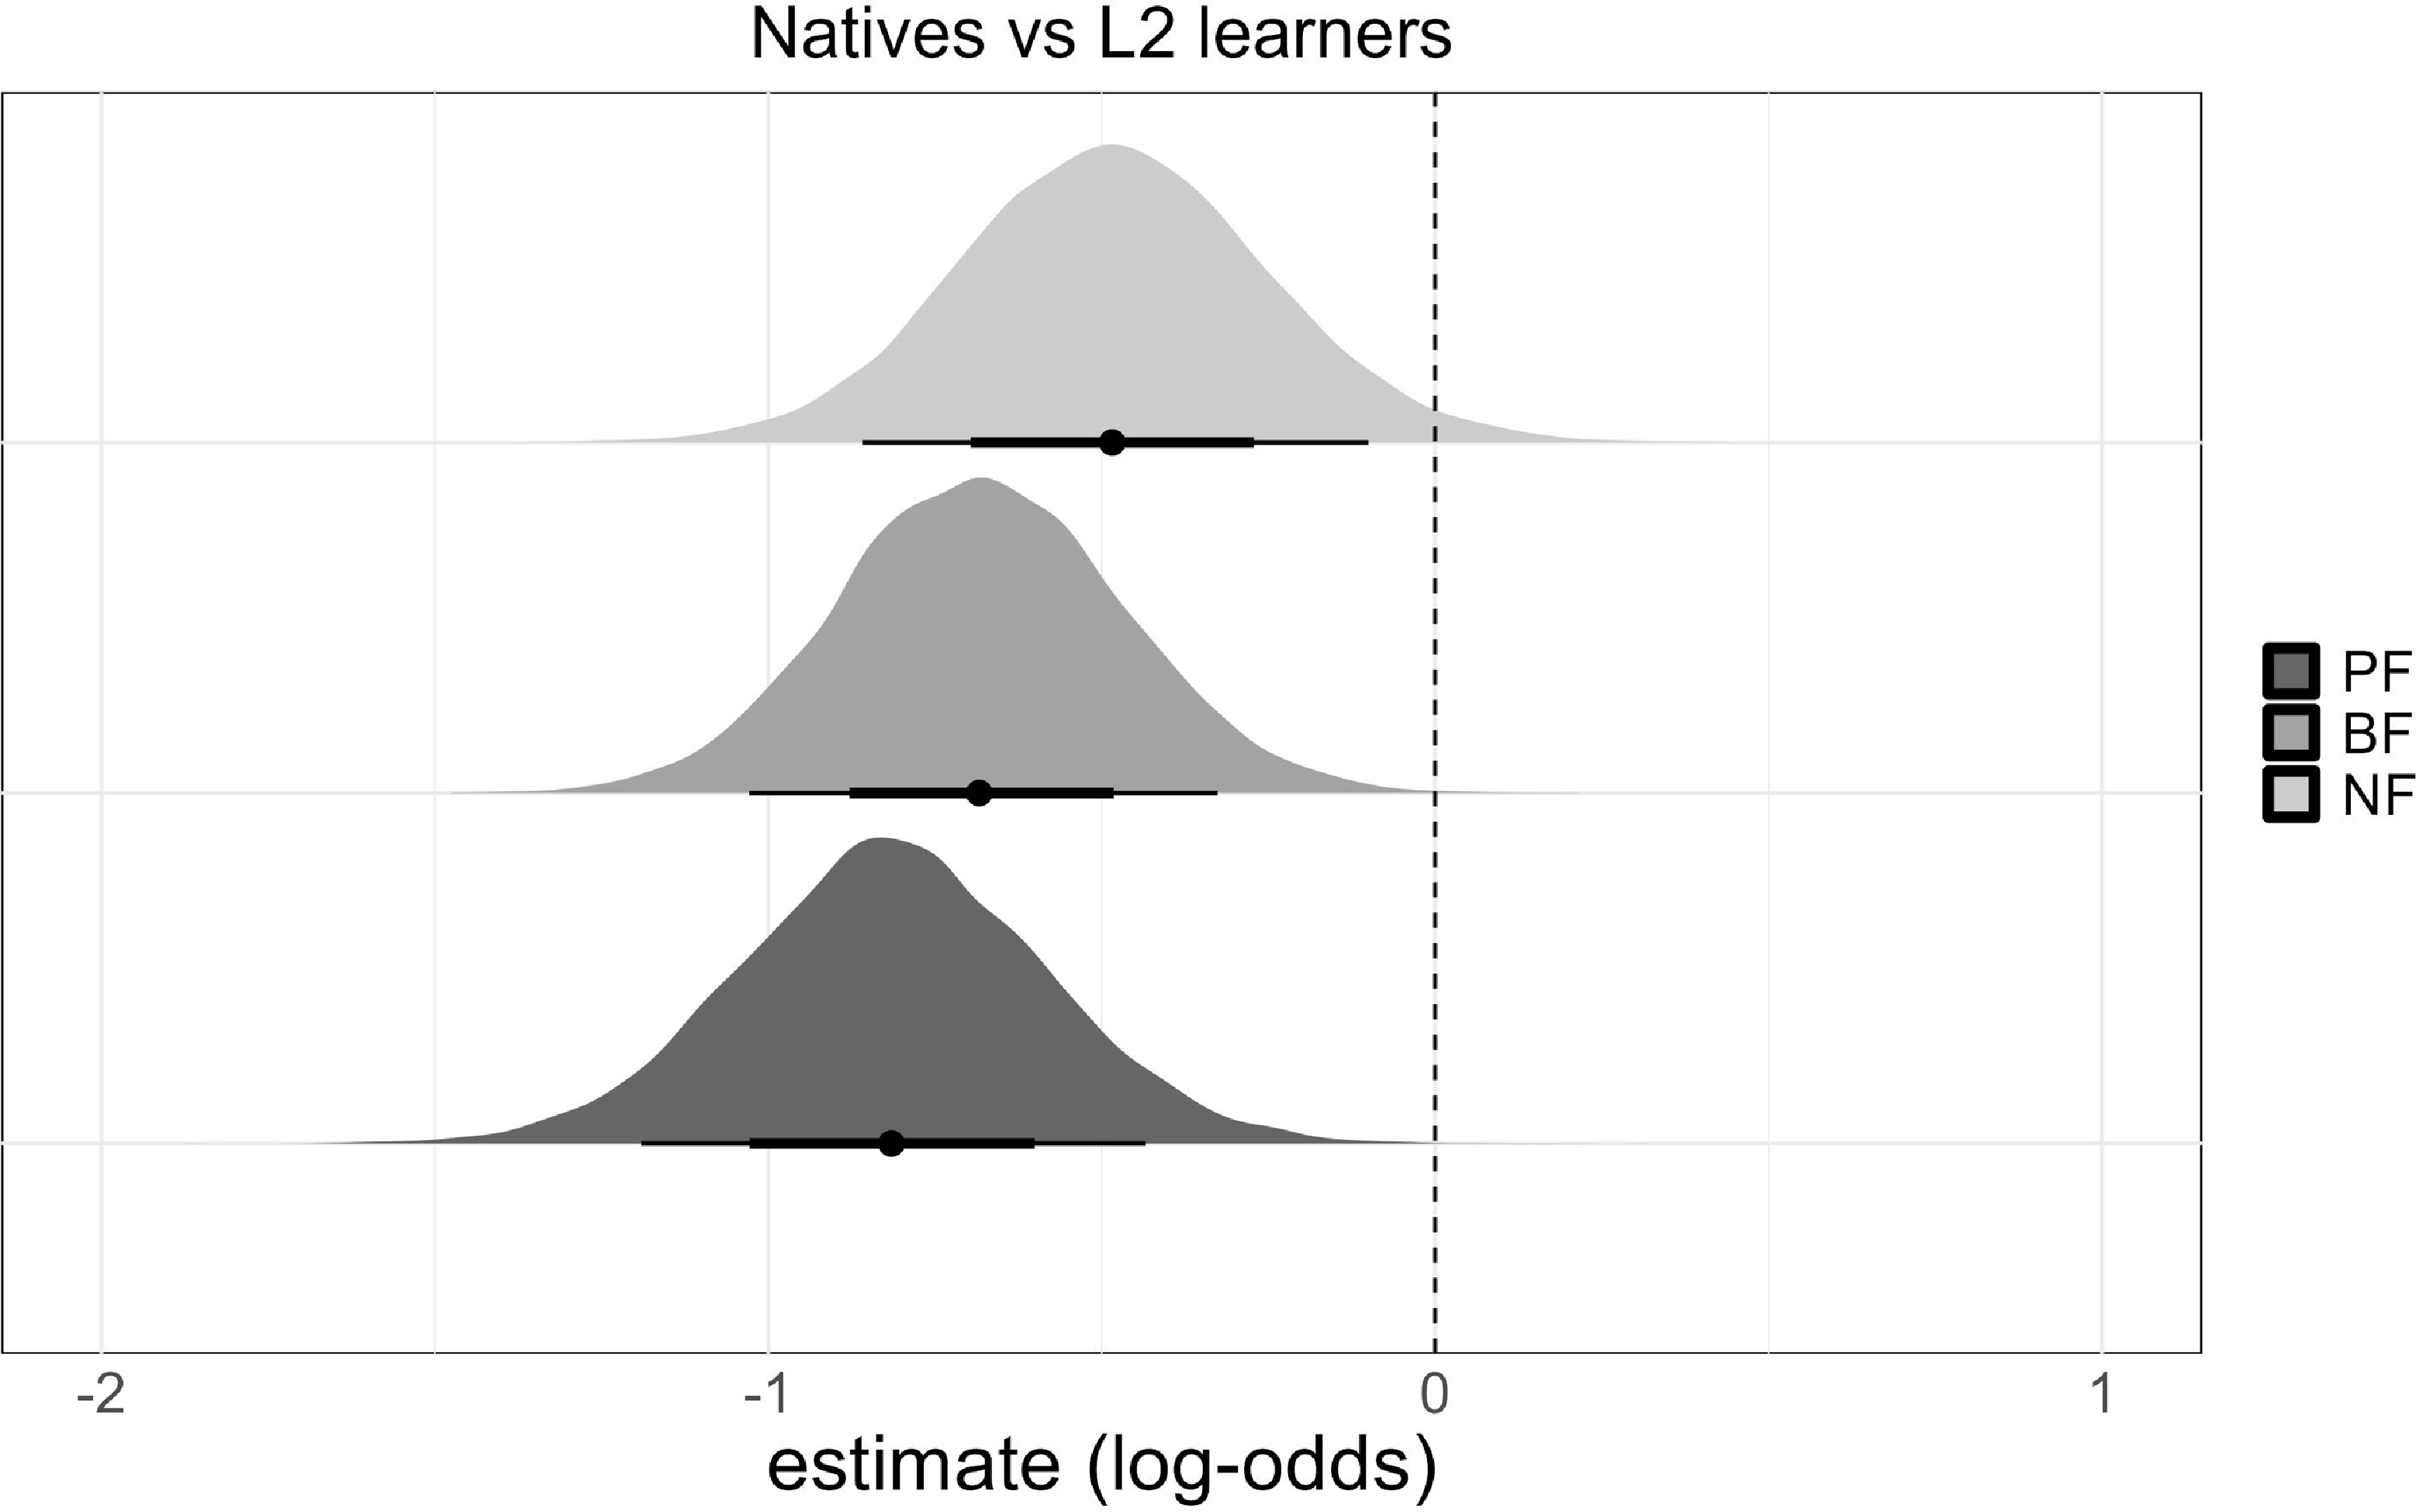
Overall, we found that target words in NF were rated as more prominent than in BF and PF condition by both groups. However, although L2 learners rate target words as less prominent in PF than in BF, natives rate these two conditions as equally prominent. To assess group differences directly, we compare the effect of NF, BF and PF on prominence ratings between groups. The resulting posteriors suggest a strong difference between natives and L2 learners, with L2 learners assigning lower ratings across all conditions compared to natives. Additionally, the posteriors reveal a reliable decrease in prominence ratings from NF to BF to PF by the L2 group compared to the native group (NF, $\hat \beta $
= −0.48, 90%-CrI: [−0.86, −0.1], P(
$\hat \beta $
= −0.48, 90%-CrI: [−0.86, −0.1], P( $\beta $
< 0) = 0.98; BF,
$\beta $
< 0) = 0.98; BF, $\hat \beta $
= −0.68, 90%-CrI: [−1.03, −0.33], P(
$\hat \beta $
= −0.68, 90%-CrI: [−1.03, −0.33], P( $\beta $
< 0) = 1; PF,
$\beta $
< 0) = 1; PF, $\hat \beta $
= −0.81, 90%-CrI: [−1.19, −0.43], P(
$\hat \beta $
= −0.81, 90%-CrI: [−1.19, −0.43], P( $\beta $
< 0) = 1). Posterior distributions are shown in Figure 13.
$\beta $
< 0) = 1). Posterior distributions are shown in Figure 13.
Posterior distributions for the between group differences of the focus effects on prominence ratings. All parameters are on log-odds scale. Error bars around the posterior means illustrate 66% (thick line) and 90% (light line) credible intervals.

Figure 13 Long description
The image presents three overlapping normal distribution curves, each representing the posterior distributions for the between group differences of the focus effects on prominence ratings. The x-axis represents the estimate in log-odds, ranging from -2 to 1, while the y-axis represents the frequency or probability density. The curves are color-coded: the top curve is light gray, the middle curve is medium gray, and the bottom curve is dark gray. Each curve has a bell-shaped, symmetrical distribution, indicating the spread of the data. The mean of each distribution is marked with a black dot, and error bars around the posterior means illustrate 66% (thick line) and 90% (light line) credible intervals. The legend on the right side identifies the curves as PF, BF, and NF. The dashed vertical line at x=0 serves as a reference point. The curves show that the estimates for the focus effects on prominence ratings vary between the groups, with some overlap in their distributions. All values are approximated.
5. Discussion and conclusions
The results generally indicate that when assigning prominence values to words in sentence context, native listeners may take both the acoustic signal and structural expectations into account, whereas learners rely more on the acoustic signal.
Prominence ratings of the target words in narrow focus were consistently higher than for broad focus across the two groups. However, although learners rated words in broad focus as more prominent than those in post-focal position, native speakers of Italian did not rate these differently. This result is particularly striking, given the differences in the acoustic realisation of the target words in the two conditions. The broad focus words have a greater Mass (indicating that they were longer and louder) and a considerably greater f0 span. The fact that Italian listeners did not take this acoustic difference into account indicates that they were using a top-down strategy in their perception of prominence. By contrast, the German learners appeared to be guided by the acoustic saliency of the broad focus words compared to the reduced Mass and f0 span in post-focal position, leading to lower prominence ratings in post-focal position. In this case their judgements could be based on a bottom-up strategy, which is understandable, given their learner status.
Moreover, our results confirm that the preceding prosodic context may also play a role in building up expectations of prominence, in the sense that prominence perception may rely on a language-specific distribution of accents. Learners appear to interpret the low flat pitch of post-focal targets as low in prominence, both because they have less recourse to distributional properties of accents in the language, and possibly also because this is how flat pitch would be in their native language (Röhr & Baumann Reference Röhr and Stefan2010). By contrast, Italian listeners interpret low flat pitch as similarly prominent to dynamic pitch and appear to rely more on their native language-driven expectations to find cues for prominence in post-focal position (Bocci & Avesani Reference Bocci and Avesani2011, Reference Bocci, Avesani and Shlonsky2015). This tendency could be explained by the higher-level structures of the language that play a role in the generation of expectations for the realisation of upcoming words and by the fact that learners seem to prioritise bottom-up inferences (being guided more by the signal).
In line with the study by Ventura et al. (Reference Ventura, Martine Grice, Kolev, Brilmayer and Schumacher2020), where attention to post-focal words is enhanced by flat intonation post-focally (or blocked by a post-focal dynamic pitch accent), it appears that flat pitch has a different status in Italian to German, reflecting the different prosodic systems of the two languages. Since native speakers of Italian perceive these flat stretches as relatively prominent, these results support the analysis of Bocci & Avesani (Reference Bocci and Avesani2011, Reference Bocci, Avesani and Shlonsky2015) who, despite the flat pitch, treat words in this position as accented. Consequently, the analysis of German as a deaccenting language and Italian as resistant to deaccenting appears to hold.
Acknowledgements
We would like to thank Caterina Ventura for her valuable contribution in an earlier stage of this study. We also gratefully acknowledge funding from the German Research Foundation (Project ID 281511265 ‘Prominence in Language’). Preliminary results from this dataset were presented at the third Conference on Phonetics and Phonology in Europe (PaPE 2019).
Appendix A Stimuli and elicitation contexts
Below the sentences selected for the stimuli in the perception experiment are reported. The questions provided were used as contexts for the different focus structures (numbers refer to audio recordings, which can be found at https://osf.io/6kjxr/).
Target word is marked in bold. Elicited prosodic realisations are Broad Focus (BF), contrastive Narrow Focus (NF) and Post-Focal (PF).
Sentence 02
Bisogna prendere gli stivali per il fango
(One should take the boots for the mud)
BF
Cosa bisogna fare quando piove?
(What should one do when it rains?)
NF
Per il fango bisogna prendere gli stivali o i sandali?
(For the mud should one take the boots or the sandals?)
PF
Quando piove bisogna prendere o buttare gli stivali per il fango?
(When it rains should one take or throw away the boots?)
Sentence 03
Bisogna girare la maniglia sulla porta
(One should turn the handle on the door)
BF
Cosa bisogna fare per entrare nella stanza?
(What should one do to enter the room?)
NF
Per entrare nella stanza bisogna girare la maniglia o il chiavistello sulla porta?
(To enter the room should one turn the handle or the latch on the door?)
PF
Per entrare nella stanza bisogna girare o spingere la maniglia sulla porta?
(To enter the room should one turn or push the handle on the door?)
Sentence 04
Bisogna portare il maglione nella borsa
(One should carry the jumper in the bag)
BF
Cosa bisogna fare per non avere freddo?
(What should one do so as not to be cold?)
NF
Quando fa freddo bisogna portare il maglione o il cappello nella borsa?
(When it is cold should one carry the jumper or the cap in the bag?)
PF
Per non avere freddo bisogna portare o lasciare il maglione nella borsa?
(To not be cold, should one carry or leave the jumper in the bag?)
Sentence 05
Bisogna cuocere le ciliegie nella pentola
(One should cook the cherries in the pot)
BF
Cosa bisogna fare per preparare la marmellata?
(What should one do for making jam?)
NF
Per preparare la marmellata bisogna cuocere le ciliegie o i semi nella pentola?
(For making jam, should one cook the cherries or the seeds in the pot?)
PF
Per preparare la marmellata bisogna cuocere o schiacciare le ciliegie nella pentola?
(For making jam, should one cook or mash the cherries in the pot?)
Sentence 07
Bisogna avere la cantina con le botti
(One should have the cellar with the barrels)
BF
Cosa bisogna fare per produrre il vino?
(What should one do to produce wine?)
NF
Per produrre il vino bisogna avere la cantina o la cucina con le botti?
(For producing wine, should one have the cellar or the kitchen with the barrels?)
PF
Per produrre il vino bisogna avere o noleggiare la cantina con le botti?
(For producing wine, should one own or rent the cellar with the barrels?)
Sentence 08
Bisogna usare la pianola con frequenza
(One should use the pianola with frequently)
BF
Cosa bisogna fare per imparare a suonare?
(What should one do to learn to play?)
NF
Per imparare a suonare bisogna usare la pianola o il computer con frequenza?
(To learn to play should one use the pianola or the computer frequently?)
PF
Per imparare a suonare bisogna usare o osservare la pianola con frequenza?
(To learn to play should one use or watch the pianola frequently?)
Sentence 14
Bisogna coprire la ferita con la pomata
(One should cover the wound with the ointment)
BF
Cosa bisogna fare quando ci si taglia?
(What should one do if one cuts oneself?)
NF
Bisogna coprire la ferita con la pomata o con la garza?
(Should one cover the wound with the ointment or the gauze?)
PF
Bisogna coprire o grattare la ferita con la pomata?
(Should one cover or scratch the wound with the ointment?)
Sentence 15
Bisogna comprare un regalo per gli amici
(One should buy a present for one’s friends)
BF
Cosa bisogna fare a Natale?
(What should one do at Christmas?)
NF
Bisogna comprare un regalo o una pianta per gli amici?
(Should one buy a present or a plant for one’s friends?)
PF
Bisogna comprare o riciclare un regalo per gli amici?
(Should one buy or recycle a present for one’s friends?)
Sentence 19
Bisogna pesare la farina con la bilancia
(One should weigh the flour with the scales)
BF
Cosa bisogna fare per preparare la torta?
(What should one do to prepare a pie?)
NF
Bisogna pesare la farina o la vanillina con la bilancia?
(Should one weigh the flour or the vanillin with the scales?)
PF
Per fare una torta bisogna pesare o filtrare la farina con la bilancia?
(To prepare a pie, should one weigh or filter the flour with the scales?)
Sentence 20
Bisogna sbattere la tovaglia dalle briciole
(One should shake off the crumbs from the tablecloth)
BF
Cosa bisogna fare dopo il pranzo?
(What should one do after lunch?)
NF
Bisogna sbattere la tovaglia o i tovaglioli dalle briciole?
(Should one shake off the crumbs from the tablecloth or the napkin?)
PF
Bisogna sbattere o lavare la tovaglia dalle briciole?
(Should one shake off or wash the crumbs from the tablecloth?)
Appendix B Instructions for the prominence rating task
For the Italian listeners:
Per la frase che segue, indica quanto ciascuna delle tre parole evidenziate risulta saliente al tuo orecchio. Per indicarlo, clicca la sua posizione sulla scala di valori.
For the German learners of Italian:
Geben Sie für den folgenden Satz an, wie hervorgehoben die drei Wörtern in Ihren Ohren klingen. Um dies anzuzeigen, klicken Sie jeweils auf eine Position der Werteskala.
Translation into English:
‘For the following sentence, indicate how each of the words sound highlighted to your ear. To indicate this, click a position on the scale.’


 Open access