

Introduction
Radar imaging is one of the primary subsurface analysis methods in glaciology. It provides valuable information on ice thickness (Reference Shabtaie and BentleyShabtaie and Bentley, 1988), internal structure (Reference Jacobel, Gades, Gottschling, Hodge and WrightJacobel and others, 1993; Reference Vaughan, Corr, Doake and WaddingtonVaughan and others, 1999; Reference Ng and NgNg and Conway, 2004; Reference Karlsson, Rippin, Vaughan and CorrKarlsson and others, 2009; Reference BellBell and others, 2011; Reference ChristiansonChristianson and others, 2013), and the dielectric properties of the ice and underlying substrate (Reference BellBell and others, 1998, 2011; Reference Bentley, Lord and LordBentley and others, 1998; Reference Anandakrishnan, Catania, Alley and HorganAnandakrishnan and others, 2007; Reference Woodward and BurkeWoodward and Burke, 2007; Reference Murray, Corr, Forieri and SmithMurray and others, 2008; Reference Oswald and GogineniOswald and Gogineni, 2008; Reference Jacobel, Welch, Osterhouse, Pettersson and MacGregorJacobel and others, 2009, Reference Jacobel, Lapo, Stamp, Youngblood, Welch and Bamber2010; Reference MacGregor, Anandakrishnan, Catania and WinebrennerMacGregor and others, 2011; Reference Christianson, Jacobel, Horgan, Anandakrishnan, Alley and andChristianson and others, 2012; Reference Matsuoka, Pattyn, Callens and CallensMatsuoka and others, 2012). Proper survey design should ensure that collected data can be used to accurately address all three of these unknowns. This means designing and deploying suitable radar systems, collecting data at appropriately high spatio-temporal frequencies, processing in a way that best preserves true layer geometries and amplitudes, and interpreting data within limitations imposed by the collection process.
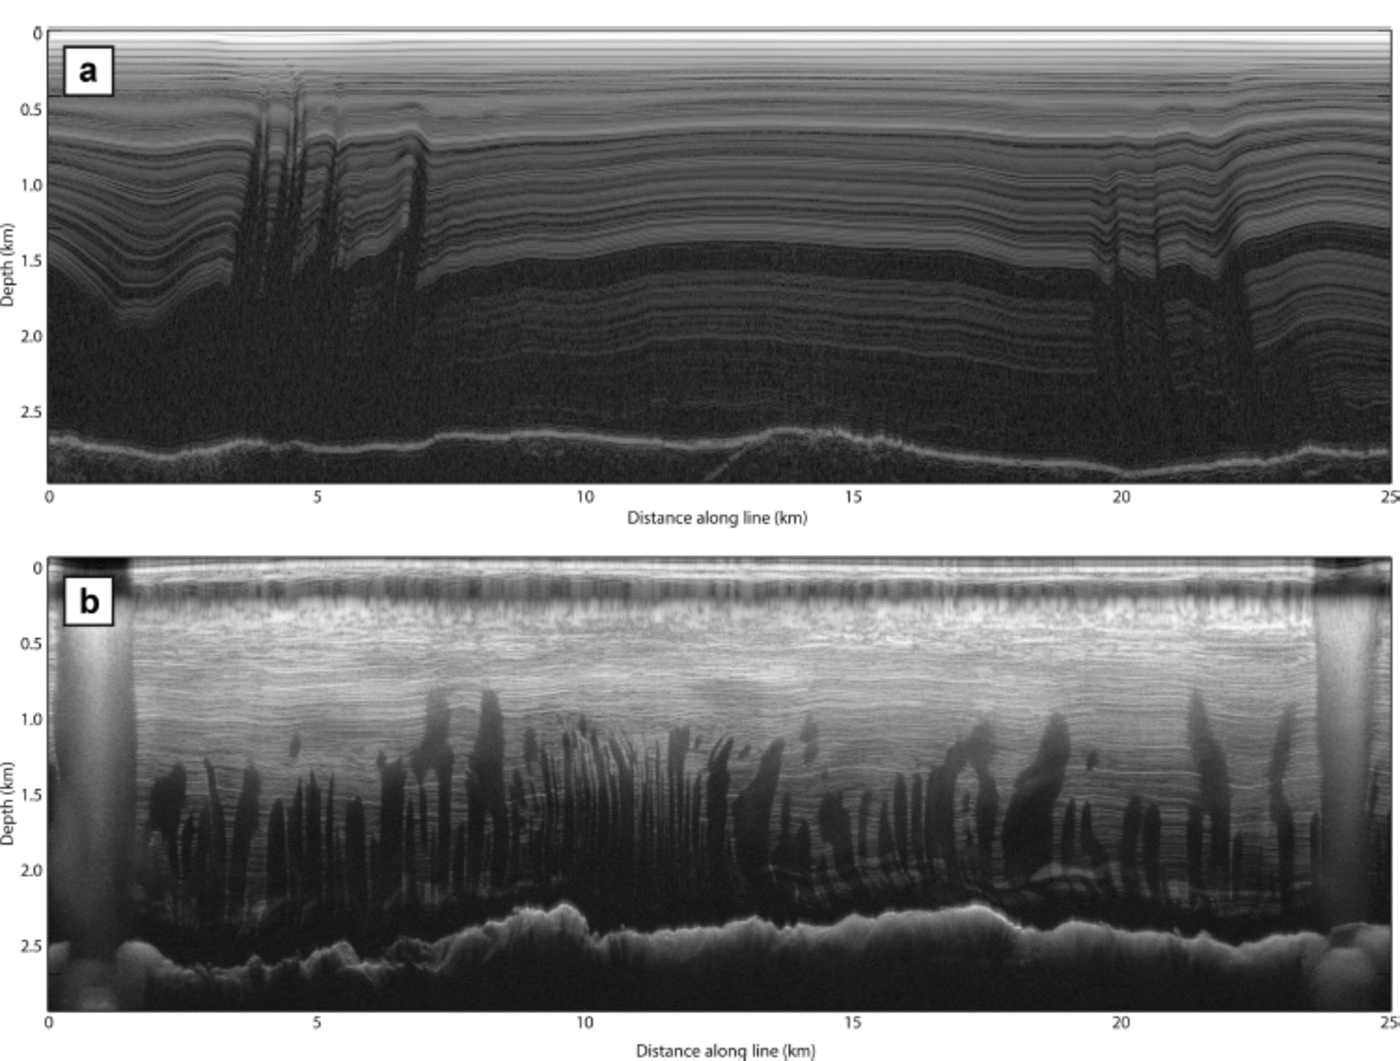
Reference Matsuoka, Morse and RaymondMatsuoka and others (2010) noted anomalous amplitude reduction above steep beds in radar data collected near the West Antarctic ice sheet (WAIS) divide. These lossy regions introduced strong lateral gradients in inferred internal reflectivity. We noticed a similar power drop in ground-based radar data collected over northeast Greenland, where internal layers vanish in the shear margins of the northeast Greenland ice stream (NEGIS). Similar, but more pervasive, data losses commonly occur in airborne campaigns over West Antarctic ice streams, which are glaciological targets due to their recent thinning, but are often difficult to image in ground surveys due to crevassing and other logistical difficulties. In order to accurately image and interpret steeply dipping internal horizons, it is necessary to characterize, and, if possible, correct for, this power reduction. Figure 1 shows a typical manifestation of these anomalies in both ground-based and airborne data: the disappearance of steeply dipping internal reflectors, with greater losses at depth. Some bright reflectors are present with diminished amplitude in the lossy areas, and seem to indicate that loss is spatially coincident with steeply dipping internal reflecting horizons (IRHs).
Data collected over (a) the northeast Greenland ice stream and (b) Thwaites Glacier. NEGIS data were collected via a ground-based survey during summer 2012, using the St Olaf monopulse radar system (Reference Welch and JacobelWelch and Jacobel, 2003). Thwaites Glacier data were collected via an airborne survey during the 2009/10 austral summer, using the CReSIS (Center for Remote Sensing of Ice Sheets, University of Kansas, USA) Multichannel Coherent Radar Depth Sounder/Imager (MCoRDS/I).
The reflection power loss affects our ability to interpret IRHs in two ways: we cannot trace layers continuously and we cannot interpret layer reflection amplitude as an unaltered indicator of dielectric contrast, but rather as a combination of the effects of dip and dielectric effects.
Internal layer tracing is a primary means of determining the deformation history of an ice sheet. These data can be used to make inferences about both flow dynamics and basal conditions (Reference Jacobel, Gades, Gottschling, Hodge and WrightJacobel and others, 1993; Reference Vaughan, Corr, Doake and WaddingtonVaughan and others, 1999; Reference Conway, Catania, Raymond, Scambos, Engelhardt and EngelhardtConway and others, 2002; Reference Ng and NgNg and Conway, 2004; Reference Karlsson, Rippin, Vaughan and CorrKarlsson and others, 2009, Reference Karlsson, Rippin, Bingham and Vaughan2012; Reference BellBell and others, 2011; Reference ChristiansonChristianson and others, 2013). Regions with highly deformed IRHs tend to be in areas of dynamic flow, such as shear margins; however, the steep dips and the resulting amplitude loss make it impossible to reliably trace these layers (Reference Karlsson, Rippin, Bingham and VaughanKarlsson and others, 2012).
Significant time and energy are needed to manually pick internal reflectors. As a result, developing automated layer-tracking algorithms is a high priority in radioglaciology (Reference Sime, Hindmarsh and CorrSime and others, 2011). One of the greatest barriers to full automation is low data quality, often arising from data losses such as those described in this study. As the posting interval between traces grows, it becomes more difficult to discern spatial links between individual amplitude peaks. Energy minimization algorithms in layer-tracking software attempt to do this, but the accuracy of picks falls with increasing trace spacing (Reference Sime, Hindmarsh and CorrSime and others, 2011). If power losses due to reflector dip were eliminated, the layer-tracking problem would be much simpler.
Radar amplitude analysis is a powerful tool for determining basal conditions, such as water content at the bed (Reference Gades, Raymond, Conway and JacobelGades and others, 2000; Reference Oswald and GogineniOswald and Gogineni, 2008; Reference Jacobel, Welch, Osterhouse, Pettersson and MacGregorJacobel and others, 2009; Reference MacGregor, Anandakrishnan, Catania and WinebrennerMacGregor and others, 2011; Reference Christianson, Jacobel, Horgan, Anandakrishnan, Alley and andChristianson and others, 2012). To isolate the effect of dielectric properties on reflection amplitude, all other sources of amplitude loss must first be corrected. Although the data plotted in Figure 1 do not obviously indicate whether the mechanisms which result in anomalous amplitude loss in IRHs directly affect amplitudes at the bed, this IRH amplitude loss can affect the final interpretation of bed reflections in other ways. For example, in order to accurately determine the reflection power of the ice/bed interface, englacial attenuation must be estimated. This calculation is often done using amplitudes collected from internal reflectors (Reference MacGregor, Winebrenner, Conway, Matsuoka, Mayewski and ClowMacGregor and others, 2007, Reference MacGregor, Matsuoka, Waddington and Winebrenner2012; Reference Jacobel, Welch, Osterhouse, Pettersson and MacGregorJacobel and others, 2009; Reference Matsuoka, Morse and RaymondMatsuoka and others, 2010). If dip effects that distort internal layers at depth also affect amplitudes of shallower IRHs, the attenuation coefficients calculated using those internal reflectors will be incorrect.
As a result, identifying the source and correcting for loss in reflection amplitudes is crucial to analysis of ice-stream shear margins, grounding zones and other complex flow regimes.
The problem can be summarized in the following way:
Is this power loss a physical phenomenon intrinsic to the dielectric properties of the ice and the reflector, or is it the result of data recording and processing?
Does the process affect the reflection power of all non-horizontal IRHs, or is there a threshold behavior for IRH slopes larger than a critical value?
Does the observed non-homogeneous power loss in the ice column affect the bed reflector as well?
Here we propose and assess several mechanisms for the effective power loss phenomenon seen in Figure 1, and determine whether these losses can be eliminated through optimization in survey design and processing. For power loss that cannot be recovered, we discuss how it must be considered in subsequent glaciological analysis. First, we establish the theoretical mechanisms for reflection power loss in deformed ice. Then we apply our results to two datasets (NEGIS and Thwaites Glacier) and make recommendations to minimize data loss in future surveys.
Amplitude Reduction Mechanisms
Geometric controls on subsurface imaging are well explored in the seismic imaging literature (Reference Yilmaz and DohertyYilmaz and Doherty, 2001). Here we collect the processes that are geometry-dependent, with a focus on spatial aliasing and trace stacking. The effects of some dip-dependent controls on amplitude are difficult to generalize, but are enumerated for future, survey-specific analyses. We address the proposed mechanisms in the following order: refraction limits, destructive stacking, synthetic aperture radar (SAR) processing, ray path extension and source directivity.
Refraction limits
The contrast between the electromagnetic wave speed in air (~3x10⁸ ms- 1), in snow ~2x10⁸ ms- 1 ) and in ice (~1.68x10⁸ms-1) produces a focusing effect on radar waves penetrating an ice sheet. Downgoing waves are refracted toward nadir, preventing energy from being sent out at the wide angles necessary to image steeply dipping specular reflectors. As a result, airborne radar is severely limited in its ability to image dipping IRHs. To compute the imaging threshold for dipping reflectors, the only parameters required are the wave speeds at the transmitter and at the imaging target; changes in wave speed along the ray path between the transmitter and reflector are irrelevant (Bogor-odsky and others, 1985). This critical angle (and therefore imaging threshold) for plane-mounted radar targeting reflectors in glacial ice is 34.1°. These refraction limits in airborne radar have been described by Reference Dowdeswell and EvansDowdeswell and Evans (2004), and comparable restrictions exist in ground-based surveys.
In the accumulation zone, if the radar and the surface are well coupled (i.e. if the signal wavelength exceeds the distance between the antenna and the snow surface), the wave speeds used for the critical angle calculation change from air and ice to snow and ice. To estimate the electromagnetic wave speed in snow, we use the empirical relationship between firn density and refractive index derived by Reference RobinRobin (1975) and subsequently validated by Reference Kovacs, Gow and MoreyKovacs and others (1995). Using an assumed snow density of 300-400kgm-3, the maximum downgoing angle will be between 44.7° and 48.8°. Data collected by ground-based radar in the ablation zone, where glacial ice is exposed at the surface, are not subject to refraction limitations.
Unlike amplitude loss due to destructive stacking, which affects all reflectors of nonzero dip, refraction-controlled limitations are not gradual. When the reflector dip exceeds the critical angle threshold, there is no energy backscatter detected at the receiver and IRHs are not imaged. Because of these limits, only angles less than 50° will be considered for the remaining amplitude loss mechanisms.
Destructive stacking
Most radars stack traces in hardware before recording. Hardware stacking is fast, allowing large numbers of traces to be collected and stacked in an effort to improve the signal-to-noise ratio (SNR), while also reducing the data rate. If the reflector is dipping, the reflections in the component traces of a stack will be slightly out of phase, instead of perfectly in phase as in the case of a horizontal reflector. As a result, stacking over long distances in the presence of a dipping reflector may even reduce the SNR.
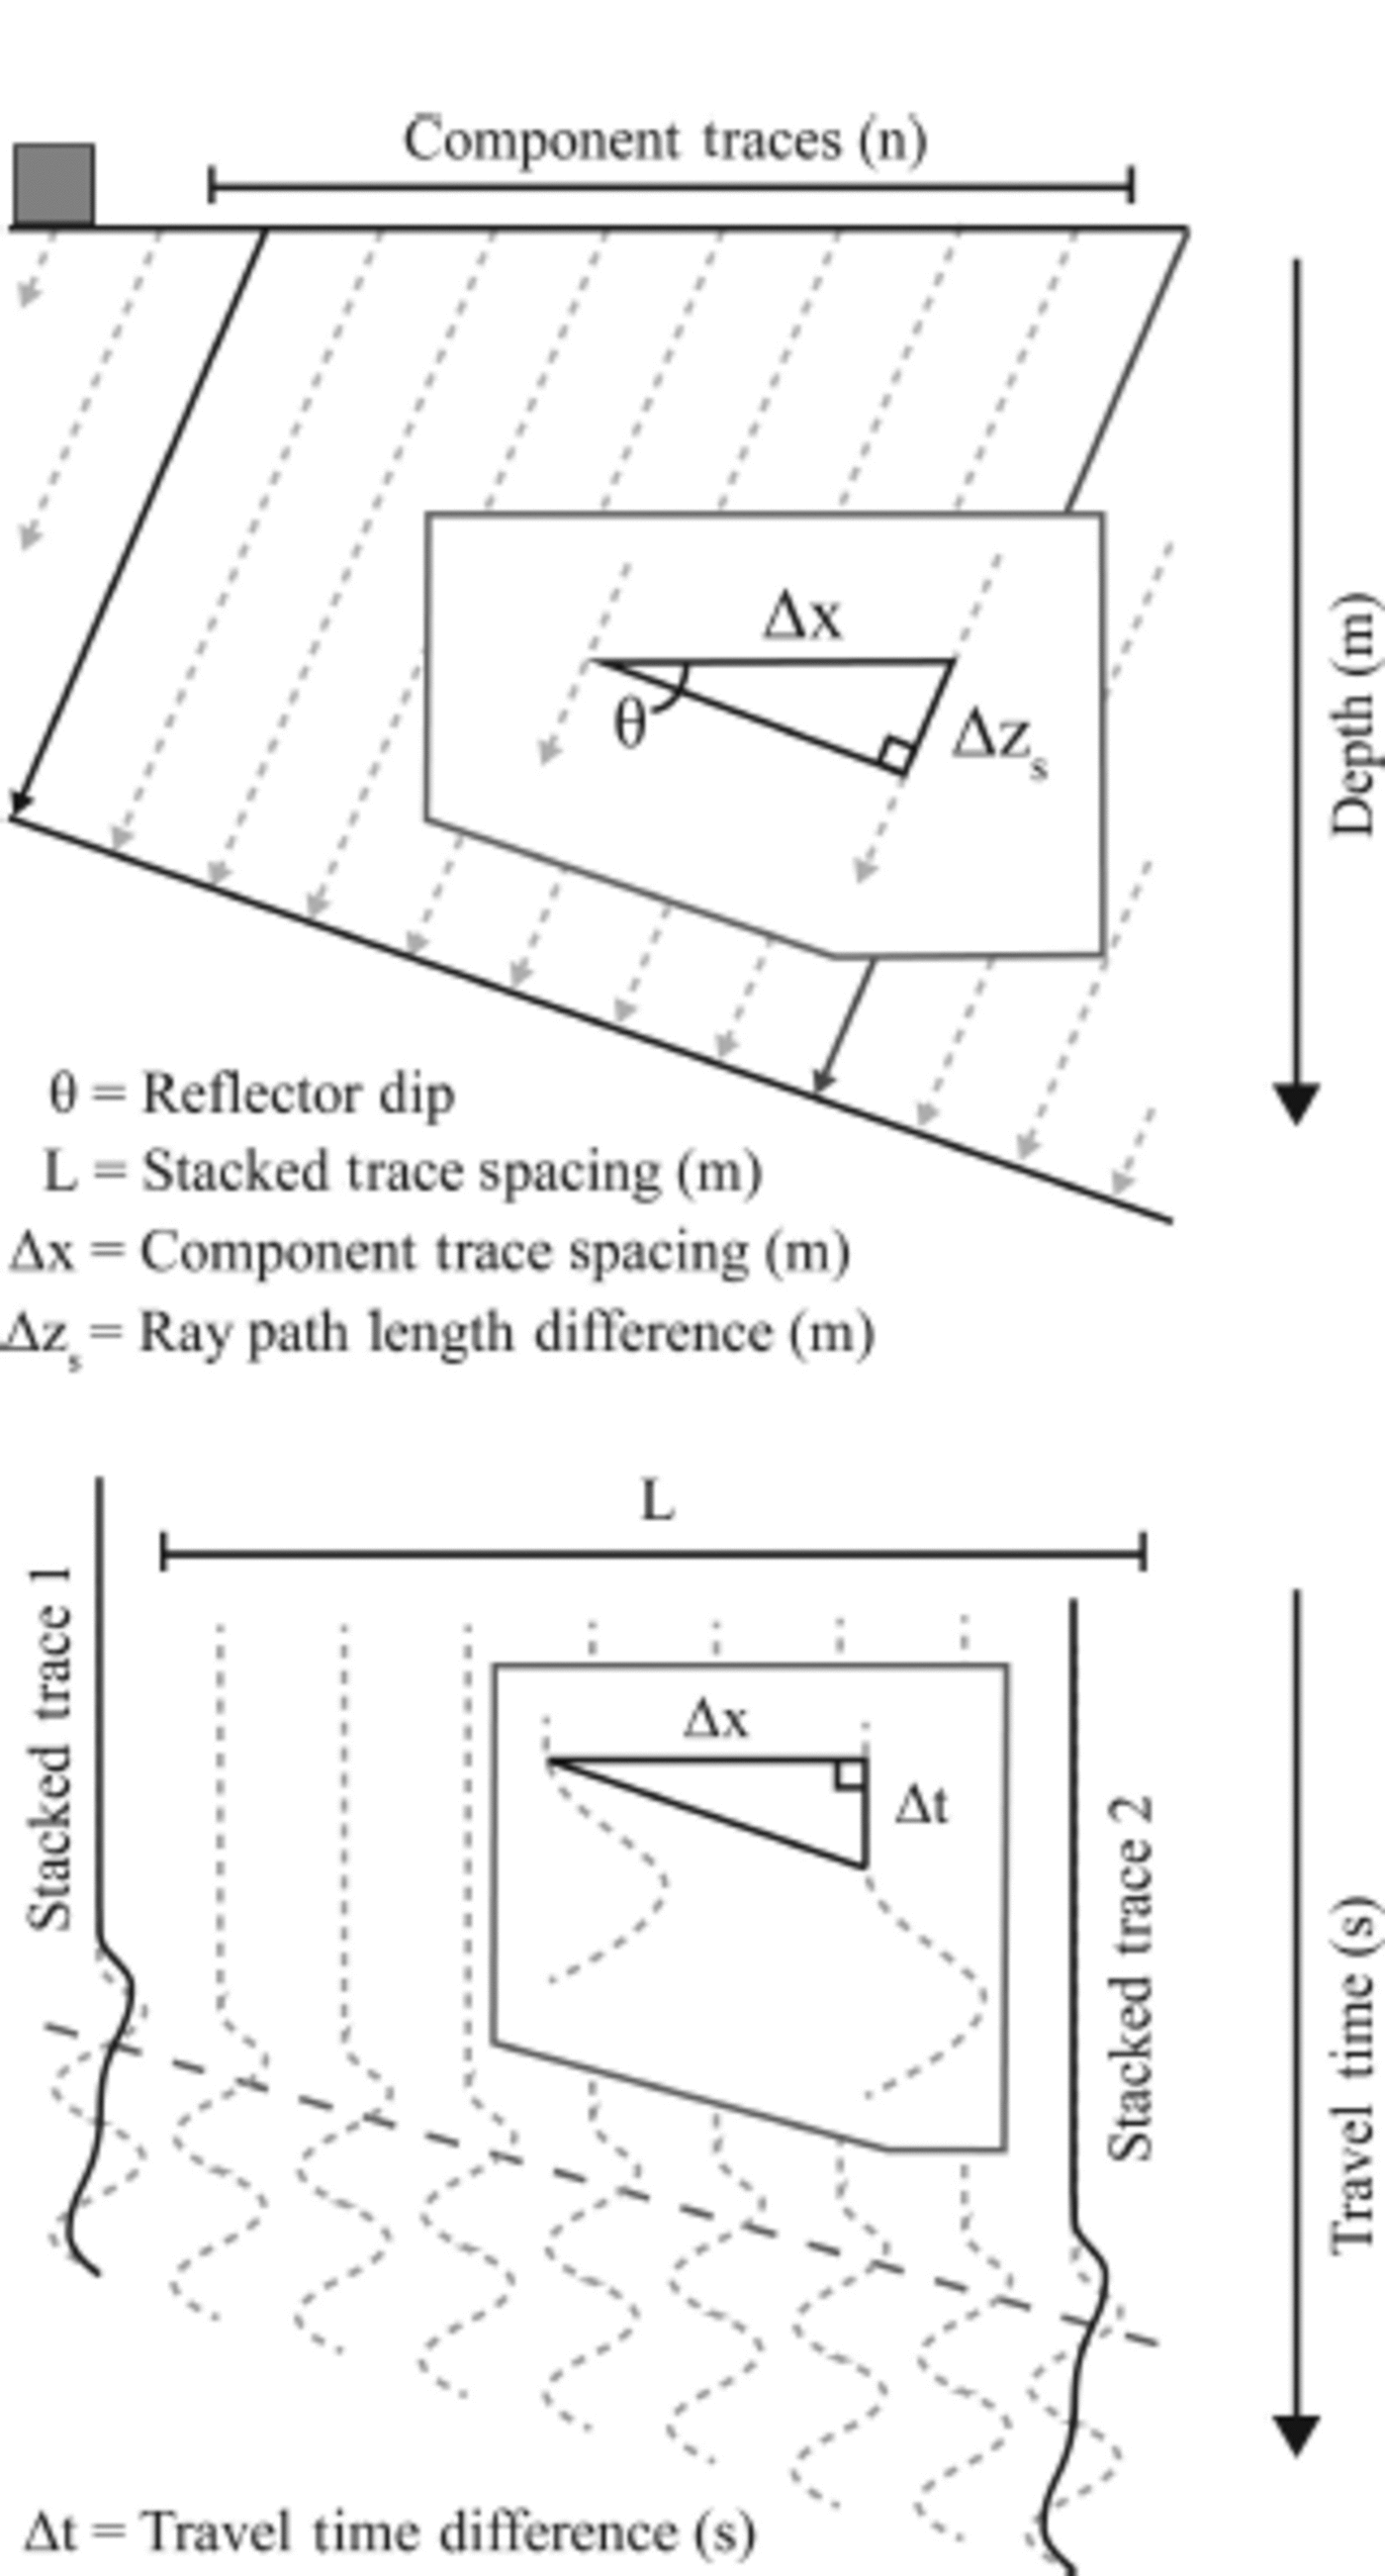
To quantify the relative loss in power due to destructive stacking, consider the numerical framework and geometry in Figure 2. Individual traces are collected over a finite distance, △x, and every n traces are summed to form a single stacked trace (which have posting distance L). For a reflector dipping at some value θ≠0, the two-way travel time for a reflection signal changes between adjacent traces, At. Synthetic stacks were produced to determine the power loss using Eqns (1-5) for a variety of frequencies, f, postings, L, and dip angles, θ .
Geometry of the subsurface imaging process (top) and the resulting data in the space-time domain (bottom). Incident rays perpendicular to the specular reflector are received by the antenna and recorded. Component traces (dotted lines) are stacked to produce the final traces (solid lines) in an effort to improve the SNR of the data. The relationship between additional perpendicular distance, △zs, and additional travel time, △t, is given by Eqn (3).
The range of parameters selected for modeling were chosen based on realistic survey characteristics, exemplified by the surveys presented in Figure 1. Frequencies ranging from 1 MHz to 1 GHz were modeled, allowing us to explore the potential for destructive stacking in high-frequency radar (3-30 MHz), used for deep sounding, very high-frequency (VHF) radar (30-300MHz), used for imaging intermediate depth at higher resolution, and ultra-high-frequency radar (300-1000 MHz), used for near-surface imaging and determination of accumulation rate. We varied stacked trace spacing from 0 to 25 m, and reflector dip angles between 0° and 50°. The number of component traces contributing to each stack does little to change the relative amplitudes of stacked traces under different geometries, so we chose 2000 component traces, consistent with the survey performed at the NEGIS.
Equations (1–3) relate the data collection geometry to the resulting phase shift between reflections in adjacent traces:
where c is the speed of light in the medium. Once At has been computed for each component trace in the stack, the synthetic traces can be represented mathematically as sinusoids incorporating these incremental phase shifts:
The sum of these n component traces, Ti , results in a stacked trace:

The peak amplitudes of the resulting stacked traces were converted to powers, and normalized against the power produced by a flat reflector. These results are plotted in Figure 3 as a function of corresponding reflector geometry and radar frequency. Over short stacking distances this process has little effect on reflection power (Fig. 3a). An airborne platform traveling at 80ms-1, stacking over 0.5 s intervals (i.e. a stacking interval of 10 m), will produce stacks similar to the image in Figure 3b. Even at dip angles of ~20°, which are common in deformed ice, radar frequencies higher than 150 MHz see a 6dB drop in return power (50% drop in return amplitudes). Figure 3c shows the expected power loss as a function of reflector dip for common ground-based (3 MHz, 5 m posting) and airborne (140-160 MHz, 10 m posting) survey designs.
Using Eqn (5), we produced synthetic traces at varying frequencies, reflector dips and stacking intervals, in an effort to quantify the power loss caused by destructive interference. (a, b) Normalized powers at common ground-based and airborne posting intervals, showing power loss with increasing reflector dip. (c) Expected powers for two specific surveys, using 3MHz frequency and 5 m posting to characterize a typical ground-based survey, and 140–160 MHz with a 10 m posting for a typical airborne survey.

SAR processing and spatial aliasing
Raw radar traces are not simply one-dimensional records of the subsurface at nadir. Each trace contains information from off-nadir reflections. To convert raw radar data into a spatially resolved image of the subsurface, energy from off-nadir reflections must be returned to its correct subsurface location through a correction called SAR processing (also referred to as ‘migration’ in the geophysical community). SAR processing uses information from adjacent traces to collapse detected energy back to the reflector location, based on the radar wave propagation speed in the medium being imaged (described in detail by Reference Legarsky, Gogineni and AtkinsLegarsky and others, 2001). Numerically, this process can be performed in several ways, each with its own limitations. If the original data are lossless, yet the post-migrated image contains power losses such as those seen in Figure 1, spatial aliasing of off-nadir reflections may play a significant role in signal destruction.
Many migration schemes exist, each with its own advantages and disadvantages. F-K (frequency-wavenumber) schemes provide computational expedience, but do not allow for the incorporation of lateral variation in wave speed, while Kirchhoff and finite-difference schemes allow more customization of the spatial domain, but require more time to calculate (Reference Yilmaz and DohertyYilmaz and Doherty, 2001). Associated with each method are migration parameters, such as the calculation aperture width and in some cases even the maximum dip to migrate. When selecting a migration scheme, parameter selection should be considered carefully, as certain computation apertures will prevent the coherent migration of steeply dipping layers.
While there are intrinsic limitations to individual migration schemes, none of the different computational methods will recover the original geometry if the data are spatially aliased. As explained by Reference Yilmaz and DohertyYilmaz and Doherty (2001), the equality that defines spatial aliasing follows directly from Eqn (3). When At exceeds half of the wave period, the reflector is aliased. Therefore, we can define the stacked trace spacing, △x, at which the signal is aliased for a given reflector dip, θ, and radar frequency, f, as
Using this equation we can define the aliasing threshold for a given trace spacing and radar frequency Fig. 4). Reflectors which dip at an angle exceeding this threshold will not coherently migrate; energy reflecting from these horizons will be dispersed and increase the noise level in adjacent data. As is evident from Figure 4, VHF radar (30–300 MHz) are prone to aliasing dipping reflectors at common posting intervals. Thus, to ensure proper migration, a narrow trace collection interval must be used.
Plot of the aliasing threshold for internal reflectors as a function of radar frequency and posting interval (contour interval of 58). Dip angles exceeding the aliasing threshold for a given survey configuration will not coherently migrate, preventing those IRHs from being imaged and instead dispersing their energy as noise into the rest of the profile.

Path length
Because dipping layers are imaged from off-nadir angles, the path length for radar waves imaging steep reflectors is longer than the path to flat reflectors at comparable depths. This additional distance the wave traverses will reduce the reflection amplitude, due to three effects: spherical spreading interface reflection losses and additional englacial attenuation. Transmission losses at interfaces are known to be small (Reference MacGregor, Winebrenner, Conway, Matsuoka, Mayewski and ClowMacGregor and others, 2007), so here we focus on spherical spreading and attenuation. It may be possible to correct these amplitude losses through post-processing; however, the order in which the three corrections occur (migration, spherical spreading and attenuation) has the potential to affect the accuracy of the final reflection strength.
When examined in log space (denoted by square brackets), the reflection power, [Пr]dB, can be expressed in terms of the source strength, [Пs]dB, spherical spreading losses, [S]dB, and englacial attenuation, [A]dB (Reference Bogorodsky, Bentley and GudmandsenBogorodsky and others, 1985; Reference Matsuoka, Morse and RaymondMatsuoka and others, 2010):
Equations (8) and (9) define the spherical spreading and attenuation losses in terms of the distance traveled, r, and a characteristic attenuation length, N:
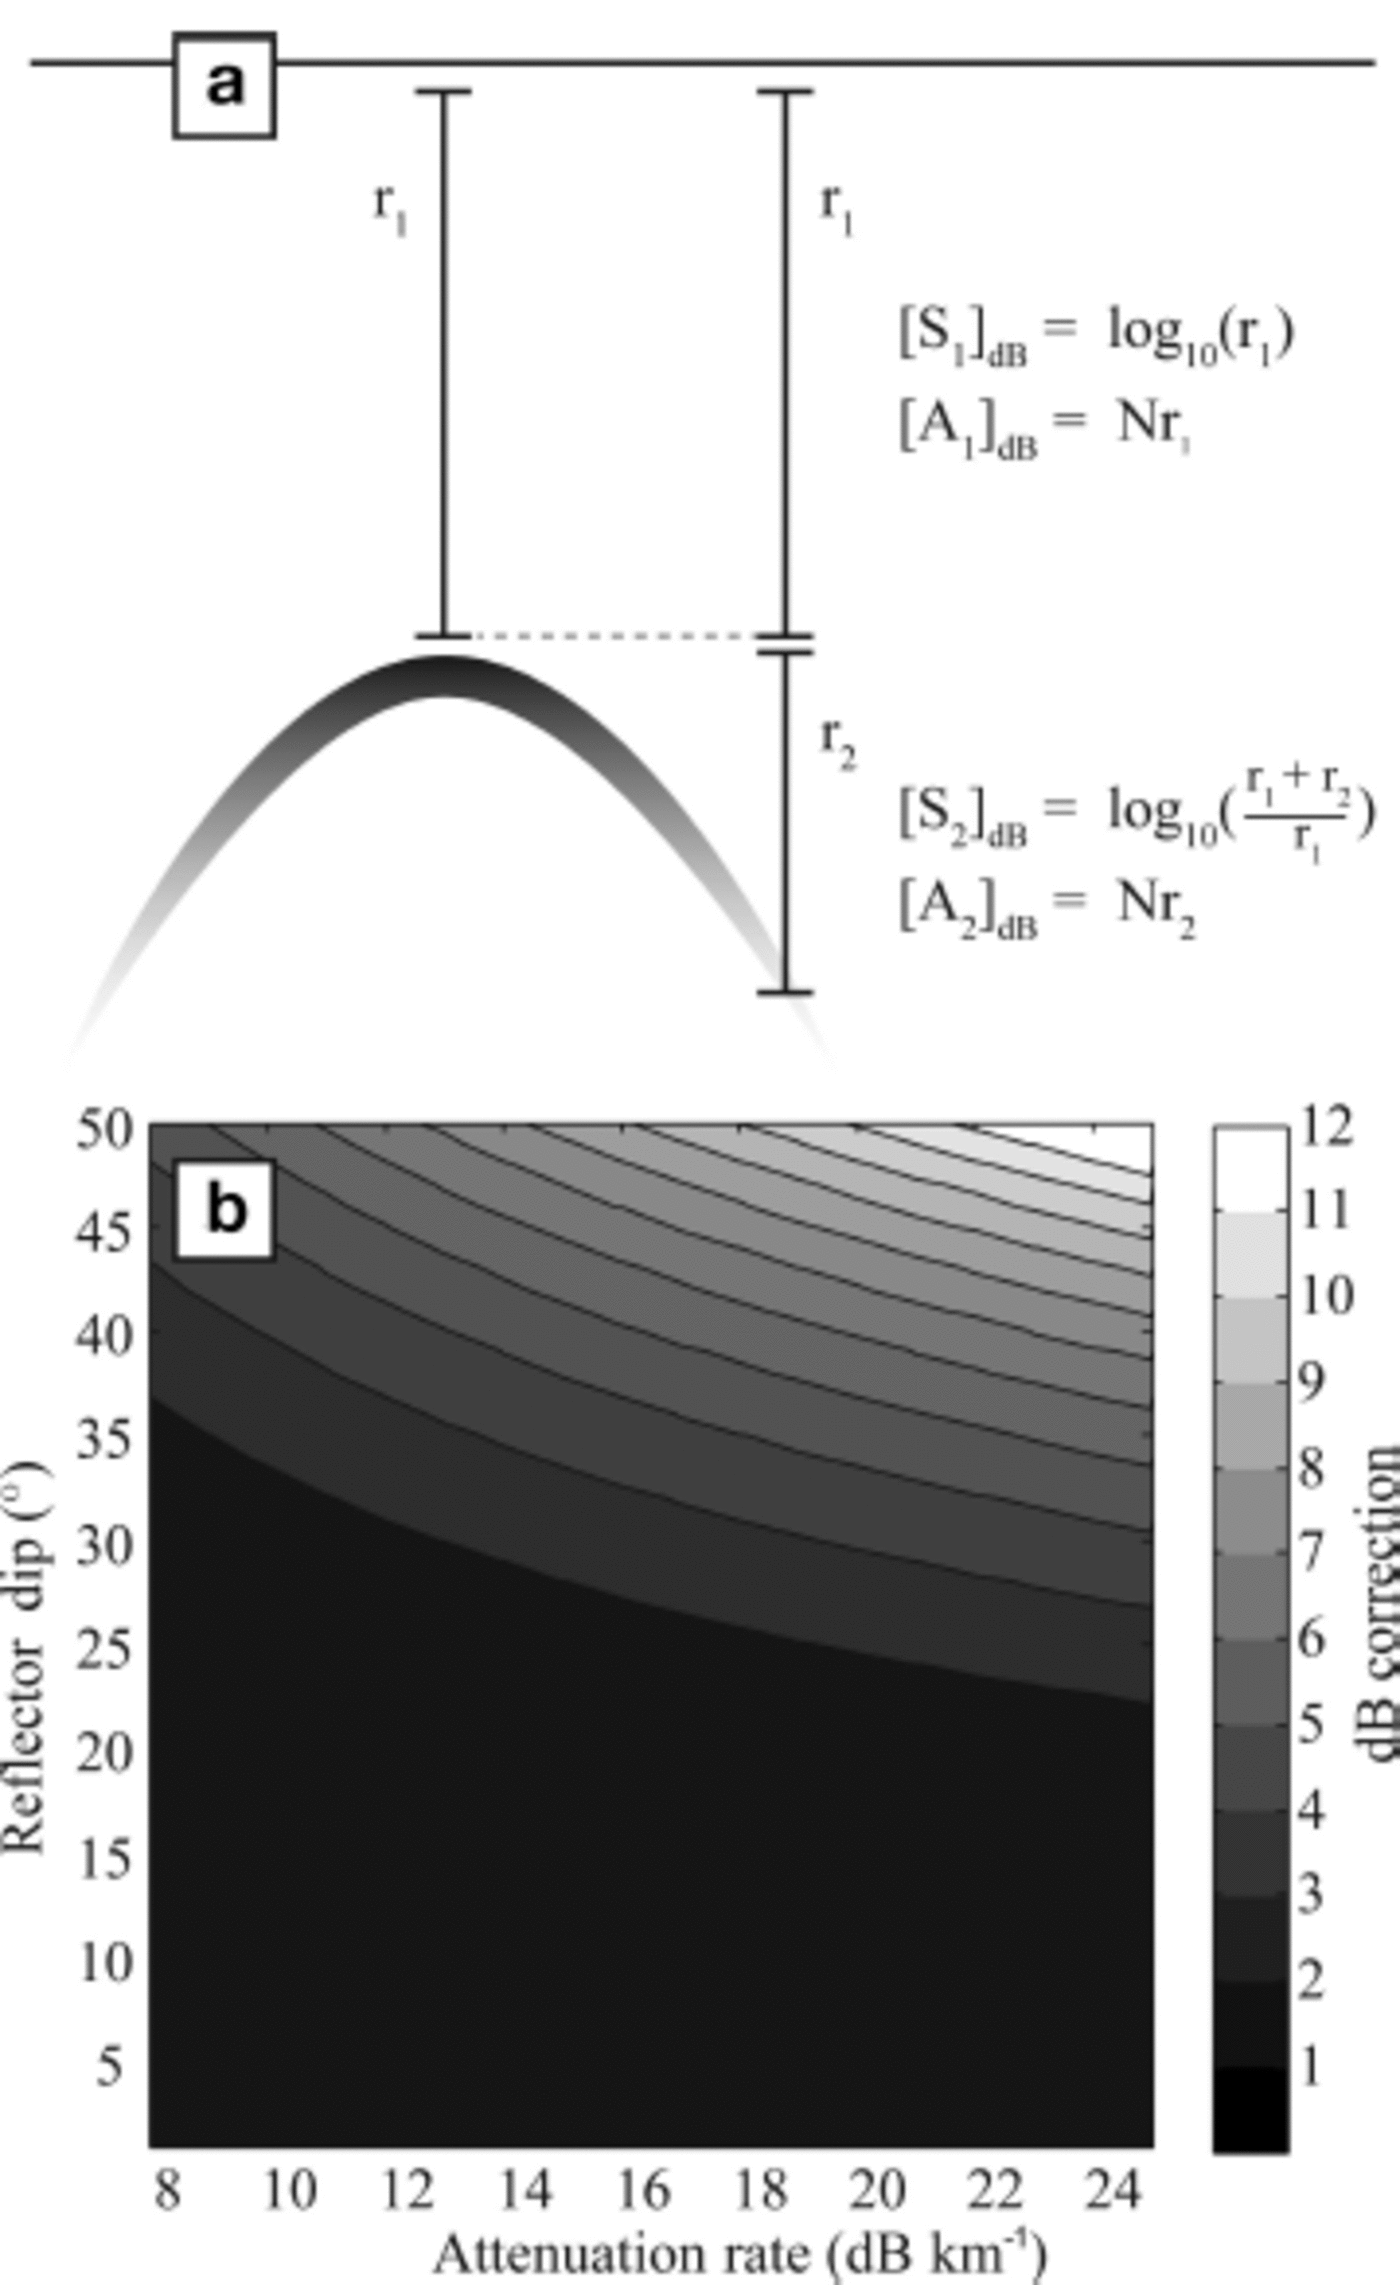
Figure 5 illustrates this problem conceptually. We define [S1]dB and [A 1 ]d B to be the spherical spreading and attenuation losses, respectively, that correspond to a nadir path to a given subsurface reflector, and [S 2]dB and [A2]dB as the additional losses associated with an off-nadir ray path to that same reflection point. Migration techniques often include a correction for [S 2]dB. Correcting for spherical spreading and attenuation before migration would correct for amplitude losses over the entire ray path (i.e. [A 1 ]d B, [A 2]dB, [S 1 ]d B and [S 2]dB). Migrating the data after these corrections would result in double correction for [S 2]dB, resulting in an erroneously high amplitude. Correcting for attenuation and radial spreading after migration fails to correct for [A 2]dB, because the energy is returned to the nadir location before the effects of attenuation are removed. This can cause a significant change in the reflection strength, depending on the reflector dip and attenuation rate (Fig. 5b). Thus, the proper correction order is attenuation, migration then radial spreading. When done correctly, no additional error will be introduced as a result of the enhanced attenuation and spherical spreading for dipping reflectors.
(a) An individual diffraction hyperbola. Reflections from a dipping bed are analogous to the flanks of the hyperbola; SAR processing/migration returns that energy to the apex, which is inferred to be the true reflector location in the subsurface. (b) The amplitude correction, [A2]dB, that is required to recover the true amplitude for a reflector at 1 km depth, for a variety of attenuation rates collected from the literature (Reference MacGregor, Winebrenner, Conway, Matsuoka, Mayewski and ClowMacGregor and others, 2007, Reference MacGregor2013; Reference Oswald and GogineniOswald and Gogineni, 2008; Reference Matsuoka, Morse and RaymondMatsuoka and others, 2010). The magnitude of the [A2]dB correction increases with reflector depth.
Source directivity
Radar antennas are not identical in their directivity, and the variations with angle of the electromagnetic field generated by the radar may cause significant differences in return amplitude when imaging dipping reflectors. The angular distribution of energy transmitted for any antenna is described by its radiation pattern. Most radar antennas designed for subsurface imaging are optimized at nadir, and gain diminishes the further off-nadir the target. For the dipole antenna used on the NEGIS, there are no amplitude nodes, so their ability to image dipping reflectors off-nadir is quite good (Reference Arcone, Spikes and HamiltonArcone and others, 2005). The MCoRDS/I L1B published data presented in Figure 1 have a narrow beamwidth in the cross-track orientation (~208), but along-track the radar system can image all angles (Reference Rodríguez-MoralesRodríguez-Morales and others, 2013). The overall impact of source directivity on the imaging of dipping reflectors depends on the radar used. Thus, source directivity should be considered when selecting or building a radar system for a survey intending to image specular layers with significant dip.
The role of specularity
Internal reflectors outside of bed-controlled ‘echo-free zones’ are known to be specular (Reference DrewsDrews and others, 2009), meaning only incident energy normal to the reflecting surface can be imaged. As a result, the ray paths that image reflectors of different dips vary greatly, causing the amplitude losses described above. The ice/rock interface, however, is in most places a diffuse reflector, and therefore radar backscatter is detected at nadir regardless of bed dip. As a result, imaging the bed is not subject to the same refraction and ray path limitations as internal reflectors. Additional complications may arise as a function of the ‘effective radiation pattern’ of the bed; diffuse reflectors send energy away at non-incident angles, but do so as a function of their specific structure. The distribution of energy reflected from the bed will vary from survey to survey, and spatially within a given survey area. The amplitude loss mechanisms discussed above are constructed using the assumption of specularity, and as a result the defined equations cannot be applied to the bed.
Application to Published Data
Northeast Greenland ice stream
During the 2012 field season, ~350 line-kilometers of ground-based radar data were collected in upstream portions of the NEGIS. The survey sampled ice in streaming flow, shear margins characterized by steeply dipping IRHs, and the slow-moving ice flanking the ice stream. The survey was performed using the St Olaf 3 MHz monopulse radar with dipole antennas (Reference Welch and JacobelWelch and Jacobel, 2003; Reference Welch, Jacobel and ArconeWelch and others, 2009; Reference Christianson, Jacobel, Horgan, Anandakrishnan, Alley and andChristianson and others, 2012). Two thousand waveforms were stacked in hardware to form one coherent trace, resulting in a trace spacing of ~8 m. Trace spacing was linearly interpolated to precisely 8 m in post-processing. Most of the survey area showed horizontal or sub-horizontal IRHs (picked using the methods of Reference Gades, Raymond, Conway and JacobelGades and others, 2000). Internal reflectors near the shear margins of the ice stream, however, exhibited strong deformation. In these data, it is clear that deformation is driven by variations in basal shear stress, as internal slopes are most extreme near the bed (Reference ChristiansonChristianson and others, 2013). The transition from flat reflectors near the surface to steep reflectors at depth is consistent with the power loss in both panels of Figure 1, which shows lossy areas that intensify toward the bed from their depth of onset.
IRH slopes up to 400 are imaged before coherent backscatter ceases to return to the receiver. This limit is consistent with the refraction limitations for ground-based radars. There are observed power losses in the transition zones between horizontal reflectors and the lossy regions. Figures 3c and 4 both indicate that neither stacking nor aliasing should result in significant power reductions for this low-frequency radar data, leaving enhanced attenuation as the only other potential power reduction mechanism. A close examination of the folds in the shear margins at 1200 m depth shows amplitude variations from one limb of the fold to the other. The steeper limb, which dips at 25.88, has a reflection power ~0.93 dB lower than the flatter limb, which dips at 5.78. Using Eqn (9) and the geometry of the reflector, this is consistent with an attenuation rate of ~13dBkm-1.
Thwaites Glacier
As a part of NASA's Operation IceBridge, the CReSIS (Center for Remote Sensing of Ice Sheets, University of Kansas, USA) Multichannel Coherent Radar Depth Sounder/Imager (MCoRDS/I; Reference Rodríguez-MoralesRodríguez-Morales and others, 2013) was deployed on several airborne platforms over Antarctica and Greenland to image the interior of the ice sheet. In the configuration used to collect the data presented in Figure 1b, MCoRDS/I was mounted to a Twin Otter aircraft, transmitting 140-160MHz chirped signals over six separate, coherently averaged antennas to increase SNR and allow digital beam steering. In hardware, the MCoRDS/I system performs 16-fold stacking over ~0.22 m. CReSIS publishes these data in an ‘L1B’ processed form, with the six channels coherently averaged, migrated using an along-track F-K scheme. Other processing techniques would allow for beam-forming across range; however, in the standard averaging scheme used for the published data product, the antennas produce a fixed beam at nadir.
Power loss in the Thwaites Glacier data is prevalent compared to the NEGIS data for two reasons: (1) the SAR processing scheme employed by CReSIS uses a beamwidth of 108 in the Doppler domain, effectively filtering out steeply dipping reflectors, and (2) the geometry of the internal reflectors is more complex at Thwaites Glacier than at the NEGIS. While it is possible to determine the dip angle at which internal reflectors are lost (-48), almost no signal is preserved in the lossy regions, making it impossible to use the published data product to constrain the maximum dip angle achieved outside the horizontal, resolved sections. Without additional data, we cannot assess the observed deformation, preventing even qualitative analysis in this glaciologically interesting region.
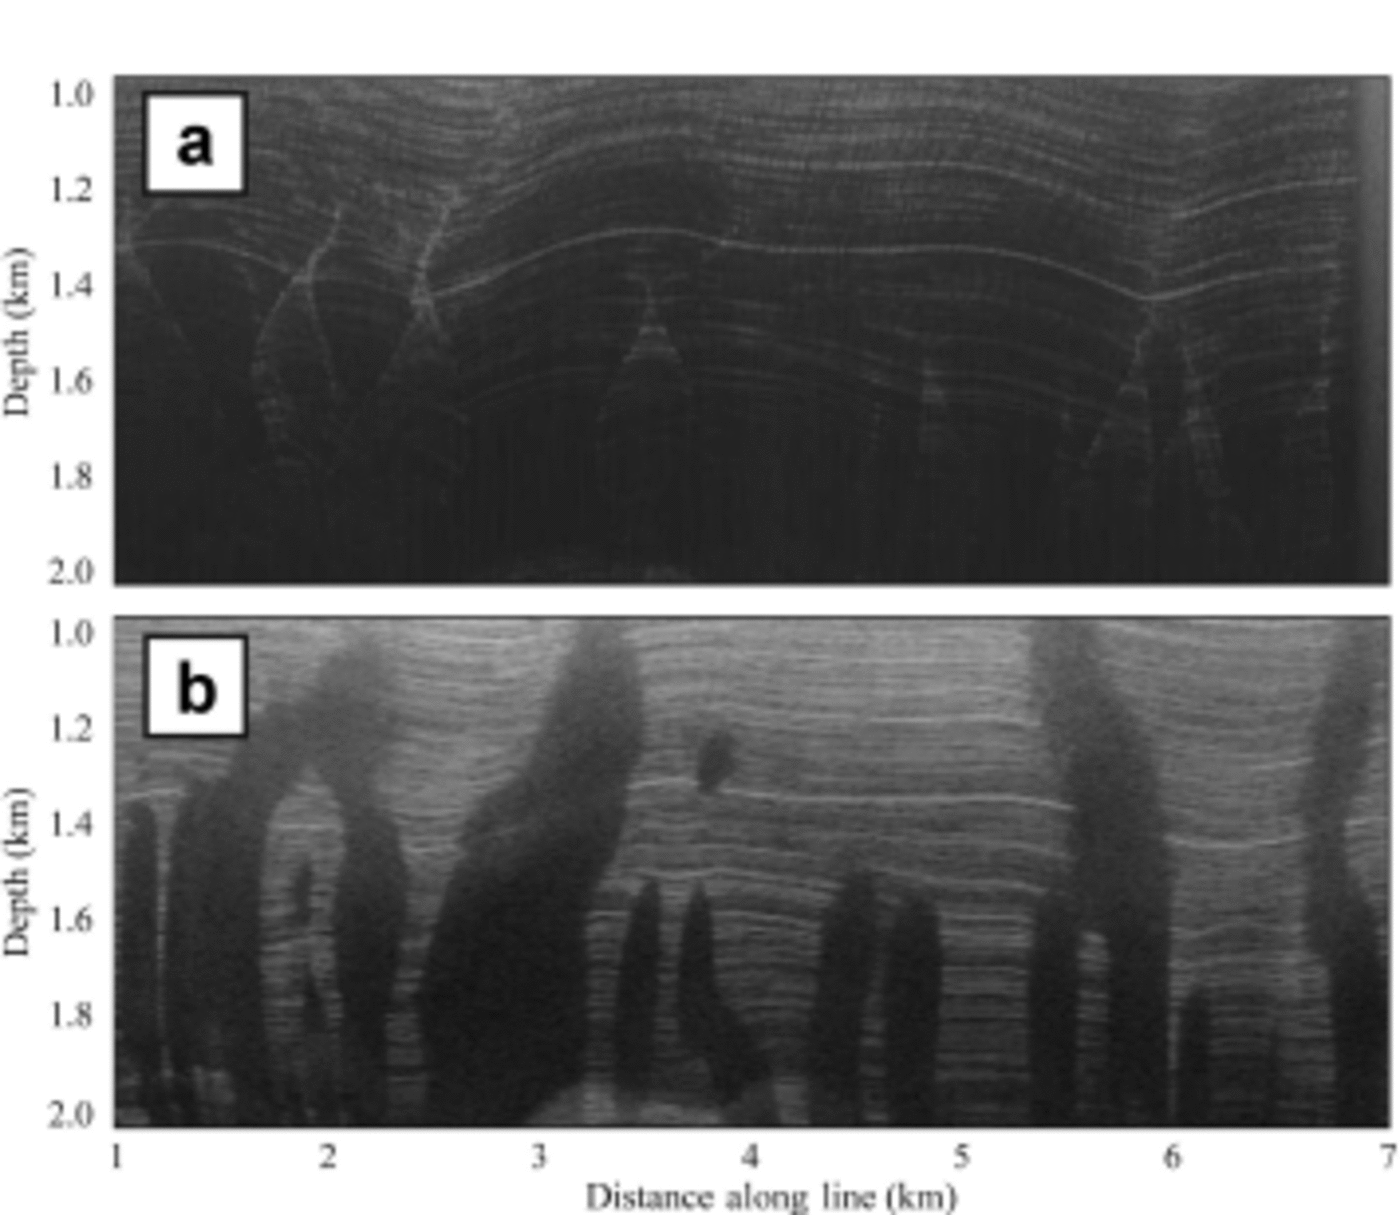
Raw data were provided by CReSIS for the purposes of this study, and Figure 6 plots these data along with the published data product. Lossy regions in the ‘L1B’ product correspond well to areas in which internal reflectors cross, colloquially known as ‘bow ties’, commonly found in unmigrated data where synclines are present. The brightest reflector is easily traceable in the unmigrated section, but is obscured in areas of steepest dip after SAR processing.
Plots of (a) pre-migrated and (b) post-migrated sections from the Thwaites Glacier dataset. Lossy regions often correspond to intersecting horizons in the unmigrated section that result from steeply dipping IRHs.
Discussion and Conclusions
The motivation for this study was to explain, and ideally prevent, vanishing IRHs in radar data collected over ice sheets. These losses occur not only in the radar data presented here, but are also commonly found in data in the literature (Reference Karlsson, Rippin, Vaughan and CorrKarlsson and others, 2009, Reference Karlsson, Rippin, Bingham and Vaughan2012; Reference Matsuoka, Morse and RaymondMatsuoka and others, 2010, Reference Matsuoka, Pattyn, Callens and Callens2012; Reference BellBell and others, 2011; Reference VaughanVaughan and others, 2012; Reference Le BrocqLe Brocq and others, 2013), and therefore must be addressed. Reflector dip is ultimately the cause of data loss in both surveys presented above, but the primary loss mechanism is different between the Thwaites Glacier data and the NEGIS data. The NEGIS survey failed to image only the most extreme dips of >408, whereas published data from the Thwaites survey contain only internal reflectors dipping <48. The mechanism that prevented coherent imaging differed between the two radar systems. Wave focusing by refraction and incoherent migration from aliased layers causes the complete loss of steep reflectors at depth, but other processes (e.g. destructive stacking and ray path extension) affect the amplitude of all subsurface layers.
Because destructive stacking, spatial aliasing and ray path extension may distort amplitudes across the entire profile, it is important that amplitude interpretation of the successfully imaged internal reflectors account for these mechanisms. IRHs with dip angles under the aliasing threshold are still subject to destructive stacking losses. Systematic steepening of reflector dip with depth (as seen in Fig. 1) could result in the calculation of artificially high attenuation rates, as the magnitude of amplitude loss due to destructive stacking increases with depth. These amplitudes must either be corrected using the relationship indicated by Figure 2, or the amplitudes of dipping reflectors should be ignored.
Higher platform velocities make airborne surveys more susceptible to data loss, which can be alleviated through higher data collection rates and shorter stacking intervals in regions of intense deformation. IRHs with extreme dips simply cannot be imaged with airborne radar, due to refractive limitations on imageable surfaces; however, slopes exceeding these thresholds are uncommon. Shear margins and other regions of complex flow, where these slopes are most likely to occur, are better mapped by ground surveys. Different glacial environments have characteristic internal geometries, and using our knowledge of IRH geometries from previous surveys of the ice-sheet interior, grounding zones and shear margins, we might better inform future radar campaigns imaging these environments. Table 1 presents the longest posting interval that will still image the steepest internal reflectors for a given environment, based on the amplitude destruction mechanisms discussed in this study.
Survey suggestions to minimize the effects of destructive stacking, spatial aliasing and incoherent migration for common ice-stream environments. Values in the table are the maximum suggested posting interval to preserve dipping specular reflectors

Lower-frequency radar data can be stacked over longer distances without data destruction, and ground-based radar suffers less from refraction limitations. But airborne systems, such as MCoRDs/I, have significant advantages: airborne radar data can be collected more quickly and over broader areas at lower cost than ground-based alternatives, and high-frequency radar provides better depth resolution. Through beam-steering techniques and SAR processing, multichannel coherent radars also have the potential to perform swath imaging of the subsurface, dramatically increasing the coverage without any additional field time. As radar systems and analysis become more sophisticated, it is important that researchers collecting data do so in the most useful way for the broader glaciological community. This means targeting internal layers as well as the bed, and collecting data in a way that accurately preserves amplitude and phase. While survey and radar design has historically focused on imaging a particular depth, or best resolving the basal reflector, we suggest that surveys should also take into account a priori knowledge of the likely geometry of internal reflectors when determining the radar frequency, data collection rates and stacking distances to employ.
Acknowledgements
We thank John Paden, Jilu Li, Joe MacGregor and our collaborators at the University of Kansas, for their assistance in working with the CReSIS data. Funding for the data collection was provided under US National Science Foundation (NSF) grant No. OPP-0424589 and NASA grant No. NNX10AT68G, with CReSIS funding coming from grant No. 0852697. Additional funding was provided under the NSF Graduate Research Fellowship, grant No. DGE1255832.


