


Introduction
Most of the time, bilingual speakers succeed in selecting their target language for speaking in a given language context and avoiding interference from a nontarget language (Poulisse, Reference Poulisse1999; Poulisse & Bongaerts, Reference Poulisse and Bongaerts1994). Only occasionally language intrusion errors occur, which concern the involuntary use of words from the nontarget language, such as a Dutch–English bilingual saying “where is my fiets” to her English-speaking friend when she finds her bike stolen (“fiets” is the Dutch word for “bike”). Such errors may happen in different contexts, for example, after a change of interlocutor or in the presence of interfering background conversation. The rarity of language intrusion errors suggests strong language control mechanisms that normally keep the languages apart (Declerck & Philipp, Reference Declerck and Philipp2015; Green, Reference Green1998; Green & Wei, Reference Green and Wei2014). The mechanisms underlying language control and language selection have been studied extensively: for example, using picture-word interference and language switching paradigms (e.g., Boukadi, Davies & Wilson, Reference Boukadi, Davies and Wilson2015; Hermans, Bongaerts, De Bot & Schreuder, Reference Hermans, Bongaerts, De Bot and Schreuder1998; Meuter & Allport, Reference Meuter and Allport1999; Zheng, Roelofs, Farquhar & Lemhöfer, Reference Zheng, Roelofs, Farquhar and Lemhöfer2018a). However, it has remained unclear why and where in the speaking process language intrusion errors, as a failure of control over target language production, may take place.
Producing a spoken word requires first preparing the intended concept to be expressed, and then continuing to generate the word through lexical selection (e.g., Levelt, Reference Levelt1993; Levelt, Roelofs & Meyer, Reference Levelt, Roelofs and Meyer1999). According to several models of bilingual word production, the intention to use one language rather than another is specified at the conceptual level (e.g., De Bot, Reference De Bot2004; La Heij, Reference La Heij, Kroll and de Groot2005; Roelofs, Reference Roelofs1998; Roelofs, Dijkstra & Gerakaki, Reference Roelofs, Dijkstra and Gerakaki2013; see also Green, Reference Green1998), which then further drives the language-specific planning processes, including the selection of the words at the lexical level in the appropriate language. For example, correctly naming a picture of a bike in English by a Dutch–English bilingual speaker involves selection of the target language (i.e., English) at the conceptual level, followed by the planning of the English word bike at the lexical level. The intrusion error “fiets” may occur because the speaker erroneously selected Dutch as the target language at the conceptual level and then correctly planned the picture name in that language. Alternatively, the intrusion may happen when English was correctly selected as the target language, but at the lexical level, the Dutch word fiets was nevertheless incorrectly selected. The latter may occur because both languages are still activated regardless of a bilingual's intention to speak one language only (Colomé, Reference Colomé2001; Costa, Miozzo & Caramazza, Reference Costa, Miozzo and Caramazza1999; Hermans et al., Reference Hermans, Bongaerts, De Bot and Schreuder1998). The current study aims at shedding more light on the question of where in the speaking process language intrusion errors can originate from.
Cross-language interference is typically observed in bilingual picture-word interference studies (e.g., when so-called “phono-translation” distractors are used). In the task, participants are asked to name pictures in a given language (e.g., name the picture mountain in English) while ignoring visual or auditory words in the same or the alternative language. When distractors are words from the nontarget language (e.g., a Dutch word berm) that phonologically overlap with the picture name in the nontarget language (e.g., berg, the Dutch word for mountain), they slow down naming response time (RT) and increase error rates (the so-called “phono-translation effect”). The interference is not only observed for distractors from the more dominant first language (L1) during naming in the less dominant second language (L2) (Boukadi et al., Reference Boukadi, Davies and Wilson2015; Hermans et al., Reference Hermans, Bongaerts, De Bot and Schreuder1998), but also the other way around (Klaus, Lemhöfer & Schriefers, Reference Klaus, Lemhöfer and Schriefers2018). In these picture-word interference studies with phono-translation distractors, intrusion errors are occasionally observed (in the current example, saying the Dutch word berg instead of the target English word mountain), although not frequently. These intrusion errors can occur due to the incorrect selection during either concept preparation or lexical selection. For example, because the Dutch word berg was primed by the phonologically-related distractor berm, it may be erroneously selected at the lexical level even though the target language (English) had been correctly selected at the concept level. Alternatively, it is also possible that it was the nontarget language Dutch as a whole that was primed by the Dutch distractor word berm, and therefore the language itself was erroneously selected for naming.
Besides in bilingual picture-word interference studies, language intrusion errors are also observed in language switching studies, where bilingual speakers are asked to name pictures while switching between their languages according to a given cue (e.g., a flag or a color patch in addition to the to-be-named picture). In such a paradigm, intrusion errors happen mostly in trials where participants are required to switch the language relative to the previous trial (Zheng, Roelofs & Lemhöfer, Reference Zheng, Roelofs and Lemhöfer2018b). For example, after consecutively naming pictures in English (e.g., ant, spoon, key), a Dutch–English bilingual speaker may fail to switch to Dutch but continue to name the picture tree in English instead of using the target Dutch name boom. The mechanism of such intrusion errors, or the failure to switch, is also unclear. It is possible that the speaker fails to implement the language switch at the conceptual level and consequently selects the previous language (English). Alternatively, it is also possible that the new target language (Dutch) has been correctly selected, but the planning of the word during lexical selection is interfered by previously-selected words from the nontarget language (e.g., the English words key, spoon, ant). Besides the failure to switch to another language, language intrusion also occurs when failing to stay in the same language. While this type of error is less frequent than switch errors in the laboratory switching paradigm (e.g., Declerck, Lemhöfer & Grainger, Reference Declerck, Lemhöfer and Grainger2017; Zheng et al., Reference Zheng, Roelofs, Farquhar and Lemhöfer2018a; Zheng et al., Reference Zheng, Roelofs and Lemhöfer2018b), it does at least occasionally happen in real life (e.g., accidentally producing a Dutch word in an English conversation). To our purposes, these intrusion errors may be better suited to understand the process of language selection than the failure to switch: when one should stay in the same language but fails to do so in a given language context (e.g., a change of interlocutor or interfering background conversation), it is less likely that the interference comes from nontarget-language words at the lexical level. Even though both the target word and its translation-equivalent are activated during production (e.g., Declerck, Philipp & Koch, Reference Declerck, Koch and Philipp2015; Green, Reference Green1998), such activation remains low on repeat trials, in which the same language is required as in the previous trial, as compared to switch trials, because words in the nontarget language have not been used in the previous trials. Thus, any language intrusion errors in this situation are likely the consequence of incorrect language selection at the conceptual level, while language switch errors can result from both lexical and conceptual-level interference. Being able to study this kind of intrusion error would thus help us to isolate conceptual language intrusion errors from those arising from lexical processing.
It is worth noting that language intrusions have also been investigated extensively using a reading aloud task, where participants are asked to read aloud mixed-language paragraphs (Gollan & Goldrick, Reference Gollan and Goldrick2018; Gollan, Schotter, Gomez, Murillo & Rayner, Reference Gollan, Schotter, Gomez, Murillo and Rayner2014; Li & Gollan, Reference Li and Gollan2018; Schotter, Li & Gollan, Reference Schotter, Li and Gollan2019). However, the fact that people can read aloud non-existing words suggests that reading aloud does not necessarily involve concept and lemma selection. Therefore, we consider the literature on reading aloud to be less relevant for answering the current research question and keep a discussion of it for later.
As discussed so far, language intrusion takes place in daily life – though not very frequently (Muysken, Reference Muysken2000; Poulisse, Reference Poulisse1999) – as well as in laboratory experiments, such as in the picture-word interference task (Boukadi et al., Reference Boukadi, Davies and Wilson2015; Hermans et al., Reference Hermans, Bongaerts, De Bot and Schreuder1998; Klaus et al., Reference Klaus, Lemhöfer and Schriefers2018), the cued language-switching task (Meuter & Allport, Reference Meuter and Allport1999; Zheng et al., Reference Zheng, Roelofs, Farquhar and Lemhöfer2018a; Zheng et al., Reference Zheng, Roelofs and Lemhöfer2018b), and the reading aloud task (Gollan & Goldrick, Reference Gollan and Goldrick2018; Gollan et al., Reference Gollan, Schotter, Gomez, Murillo and Rayner2014; Li & Gollan, Reference Li and Gollan2018; Schotter et al., Reference Schotter, Li and Gollan2019). Studying why intrusion errors happen can help us better understand how bilinguals exert control over the bilingual word production system. The aim of the present study was to examine whether language intrusion errors can happen as a result of incorrect language selection during concept preparation, rather than as a result of cross-language interference which takes place during lexical selection (we certainly do not exclude the latter as a possibility, although we do not investigate this here). To this end, we experimentally created laboratory paradigms inspired by real-life scenarios where language intrusions are likely to happen due to priming of the nontarget language at the conceptual level rather than the lexical level. For that, we manipulated the language context, which presumably will affect language activation in bilingual speech production (see Hartsuiker, Reference Hartsuiker, Mishra, Srinivasan and Huettig2015, for a review).
We developed two versions of bilingual picture naming tasks. In the first experiment, we simulated the situation where the language associated with the interlocutor is incoherent with the conversational environment (e.g., when you always speak English at school, but one day it becomes more difficult because your sister, with whom you always talk in Dutch, is also there). Bilingual participants were cued to speak a given language in the context of a cartoon interlocutor who was associated with the same language (congruent) or the different language (incongruent) as the target language associated with the “environment” (location of the to-be-named picture on the screen). In the second experiment, we simulated the distraction of background noise during daily conversation (e.g., when you are talking with your English-speaking friend in a bar, but everyone around you is speaking Dutch). Bilingual participants were cued to speak in a given language to an interlocutor while listening to the same (congruent) or the alternative language (incongruent) as distractors. In both experiments, the contextual congruency manipulation concerned the language (conceptual level) rather than words in the language (lexical level). Therefore, if language intrusion errors happened because the nontarget language is selected, then intrusion errors should be found more often in incongruent than in congruent contexts. We embedded the tasks in a mixed-language situation (i.e., language switching) in order to induce higher levels of general cross-language interference. To be able to investigate the ‘pure’ process of language selection (and possible failures), we focused the analysis only on the repeat trials. Besides the contrast between the congruent and incongruent conditions, we also expected to observe that the dominant language is more likely to be intruded by the nondominant language than vice versa, which would replicate the reverse-dominance phenomenon in a mixed-language context (e.g., Gollan & Goldrick, Reference Gollan and Goldrick2018; Gollan et al., Reference Gollan, Schotter, Gomez, Murillo and Rayner2014; Schotter et al., Reference Schotter, Li and Gollan2019; Zheng et al., Reference Zheng, Roelofs and Lemhöfer2018b).
Experiment 1
In the first experiment, we instructed participants to name pictures either in English or in Dutch, depending on the location on the screen where the target picture was presented (‘conversational environment’, valid cues). The invalid cues were cartoon characters presented next to the target picture. They were introduced as either English- or Dutch-speaking interlocutors. The invalid cues could be congruent (indicating the same language) or incongruent (indicating the alternative language) with the valid cues. After having learned the association between interlocutors and language, participants were asked to ignore the invalid cues (interlocutor) and focus on the valid cues (location). Crucially, we had the incongruent cues only on repeat trials. Therefore, if an intrusion error occurred, it was most likely to be a result of the incorrect selection of the nontarget language itself (which was primed by the incongruent interlocutor) at the conceptual level, rather than the immediate cross-language interference from the previous trial during word selection – unlike a switch trial, the nontarget language had not been actively used on the previous trials. To make the experiment more naturalistic, we introduced the cartoon interlocutor and the naming task as part of a real-life scenario, as explained below.
Method
Participants
Twenty-two participants took part in the experiment for course credit or vouchers. All of them were native Dutch speakers, raised monolingually, who spoke English as their most proficient nonnative language. All the participants had normal or corrected-to-normal vision. Data from two participants were excluded because they misunderstood the task or did not follow the instructions, leaving a final set of 20 participants (eight males). Table 1 shows the language background and English vocabulary size (measured by the LexTALE test, Lemhöfer & Broersma, Reference Lemhöfer and Broersma2012) of the final set of participants of this experiment and the later reported Experiment 2.
Participants’ language background and English proficiency in Experiments 1 and 2.

Note: SD = Standard Deviation.
aSelf-ratings were given on a scale from 1 = very rarely/bad to 5 = very often/good.
bThe score is a weighted % correct score, i.e., 50 is chance level, 100 is the maximum score.
Materials
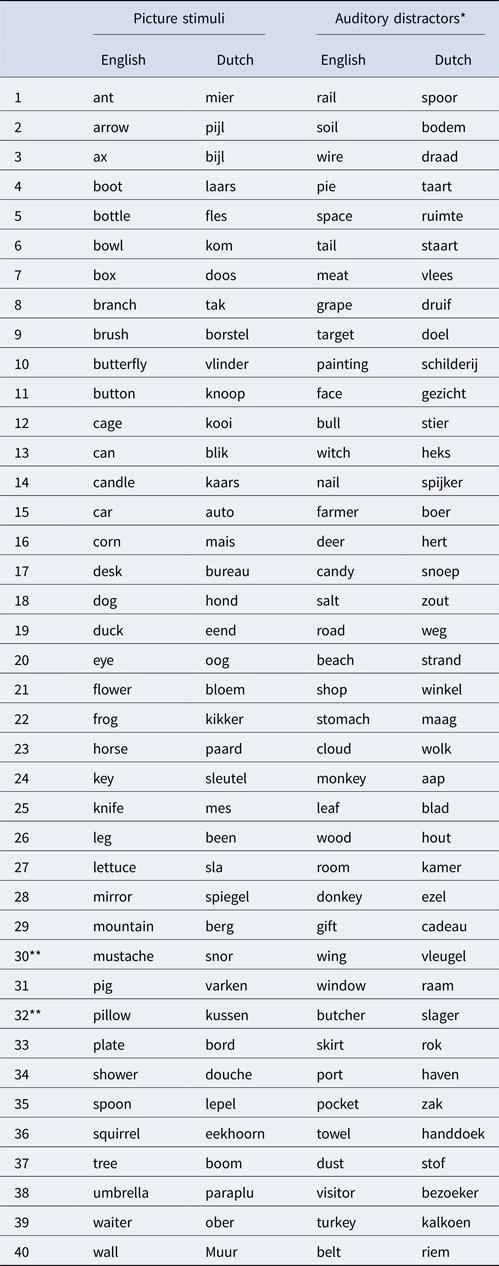
Experimental stimuli consisted of 40 black-and-white line drawings, representing 40 translation pairs of Dutch–English noncognate words (e.g., the Dutch word “boom” and its English translation “tree”). All the pictures were selected from the international picture naming project (IPNP) database (Bates, D'amico, Jacobsen, Székely, Andonova, Devescovi, Herron, Lu, Pechmann, Pléh, Wicha, Federmeier, Gerdjikova, Gutierrez, Hung, Hsu, Iyer, Kohnert, Mehotcheva, Orozco-Figueroa, Tzeng & Tzeng, Reference Bates, D'amico, Jacobsen, Székely, Andonova, Devescovi, Herron, Lu, Pechmann, Pléh, Wicha, Federmeier, Gerdjikova, Gutierrez, Hung, Hsu, Iyer, Kohnert, Mehotcheva, Orozco-Figueroa, Tzeng and Tzeng2003), opting for those with highest naming agreements (Bates et al., Reference Bates, Mächler, Bolker and Walker2003; Severens, Van Lommel, Ratinckx & Hartsuiker, Reference Severens, Van Lommel, Ratinckx and Hartsuiker2005) and high lexical frequency (CELEX database; Baayen, Piepenbrock & Gulikers, Reference Baayen, Piepenbrock and Gulikers1995) in both Dutch and English. We matched all the Dutch and English picture names as closely as possible on number of syllables (p = .813) and phonological onset category (e.g., fricatives like /f/ have a delayed voice-key onset compared to vowels like /a/). Based on a pilot study on naming agreement, we replaced two out of the 40 original pictures with drawings sketched by the first author (see Appendix A for the full set of stimuli). All the pictures were edited to a size of 300 × 300 pixels.
Design
Each experimental session consisted of 640 trials, divided into eight blocks of 80 trials. Each picture appeared twice in a block, once in Dutch and once in English. Twenty-five percent of the trials were switch trials. We pseudo-randomized all the items in each block using the program MIX (van Casteren & Davis, Reference van Casteren and Davis2006), with the following requirements: (1) subsequent trials were semantically and phonologically unrelated; (2) repetition of a picture was separated by at least four intervening trials; (3) there were no more than six subsequent trials in the same language; (4) there were no subsequent switch trials.
We manipulated interlocutor-location congruency (congruent vs. incongruent) in both languages (L1 vs. L2). Twenty-five percent of all the trials were incongruent trials, i.e., the language required by the object location was not the same as the language associated with the interlocutor. All the items were proportionally distributed across congruency conditions (i.e., 25 percent of the time an item occurs on an incongruent trial). To avoid the co-occurrence of incongruency and switching, incongruent trials only occurred as repeat trials. We also made sure that there were no subsequent incongruent trials within a list. A second list was constructed by reversing the block order of the first list.
Procedure
Participants were seated in a sound-proof booth and the experiment was run using the software package Presentation (Version 17.0, Neurobehavioural System Inc, Berkeley, U.S.). The computer screen (Benq XL2420Z, screen size 24 inch) was set to grey, with a resolution of 1920 × 1080 pixels, at a refresh rate of 120 Hz.
First, the participants were familiarized with all picture names: they saw each picture and named it in Dutch (block 1) or English (block 2). After each picture naming, they were told the correct answer and asked to name it again in case the original answer had been incorrect.
After that, we introduced the participants to the two Dutch- and English-speaking cartoon interlocutors. Both interlocutors were introduced as bilinguals with one of their languages being strongly dominant. The participants named all the pictures either in Dutch or in English, according to the interlocutor presented next to the picture. To make the interlocutors more salient, we used a 100-pixel-wide color frame for the pictures when the corresponding interlocutor was presented (blue frame for the English-speaking interlocutor and orange frame for the Dutch-speaking interlocutor). This served as a training of the interlocutor-language association. The correct word was presented on the screen after each response for the first ten trials and then the training continued for another 30 trials without feedback. Switch rate was kept the same as in the main experiment (25%).
Then we introduced the participants to the location cues: the target pictures would be presented in one of the four corners of the screen, which represented either “school” or “home” (e.g., top-left corner and bottom right corner for “school”, and top-right and bottom-left corner for “home”, or vice versa). At “school” the participants were supposed to speak English whereas at “home” they spoke Dutch. Two locations were used to cue each language, so that the location could alternate between each trial to avoid a confound of language switch and location switch (Mayr & Kliegl, Reference Mayr and Kliegl2003). We counterbalanced the assignment of the locations to the response language across participants. After ten trials, we introduced time pressure to induce more speech errors. For that, a response deadline was computed dynamically and calibrated individually for each participant, based on the 80th percentile of the previous ten trials. Participants would receive a warning message for being “too late” if they failed to respond within the time limit. This continued for another 80 trials. During this phase, the interlocutor cues (that would become invalid in the main experiment) were always congruent with the location cues (that would be the valid cues in the main experiment).
At the beginning of the main experiment, we introduced the incongruent condition, i.e., when the interlocutor presented next to the picture indicated a different language from the one indicated by the location cue (e.g., the participants would see the English-dominant interlocutor at “home”, where they were supposed to speak Dutch). Figure 1 shows a schematic diagram for a trial where participants needed to name the picture in English or in Dutch, in either the congruent or incongruent condition. We instructed the participants to pay attention to the valid cues (i.e., locations). During the experimental blocks, each trial started with the 250 ms presentation of a fixation cross, followed by a blank screen with a jitter of 250–500 ms. Then, the picture appeared in one of the four corners of the screen, and the picture and the interlocutor stayed together on the screen until 550 ms after the voice key (Shure SM-57 microphone) had registered the onset of speech. If the voice key was not triggered within 2000 ms, the stimulus stayed on the screen for a total of 2550 ms. After another jittered blank screen of 250–500 ms, the next trial began. In total, there were eight blocks of 80 trials. After each block, participants received feedback on their performance (e.g., speed) and got reminded of the languages represented by the locations. We instructed them to name the pictures as quickly as possible in the language indicated by the location cue, and also not to correct themselves when they said something wrong. All the instructions were in English.
A schematic diagram for Experiment 1. The target language was cued by the location (home: Dutch; school: English). Next to the picture, a cartoon interlocutor was simultaneously presented with a color frame, which was associated either with the target language (congruent condition, top panel) or the nontarget language (incongruent condition, bottom panel). The diagram depicts an experimental trial where participants had to name the picture either in English (A) or in Dutch (B).

At the end of the session, the participants completed the LexTALE vocabulary test in English (Lemhöfer & Broersma, Reference Lemhöfer and Broersma2012) and a language background questionnaire, as summarized in Table 1. The entire session took approximately 1.5 hrs.
Data analysis
Error rates and RTs were used as dependent variables. Only repeat trials were analyzed. Participants’ responses were coded either as (1) correct, fluent responses, or as (2) incorrect responses. Incorrect responses were further categorized into language intrusion errors (i.e., complete and fluent naming responses using the translation equivalent in the nontarget language) and eleven other types of errors, such as self-corrections, disfluencies, or using a wrong word in the correct language. Correctly responded trials with an RT (measured automatically by the voice key) deviating more than three standard deviations from the respective participants’ condition mean were defined as another type of error (i.e., RT outliers, see Appendix C for all the categories and the percentages of each type of error). We excluded all error trials as well as post-error trials from the RT analysis. In the analysis of intrusion errors, we excluded trials at the beginning of each block and trials following language intrusion errors or other interlingual errors (see Appendix C).
We performed the statistical analyses using mixed-effects models with the lme4 package (Version 1.1.13, Bates, Mächler, Bolker & Walker, 2015) in R (Version 3.4.1; R Core Team, 2017). The factors language (L1 vs. L2) and congruency (congruent vs. incongruent) were sum-coded and included as fixed effects in the models. Participants and items were included as random effects. For both RT and error analyses, we used generalized linear mixed models (GLMEMs). GLMEMs were chosen for the RT analysis to account for the right-skewed shape of the RT distribution without the need to transform and standardize the raw data (Lo & Andrews, Reference Lo and Andrews2015). All the analyses were conducted with a maximal random-effects structure, which includes random intercepts and random slopes for all fixed effects and their interactions for both participants and items (Barr, Levy, Scheepers & Tily, Reference Barr, Levy, Scheepers and Tily2013). When the model failed to converge, we simplified it by removing the interactions in the random structure (see Appendix D for the final models used for analyses). For both analyses, we reported Wald's z-scores, t-scores and their associated p-values.
Results
Speakers made different types of speech errors on 11.0% of all trials, including language intrusion errors (e.g., said the Dutch word “boom” instead of the English word “tree” on an English trial) on 4.4% of the repeat trials and 9.3% of the switch trials.
Figure 2 shows the violin plots for the language intrusion error rates and the RTs on the repeat trials. Table 2 gives the statistics from the GLMEMs.
Violin plots with individual data distributions for language intrusion error rate (panel A) and mean RT (panel B, in ms) on repeat trials, grouped by language and congruency. The outer shapes represent the distribution of individual data, the thick horizontal line inside the box indicates the median, and the bottom and top of the box indicate the first and third quartiles of each condition.

Statistics from the GLMEMs for language intrusion error rate (ER, in %) and reaction time (RT, in ms) on repeat trials in Experiment 1.

Note: Significant effects (p < .05) are highlighted in bold.
Speakers made more language intrusion errors on incongruent than on congruent repeat trials, and also more when naming in the L1 than in the L2. There was no interaction between language and congruency.
As for RTs, speakers were slower on incongruent than on congruent trials and also slower when naming in the L1 than in the L2. There was a significant interaction between congruency and language. A follow-up analysis for each language showed that the congruency effect was larger in the L1 (M L1cong = 807 ms, SD L1cong = 63 ms; M L1incong = 883 ms, SD L1incong = 89 ms; β = −39.61, SE = 6.93, t = −5.71, p < .001) than in the L2 (M L2cong = 754 ms, SD L2cong = 50 ms; M L2incong = 796 ms, SD L2incong = 65 ms; β = −22.33, SE = 4.98, t = −4.49, p < .001).
To summarize, language intrusion errors were more likely and responses were slower in the incongruent than in the congruent contexts, and also in the dominant L1 than in the weaker L2. There was an interaction between congruency and language dominance in the RTs: the congruency effect was larger in L1 than in L2. These findings suggest that language intrusion can happen as a result of incorrect language selection on the conceptual level.
Experiment 2
In the second experiment, we sought for converging evidence for intrusion errors caused by incorrect language selection, using a different paradigm inspired by real-life scenarios. Similar to Experiment 1, participants would see cartoon interlocutors and name pictures in English or in Dutch, but this time, they were simultaneously hearing auditory distractor words in the same (congruent condition) or different language (incongruent condition). Thus, now the interlocutor served as the valid cue and the language spoken in the background as the invalid cue. This task was developed based on the natural situation of talking to a person in a certain language while other people in the neighborhood may be speaking other languages. Crucially, the auditory distractors were neither related to the target word nor to its translation equivalent in the nontarget language. Therefore, if an intrusion error occurs due to the incongruent distractors, it is most likely to be a result of the priming and subsequent selection of the distractor language at the conceptual level, rather than of the distractor priming a single word in the nontarget language at the lexical level.
Method
Participants
Thirty new participants from the same population as Experiment 1 took part in the experiment for course credit. Other recruiting criteria were identical to Experiment 1. Data from one participant was excluded because he did not follow the instructions. This leaves a final set of 29 participants (eight males). Their language background and English vocabulary size is presented in Table 1.
Materials
The experimental materials consisted of 40 pictures and 40 pairs of auditory distractors which were translation equivalents between Dutch and English. The picture stimuli were identical to the ones used in Experiment 1.
Dutch and English auditory distractors were voice recordings of a male Dutch native speaker. We did this to make sure that the accent of the audios was familiar enough to our participants. Auditory distractors were highly frequent words representing daily objects. The distractors were selected to be noncognate words between Dutch and English and were always presented with the same picture. Furthermore, auditory distractors were semantically and phonologically unrelated to the target picture name in both languages (e.g., the target picture of “tree”, or “boom” in Dutch, was presented with the English word “dust” or its Dutch translation “stof” as auditory distractors). Lastly, syllable length of the target picture name and the incongruent (i.e., other language) auditory distractor was matched (see Appendix A for the full set of stimuli).
Design
The design was identical to that in Experiment 1, with the independent variables being language (L1 vs. L2) and congruency (congruent vs. incongruent), and the dependent variables being intrusion error rates and RTs. The lists were constructed in a similar way as in Experiment 1, pseudo-randomized by the program MIX. Twenty-five percent of the trials were switch trials and one third of the repeat trials were incongruent trials. Besides the restrictions used in Experiment 1, we made sure that the auditory distractors were semantically and phonologically unrelated to the pictures after the current trial, to avoid potential priming effects.
Procedure
The setup of the experiment was identical to Experiment 1, apart from that the computer screen was set to black instead of grey. The testing procedure was similar. We describe it below, mainly focusing on its differences from Experiment 1.
First, the participants were familiarized with all picture names and introduced to the two Dutch- and English-speaking interlocutors. In Experiment 2, we used two same-gender interlocutors (i.e., two males) instead of the two different-gender interlocutors used in Experiment 1, in order to be consistent with the same-gender auditory distractors. Both interlocutors were introduced as monolingual speakers. Unlike their distractor roles in Experiment 1, the interlocutors in Experiment 2 served as valid cues. The interlocutors were presented together with a color frame (blue frame for the English-speaking interlocutor and red frame for the Dutch-speaking interlocutor) to make the primes more salient. Again, participants received 40 trials of training for the interlocutor-language association, where they named the pictures either in English or in Dutch according to the interlocutor cues. After that, we asked the participants to put on headphones and to name the pictures while at the same time being presented with the auditory distractors. They were asked to imagine that they were ‘talking’ to the target interlocutors while hearing other people talking in the background (e.g., in a bar). After 10 trials of practice, participants completed a block of 80 trials with time pressure (see Experiment 1). During this phase, the language of the auditory distractor was always congruent with the interlocutors.
Without further instruction, the participants continued with eight experimental blocks of 80 trials. There were 25% incongruent trials (i.e., the language of the auditory distractors is in a different language as indicated by the interlocutors) in the experimental blocks, again, only on repeat trials (switch rate = 25%). The presentation of the picture stimuli was identical to Experiment 1, except that the picture was always presented in the center of the screen. The onset of the auditory distractors was 150 ms before picture onset to ensure that the distractors could be processed in terms of their language. The rest of the procedure was identical to Experiment 1. A schematic diagram for a trial where participants had to name the picture either in English or in Dutch, in either congruent or incongruent condition, can be found in Figure 3.
A schematic diagram for Experiment 2. The target language was cued by the cartoon interlocutor with a color frame. Besides, an auditory distractor was presented either in the target language (congruent condition, top panel) or in the nontarget language (incongruent condition, bottom panel [“boer” is the Dutch translation of “farmer”]).The diagram depicts an experimental trial where participants had to name the picture either in English (A) or in Dutch (B) SOA: stimulus onset asynchrony.

All the written instructions were in English and all the oral communication was in Dutch. We kept the oral communication to a minimum. At the end of the experiment, we again asked participants to complete the LexTALE vocabulary test in English as well as a language background questionnaire. The entire session took approximately 1.5 hrs.
Data analysis
We used the same analysis procedures as in Experiment 1.
Results
Speakers made different types of speech errors on 9.6% of all trials, including language intrusion errors on 4.1% of the repeat trials and 8.0% of the switch trials.
Figure 4 shows the violin plots for language intrusion error rates and RTs on the repeat trials. Table 3 gives the statistics from the GLMEMs.
Violin plots with individual data distributions for language intrusion error rate (panel A) and mean RT (panel B, in ms) on repeat trials, grouped by language and congruency. The outer shapes represent the distribution of individual data, the thick horizontal line inside the box indicates the median, and the bottom and top of the box indicate the first and third quartiles of each condition.

Statistics from the GLMEMs for language intrusion error rate (ER, in %) and reaction time (RT, in ms) on repeat trials in Experiment 2.

Note: Significant effects (p < .05) are highlighted in bold.
Speakers made more language intrusion errors on incongruent than on congruent repeat trials and when naming in the L1 than in the L2. There was no significant interaction between language and congruency.
As for RTs, speakers were slower on incongruent than on congruent trials and when naming in the L1 than in the L2. There was also a significant interaction between congruency and language. A follow-up analysis for each language showed that the congruency effect was only present in the L2 (M L2cong = 732 ms, SD L2cong = 61 ms; M L2incong = 762 ms, SD L2incong = 68 ms; β = −15.49, SE = 3.03, t = −5.12, p < .001), but not in the L1 (M L1cong = 835 ms, SD L1cong = 89 ms; M L1incong = 842 ms, SD L1incong = 83 ms; β = −3.16, SE = 3.77, t = −0.84, p = .402).
To summarize, language intrusion errors were more likely and correct responses were slower in the incongruent than in the congruent contexts. Besides, responses were slower and less accurate in the dominant L1 than in the weaker L2. There was an interaction between congruency and language dominance in the RTs: the congruency effect was only present in the L2. Despite the interaction in RTs (in which the congruency effect was larger in the L1 than in the L2), these findings converge with those of Experiment 1, suggesting that language intrusion can happen due to the incorrect selection of language during concept preparation.
General discussion
Inferences about bilingual control mechanisms can be made by studying how and when these mechanisms fail, e.g., when language intrusions occur. In the current study, we examined whether language intrusion errors may be the result of selecting the nontarget language itself at the conceptual level rather than selecting a word from the nontarget language at the lexical level (while the language has been correctly selected). In the first experiment, we introduced incongruent interlocutor-location pairs (e.g., an English-Dutch bilingual interlocutor with English as the dominant language vs. the house of a Dutch-speaking family) in a language switching task. In the second experiment, we combined the language switching task with an auditory picture-word interference task, to simulate the situation where background conversation is disturbing the selection of the target language (e.g., when the background conversation is in English whereas the current target language is Dutch).
Although embedded in mixed-language contexts, we only looked at situations where the bilingual participants were supposed to stay in the same language (i.e., repeat trials) but failed to do so – in contrast to situations where participants are asked to switch but fail to do so, which was the predominant line of inquiry in previous research (e.g., Meuter & Allport, Reference Meuter and Allport1999; Zheng et al., Reference Zheng, Roelofs and Lemhöfer2018b). In both experiments, we observed more language intrusion errors and longer RTs on incongruent repeat trials (i.e., when the interlocutor and location cues were not indicating the same language in Experiment 1; or when the background and current ‘conversation’ were not in the same language in Experiment 2) than on congruent trials. In both cases, the congruency manipulation concerned language selection rather than word selection. Therefore, language intrusion errors that were due to incongruency can be attributed to the erroneous selection of the nontarget language.
In Experiment 1, we associated the cartoon characters (the invalid cues) with one of the two languages, rather than with any specific words in the languages. Therefore, the intrusion errors caused by the congruency manipulation (i.e., more intrusion errors were observed when the interlocutor was associated with the nontarget language) were likely to be a result of the nontarget language being primed. Interference on the lexical level due to the congruency manipulation is unlikely, otherwise the incongruent interlocutor would have to boost the activation of the whole lexicon in the nontarget language. Note that although the results of the RTs showed the same pattern as the errors (i.e., longer RTs in the incongruent than in the congruent condition), this is not direct evidence for incorrect language selection because these RTs were obtained in correct trials. Nevertheless, the prolonged RTs may reflect the difficulty in selection which resulted from additional activation of the competitive language. Our results are coherent with the idea that language context, such as faces associated with a certain social-cultural identity, affects language production (e.g., Blanco-Elorrieta & Pylkkänen, Reference Blanco-Elorrieta and Pylkkänen2017; Hartsuiker, Reference Hartsuiker, Mishra, Srinivasan and Huettig2015; Li, Yang, Scherf & Li, Reference Li, Yang, Scherf and Li2013; Liu, Timmer, Jiao, Yuan & Wang, Reference Liu, Timmer, Jiao, Yuan and Wang2019).
In Experiment 2, we used distractor words (e.g., “stof” or its English translation “dust”) that were unrelated to either the target words (e.g., tree) or its translation equivalent (the Dutch word boom). In the incongruent condition, these distractor words were from the nontarget language, while congruent distractors were from the target language. Therefore, the occurrence of more intrusion errors in the incongruent than in the congruent condition is again more likely to be a result of the selection of the nontarget language (in this case, Dutch) which was primed by the distractor word. The errors are unlikely to be due to cross-language interference during word selection, which has been observed when distractor words have a specific relation to the target words like in the phono-translation condition in the picture-word interference task (e.g., the distractor word berm priming the Dutch word berg; Hermans et al., Reference Hermans, Bongaerts, De Bot and Schreuder1998). Although not particularly investigated, the fact that merely listening to the nontarget language could affect target language production is also consistent with the idea that language control mechanisms are shared between comprehension and production, and that bottom-up linguistic representations have a considerable influence on language selection processes in both modalities (Gambi & Hartsuiker, Reference Gambi and Hartsuiker2016; Peeters, Runnqvist, Bertrand & Grainger, Reference Peeters, Runnqvist, Bertrand and Grainger2014).
It is also worth noting that intrusion errors that happened in the congruent condition, or that occurred on switch trials, might still be attributable to erroneous lexical selection. Therefore, we do not reject the alternative possibility that cross-language interference during word selection can also lead to language intrusions. Actually, this type of intrusion is likely because both languages are activated regardless of a bilingual's intention to speak one language only (Colomé, Reference Colomé2001; Costa et al., Reference Costa, Miozzo and Caramazza1999; Hermans et al., Reference Hermans, Bongaerts, De Bot and Schreuder1998). Nevertheless, our two experiments provide converging evidence that incorrect language selection on the conceptual level is one factor contributing to language intrusion errors. Moreover, although we interpret the incorrect language selection on the conceptual level as a failure of control, it has to be acknowledged that language control goes beyond language selection and takes place at multiple levels of processing (e.g., Declerck & Philipp, Reference Declerck and Philipp2017; Gollan et al., Reference Gollan, Schotter, Gomez, Murillo and Rayner2014; Olson, Reference Olson2013).
In both experiments, language intrusion errors were more likely and responses were slower in the dominant L1 than the weaker L2. This finding replicates the so-called reverse dominance effect, i.e., the seemingly paradoxical finding that production in the dominant L1 can under some circumstances be more difficult than in the L2. This effect is reliably observed in standard cued language switching experiments (Christoffels, Firk & Schiller, Reference Christoffels, Firk and Schiller2007; Costa & Santesteban, Reference Costa and Santesteban2004; Verhoef, Roelofs & Chwilla, Reference Verhoef, Roelofs and Chwilla2009; Zheng et al., Reference Zheng, Roelofs and Lemhöfer2018b), and has also been shown for voluntary language switching (Gollan & Ferreira, Reference Gollan and Ferreira2009) and for other language-mixing tasks (Gollan & Goldrick, Reference Gollan and Goldrick2018; Gollan et al., Reference Gollan, Schotter, Gomez, Murillo and Rayner2014; Schotter et al., Reference Schotter, Li and Gollan2019). This reverse dominance effect can be accounted for by assuming that when unbalanced bilinguals mix languages, they need to inhibit the dominant language while enhancing the less dominant language to facilitate production (Allport & Wylie, Reference Allport and Wylie1999; Green, Reference Green1998).
Additionally, we found an interaction between the congruency effect and language dominance in both experiments. However, the direction of this interaction differed between experiments. In the first experiment, the congruency effect was larger in the L1 than in the L2, whereas, in the second experiment, the congruency effect was restricted to the L2. The interaction was only observed in the RTs, but not in the intrusion error rates. The difference in interaction might be due to the fact that we used different manipulations of contextual priming in the two experiments: in the first experiment, the congruency between the interlocutor's identity (invalid cue) and picture location (valid cue) was manipulated; in the second experiment, the distracting information came from the language spoken in the background. Whereas face or culture priming can facilitate L1 and L2 picture naming (Li et al., Reference Li, Yang, Scherf and Li2013), auditory distractor words may cause more interference rather than facilitation. Unfortunately, we did not include a neutral condition in the experiments to be able to attribute the congruency effect to inhibition of the incongruent condition, to facilitation of the congruent condition, or both. Therefore, the precise reason for the difference in the direction of the interaction in the two experiments remains unclear and requires further investigation.
In the current study, we also attempted to take a more ecologically valid approach to investigating naturally occurring language intrusions by employing two novel versions of a bilingual switching paradigm. Compared to classic language-switching tasks where participants are cued to switch (i.e., switch trials), the current paradigms focus on repeated naming (i.e., repeat trials) and are able to look into more natural aspects of the failures of language selection. By manipulating the language context, the paradigms successfully simulated daily-life scenarios where language intrusion is more likely to occur. Compared to other tasks such as the reading aloud of texts (Gollan & Goldrick, Reference Gollan and Goldrick2018; Gollan et al., Reference Gollan, Schotter, Gomez, Murillo and Rayner2014; Li & Gollan, Reference Li and Gollan2018; Schotter et al., Reference Schotter, Li and Gollan2019), the current paradigm is better suited to investigate failures to ‘stay’ rather than failures to switch. However, in the current study, bilingual participants were still asked to use both of their languages in quick succession, which makes the repeat trials still intrinsically different from the ‘staying in the same language’ situation in daily life. Future research can aim to find ways of inducing sufficient numbers of intrusion errors in a monolingual mode.
To summarize, the current study investigated whether language intrusion errors can be caused by the erroneous selection of the language on the conceptual level. We examined this in two experiments by manipulating language context: more specifically, the congruency of two language cues (one task-relevant, one non-relevant). In both experiments, we observed that language intrusion errors occurred more often when the context was incongruent than congruent with the target language. This finding provides evidence that language selection, rather than only selection at the lexical level, is an error-prone process during bilingual word production.
Data availability
Data are available from the Donders Institute for Brain, Cognition and Behaviour repository at http://hdl.handle.net/11633/aab2nrxz.
Acknowledgements
The authors would like to thank Kristin Witte, Max Sterling, Daniel Holthuis, Elena Nicolaou, and Rick Alofs for their help in data collection.
Appendix A: Stimuli
Appendix B: Instructions for Experiment 1
Introducing the interlocutors
This is your little sister, Fleur. She's 14 years old. Since she is learning English in school, she already speaks it quite well. Still, you usually speak Dutch to her as that's both of your native language. Therefore, when you see a picture next to her, you name it in Dutch.
This is Benjamin, an English exchange student in your class. He is really making an effort in learning Dutch, but he is not that good at it yet, so you mostly speak English to him. Therefore, you name pictures in English if you see Benjamin next to them.
Introducing the location cues*
In this task there are two different locations you need to keep in mind.
The first one is your home, where you usually see your little sister, Fleur. When you are at home you speak Dutch to your family. Your home in this task is represented by the bottom right and top left corner of the screen. If a picture is presented there, you name it in Dutch:
The second location is the school, where you usually meet Benjamin. You speak English at school as there are many other exchange students in your class that would otherwise not understand you. In this task, the top right and bottom left corner represent your school. You therefore name pictures presented there in English.
*The assignment of the locations to the languages is counterbalanced across participants.
Introducing the incongruence manipulation
Sometimes your sister Fleur comes to your school with you to see what it is like. (She will then be present next to a picture in the top left or bottom right corner.) You then have to speak English to her in order to not be rude to your classmates that don't understand Dutch. (You therefore still name the pictures in English).
Similarly, you sometimes invite the exchange student Benjamin over to your house have dinner with your family. (He will then be presented in the bottom right and top left corner.) Since your parents don't really speak English you need to speak Dutch to Benjamin then (and name the pictures in Dutch).
Appendix C: Error coding

Appendix D: Linear mixed effect models
Experiment 1
For errors
glmer.IntruError.repeat =
glmer(IsIntruErr ~ Lang*Congruency + (1 + Lang*Congruency|pNumber) + (1 + Lang*Congruency|picNam), data = mydata.4ER.repeat, family=“binomial”, control = glmerControl(optimizer = “bobyqa”))
For RTs
glmer.RT.repeat =
glmer(RT~Lang*Congruency + (1 + Lang*Congruency|pNumber) + (1 + Lang + Congruency|picNam), data = mydata.4RT.repeat, family = Gamma(link = “identity”), control = glmerControl(optimizer = “bobyqa”)) # full model failed to converge
# IF there is an interaction
glm.RT.repeat.L1 =
glmer(RT~Congruency + (1 + Congruency|pNumber) + (1 + Congruency|picNam), data = mydata.4RT.repeat[mydata.4RT.repeat$Lang==“Dutch”,], family = Gamma(link = “identity”), control = glmerControl(optimizer = “bobyqa”))
glm.RT.repeat.L2 =
glmer(RT~Congruency + (1 + Congruency|pNumber) + (1 + Congruency|picNam), data = mydata.4RT.repeat[mydata.4RT.repeat$Lang==“English”,], family = Gamma(link = “identity”), control = glmerControl(optimizer = “bobyqa”))
Experiment 2
Linear mixed effect models used in Experiment 2 were identical to Experiment 1.


 Open access