


Introduction
The chemistry of metal-organic complexes on solid surfaces is quite relevant to several practical applications, in the making of heterogeneous catalysts [Reference Gates, Flytzani-Stephanopoulos, Dixon and Katz1, Reference Samantaray, Pump, Bendjeriou-Sedjerari, D’Elia, Pelletier, Guidotti, Psaro and Basset2] and the growth of thin solid films [Reference Hämäläinen, Ritala and Leskelä3, Reference Gordon and Hwang4, Reference Koponen, Gordon and Barry5], for instance. In general, adsorption of those compounds is assumed to take place via the formation of new bonds involving the metal center of the discrete metal-organic complex, a step that may require either rearrangement of the original ligands or displacement of one or more of those by a surface site [Reference Barry, Teplyakov and Zaera6]. However, in some instances, this chemistry may be complicated by the fact that the gas-phase precursor may exist in an oligomeric form, typically as a dimer but sometimes as a trimer or a tetramer. An early example where this issue was recognized was in the study of the deposition of aluminum-containing films (i.e., nitrides and oxides) using a trimethylaluminum [TMA, Al(CH3)3] precursor [Reference Gordon, Riaz and Hoffman7], which is well known to dimerize in the gas phase [Reference Laubengayer and Gilliam8]. Many bidentate ligands may also favor the formation of dimers, trimers, or even tetramers, upon complexation with metal centers [Reference Malik, O’Brien, Motevalli, Jones and Leedham9, Reference Lim, Rahtu and Gordon10, Reference Devi11]. In general, this oligomerization of film-growth precursors has been seen as a positive development that helps increase volatility, a property needed for vapor depositions, but its implication to the surface chemistry involved has not been fully recognized.
To address this issue, we in our laboratory have focused on the characterization of copper precursors made with amidinate and related ligands used for atomic layer deposition (ALD) applications [Reference Xu, Tiznado, Kang, Bouman, Lee and Zaera12, Reference Zaera13, Reference Ma, Guo, Gordon and Zaera14, Reference Ma, Guo, Gordon and Zaera15, Reference Kim, Yao, Coyle, Barry and Zaera16, Reference Yao, Coyle, Barry and Zaera17, Reference Yao and Zaera18, Reference Chen, Duan, Yao, Ma, Coyle, Barry, Teplyakov and Zaera19, Reference Yao, Coyle, Barry and Zaera20, Reference Chen, Coyle, Barry and Zaera21, Reference Guerrero-Sánchez, Takeuchi and Zaera22]. We rely on our extensive experience in the study of reaction mechanisms on solid surfaces using modern surface-sensitive techniques [Reference Zaera13, Reference Tiznado, Bouman, Kang, Lee and Zaera23, Reference Zaera24, Reference Zaera25]. In our initial report on the specific subject of the behavior of copper amidinates, we provided mass spectrometry evidence for the preservation of the oligomeric structure of these compounds when vaporizing them from their solid state, and additional quantum mechanics calculations to explain the origin of the energetic stability gained by the formation of dimers or tetramers [Reference Chen, Duan, Yao, Ma, Coyle, Barry, Teplyakov and Zaera19]. We also found that, on silica surfaces, the steric constraints added by the shielding of the metal center in the gas-phase dimers force adsorption via one of the nitrogen atoms rather than the Cu ions. More recent density functional theory (DFT) calculations on the energetics of the likely reaction pathway during copper(I)–N,N′-dimethylacetamidinate thermal activation on Cu(110) surfaces indicated that the initial adsorption of the dimer in that case does involve the Cu ions, but that the adsorbate then follows a decomposition route that depends on surface coverage: at low coverages the dimer fully sheds one of the ligands, whereas at high coverages the ligand dissociation is only partial, with retention of one Cu–N bond (the second ligand remains fully coordinated, as is also the case at low coverages) [Reference Guerrero-Sánchez, Takeuchi and Zaera22]. A more general discussion of this chemistry was briefly provided in our recent accounts on the chemistry of inorganic precursors during the chemical deposition of films on solid surfaces [Reference Barry, Teplyakov and Zaera6].
Here, we discuss the behavior of Cu amidinates on metal surfaces in terms of the initial transformations associated with their oligomers. Both experimental [temperature-programmed desorption (TPD)] and computational (DFT calculations) data are provided and analyzed in terms of the potential interconversion between the dimer and its monomers. The molecule studied here is Cu(I)-2-(tert-butylimino)-5,5-dimethyl-pyrrolidinate, herein referred to as compound (1) (Scheme 1). It was found that, before thermal decomposition of the adsorbed precursor, desorption of high-mass species is detected in three different temperature regimes. Analysis of the cracking patterns of the desorbing products, which were all very similar but displayed a few key differences, was used to estimate the nature of the desorbing species. For the two first peaks, seen at 320 and 350 K, the desorbing species was determined to be the molecular dimer, whereas the third TPD peak at 550 K was associated with a dimer made out of two free ligands, without any copper ions. DFT calculations were added to provide an energetic framework to explain the experimental results. The details are provided below.
Line drawings of compounds (1) and (2), highlighting the possible interconversion between the dimer and the monomer forms of the former.

Results
Low-temperature TPD
The general aspects of the thermal chemistry of (1) on Ni(110) surfaces were already characterized by TPD and X-ray photoelectron spectra (XPS) in the past, and the results reported in a previous publication [Reference Chen, Coyle, Barry and Zaera21]. The adsorbed molecules were determined to decompose in a stepwise fashion, starting at approximately 450 K. One characteristic feature of this type of decomposition is the emission of H2 in TPD experiments, which can be used as a proxy to determine the reactivity temperature ranges as well as the yields of the products resulting from the decomposition. In order to estimate the doses of (1) required to saturate the first layer on the Ni(110) surface, H2 TPD data were recorded as a function of exposure; the results are shown in Fig. 1 (left panel). It can be seen in the figure that the desorption profile changes with increasing initial dose, in general shifting to higher temperatures. This is expected, and indicates partial inhibition of the decomposition of the ligand upon crowding of the surface (the hydrogen atom recombination step on Ni(110) is well known to occur at much lower temperatures [Reference Christmann, Schober, Ertl and Neumann26], and does not contribute to this kinetics).
Left: H2 TPD from Cu(I)-2-(tert-butylimino)-5,5-dimethyl-pyrrolidinate, (1), adsorbed on Ni(110) as a function of initial exposure. Right: H2, HCN, and isobutene yields (in arbitrary units) in TPD experiments as a function of (1) dose. Heating rate: 5 K/s.

One thing to notice in Fig. 1 is that the H2 desorption profile stops changing significantly after initial (1) doses above approximately 20 L, which we associate with the saturation of the first layer on the surface. The TPD yields for H2, as well as those for HCN and isobutene, two other main products from the thermal decomposition of (1) on Ni(110), are reported as a function of initial dose in the right panel of Fig. 1. In all cases, maximum yields are reached after approximately 10–20 L.
The low-temperature thermal chemistry of (1) adsorbed on Ni(110) is highlighted by the peaks seen in the TPD reported in Fig. 2. There, traces are shown for a large selection of high-amu fragments, to illustrate the desorption profile of the different species that may desorb. An exposure of 20 L was chosen for these experiments in order to saturate the first layer but not condensed excessive amounts of the precursor because desorption from the condensed layer, which was determined to occur around 285 K, could mask the other features.
Selected TPD traces from thermal activation of 20 L of (1) adsorbed on Ni(110).

Three distinct features can be identified in the traces in Fig. 2, with peaks at 320, 350, and 550 K. Because of the significant overlap in the cracking patterns of the potential species produced during this thermal activation of the adsorbed precursor, analysis of the data is not straightforward. Nevertheless, some clear differences among the three temperature regimes can be identified upon close inspection. Here, we focus on the high-mass end of the data associated with large molecular species, either derived from the precursor itself (monomer or dimer) or from the ligand (iminopyrrolidine). An analysis of the relative intensities of the peaks for all the amus probed is summarized in Figs. 3 and 4 in the form of extracted cracking patterns for the desorbing species. The two figures correspond to two separate amu ranges: 100–230 amu in Fig. 3 and 220–350 amu in Fig. 4. It should be pointed out that the peaks for fragments with masses beyond about 250 amu were quite weak, and that those data are somewhat less reliable than the information in Fig. 3.
Cracking patterns in the mass spectrometer of the species that desorb from the Ni(110) surface at the indicated temperatures. Data are shown for the 100–230 amu range.

Cracking patterns in the mass spectrometer of the species that desorb from the Ni(110) surface at the indicated temperatures. Data are shown for the 220–350 amu range.

First, the cracking pattern of the molecules desorbing from the condensed layer, at 285 K (not shown in Fig. 1), is quite similar to that measured for the gas phase (1). The small differences can in fact provide an estimate of the experimental errors associated with these measurements. Second, the fact that peaks are seen here for masses larger than the molecular weight of the monomer of (1), 230 and 232 amu (in a 2:1 ratio), indicates that dimers (or other oligomers) of the Cu complex either survive adsorption or form on the surface. Third, the individual ligands [2-(tert-butylimino)-5,5-dimethyl-pyrrolidinates] can be identified by the peaks at 167/168 amu; accordingly, the fragments at 152/153 amu correspond to the loss of a methyl group from that species. Fourth, because Cu has two stable isotopes, with atomic masses of 63 (2/3 of total intensity) and 65 (1/3) amu, it should be possible in principle to identify fragments that contain Cu atoms in these cracking patterns. Hence, the signals at 228 and 230 amu (seen in all TPD peaks) could be associated with the molecular monomer after losing two hydrogen atoms.
All of the arguments presented in the previous paragraph apply to all of the TPD peaks in Fig. 1, in particular to the low-temperature (320 and 350 K) ones. In fact, the differences in the cracking patterns of all these TPD peaks are subtle. Nevertheless, some can be pointed out. First, the sequence of peaks at 332/334/336 amu seen for the gas-phase molecule and for the 320 and 350 K peaks (but not for the 550 K peak) is likely to be associated with a fragment containing two Cu atoms. That leaves an organic moiety with a mass of 206 amu (after subtracting two Cu atoms), which may correspond to a 5,5-dimethyl-iminopyrrolidinate moiety (upon the loss of the tert-butyl group from the original ligand) plus another 5,5-dimethyl-pyrrolidinate (without the added imino nitrogen). The peaks for a [Cu(I)-5,5-dimethyl-iminopyrrolidinate]2 dimer would be expected at 346/348/350 amu, at the limit of our detection (some of those peaks are nevertheless seen in our spectra). All this points to the likelihood that the species desorbing at both 320 and 350 K are dimers of compound (1), or possibly larger oligomers. The main difference between the cracking patterns of those two peaks is in the intensity of some of the signals at masses beyond the unimolecular ligand, which is higher for the 350 K case. This is particularly true for the signals at 214 and 215 amu, and also for the signal at 281 amu. We do not have at present an interpretation of these observations or a full assignment of all of the amus detected, but speculate that perhaps the species desorbing at 350 K is a dimer where some skeletal rearrangement has taken place. Another possibility is that one of the peaks may correspond to a dimer and the other to a tetramer, as the two are not too far in energy [Reference Chen, Duan, Yao, Ma, Coyle, Barry, Teplyakov and Zaera19]. It is difficult to settle this point with the available data.
The spectrum associated with the 550 K peak, on the other hand, does display clear discernible differences with the others, mainly in the 175–230 amu range. Because these peaks are at masses above that of the molecular ligand unit, and because the peaks do not appear to correspond to fragments containing Cu atoms [there is no 2:1 (amu):(amu + 2) split in intensities anywhere in the cracking pattern figure], we believe that these features may signify the dimerization of the ligands themselves, perhaps to make [2-(tert-butylimino)-5,5-dimethyl-pyrrolidinate]2. In particular, the intense peak at 181 amu could be associated with a fragment of C10N3H19 stoichiometry, which could come from a full 2-(tert-butylimino)-5,5-dimethyl-pyrrolidinate ligand plus an extra nitrogen atom (we suggest that the dimerization takes place via a N–N bond formation). This assignment is tentative, however, because the TPD data are by themselves difficult to interpret, given the extensive overlap with cracking fragments from other species and the possibility of more than one species being formed at this temperature. One additional observation in favor of our proposal is the fact that this dimer desorbs as the Cu centers become reduced to their metallic state [Reference Chen, Coyle, Barry and Zaera21]. It could be argued that the metal reduction is achieved via a reductive elimination step such as the ligand coupling proposed here; similar chemistry has been seen with other ALD precursors [Reference Barry, Teplyakov and Zaera6, Reference Zaera25, Reference Bouman and Zaera27, Reference Bouman and Zaera28]. Regardless, it appears that by 550 K, most of the adsorbed (1) precursor loses its ligands on the nickel surface.
Quantum mechanics calculations
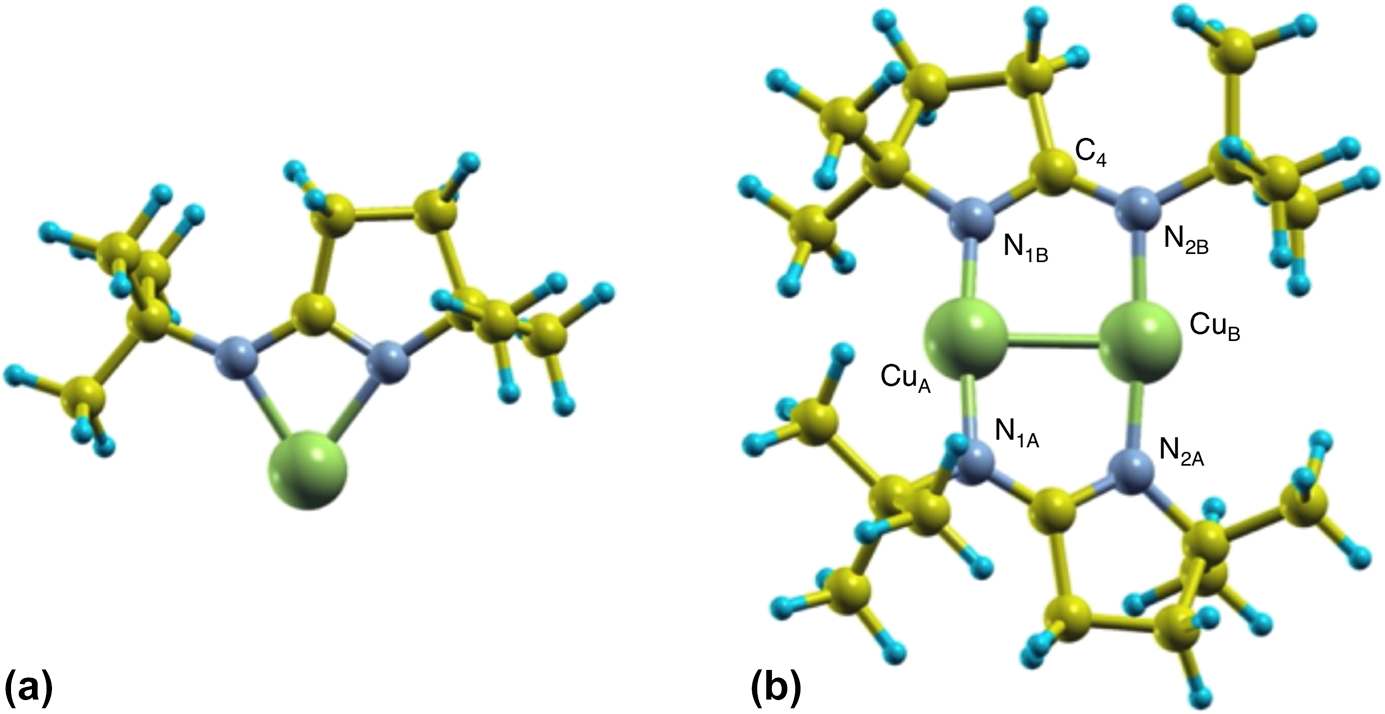
In order to better understand the energetics of the monomer–dimer interconversion of the iminopyrrolidinate complexes when adsorbed on surfaces, complementary DFT calculations were performed. Because it is well known that copper amidinates tend to dimerize in the solid state [Reference Lim, Rahtu and Gordon10, Reference Li, Barry and Gordon29, Reference Whitehorne, Coyle, Mahmood, Monillas, Yap and Barry30, Reference Edelmann, Anthony and Mark31] (and in the gas phase as well [Reference Chen, Duan, Yao, Ma, Coyle, Barry, Teplyakov and Zaera19]), we first optimized the atomic structure of isolated monomers and dimers of (1) using a big unit cell (to simulate the gas phase, in which all molecules are separated by a large distance). Figure 5 shows schematic views of the resulting structures. It was found that, in the monomer, one Cu atom forms two Cu–N bonds with bond lengths of d Cu–N = 1.99 and 2.02 Å, at an angle of ∠NCuN = 69°. On the other hand, the dimer shows two copper atoms each forming two Cu–N bonds with bond lengths of d Cu–N 1.87 and 1.90 Å, with the Cu2N4 moiety in a configuration close to planar (matching almost perfectly experimental X-ray diffraction structural results) [Reference Coyle, Kurek, Pallister, Sirianni, Yap and Barry32]. The differences in bond distances in both cases are small and could be within the error of our calculations; otherwise, the structures may fluctuate in time, with the Cu–N bond lengths switching between the two (monomer) or four (dimer) bonds involved. We have found that a Cu(I)-2-(tert-butylimino)-5,5-dimethyl-pyrrolidinate dimer is more stable than its two monomers kept apart by an energy difference of approximately ∆E = 4.9 eV (470 kJ/mol).
Schematic views of the most stable monomer (a) and dimer (b) structures of (1). Green, gray, yellow, and blue spheres represent Cu, N, C, and H atoms, respectively. Structural parameters for the dimer: CuA–N1B = 1.87 Å, CuB–N2B = 1.90 Å, CuA–CuB = 2.46 Å, N1B–C4 = 1.34 Å, N2B–C4 = 1.33 Å, ∠N1B–C4–N2B = 121.6°, dihedral angles: 13.5° and 11.2°.
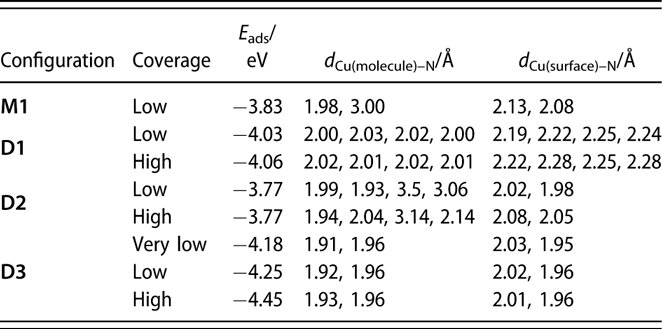
Additional calculations were performed to probe the adsorption of the monomer and the dimer on a Cu(110) surface using a large (4 × 5) unit cell. Copper rather than nickel surfaces were used here to isolate the trends in the energetics of the surface interactions from the nature of the metal used; analogous calculations on Ni(110) are being carried out currently and will be reported in a future publication. It should be stated that, based on our previous studies, we believe that much of the chemistry of the amidinate precursors is similar on Cu and Ni surfaces, although the thermal decomposition tends to take place at lower temperatures on the more active Ni substrates [Reference Ma, Guo, Gordon and Zaera15, Reference Yao, Coyle, Barry and Zaera20, Reference Ma, Zaera and Gordon33]. In any case, it was determined that on Cu(110) and for the monomer in its most stable configuration, M1 [shown in Fig. 6(a)], one of the original Cu–N bonds is broken, with the respective N atom forming a new bond with a surface Cu atom with a bond length of d Cu–N = 2.08 Å (Table I). Although the other N atom remains bonded to the original Cu atom of the monomer, with d Cu–N = 1.98 Å, it also interacts with a Cu surface atom, forming a bond of length d Cu–N = 2.13 Å.
Top and side views of the different optimized configurations calculated for the adsorption of a monomer and of a dimer of (1) on Cu(110). (a) The most stable monomer configuration M1; (b) configuration D1, where the dimer is intact; (c) configuration D2, after the dimer dissociates but keeps both ligands close to each other; (d) configuration D3, where the dimer is dissociated and one of the ligands is on top of the two Cu atoms of the dimer while the other is on top of the ideal Cu(110) surface. Green, gray, yellow, and blue spheres represent Cu, N, C, and H atoms of the molecule, respectively. Surface Cu atoms are shown as brown spheres. The second-layer Cu atoms in the top views are shown with smaller diameters.

Adsorption energies and structural parameters for the several configurations of monomers and dimers of (1) adsorbed on Cu(110) surfaces estimated from our DFT calculations. Low (θ = 1/20 monolayers) and high (θ = 1/12 monolayer) coverages were simulated by using (4 × 5) and (3 × 4) unit cells, respectively. The “very low” coverage for D3 was calculated using a different, larger cell (see text).
Adsorption energies were calculated by using the energy of the relaxed Cu(110) surface plus the energy of the dimer in gas phase as reference. Accordingly, the adsorption energy for a monomer can be written as follows:
 $${E_{{\rm{ads}}}} = 2{E_{{\rm{monomer@surface}}}} - 2{E_{{\rm{surface}}}} - {E_{{\rm{dimer}}}}\quad ,$$
where E monomer@surface and E surface are the total energies of the slab with and without the monomer, respectively, and E dimer is the total energy of the dimer in the gas phase. The calculated adsorption energy for the monomer using this equation was estimated at E ads,M1 ∼ −3.83 eV (−370 kJ/mol).
In the molecularly adsorbed dimer on Cu(110), the two Cu atoms of the dimer were found to occupy bridge sites, with the four N atoms on top sites above surface Cu atoms [configuration D1, Fig. 6(b)]. Because bridge sites are not stable for the adsorption of a Cu dimer (the energy is 0.48 eV higher than the energy of the most stable configuration at hollow sites), the stability of D1 is due to the bonds that the nitrogen atoms make with the surface Cu atoms. Also, as shown in Fig. 6(b), the dimer is considerably distorted from its planar structure in the gas phase to favor adsorption. Four Cusurface–N bonds are formed between the surface Cu atoms and N atoms of the dimer, with bond lengths of between d Cu–N = 2.19 and 2.25 Å. The increase in Cumolecule–N bond length upon adsorption, from d Cu–N = 1.87 and 1.90 Å in the gas-phase dimer to d Cu–N = 2.00–2.03 Å on the surface, indicates their weakening upon adsorption. Using a similar convention as for the monomer, the adsorption energy for a dimer can be written as follows:
 $${E_{{\rm{ads}}}} = {E_{{\rm{dimer@surface}}}} - {E_{{\rm{surface}}}} - {E_{{\rm{dimer}}}}\quad ,$$
where E dimer@surface and E surface are the total energies of the slab with and without the dimer and E dimer is the total energy of the dimer in the gas phase. The calculated adsorption energy of this configuration is E ads,D1 = −4.03 eV (−390 kJ/mol, Table I), indicating that adsorption as a dimer is more stable than adsorption as two monomers.
We have also considered the possible dissociation of the dimer on the surface. In configuration D2, shown in Fig. 6(c), the dimer is shifted in the  $\left[ {1\bar{1}0} \right]$ direction in such a way that the Cu atoms of (1) now occupy stable hollow positions. One of the ligands of the precursor is still bonded to what is now a Cu ad-dimer but not to any Cu surface atom, whereas the other is separated from the Cu ad-dimer, with both N atoms forming bonds with surface Cu atoms. This ligand shifts one lattice constant with respect to configuration D1. The bond lengths of the N atoms of the first ligand to the Cu ad-atoms are now d Cu–N = 1.99 and 1.93 Å, and the shifted ligand are 3.5 and 3.06 Å away from the Cu ad-atoms but form new bonds to Cu surface atoms with bond distances of d Cu–N = 2.02 and 1.98 Å; the new bonding is slightly asymmetric. The adsorption energy of D2 is E ads,D2 = −3.77 eV (−365 kJ/mol, Table I), showing that this configuration is less stable than D1: In D2, the organic groups are too close and repel each other.
Next, we considered the shifting of the ligand in the −[100] direction to reduce steric effects. In this configuration [D3, Fig. 6(c)], both ligands are oriented with their planes perpendicular to the surface, and are separated by 1 and 1/2 lattice constants in the [100] direction, respectively. The Cu–N bond lengths are d Cu–N = 1.92 and 1.96 Å for the ligands on top of the ad-dimers, and d Cu–N = 2.02 and 1.96 Å for the ligand on top of the surface. This is the most stable configuration calculated here for the adsorption of the dimer, with an adsorption energy of E ads,D3 = −4.25 eV (−410 kJ/mol, Table I).
The overall conclusions from these calculations is that (1) prefers to adsorb on Cu(110) as a dimer, and that it is energetically driven to decompose via the loss of one of its ligands, intact, to the surface. This latter step may be activated, however, which may be why molecular desorption is detected in TPD experiments. Of course, our search of decomposition mechanisms has not been exhaustive, and other pathways are in principle possible. However, a previous, more comprehensive, study with a smaller amidinate ligand [Reference Guerrero-Sánchez, Takeuchi and Zaera22] led us to identify single ligand loss as a promising possibility to explore here; the calculations reported above have then corroborated the feasibility of such path.
Finally, we have studied the evolution of the charges around the individual atoms upon adsorption and dissociation of the (1) dimer on the Cu(110) surface using Bader’s charge population analysis. Figure 7 shows that the initial adsorption of the dimer (without dissociation) results in a very small reduction of the Cu atoms of the dimer, from charges of +0.55 and +0.55 in the gas phase to +0.47 and +0.52 once it is attached to the surface (the two values correspond to the two Cu atoms of the dimer). The ligands are also reduced, from −0.54 and −0.55 to −0.62 and −0.60. To compensate, the surface Cu atoms directly bonded to the dimer acquire a partial positive charge, changing from neutral to +0.10, +0.08, +0.07, and +0.09. Once the dimer is broken into two pieces, the Cu atoms of the molecule are reduced further, to +0.31 and +0.23, and the surface Cu atoms that bond to the N atoms are oxidized, with charges of +0.23 and +0.25. The ligands on top of the Cu ad-atoms and Cu surface atoms are slightly oxidized, reaching new charges of −0.54, and −0.53, respectively. When the free ligand moves away from the reminder of the dimer (to configuration D3), the additional changes in the charges of the Cu atoms and the ligands are small, as seen in Fig. 7(d). The charges in the Cu atoms that form bonds with the ligands remain small, in the +0.18 to +0.28 range. Finally, when the ligands are taken away from the surface, the Cu atoms become metallic. These results show that both the ligands and the Cu substrate are responsible of the reduction of the Cu centers of the precursor, (1), as it adsorbs and decomposes on the surface.
Evolution of the charges of the dimer of (1) after adsorption and dissociation on Cu(110), as it goes from its gas phase structure (a) through the D1 (b), D2 (c), and D3 (d) intermediates. Also provided is the charge distribution of the Cu ad dimer (e). The black and red numbers correspond to the charges of the Cu atoms and the ligands, respectively.

Adsorption of the ligand
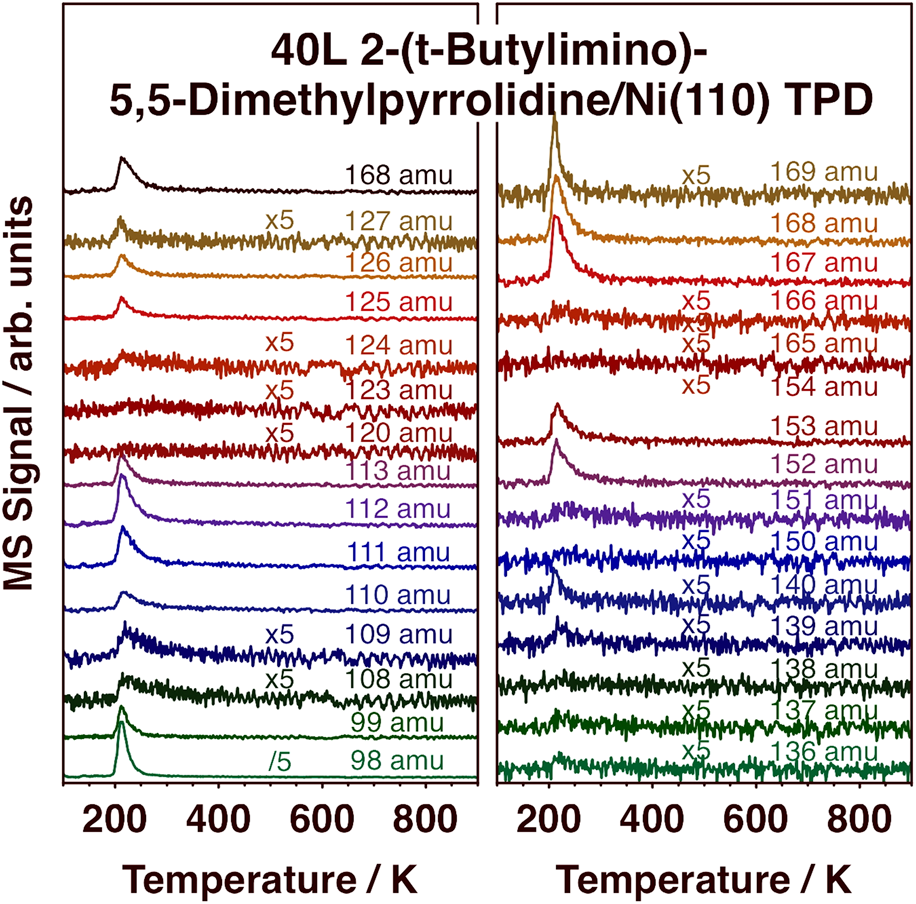
In order to complement the information from the TPD experiments and DFT calculations on the desorption of (1) from metal surfaces, additional studies were carried out with the free, protonated ligand, 2-(tert-butylimino)-5,5-dimethyl-pyrrolidine, compound (2) [Scheme 1, MW = 167 amu]. Selected TPD traces in the 98–169 amu range after low-temperature adsorption on Ni(110) are reported in Fig. 8, and the cracking pattern obtained from those data for molecular desorption, which peaks at 210 K, is reported in Fig. 9. It is seen in Fig. 9 that the cracking pattern of molecular (2) is quite similar to that obtained for (1), as reported in Fig. 3, corroborating that the latter contains information about the whole, non-decomposed, ligand. A few subtle differences can be seen nevertheless. First, in the case of (2), no significant signal was detected for masses above 168 amu, the molecular weight of the protonated monomer of the ligand. There is no reason to expect the free protonated ligand to dimerize, and no evidence of that was obtained here. Second, a clear peak is seen in Fig. 8 for 140 amu, associated with the loss of a C2H4 fragment in the ionization process (from the pyrrolidine ring). Curiously, this fragment was not seen in the experiments with (1). Finally, the relative intensities of the 167 and 168 amu peaks are different for (1) versus (2). This is not surprising, as (2) is the protonated version of the ligand in (1), and therefore contains an extra hydrogen atom.
TPD traces from selected masses in the 98–169 amu range after dosing 2-(tert-butylimino)-5,5-dimethyl-pyrrolidine, compound (2), on Ni(110) at 100 K. Emphasis here is on the detection of molecular desorption.
Mass-spectrum cracking pattern of (2), obtained from TPD experiments such as those reported in Fig. 8. Molecular desorption in this case was seen to peak at about 210 K.

Another important observation in Fig. 8 is the fact that most of the adsorbed (2) desorbs molecularly and at quite low temperatures, around 210 K as indicated above. It is worth recalling that the protonated ligand is a stable molecule by itself, and perhaps not prone to easy deprotonation/dehydrogenation (at the amine group), the step that presumably could trigger further surface decomposition. Some decomposition does take place on the Ni(110) surface, as reported before [Reference Chen, Coyle, Barry and Zaera21], mainly to produce not only H2, HCN, N2, and iso-butene but also 5,5-dimethyl-pyrrolidine. Here, we can highlight the weak peaks seen in the TPD data in Fig. 8 for 108, 109, 139, 151, and 166 amu. Those features reach maximum intensity at a slightly higher temperature than the rest, at about 225 K, indicating that they originate from a different species. Given that the mass values of those peaks are one or two units below the key peaks of the molecular species, we speculate that the new desorbing species could be a dehydrogenated version of (2), a molecule that retains the full skeletal arrangement of the original ligand but loses a couple of hydrogens, perhaps 2-(tert-butylimino)-5,5-dimethyl-pyrroline.
DFT calculations of the adsorption of (2) on Cu(110) showed that the compound prefers to attach to the surface with its molecular axis perpendicular to the Cu surface normal [Fig. 10(a), configuration L1]. Each of its two nitrogen atoms bond with a Cu surface atom, with d Cu(surface)–N = 2.03 and 1.95 Å.
Top and side views of two different configurations for the adsorption of (2) on Cu(110). (a) The ligand is on top of the ideal Cu(110) surface. (b) The ligand is on top of the two Cu atoms of the dimer. Green, gray, yellow, and blue spheres represent Cu, N, C, and H atoms of the molecule, respectively. Surface Cu atoms are shown as brown spheres. Second-layer Cu atoms in the top views are shown with smaller diameters.

Starting with the calculated energy of this configuration, we can then estimate the adsorption energy of the dimer of (1) after its two ligands have broken away from the Cu center atoms using the formula:
 $${E_{{\rm{ads}}}} = 2 \times {E_{{\rm{ligand@surface}}}} - 2 \times {E_{{\rm{surface}}}} - {E_{{\rm{dimer}}}}\quad ,$$
where E ligand@surface and E surface are the total energies of the slab with and without the ligand, respectively, and E dimer is the total energy of the dimer in the gas phase. The adsorption energy calculated this way is E ads, dissociated = −3.59 eV (−345 kJ/mol), indicating that this configuration is less stable than configuration D1. In this case, the organic groups of the ligands are too close to the Cu surface.
Effect of surface coverage
The ligands considered here are quite bulky, suggesting that increasing coverages of the adsorbates could induce new steric effects and modify the energetics of the adsorption, desorption, and decomposition processes. To probe that effect, additional DFT calculations were carried out with a smaller (3 × 4) unit cell; this is the smallest unit cell in which a dimer can be fitted. In particular, we considered adsorption of a dimer in configurations D1, D2, and D3. The adsorption energies and Cu–N bond distances resulting from these calculations are summarized in Table I. It can be seen that in configurations D1, and D3, the Cu–N bond lengths change little when going from low to high coverage. In D2, on the other hand, the changes in the Cu–N bond lengths are slightly larger because in this configuration the molecule is more spread out on the surface.
A possibility for the surface decomposition of (1) is that only one ligand is removed and displaced to the surface while the other stays on top of the Cu ad-dimer. In that case, our calculations show that the remaining ligand also prefers to attach with its molecular axis perpendicular to the Cu surface normal [Fig. 10(b), configuration L2]. Each of its two nitrogen atoms bond with a Cu atom of the ad-dimer, with d Cu(surface)–N = 1.91 and 1.96 Å. Using the energy of this configuration, together with one of the ligand on top of the surface, the adsorption energy of the dimer in configuration D3 can be estimated at very low coverages. This adsorption energy, reported in Table I as “very low” coverage, comes out to be E ads,“very-low-coverage”D3 = −4.18 eV (−405 kJ/mol), very similar to the −4.25 eV calculated before, indicating that steric effects at the coverage calculated before are not very important. This seems to be the case for the other configurations as well (Table I).
Discussion
In this project, we aimed to better understand the thermal chemistry of the oligomers of ALD precursors on surfaces. Specifically, we looked at the behavior of compound (1), a metal (copper) amidinate, on a metal surface (nickel or copper). Our previous work had indicated that these oligomers, typically dimers, are quite stable: they are well known to form in the solid phase [Reference Malik, O’Brien, Motevalli, Jones and Leedham9, Reference Lim, Rahtu and Gordon10, Reference Devi11] and are also thermodynamically favored in the gas phase (the DFT calculations in those reports did not include van der Waals interactions, but the new calculations reported here, which do, corroborate the general trends identified before) [Reference Chen, Duan, Yao, Ma, Coyle, Barry, Teplyakov and Zaera19, Reference Guerrero-Sánchez, Takeuchi and Zaera22]. Moreover, we found that in the dimer of Cu(I)-(2-sec-butylimino)-pyrrolidinate, the copper ions appear to be sheltered to a sufficient degree that, on silica surfaces at least, the first interaction is not via the metal center but rather through one of the nitrogen atoms [Reference Chen, Duan, Yao, Ma, Coyle, Barry, Teplyakov and Zaera19]. We speculate that such initial interaction may promote subsequent surface chemistry, leading to the decomposition of the ligands not foreseen when these precursors were designed for film growth applications.
In the present study, we explore the equivalent surface chemistry on metal rather than oxide surfaces. We find that the behavior is quite different. Our DFT calculations on Cu(110) show that adsorption of the dimer of (1) is more stable than dissociation into two monomers. The experimental TPD data also indicate that molecular desorption upon thermal activation of the precursor adsorbed on Ni(110) leads to the evolution of the dimer; no evidence for monomer formation was found. In addition, the quantum mechanical calculations point to the fact that, on metals, adsorption via the formation of metal–metal bonding is possible; no initial bonding through the nitrogen atoms of the ligands was seen in this case. Several configurations involving Cusurface–N bonds were tested, but none yielded adsorption energies comparable to that for adsorption through the Cu ions (data not shown). What was found was that the dimer of (1) bends, losing it planarity, in order to facilitate the access of the copper ions to the surface. Those appear to prefer surface positions in registry with the metal lattice.
Once bonded to the surface, as a dimer as stated above, (1) is capable of undergoing some ligand rearrangement steps. The initial molecular (dimer) structure, configuration D1 (Fig. 6), may be stable but is thermodynamically more energetic than having one ligand leave the adsorbed complex and migrate to adjacent sites on the surface, configuration D3 (again, Fig. 6). However, configurations D1 and D3 do have similar energies, and although D3 is slightly more stable, it is quite likely that the conversion of D1 to D3 is activated, and therefore limited at low temperatures. It is therefore reasonable to expect the dimer not to dissociate but rather to prefer to (partially) desorb at lower temperatures, as seen experimentally here on Ni(110). The adsorbed dimer can still undergo some structural rearrangements, via, for instance, the scission of one of the Cu–N bonds, as in configuration D2; this would justify the two molecular peaks seen in the TPDs in Fig. 2 at 320 and 350 K for the dimer (recall that those show only slight differences in cracking patterns at masses above the molecular weight of the monomer, the reason why we suggested both to correspond to different structures of the molecular Cu precursor). However, once configuration D3 is reached, it is difficult to go back to the original dimer configuration. Instead, the ligands, now bonded to the substrate, may protonate or dissociate into a variety of products. The dimerization of the ligands seen in the TPD at 550 K (Fig. 2) could come from either configuration D2 or configuration D3. However, the more extensive decomposition, to H2, HCN, and isobutene, must start via the dissociation of the ligands seen in D3.
One additional piece of information useful to interpret the ALD chemistry associated with (1) and similar precursors comes from the calculated evolution of the charges on copper atoms shown in Fig. 7. There, it is clear that, upon adsorption and dissociation of (1), the copper atoms in the ALD precursor are reduced to a metallic state. This is in good agreement with experimental XPS results [Reference Ma, Guo, Gordon and Zaera14, Reference Ma, Guo, Gordon and Zaera15, Reference Yao, Coyle, Barry and Zaera17, Reference Yao and Zaera18, Reference Yao, Coyle, Barry and Zaera20, Reference Chen, Coyle, Barry and Zaera21, Reference Ma, Zaera and Gordon33]. We have in the past argued that the initial dissociation or decomposition of the adsorbed ligands is rate limiting, and that that first step is accompanied by the reduction of the metal ions of the ALD precursor. This idea is supported mainly by the coincidence between the threshold temperatures at which hydrogen is detected in TPD experiments and the reduction of Cu(I) ions to Cu(0) atoms on the surface seen by XPS. Figure 7 shows that the latter occurs when both ligands are displaced and migrate to the surface; it is interesting to note that in configuration D3, the Cu atoms of the adsorbed complex still retain a partial positive charge. Given that this intermediate state is not seen in the XPS data, it would seem that the first decomposition step, to configuration D3, is rate limiting and that the removal of the second ligand, and even further decomposition of the organic moieties on the surface, takes place right after that first step. In a previous calculation, with a simpler amidinate, we determined that, indeed, the removal of the first ligand from the adsorbed Cu complex is activated, with a barrier of approximately 40 kJ/mol [Reference Guerrero-Sánchez, Takeuchi and Zaera22]; it is likely that the decomposition steps that follow require less energy to proceed. Ligand decomposition, it appears, takes place on the substrate, not while the ligands are bound to the original Cu ions.
Conclusions
The early stages of the thermal chemistry of Cu(I)-2-(tert-butylimino)-5,5-dimethyl-pyrrolidinate, compound (1), on metal surfaces were characterized by a combination of experimental (TPD) and theoretical (DFT) methods. The decomposition of this precursor on Ni(110), already reported in a previous publication [Reference Chen, Coyle, Barry and Zaera21], was here corroborated via the detection of H2 desorption, and a calibration of the exposure required to saturate the first monolayer on the surface was achieved by performing dose-dependent studies (Fig. 1). More detailed TPD data collection was performed in the high-mass range, by detecting fragments with masses as high as ∼350 amu, in order to determine the character of the species that desorb molecularly in the low-temperature region of the TPD traces, that is, below ∼400 K (Fig. 2). A careful analysis of the cracking patterns of the desorbing species in the mass spectrometer afforded the identification of two closely related dimer forms of (1) at 320 and 350 K (Figs. 3 and 4). An additional peak seen at 550 K was identified with the formation of dimers of the free ligands, once detached from the Cu ions, but no evidence of monomer formation was ever seen in these experiments. Additional TPD runs with 2-(tert-butylimino)-5,5-dimethyl-pyrrolidine, compound (2) (the protonated ligand), corroborated some of the assignments and helped with the interpretation of the data obtained with the full ALD precursor (Figs. 8 and 9).
The experimental work was complemented with quantum mechanics calculations of the energetics, structures, and charge distributions of the species that form upon adsorption of (1) and (2) on Cu(110). New, better quality calculations were first performed for the gas-phase free monomer and dimer of (1), which included the van der Waals interactions that were neglected in past reports (Fig. 5). More accurate energy values were obtained, but the general trends remained the same: the dimer is significantly more stable than the monomer. Next, the structures of the adsorbed monomer and dimer on Cu(110) were estimated. The adsorbed dimer turned out to be more stable than the monomer, even if it needs to undergo a molecular distortion, away from its initial planar configuration, to improve accessibility of the Cu ions of the complex to the atoms of the solid surface (Fig. 6). A possible dissociation path via stepwise displacement of the individual ligands, whole, to the surface was identified as well. The final ligand adsorption is similar to what is obtained by dosing the free protonated ligand (Fig. 10) [Reference Chen, Coyle, Barry and Zaera21], even if its molecular desorption is delayed and occurs at higher temperatures because the displacement step from the original complex to the surface is rate limiting. Finally, the evolution of the charge distributions on the adsorbed species upon dissociation was evaluated. The reduction of the Cu ions of the ALD precursor to a metallic state was seen as the ligands were removed (Fig. 7).
Methods
Experimental details
The TPD experiments reported here were performed in an ultrahigh vacuum (UHV) apparatus described in more detail in previous publications [Reference Chen, Coyle, Barry and Zaera21, Reference Zaera34, Reference Yao, Guerrero-Sánchez, Takeuchi and Zaera35]. A UTI quadrupole mass spectrometer was used, with the ionizer placed inside a stainless-steel box with a small front aperture for selective sampling of the desorbing gases [Reference Yao, Coyle, Barry and Zaera17]. The electronics were interfaced to a personal computer in order to be able to collect data for up to 15 different masses in a single TPD run. Because the transmission function of mass quadrupoles decreases exponentially with increasing ion mass, different tuning parameters (focusing, resolution, and signal amplification voltages) were required for the detection of the high-mass end of the spectra reported here. Accordingly, many TPD experiments were carried out using several sets of conditions, with some common masses across the different settings in order to be able to put together the full cracking patterns of the desorbing products. It should be indicated that although the UTI instrument is rated for a maximum mass detection of 300 amu, we managed to detect ions beyond that mass limit. A linear heating rate of 5 K/s was used in the TPD experiments.
A Ni(110) single crystal was used as the substrate, cleaned in situ before each experiment by a combination of chemical (O2 and H2 treatments) and physical (sputtering–annealing cycles) procedures until the surface was deemed cleaned by CO or H2 TPD. Sputtering was followed by annealing at high temperatures (∼1100 K) to regain the smooth nature of the single-crystal flat (110) surface, as established by others in the past [Reference Farnsworth, Schlier, George and Burger36, Reference Klier, Zettlemoyer and Leidheiser37]. The UHV chamber used in these experiments is also equipped with an hemispherical electron energy analyzer and an aluminum-anode (hν = 1486.6 eV) X-ray source, used to acquire XPS to further check on the cleanliness of the sample. The Cu(I)-2-(tert-butylimino)-5,5-dimethyl-pyrrolidinate precursor, compound (1), was synthesized by reaction of the corresponding ligand with an alkyl lithium compound and copper chloride, as described in detail in previous publications [Reference Chen, Coyle, Barry and Zaera21, Reference Coyle, Kurek, Pallister, Sirianni, Yap and Barry32]. It was dosed on the surface using a controlled leak valve, and followed by measuring the exposure time and pressure, the latter using a nude ion gauge. In the data reported below, exposures are expressed in terms of Langmuirs (1 L = 1 × 10⁻⁶ torr s), uncorrected for ion gauge sensitivities.
Computational details
Spin-unrestricted first principle calculations were used based on periodic DFT, as implemented in the Quantum ESPRESSO open source package [Reference Giannozzi, Baroni, Bonini, Calandra, Car, Cavazzoni, Ceresoli, Chiarotti, Cococcioni, Dabo, Corso, de Gironcoli, Fabris, Fratesi, Gebauer, Gerstmann, Gougoussis, Kokalj, Lazzeri, Martin-Samos, Marzari, Mauri, Mazzarello, Paolini, Pasquarello, Paulatto, Sbraccia, Scandolo, Sclauzero, Seitsonen, Smogunov, Umari and Wentzcovitch38]. For the exchange-correlation (XC) potential, the generalized gradient approximation (GGA), with the Perdew–Burke–Ernzerhof (PBE) functional, was used. Van der Waals interactions were included by using the Grimme D2 method. Ultra-soft pseudopotentials were used, and the wave functions were expanded in plane waves with a kinetic energy cutoff of 35 Ry. The cutoff for the charge density was set to 280 Ry. To model each of the slabs, four Cu layers and an empty space of ∼18 Å were used to avoid self-interactions between the surface and its image generated by the periodic conditions imposed to the system. In each simulation, the bottom layer was fixed to the bulk positions, whereas the remaining three were let free to move. The geometric structures were optimized by minimizing the forces on individual atoms with the criterion that all forces on each atom must be smaller than 1 × 10⁻³ Ry/a.u.
We note that the Grimme D2 method used here is known to overestimate adsorption energies. However, the inclusion of dispersion-corrected van der Waals interactions is mandatory for this kind of surface–molecule interactions. In an ongoing work on the adsorption of an analogous amidinate using PBE, PBE + Grimme-D2, and PBE + Grimme-D3, we have found that the adsorption energy trends are not affected by the type of van der Waals correction used. A similar conclusion has been reached by others [Reference Pašti, Jovanović, Dobrota, Mentus, Johansson and Skorodumova39].
Acknowledgments
Financial support for this project was provided by the U.S. Department of Energy, Office of Science, Basic Energy Sciences, Materials Sciences and Engineering (MSE) Division, under Award No. DE-SC0001839. N.T. and J.G.S. thank DGAPA-UNAM Project IN100516, and Conacyt Grant A1-S-9070 of the Call of Proposals for Basic Scientific Research 2017–2018 for partial financial support. N.T. thanks DGAPA-UNAM for a scholarship at the University of California, Riverside. Calculations were performed in the DGCTIC-UNAM Supercomputing Center, project LANCAD-UNAM-DGTIC-051.


