

Obesity is the result of chronic mismanagement of energy balance (EB) and is associated with several chronic diseases( Reference Bray 1 ). Recent analyses project the prevalence of obesity to continue to increase( 2 ), with part of this increase attributable to a greater number of lean individuals gaining weight throughout adulthood( Reference Ostbye, Malhotra and Landerman 3 ). Daily energy restriction (ER) of 20–50 % of estimated energy requirements (EER) is frequently used as a method of managing EB( Reference Omodei and Fontana 4 ), yet data suggest that only approximately 40 % of individuals manage to achieve long-term weight loss( Reference Greenberg, Stampfer and Schwarzfuchs 5 ). This may be owing to the requirement for daily adherence to the diet in order to achieve a sufficiently large energy deficit for weight loss( Reference Harvie, Wright and Pegington 6 ).
Intermittent energy restriction (IER), often termed ‘intermittent fasting’, has become the subject of considerable research attention as an alternative to continuous ER( Reference Varady, Bhutani and Church 7 ). Typically, IER permits consumption of an ad libitum or adequate energy diet (i.e. approximately 100 % EER) punctuated by short periods (24–48 h) of severe (approximately 25 % EER) or complete ER. Previous studies have demonstrated 2–16 kg of weight loss after 3–20 weeks of IER, which is comparable to losses induced with daily ER( Reference Seimon, Roekenes and Zibellini 8 ). With IER, this weight loss may be facilitated by a subjective and hormonal appetite response conducive to the maintenance of a negative EB( Reference O’Connor, Scisco and Smith 9 – Reference Clayton, Burrell and Mynott 11 ). As such, IER may be an effective alternative weight management strategy to traditional continuous moderate ER.
By nature, IER requires individuals to undergo repeated cycles of acute severe ER and refeeding. It has been demonstrated that a short (12–72 h) period of complete ER (i.e. fasting) causes several metabolic alterations, including a reciprocal upregulation of lipolysis to provide NEFA for oxidation, and a down-regulation of glycogenolysis to conserve glycogen stores( Reference Soeters, Soeters and Schooneman 12 ). This concurrently occurs with a decline in postprandial/nutrient-stimulated insulin sensitivity and elevated plasma glucose concentrations( Reference Bergman, Cornier and Horton 13 ). Typically, IER protocols utilise partial (consuming approximately 25 % EER) rather than complete (i.e. fasting) ER, which may mitigate these effects( Reference Antoni, Johnston and Collins 14 ). It was recently shown in overweight/obese individuals that partial ER (approximately 25 % EER) produced a more favourable postprandial glycaemic response compared with complete ER, but a degree of insulin resistance was still present( Reference Antoni, Johnston and Collins 14 ). However, metabolic regulation is likely to differ between lean and overweight/obese individuals( Reference Kahn and Flier 15 ), as does the premise of IER (i.e. weight loss v. weight maintenance). Weight management is an integral part of reducing the prevalence of cardiometabolic disease. It has been well established that IER diets induce weight loss, which may in itself impart a beneficial effect on risk markers for chronic disease. However, identifying whether there are specific metabolic effects of IER style diets, in lean individuals, will help determine whether IER might be used effectively as a tool for weight management( Reference Antoni, Johnston and Collins 16 ).
Therefore, the aim of this study was to investigate the acute effects of 24-h severe ER (approximately 25 % EER) in lean males, on indices of glycaemic control and metabolism, including fasting and postprandial measures of glucose, insulin, NEFA, glucagon-like peptide 1 (GLP-1), glucose-dependent insulinotropic peptide (GIP) and fibroblast growth factor 21 (FGF21).
Methods
Subjects
This study was conducted according to the guidelines laid down in the Declaration of Helsinki, and all procedures involving human subjects/patients were approved by the Loughborough University Ethical Sub-committee for human participants (reference number: R15-P032). A total of fourteen recreationally active, weight-stable (>6 months), non-dieting males (age: 25 (sd 4) years; mass: 77·8 (sd 10·2) kg; height: 1·79 (sd 0·07) m; BMI: 24 (sd 2) kg/m2; body fat: 17 (4) %) provided written informed consent to participate in the study. The sample size was based on the 2-h glucose AUC values for males from a previous study from our laboratory( Reference Clayton, Burrell and Mynott 11 ) that used a similar study design. Using an α of 0·05 and a β of 0·2, it was determined that twelve subjects would be required to detect a 10 % difference in glucose AUC.
Study design
Subjects’ height (Seca stadiometer), mass (AFW-120K; Adam) and body fat percentage( Reference Durnin and Womersley 17 ) were determined during a preliminary visit to the laboratory. For inclusion, subjects were required to have a BMI <25 kg/m2 and/or a body fat percentage <25 %( Reference Romero-Corral, Somers and Sierra-Johnson 18 ). Subjects completed two experimental trials in a randomised, counterbalanced order, with trials separated by ≥7 d. Each trial consisted of a 24-h period of either EB or ER, followed by an oral glucose tolerance test (OGTT).
Pre-trial standardisation
Dietary intake and physical activity in the 24 h preceding the first experimental trial were recorded, and replicated before the second trial. Alcohol and strenuous exercise were not permitted during this period, or during the study period.
Protocol
For each trial, subjects attended the laboratory on two consecutive mornings (about 07.30 hours), arriving by means of motorised transport after a >10-h overnight fast. Subjects were not permitted to consume food and drink additional to that provided during the study period.
Day 1: On arrival, subjects were seated for 30 min before a blood sample was collected by venepuncture from an antecubital forearm vein (−24 h). Before leaving the laboratory, subjects were provided with an individually standardised diet, and instructions on when to consume each item. Subjects were asked to perform minimal activity over the day. Diets were formulated to contain either 25 % (ER) or 100 % (EB) of EER, with EER calculated as the product of estimated resting metabolic rate( Reference Mifflin, St Jeor and Hill 19 ) and a sedentary physical activity level of 1·4. Total energy was divided between four meals during EB and between two meals during ER (Table 1). Diets were kept standardised; however, individual preferences (i.e. severe dislike to a certain food) were considered and minor alterations were made to ensure adherence. Water intake was prescribed at 35 ml/kg of body mass (2853 (sd 329) ml) and was evenly distributed throughout the day. On ER, in place of breakfast (08.00 hours), subjects consumed a bolus of water equal to the water content of the breakfast provided on EB.
Energy and macronutrient intake at each meal (meal time in brackets) during day 1 (Mean values and standard deviations)
Day 2: Subjects returned to the laboratory the following morning and a 20-gauge cannula was inserted into an antecubital forearm vein. After 30 min of seated rest, a fasted blood sample was collected (0 h). Subjects then consumed 75 g of glucose dissolved in 250 ml of water, with an additional 50 ml of water used to rinse the beaker to ensure that all of the glucose was consumed. The drink was consumed as quickly as possible and typically within 15 s. Blood samples were collected 0·25, 0·5, 0·75, 1, 1·5 and 2 h after ingestion, with subjects remaining seated throughout.
Blood sampling and analysis
Blood samples were drawn in 12-ml volumes, with 5 ml dispensed into pre-chilled tubes containing 1·6 mg/ml of potassium EDTA (Sarstedt AG & Co.) and stored on ice, and 5 ml dispensed into tubes containing a clotting catalyst (Sarstedt AG & Co.) and stored for 15 min at room temperature until completely clotted. Tubes were then centrifuged (1750 g ; 10 min; 4°C) and plasma/serum separated. The supernatant was stored at −20°C for later analysis. The remaining 2 ml of whole blood was mixed with potassium EDTA and used for the determination of Hb concentration (via the cyanmethaemoglobin method) and haematocrit (via microcentrifugation) to estimate changes in plasma volume, relative to −24 h( Reference Dill and Costill 20 ). Serum glucose (Horiba Medical) and plasma NEFA (Randox Laboratories Ltd) concentrations were determined by enzymatic, colorimetric methods, using a bench-top analyser (Pentra 400; Horiba ABX Diagnostics). The intra-assay CV for serum glucose and plasma NEFA were 0·5 and 1·3 %, respectively. Plasma GLP-1 (Merck Millipore), GIP (Merck Millipore), FGF21 (R&D Systems) and serum insulin (Immunodiagnostic Systems) were analysed by enzyme-linked immunosorbent assays. Intra-assay CV for plasma GLP-1, GIP, FGF21 and serum insulin were 7·9, 6·1, 3·3 and 4·7 %, respectively. Serum glucose, insulin and plasma NEFA concentrations were determined at all sample time points. Plasma GLP-1, GIP and FGF21 concentrations were determined at −24, 0, 0·5, 1, 1·5 and 2 h.
Calculations
The updated homoeostatic model assessment of insulin resistance (HOMA2-IR) was used to calculate fasting insulin resistance before and after the dietary intervention using freely available online software (http://www.dtu.ox.ac.uk/homacalculator/). Serum glucose and insulin concentrations from the OGTT were used to assess changes in whole-body insulin sensitivity using the Matsuda insulin sensitivity index( Reference Matsuda and DeFronzo 21 ). Incremental AUC (iAUC) was calculated for glucose and insulin to quantify the glycaemic response during the OGTT (0–2 h)( Reference Brouns, Bjorck and Frayn 22 ). Total AUC (tAUC) was calculated for glucose and insulin, as well as all other variables, during the OGTT (0–2 h).
Statistical analysis
Data were analysed using IBM SPSS 23.0 (IBM). Correction of hormone concentrations relative to plasma volume change did not alter the results, and thus the unadjusted values are presented. Fasted (−24–0 h) and postprandial changes (0–2 h) were analysed separately. All data were checked for normality using a Shapiro–Wilk test. Data containing one factor were analysed using a t-test or Wilcoxon signed-rank test, as appropriate. Data containing two factors were analysed using a two-way repeated-measures ANOVA, followed by post hoc Holm–Bonferroni-adjusted paired t-tests or Holm–Bonferroni-adjusted Wilcoxon signed-rank tests, as appropriate. Pearson’s r was used to explore correlations between variables indicated in text. Data sets were determined to be significantly different when P<0·05. Data are presented as means and standard deviations unless otherwise stated.
Results
Body mass change
Body mass was not different between trials at −24 h (P=0·311) but was lower at 0 h during ER (P<0·05). Body mass decreased between −24 and 0 h during both trials (P<0·0001), but to a greater extent during ER (EB: 0·43 (sd 0·31) kg; ER: 1·26 (sd 0·43) kg; P<0·0001).
Fasting metabolic measures
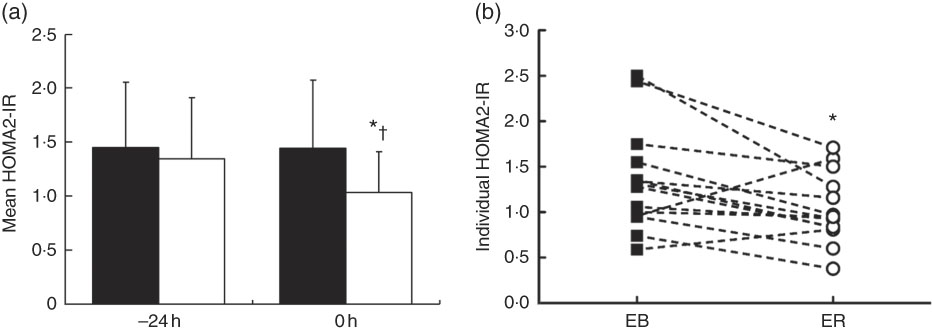
Values for fasting variables collected before (−24 h) and after (0 h) the dietary intervention are presented in Table 2. There were trial (P<0·05) and interaction (P<0·001) effects, but no time effect (P=0·099), for serum glucose concentrations. Glucose concentrations were lower at 0 h during ER compared with EB (P<0·01). Between −24 and 0 h, serum glucose concentrations decreased during ER (P<0·0001), but did not change during EB (P=0·578). There were time (P<0·01) and interaction (P<0·05) effects, but no trial effect (P=0·079), for serum insulin concentrations. Insulin concentrations were lower at 0 h during ER compared with EB (P<0·05). Between −24 and 0 h, serum insulin concentrations decreased during ER (P<0·01), but did not change during EB (P=0·178). There were time (P<0·01), trial (P<0·05) and interaction (P<0·05) effects for HOMA2-IR, which was lower at 0 h during ER compared with EB (P<0·05) and decreased between −24 and 0 h during ER (P<0·01), but did not change during EB (P=0·303; Fig. 1).
Bar chart (a) represents mean homoeostatic model assessment of insulin resistance (HOMA2-IR) values calculated from overnight fasting serum glucose and insulin concentrations before (−24 h) and after (0 h) consumption of a 24-h energy-balanced (EB; ![]() ) or energy-restricted (ER;
) or energy-restricted (ER; ![]() ) diet. Values are means, with standard deviations represented by vertical bars. Line graph (b) shows individual HOMA2-IR values at 0 h during EB (
) diet. Values are means, with standard deviations represented by vertical bars. Line graph (b) shows individual HOMA2-IR values at 0 h during EB (![]() ) and ER (
) and ER (![]() ). * Values were significantly different from EB at 0 h (P<0·05). † Values were significantly different from −24 h during ER (P<0·05).
). * Values were significantly different from EB at 0 h (P<0·05). † Values were significantly different from −24 h during ER (P<0·05).
Blood variables after 24-h energy-balance (EB) (100 % estimated energy requirements (EER); EB) or severely energy-restricted diet (25 % EER; energy restriction (ER)) (Mean values and standard deviations)
GLP-1, glucagon-like peptide-1; GIP, glucose-dependent insulinotropic peptide; FGF21, fibroblast growth factor 21
* Values are significantly different from −24 h during the corresponding trial (P<0·05).
† Values were significantly different from EB (P<0·05).
There were time (P<0·0001), trial (P<0·05) and interaction (P<0·0001) effects for plasma NEFA concentrations. NEFA concentrations were greater at 0 h during ER compared with EB (P<0·0001). Between −24 and 0 h, plasma NEFA concentrations increased during ER (P<0·0001), but did not change during EB (P=0·166). There were no time (P=0·545), trial (P=0·227) or interaction (P=0·628) effects for plasma GLP-1 concentrations. There was a time effect (P<0·01), but no trial (P=0·088) or interaction (P=0·096) effects, for plasma GIP concentrations. GIP concentrations decreased between −24 and 0 h during ER (P<0·05) and tended to decrease during EB (P=0·055). There was a time effect (P<0·0001), but no trial (P=0·776) or interaction (P=0·098) effects, for FGF21 concentrations. Plasma FGF21 concentrations decreased between −24 and 0 h during ER (P<0·0001) and EB (P<0·01).
Postprandial metabolic responses
Glucose, insulin and NEFA
There were time (P<0·0001), trial (P<0·01) and interaction (P<0·0001) effects for serum glucose concentrations, with lower concentrations at 0 h and greater concentrations between 0·75 and 1 h (P<0·05; Fig. 2a) during ER compared with EB. Serum glucose iAUC (EB: 96 (sd 74) mmol/l per 2 h; ER: 171 (sd 102) mmol/l per 2 h; P<0·001; Fig. 2b) and tAUC (EB: 692 (sd 101) mmol/l per 2 h; ER: 757 (sd 107) mmol/l per 2 h; P<0·001; Fig. 2b) were greater during ER than during EB, and there was a trend for greater peak glucose concentrations during ER (EB: 7·93 (sd 1·52) mmol/l; ER: 8·44 (sd 1·46) mmol/l; P=0·073). Glucose time-to-peak was delayed during ER compared with EB.
Serum glucose (a) and insulin (c) concentrations during a 2-h oral glucose tolerance test (OGTT) conducted after consumption of a 24-h energy-balanced (EB; ![]() ) or energy-restricted (ER;
) or energy-restricted (ER; ![]() ) diet. Bar charts represent serum glucose (b) and insulin (d) incremental AUC (iAUC) and total AUC (tAUC) during the OGTT (0–2 h) for EB (
) diet. Bar charts represent serum glucose (b) and insulin (d) incremental AUC (iAUC) and total AUC (tAUC) during the OGTT (0–2 h) for EB (![]() ) and ER (
) and ER (![]() ). Values are means, with standard deviations represented by vertical bars. * iAUC values were significantly different from EB (P<0·05). † tAUC values were significantly different from EB (P<0·05).
). Values are means, with standard deviations represented by vertical bars. * iAUC values were significantly different from EB (P<0·05). † tAUC values were significantly different from EB (P<0·05).
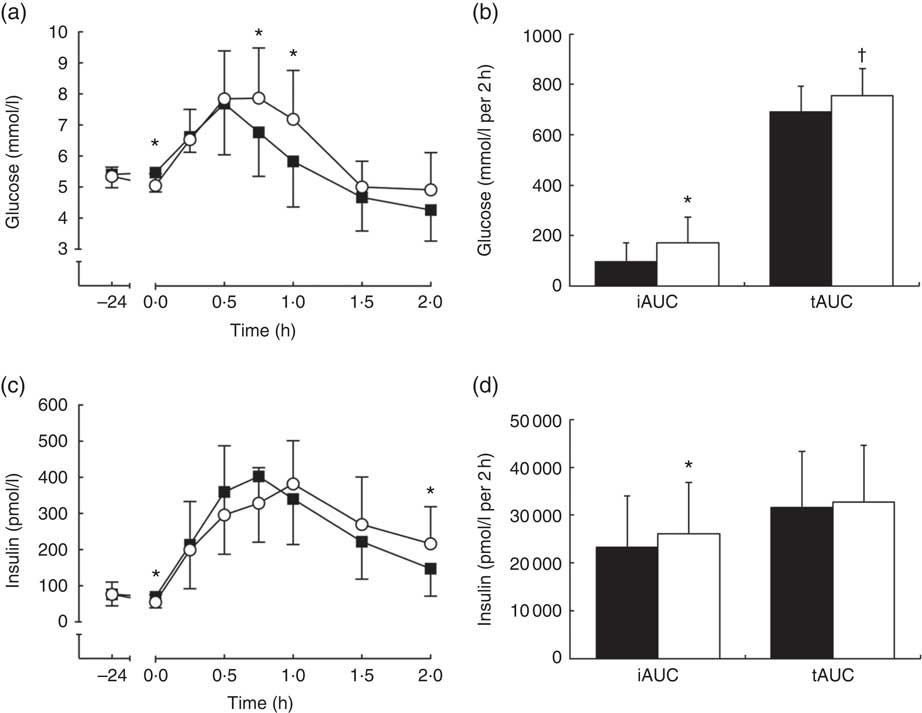
There was no trial effect (P=0·920), but there were time (P<0·0001) and interaction (P<0·001) effects for serum insulin concentrations, with greater insulin concentrations at 2 h during ER compared with EB (P<0·05; Fig. 2c). Serum insulin iAUC was greater during ER than EB (EB: 23 335 (sd 10 964) pmol/l per 2 h; ER: 26 094 (sd 10 807) pmol/l per 2 h; P<0·05; Fig. 2d), but tAUC was not different between trials (EB: 31 678 (sd 11 598) pmol/l per 2 h; ER: 32 685 (sd 11 987) pmol/l per 2 h; P=0·487; Fig. 2d). There were no differences between trials for peak serum insulin concentrations (EB: 452 (sd 168) pmol/l; ER: 433 (sd 163) pmol/l; P=0·564) but time-to-peak was delayed during ER compared with EB.
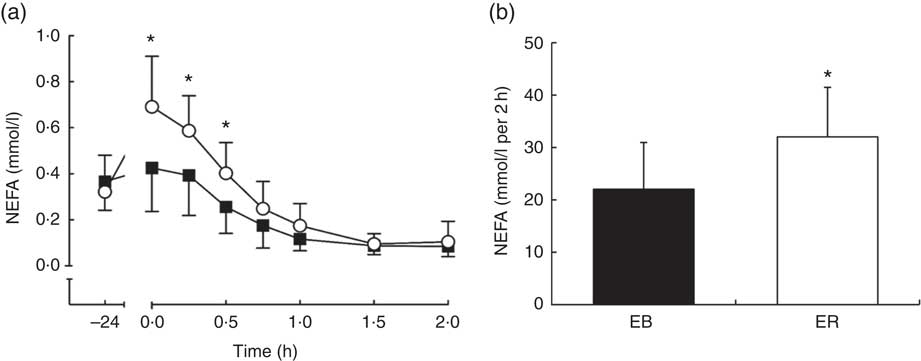
There were time (P<0·0001), trial (P<0·01) and interaction (P<0·0001) effects for plasma NEFA concentrations, with greater plasma NEFA concentrations between 0 and 0·5 h during ER compared with EB (P<0·01; Fig. 3a). Plasma NEFA tAUC was 45 % greater during ER compared with EB (EB: 22·06 (sd 9·00) mmol/l per 2 h; ER: 32·09 (sd 9·44) mmol/l per 2 h; P<0·01; Fig. 3b).
Plasma NEFA (a) concentrations during a 2-h oral glucose tolerance test (OGTT) conducted after consumption of a 24-h energy-balanced (EB; ![]() ) or energy-restricted (ER;
) or energy-restricted (ER; ![]() ) diet. Bar chart represents plasma NEFA (b) total AUC during the OGTT (0–2 h) for EB (
) diet. Bar chart represents plasma NEFA (b) total AUC during the OGTT (0–2 h) for EB (![]() ) and ER (
) and ER (![]() ). Values are means, with standard deviations represented by vertical bars. * Values were significantly different from EB (P<0·05).
). Values are means, with standard deviations represented by vertical bars. * Values were significantly different from EB (P<0·05).
Serum glucose iAUC and pre-OGTT (0 h) plasma NEFA concentrations tended to be positively correlated (r 0·472; P=0·089), but serum glucose iAUC did not correlate with NEFA tAUC (r −0·049; P=0·868). Serum glucose tAUC did not correlate with either plasma NEFA tAUC (r 0·112; P=0·703) or pre-OGTT plasma NEFA concentrations (r 0·326; P=0·255).
Matsuda index
The Matsuda index of insulin sensitivity was not different between trials (EB: 7·50 (sd 4·75); ER: 7·93 (sd 5·06), P=0·603).
Glucagon-like peptide 1 and glucose-dependent insulinotropic peptide
There was a time effect (P<0·05), but no trial (P=0·219) or interaction (P=0·055) effects, for plasma GLP-1 concentrations. GLP-1 tAUC was not different between trials (EB: 3207 (sd 1321) pmol/l per 2 h; ER: 4123 (sd 3203) pmol/l per 2 h; P=0·155; Fig. 4b).
Plasma glucagon-like peptide-1 (GLP-1) (a) and glucose-dependent insulinotropic peptide (GIP) (c) concentrations during a 2-h oral glucose tolerance test (OGTT) conducted after consumption of a 24-h energy-balanced (EB; ![]() ) or energy-restricted (ER;
) or energy-restricted (ER; ![]() ) diet. Bar charts represent plasma GLP-1 (b) and GIP (d) total AUC during the OGTT (0–2 h) for EB (
) diet. Bar charts represent plasma GLP-1 (b) and GIP (d) total AUC during the OGTT (0–2 h) for EB (![]() ) and ER (
) and ER (![]() ). Values are means, with standard deviations represented by vertical bars.
). Values are means, with standard deviations represented by vertical bars.
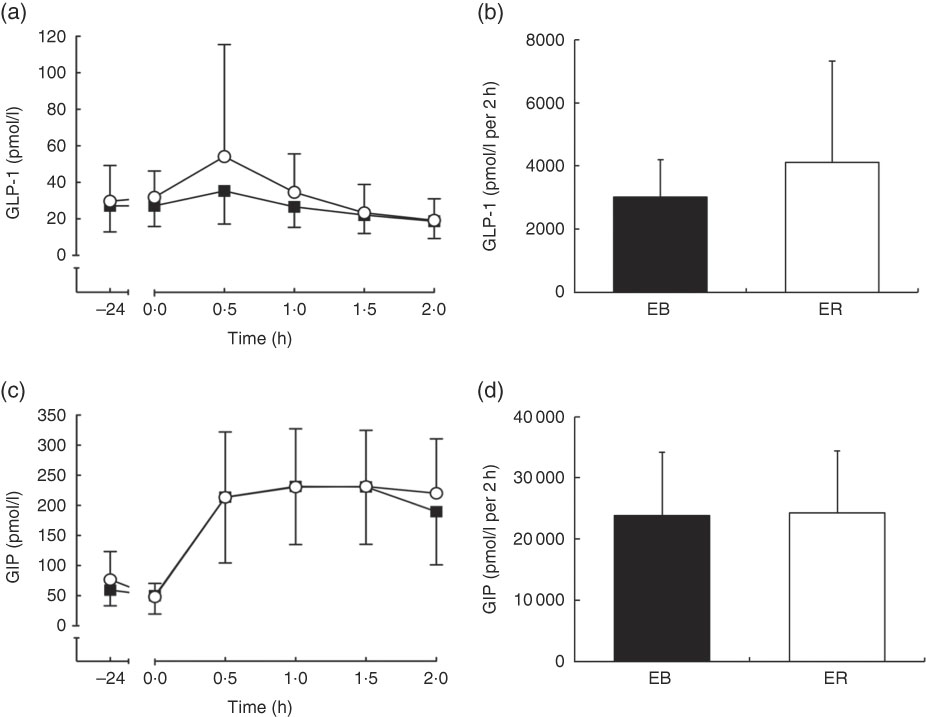
There was a time effect (P<0·0001), but no trial (P=0·473) or interaction (P=0·150) effects, for plasma GIP concentrations. GIP tAUC was not different between trials (EB: 23 874 (sd 10 283) pmol/l per 2 h; ER: 24 287 (sd 10 143) pmol/l per 2 h; P=0·698; Fig. 4d).
Fibroblast growth factor 21
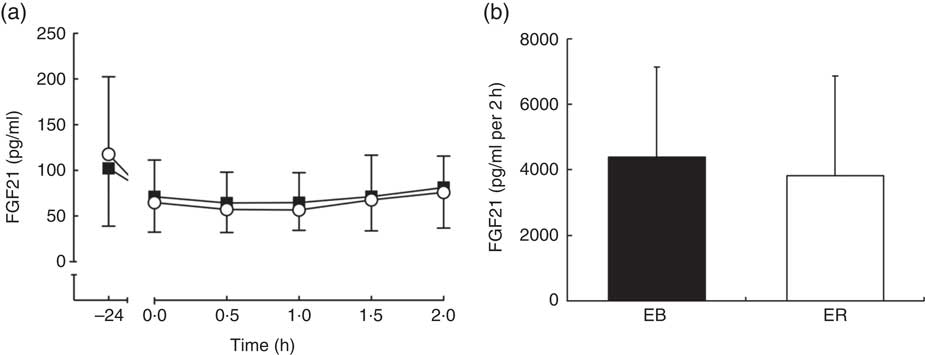
There was a time effect (P<0·01), but no trial (P=0·513) or interaction (P=0·763) effects, for plasma FGF21 concentrations. FGF21 tAUC was not different between trials (EB: 8000 (sd 4038) pg/ml per 2 h; ER: 7553 (sd 5171) pg/ml per 2 h; P=0·511; Fig. 5).
Plasma fibroblast growth factor 21 (FGF21) (a) concentrations during a 2-h oral glucose tolerance test (OGTT) conducted after consumption of a 24-h energy-balanced (EB; ![]() ) or energy-restricted (ER;
) or energy-restricted (ER; ![]() ) diet. Bar chart represents plasma FGF21 (b) total AUC during the OGTT (0–2 h) for EB (
) diet. Bar chart represents plasma FGF21 (b) total AUC during the OGTT (0–2 h) for EB (![]() ) and ER (
) and ER (![]() ). Values are means, with standard deviations represented by vertical bars.
). Values are means, with standard deviations represented by vertical bars.
Discussion
The aim of this study was to determine the acute effects of 24-h severe ER on indices of insulin sensitivity. The results demonstrate that postprandial glycaemic control is impaired, despite a reduction in HOMA2-IR after 24-h severe ER. These findings may have implications for the efficacy of IER diets, particularly for weight maintenance, where weight-loss-related improvements in insulin sensitivity might not be anticipated.
Undergoing short periods of severe ER (consuming approximately 25 % of EER) is a requisite component of an IER diet, and has been shown to be an effective method of reducing daily energy intake in lean( Reference O’Connor, Scisco and Smith 9 , Reference Clayton, Burrell and Mynott 11 ) and overweight/obese( Reference Clayton, Creese and Skidmore 10 , Reference Antoni, Johnston and Collins 14 ) populations. Recent evidence suggests that 3–12 weeks of IER can cause significant weight and fat mass losses, comparable to that achieved with moderate daily ER of similar duration( Reference Seimon, Roekenes and Zibellini 8 ). Importantly, several studies have reported improvements in fasting insulin sensitivity indexes after 4–6 months of IER( Reference Harvie, Wright and Pegington 6 , Reference Harvie, Pegington and Mattson 23 ). In the current study, HOMA2-IR decreased 23 % after 24 h of severe ER compared with an adequate energy intake control trial (EB). However, in response to an oral glucose challenge, serum glucose tAUC was approximately 9 % greater (iAUC was approximately 78 % greater) and serum insulin iAUC was approximately 12 % greater during ER compared with EB. In addition, peak serum glucose concentration was 6 % greater and serum glucose remained elevated for longer, during ER. These data suggest that glycaemic control was impaired after a single 24-h period of severe ER in a group of young, lean men.
These results could be explained by a simple alteration in substrate availability. A short period of severe ER may deplete hepatic glycogen stores and reduce endogenous glucose production( Reference Nilsson and Hultman 24 ). Consequently, circulating glucose and insulin are also reduced( Reference Rothman, Magnusson and Katz 25 ). As HOMA2-IR is a product of fasting glucose and insulin concentrations, these acute metabolic changes that occur with severe ER limit the validity of HOMA2-IR to assess insulin sensitivity in this context. The reduction observed in this and similar studies may reflect a reduced requirement for insulin secretion, rather than an improvement in insulin sensitivity per se. Similarly, despite increases in fed-state serum glucose and insulin concentrations during the OGTT, the composite Matsuda index of insulin sensitivity was unaffected by ER. This may be owing to the incorporation of fasting glucose and insulin concentrations in the calculation of the index( Reference Johnson, Stannard and Rowlands 26 , Reference Lagerpusch, Bosy-Westphal and Kehden 27 ).
When exogenous glucose availability is low, insulin concentrations are also low, stimulating lipolysis to mobilise TAG for oxidation( Reference Maughan, Fallah and Coyle 28 ). As evidenced in the current study, this leads to an increase in plasma NEFA concentrations, and previous studies, utilising a very similar ER protocol, have also reported an increase in fat oxidation and a concomitant decrease in carbohydrate oxidation in both the fasted and postprandial state( Reference Clayton, Creese and Skidmore 10 , Reference Clayton, Burrell and Mynott 11 , Reference Antoni, Johnston and Collins 14 ). A consequence of increased fat oxidation is the accumulation of acetyl-CoA, NADH and citrate, which can inhibit both upstream (via inhibition of phosphofructo-kinase) and downstream (via inhibition of GLUT4 translocation and pyruvate dehydrogenase (PDH)) glycolysis( Reference Hue and Taegtmeyer 29 ). Elevated plasma NEFA concentrations have also been postulated to cause mitochondrial overload, resulting in incomplete fatty acid oxidation and the accumulation of toxic fatty acid intermediates, such as diacylglycerol and ceramide, which may impair insulin signalling( Reference Koves, Ussher and Noland 30 ). However, impairments in skeletal muscle insulin signalling are not a prerequisite for reduced muscle glucose uptake, and rapid impairments in the ability to process exogenous (ingested or infused) glucose might be explained by reduced glycolytic flux/oxidative disposal. For example, Lundsgaard et al. ( Reference Lundsgaard, Sjøberg and Høeg 31 ) reported that 3 d of overfeeding with carbohydrate increased leg glucose uptake during a hyperinsulinaemic–euglycaemic clamp, whereas 3 d of high-fat overfeeding reduced glucose uptake despite normal insulin signalling. It was suggested that greater TCA influx from β-oxidation-derived acetyl-CoA might explain the reduced glucose uptake in the absence of changes in insulin signalling. Evidence for this was provided by the observations that high-fat diet adherence led to a significant decrease in total PDH-E1α protein content (the enzyme responsible for catalysing the conversion of pyruvate to acetyl-CoA), as well as increased Ser300 phosphorylation (i.e. reduced PDH activity) and increased glucose-6-phosphate accumulation( Reference Lundsgaard, Sjøberg and Høeg 31 ). Hence, in the context of the current study, elevated NEFA (a surrogate for increased lipolysis and greater dependency upon fat oxidation) likely decreased glucose uptake/oxidation by a similar mechanism.
Several findings from the current study are analogous to a similar study that investigated the effects of 24-h severe ER in overweight and obese subjects( Reference Antoni, Johnston and Collins 14 ). Postprandial insulin iAUC was greater after severe ER in the current study, a finding that differs from Antoni et al.( Reference Antoni, Johnston and Collins 14 ), but average time to peak insulin concentration appeared to be delayed after severe ER in both studies, suggesting an impaired early-phase insulin response. Early-phase insulin has been shown to more potently lower blood glucose concentrations compared with late-phase insulin( Reference Kahn, Montgomery and Howell 32 ). This might therefore explain the greater peak glucose concentrations observed after severe ER in the current study and in the study by Antoni et al. ( Reference Antoni, Johnston and Collins 14 ). Together, these findings demonstrate that 24-h severe ER impairs glycaemic control in both lean (current study) and overweight/obese( Reference Antoni, Johnston and Collins 14 ) subjects, with both studies indicating that early-phase insulin response may be a casual factor.
This response is similar to the ‘second meal effect’, which describes an improved glycaemic response to a meal after consumption of glucose at a prior eating occasion( Reference Gonzalez 33 ). It is thought that the impairment in early-phase insulin response observed with the ‘second meal effect’ is mediated by prolonged exposure of the pancreatic islet cells to elevated NEFA concentrations, shown in vitro to inhibit insulin secretion( Reference Grill and Ovigstad 34 ). Although this cannot be determined in the present study, plasma NEFA concentrations were greater before the OGTT during ER, indicating that plasma NEFA concentrations were also probably greater during ER in the previous 24 h. This would suggest that pancreatic islet cells were exposed to prolonged elevated plasma NEFA concentrations during ER, possibly leading to impaired early-phase response to the glucose load. This is partially supported by a tendency for a positive correlation between pre-OGTT plasma NEFA concentrations and serum glucose iAUC, and an apparent delay in time-to-peak insulin concentration during ER.
It is interesting to note that, despite several studies demonstrating an impairment in glycaemic control after severe ER at rest, a recent study found that restricting carbohydrate intake after evening exercise improved postprandial glycaemic control the following morning, compared with when carbohydrate was consumed in a quantity equal to that expended during exercise (90 min running at 70 % VO2max)( Reference Taylor, Wu and Chen 35 ). This is quite different from the present and previous studies, which have restricted total energy intake during periods of minimal physical activity. Under such conditions, ER will have little influence on muscle glycogen content (the primary site of insulin-mediated glucose disposal). It also demonstrates that the so-called (acute) insulin-sensitising effect of exercise centres on creating a ‘sink’ for glucose disposal. Further investigation is certainly necessary in this field as both exercise and dietary restriction are important components of successful weight management strategies( Reference Franz, VanWorner and Crain 36 ).
There are several biological mechanisms involved in the regulation of energy homoeostasis. GLP-1 and GIP are incretin hormones secreted rapidly from the intestine in response to food ingestion( Reference Baggio and Drucker 37 ). These hormones respond before nutrient absorption, and stimulate the secretion of insulin from the pancreas to assist with the disposal of glucose from the blood( Reference Baggio and Drucker 37 ). In the current study, although GIP was elevated after consumption of the glucose solution in both trials, severe ER did not appear to differentially affect circulating incretin hormone concentrations, compared with an EB control trial. Plasma GLP-1 and GIP concentrations were similarly unaffected by short-term (7 d) high-fat (65 % of energy) overfeeding (approximately 150 % EER), despite subjects in this study also exhibiting impaired postprandial glycaemic control( Reference Parry, Smith and Corbett 38 ). It should be noted that total GLP-1 and GIP were assessed in the current study and in the study by Parry et al. ( Reference Parry, Smith and Corbett 38 ), as opposed to the biologically active (GLP-17–36; GIP1–42) form. However, assessing total GLP-1/GIP is considered appropriate for estimating the secretion of active GLP-1/GIP from the intestine( Reference Kuhre, Wewer Albrechtsen and Hartmann 39 ). Nonetheless, these studies suggest that incretin hormones are resistant to short-term fluctuation in EB and are unlikely to be involved in acute impairments in glycaemic regulation in these settings.
FGF21 is a novel hepatokine secreted in response to fasting and feeding cycles( Reference Laegar, Henagan and Albarado 40 ), which positively correlates with obesity, type 2 diabetes, insulin resistance and impaired glucose tolerance in humans( Reference Chavez, Molina-Carrion and Abdul-Ghani 41 , Reference Li, Yang and Ning 42 ). FGF21 is thought to be involved in coordinating the adaptive response to ER via several mechanisms, such as encouraging ketosis, lowering blood glucose, increasing insulin sensitivity and potentially modulating appetite regulation via the agouti-related peptide and neuropeptide Y pathways( Reference Kharitonenkov and Larsen 43 ). It should be noted that most studies that have found a physiological effect of ER on FGF21 have been rodent studies, with FGF21 concentrations shown to increase rapidly (within 6 h) after the onset of fasting( Reference Kharitonenkov, Shiyanova and Koester 44 ). In contrast, human studies have observed no change in fasting or postprandial (OGTT) plasma FGF21 concentration after 16 h of fasting( Reference Dushay, Chui and Gopalakrishnan 45 ), and one study found that it may take 7–10 d of fasting to elicit an increase in FGF21 in humans( Reference Fazeli, Lun and Kim 46 ). In line with this, the current study found no effect of 24-h severe ER on fasting or postprandial plasma FGF21 concentrations. This strengthens evidence that nutritional regulation of FGF21 differs between rodents and humans( Reference Dushay, Chui and Gopalakrishnan 45 ).
Although the exact mechanism of metabolic dysregulation may be elusive at present, results from several acute studies now indicate that a short period of severe ER leads to a subsequent period of impaired glycaemic control( Reference O’Connor, Scisco and Smith 9 , Reference Clayton, Burrell and Mynott 11 , Reference Antoni, Johnston and Collins 14 ). The clinical significance of these findings cannot be extrapolated from these acute studies, but oscillating postprandial glucose concentrations are thought to directly contribute to the development of CVD( Reference Ceriello, Esposito and Piconi 47 ), and a delay in the postprandial glucose curve is associated with impairments in β-cell function and insulin secretion( Reference Kramer, Choi and Zinman 48 ). Whether these acute impairments in glycaemic control are improved or exacerbated with multiple restriction and refeeding cycles is not fully known. The only available data on long-term IER are from a rodent study, which found that 32 weeks of intermittent fasting and refeeding promoted redox imbalance, oxidative modification of insulin receptors and a progressive decline in glucose tolerance, despite an initial improvement in glucose tolerance after 4 weeks( Reference Cerqueira, da Cunha and Caldeira da Silva 49 ). These data suggest that irregular feeding patterns leading to increased exposure to elevated blood glucose concentrations may have the potential to impair insulin-mediated glucose uptake.
Future studies should investigate the long-term effects of an IER diet on glycaemic control in humans, including the dynamic assessment of glucose uptake and oxidation, as alterations may not be evident in the fasted state( Reference Antoni, Johnston and Collins 16 ). A recent study( Reference Antoni, Johnston and Collins 50 ) compared the effects of achieving approximately 5 % weight loss via IER (consuming approximately 25 % EER on two consecutive days, with a self-selected adequate-energy diet on the remaining 5 d of the week) or continuous ER (consuming 2510 kJ below EER for 7 d of the week), in a group of overweight/obese subjects. Fasted variables showed no difference between the dieting methods; however, postprandial insulin sensitivity markers revealed a significant reduction in C-peptide after IER, whereas C-peptide was unaltered after continuous ER( Reference Antoni, Johnston and Collins 50 ). C-peptide is secreted in equimolar amounts to insulin, but undergoes minimal extraction at the liver and thus may be a more robust measure of insulin secretion than circulating insulin concentrations( Reference Castillo, Scheen and Letiexhe 51 ). This change in C-peptide did not appear to influence postprandial glycaemic control, and comparable reductions in postprandial insulin concentrations were observed with both diets. However, this finding does indicate differences in mechanisms of action between IER and continuous ER, potentially suggesting that IER may improve insulin sensitivity to a greater extent than continuous ER after semi-chronic (approximately 2 months) adherence. This warrants further investigation, as does identifying the effects of long-term IER in the absence of weight loss. This will be crucial for determining whether IER can be used as an effective weight maintenance strategy, with this being an important target for reducing rates of obesity-related co-morbidities in the future( Reference Ostbye, Malhotra and Landerman 3 ).
In conclusion, this study has demonstrated that 24-h severe ER leads to impaired postprandial glycaemic control, which cannot be detected in the fasted state. These findings have implications for IER diets and demonstrate the need for future studies to identify the accumulative impact of repeated episodes of short-term severe ER on glycaemic control in lean individuals.
Acknowledgements
This research was supported by the NIHR Leicester Biomedical Research Centre. The views expressed in this publication are those of the authors and not necessarily those of the NHS, the National Institute for Health Research or the Department of Health.
The authors’ contributions are as follows: D. J. C., L. J. J. and C. J. H. conceived and designed the study. Data collection was performed by D. J. C., T. M. and J. B., with assistance from L. J. J. Analysis was conducted by D. J. C., with assistance from J. A. S. and M. P. F. The manuscript was prepared by D. J. C., L. J. J. and C. J. H., with assistance from D. J. S., J. A. K. and J. A. S. All authors read and approved the manuscript.
The authors declare that there are no conflicts of interest.


