


The population of pancreatic β-cells is dynamic and susceptible to compensatory changes in glucose levels within a narrow range. β-Cell mass is determined by the balance between mechanisms that increase (hypertrophy, proliferation, neogenesis and transdifferentiation) and reduce (atrophy, apoptosis, necrosis and autophagy) the number and size of β-cells(Reference Genevay, Pontes and Meda1–Reference Bonner-Weir3). The proliferation of adult β-cells is slow under basal physiological conditions(Reference Teta, Long and Wartschow4,Reference Pearl, Kushner and Buchholz5) . Neogenesis, which is the differentiation of new islet cells in the ductal epithelium, was observed during normal postnatal development(Reference Finegood, Scaglia and Bonner-Weir6). The transdifferentiation of α-cells into β-cells occurs after extreme β-cell depletion(Reference Thorel and Herrera7). Apoptosis is the major cause of β-cell death in animal models of diabetes and when islets or β-cells are exposed to various pathophysiological situations(Reference Butler, Meier and Butler8).
Adaptive and dynamic plasticity of β-cells is observed under various pathological and physiological conditions. The strongest physiological stimulus that induces β-cell plasticity is gestation(Reference Parsons, Brelje and Sorenson9–Reference Butler, Cao-Minh and Galasso11). In rodents, the peak of β-cell mass expansion occurs on 14th day of gestation(Reference Parsons, Brelje and Sorenson9,Reference Rieck and Kaestner12) through a combination of increased β-cell replication and β-cell hypertrophy as well as a reduced β-cell apoptosis. On the 20th day of gestation, a reduction in β-cell proliferation and an initial increase in β-cell apoptosis are observed(Reference Rieck and Kaestner12). Protein restriction during fetal and neonatal development produces major structural changes in the size, shape and composition of islets, which are maintained after nutritional recovery(Reference Berney, Desai and Palmer13). This background reflects reduced β-cell proliferation and increased β-cell apoptosis(Reference Petrik, Reusens and Arany14).
During gestation, the functional β-cell mass normally compensates for the increased demand for insulin. Hence, the balance between β-cell growth and loss must be tightly regulated. However, if this equilibrium is disrupted, then compensation by β-cells can fail, favouring the emergence of gestational diabetes.
Studies of the human pancreas are difficult and limited for obvious reasons. Both humans and rodents show similar β-cell adaptation during gestation, and studies with rodent models can be applicable to human disease. Thus, we evaluated whether early life protein restriction alters structural parameters that can affect β-cell mass in the first two-thirds of gestation (15th day) and at the end (20th day) of gestation.
Materials and methods
Animals and diets
The experimental procedures involving Wistar rats were performed according to the guidelines of the National Council for Control of Animal Experimentation and approved by the Ethics Committee of the Universidade Federal de Mato Grosso (protocol number 23108.015308/14-1). Male and virgin female Wistar rats (85–90 d old) were obtained from the university breeding colony. For mating, animals were housed in cages during the night at a ratio of one male to four females, and gestation was confirmed by the examination of vaginal smears for the presence of sperm. Pregnant rats were randomly separated and maintained from the first day of gestation until the end of lactation on isoenergetic diets containing either 6 % protein (low protein (LP) diet) or 17 % protein (control (C) diet, as described previously(Reference Milanski, Arantes and Ferreira15)). During the experimental period, rats had free access to food and water and were housed at 22°C under a 12-h light/12-h dark cycle. Throughout gestation, rats were housed alone in a cage. Spontaneous delivery occurred on day 22 of gestation, and large litters were subsequently reduced to eight pups when they were 3 d of age to ensure a standard litter size per mother. At 28 d, the offspring were weaned and randomly separated into three groups: C, offspring born to and suckled by mothers fed a C diet that were subsequently fed the same diet after weaning; LP, offspring of mothers fed an LP diet and subsequently fed the same diet after weaning and R, offspring of mothers that were first fed an LP diet and then fed a C diet after weaning. In this phase, rats were maintained in collective cages (three or four rats/cage). At 90 d old, pairing was performed using male rats that were not subjected to the experimental diets from the university breeding colony. The control non-pregnant (CNP), control pregnant (CP), recovered non-pregnant (RNP) and recovered pregnant (RP) groups were fed a C diet, whereas the low-protein non-pregnant (LPNP) and low-protein pregnant (LPP) groups were maintained on an LP diet. β-Cell proliferation in rats with normal gestation reaches a maximum at 15 d and subsequently markedly decreases as they approach term(Reference Sorenson and Brelje16,Reference Kawai and Kishi17) , and β-cell apoptosis occurs at the end of gestation(Reference Rieck and Kaestner12). Thus, one group of rats was maintained on the dietary regimen for 15 d, and another group was maintained on the dietary regimen for 20 d of gestation (Diagram 1). Food intake was recorded three times/week during the treatment period. A preweighed diet was provided, and after 48 h, rats were briefly removed from their cages and weighed. The amount of food remaining, including any food on the bottom of the cages, was recorded. Intake was calculated as the weight (in g) of diet provided minus the food that was recovered. Body weight was recorded once per week, and body weight gain was calculated as the difference between the initial and final body weights during gestation.
Experimental flow chart: before mating, male and virgin female Wistar rats were maintained on commercial chow (Labina®). During gestation and lactation, dams were maintained on control (C – 17 % protein) or low-protein (LP – 6 % protein) diets. At 28 d, offspring were weaned and randomly separated into the C group, which was fed the C diet; the LP group, which was fed the LP diet and the R group, which was fed the C diet. At 90 d of age, pairing was performed, and the CNP and CP groups as well as the RNP and RP groups were fed a C diet, whereas the LPNP and LPP groups were maintained on an LP diet. Experimental procedures were performed at 15 and 20 d of gestation.

After undergoing oral glucose tolerance tests, the rats were euthanised. Initially, rats were narcotised in a CO2 chamber and euthanised by decapitation. For histology, the pancreas from four rats per group (pregnant and non-pregnant) was used in each phase (15 and 20 d of gestation). The pancreas was removed, dissected and weighed for morphometry and immunohistochemical analysis. To evaluate insulin secretion and mRNA transcription of anti- and pro-apoptotic genes, the pancreas of four rats was removed and digested with collagenase. All experiments were performed in the morning. Since the evaluation of all variables in the same animal was not possible, the number of individual experiments varied among the groups but was representative of at least three different litters.
The primary experimental outcomes were assessed with morphometry and immunohistochemical analysis, and the secondary outcomes were insulin secretion, the insulin sensitivity index composite (ISI composite) and mRNA transcription of anti- and pro-apoptotic genes.
Oral glucose tolerance test
After the 12-h fasting period, a glucose load (200 g/l) was orally administered to six conscious rats/group at a dosage of 2 g/kg body weight. Blood samples were obtained from the cut tip of the tail at 0, 15, 30, 60 and 120 min postadministration for determination of the blood glucose concentrations (Accu-Chek portable glucose metre, Roche Diagnostics), and serum insulin levels were determined using a radioimmunoassay(Reference Scott, Atwater and Rojas18). The ISI composite was calculated using the following formula: 10 000/√(fasting glucose × fasting insulin × mean glucose during the oral glucose tolerance test × mean insulin during the oral glucose tolerance test)(Reference Matsuda and DeFronzo19). Some animals were not used for the determination of the ISI composite due to the impossibility of obtaining blood samples at all necessary times or because there was an insufficient amount of serum for the determination of insulin.
Isolation of pancreatic islets and determination of insulin secretion
The islets were isolated via collagenase digestion of the pancreas according to the method of Boschero et al. (Reference Boschero, Szpak-Glasman and Carneiro20). Groups of five islets of medium size were first incubated for 45 min at 37 °C in Krebs-bicarbonate buffer with the following composition: 115 mm NaCl, 5 mm KCl, 2·56 mm CaCl2, 1 mm MgCl2, 10 mm NaHCO3, 15 mm HEPES and 5·6 mm glucose supplemented with 3 g of bovine serum albumin/l and equilibrated with a mixture of 95 % O2–5 % CO2 to obtain a pH of 7·4. This medium was replaced with fresh buffer, and subsequently, the islets were further incubated for 2·0 h with glucose concentrations of 2·8 and 8·3 mm. Insulin release was measured by RIA using rat insulin as a standard(Reference Scott, Atwater and Rojas18).
RNA extraction and quantitative RT-PCR for apoptosis gene assessment
Total RNA from 300 islets obtained from four rats per group maintained on the dietary regimen for 15 d of gestation was extracted using TRIzol® (Invitrogen) after homogenisation for 1 min using a vortex mixer. After being cleared of debris by centrifugation at 6000 g, the total RNA was isolated according to the manufacturer’s guidelines and quantified using a spectrophotometer. Complementary DNA was prepared using 3 μg of total RNA and reverse transcriptase to transcribe the material into cDNA using a TaqMan mRNA reverse transcription kit (Applied Biosystems, reference no. 4368814). The primers used in the experiments were standard TaqMan primers (Applied Biosystems). Glyceraldehyde-3-phosphate dehydrogenase mRNA was used as an endogenous control (TaqMan Rodent glyceraldehyde-3-phosphate dehydrogenase Control Reagents, reference no. 4352338E). The analysed genes were Caspase 3 (GenBank: Rn 00563902_m1), Caspase 8 (GenBank: Rn00574069_m1), Bax (GenBank: Rn02532082_g1), Bcl-2 (GenBank; Rn 99999125_m1) and Bcl-xl (Rn 00437783_m1). RT-PCR was carried out in a StepOne PCR cycler (Applied Biosystems). The PCR conditions were 95 °C for 10 min, followed by 45 cycles at 95 °C for 10 s and 60 °C for 45 s. The real-time data were analysed using a Sequence Detector System 1.7 (Applied Biosystems). The relative quantitation of gene expression was performed by comparing the efficiency of the amplification of each gene of interest using the ΔCt method.
Histological processing
Four rats from each group were used for the histological studies. The pancreas was removed from rats, dissected, weighed and fixed in 4 % paraformaldehyde-PBS for 24 h. After fixation, the pancreas was dehydrated and embedded in paraffin, and sections (5-μm thick) were prepared and mounted onto glass slides (Precision Glass Line). Morphometric analyses of islets were performed on pancreatic tissue sections stained with haematoxylin and eosin using morphometric techniques in which the main observer was blinded to the group assignment. Twenty fields for each section were photographed, and the areas of the pancreas (x5) and islets (x40) were measured using an AxionScope A1 microscope (Carl Zeiss, G). Image capture and analysis were performed using AxionVision 4.8 software.
Immunohistochemistry
Tissue sections were deparaffinised and rehydrated through a series of ethanol solutions with different concentrations. After antigen retrieval at 94 °C for 20 min using citrate buffer (pH 6·0), the sections were blocked using 10 % normal goat serum and incubated with the appropriate primary antibody: polyclonal guinea pig anti-insulin antibody (Dako, Carpinteria; A0564; 1:50); polyclonal rabbit anti-glucagon antibody (Dako, Carpinteria; A0565; 1:75); monoclonal rat anti-Ki67 antibody (Dako, Carpinteria; M7248; 1:50); monoclonal mouse anti-PDX1 antibody (SC390782; 1:50) and polyclonal rabbit anti-caspase 3 (SC7148; 1:50). The sections were subsequently incubated with an appropriate secondary antibody (Alexa Fluor AF-555 goat anti-mouse IgG; Alexa Fluor AF-633 goat anti-guinea pig IgG or Alexa Fluor AF-488 goat anti-rabbit IgG; Thermo Fisher Scientific). 4′,6-Diamidine-2′-phenylindole dihydrochloride (DAPI) was used as a cell nucleus marker.
Propidium iodide (PI), a fluorescent dye that binds to nucleic acids, was used to identify morphologically altered nuclei (condensed or fragmented), which are indicative of cell death, as previously described(Reference Scaglia, Cahill and Finegood21). To this end, deparaffinised and rehydrated pancreas sections were incubated for 40 min in a dark humidified chamber in a solution of PI (20 μg/ml, Sigma) and ribonuclease A (100 μg/ml, Sigma). The labelled apoptotic nuclei of endocrine cells in the pancreas sections were counted in digitalised islet images.
To evaluate insulin-positive cells coexpressing glucagon, pancreatic sections were stained with anti-insulin and anti-glucagon antibodies using immunofluorescence staining.
To examine insulin-positive cells embedded within duct cells, double-immunofluorescence staining for duct cell-specific cytokeratin (monoclonal mouse anti-cytokeratin antibody clone AE1/AE3; Dako, Carpinteria; IR053), and insulin was performed.
Images were captured using an AxionScope A1 microscope (Carl Zeiss, G) at 40× magnification and subsequently analysed using AxionVisio 4.8 software. Image capture and analysis were performed by a blinded observer.
Definitions of the measured parameters
The number of islets is expressed as the count per mm2 of pancreas. For the analysis of the islet size distribution pattern, the median islet area for all groups and time points (15 and 20 d) was initially calculated. A strong positive asymmetry was observed for values of very large areas in relation to the median. Therefore, values considered extreme or ‘positive outliers’ were excluded for each animal. The criteria used to decide whether an observation was discrepant were as follows: values greater than (Q3 + 1·5 (Q3 − Q1)), where Q3 = third quartile (75th percentile of data) and Q1 = first quartile (25th percentile of data). For each animal, the percentiles were calculated, and extreme values were excluded. On average, 4·3 areas for each animal were excluded, and for the six groups and the two time points, 206 measurements were disregarded. After the exclusion of discrepant areas, χ 2 analysis was performed.
The relative α-cell and β-cell areas were determined by dividing the total area of insulin-positive or glucagon-positive cells in one islet by the total islet area multiplied by 100.
The α- and β-cell masses were calculated by multiplying the total cell volume (the sum of the entire α- or β-cell/total pancreas area) by the pancreas weight.
β-Cell and α-cell proliferations were assessed by dividing the total number of insulin- or glucagon- and Ki67-co-positive cells in one islet by the total number of insulin- or glucagon-positive cells.
The index of apoptotic cells was obtained by dividing the number of apoptotic nuclei labelled with PI in one islet by the total number of β-cells in the islet.
The balance between β-cell proliferation and apoptosis was expressed as Ki67-insulin/PI-positive β-cells.
To estimate β-cell neogenesis, the number of single β-cells incorporated into the duct epithelium and β-cell clusters (defined as a unit comprising three or fewer insulin-positive cells) or islets (defined as unit of four or more insulin-positive cells) in close contact with pancreatic ducts was quantified. The index of neogenesis was obtained by dividing the number of single β-cells, β-cell clusters or islets budding from pancreatic ducts by the total number of islets in a section.
The index of glucagon and insulin colocalisation was calculated as the number of insulin-positive cells coexpressing glucagon divided by the total number of cells expressing solely insulin in one islet.
Statistical analysis
The number of rats used was determined by the resource equation method(Reference Charan and Kantharia22). For all results, except the islet size distribution, data are presented as the means and standard deviations. For the islet data, n refers to the number of samples of medium collected from each group of five islets obtained from four rats. For morphometric, somatic, biochemical and hormonal variables, n refers to the number of rats. The body weights of newborn and weaned rats were analysed using a non-paired Student’s t test; body weight after the recovery phase was evaluated using one-way ANOVA; insulin secretion was evaluated using three-way ANOVA (nutritional status, physiological status and glucose concentration) and the islet size distribution was analysed using the χ 2 test. Other results were analysed using two-way ANOVA (nutritional status: control, recovered and low-protein; and physiological status: non-pregnant and pregnant). When necessary, these analyses were complemented by the least significant difference test to determine the significance of individual differences. Levene’s test for the homogeneity of variances was initially used to assess the fit of the data to the assumptions used for parametric analysis. To correct for the variance in terms of heterogeneity or non-normality, the data were subjected to BoxCox transformation(Reference Sokal and Rohlf23). The level of significance was set at P < 0·05. The data were analysed using the Statistica Software package (StatSoft).
Results
Newborn female rats from dams fed an LP diet exhibited similar body weights (Fig. 1(A)). By the 28th day of life, the body weight was significantly lower for LP pups than for C pups (P < 0·0001; Fig. 1(B)). At the end of the recovery phase, although the R group had a higher final body weight than the LP group, their weights were still significantly lower than those of the C group (P < 0·0001; Fig. 1(C)).
(A) Body weight at birth and (B) body weight at weaning of offspring from dams fed a control (C; n 48 offspring) or low-protein (LP; n 96 offspring) diet during pregnancy and lactation. (C) Body weight of rats exposed to a control (C; n 48 rats) or low-protein (LP = 47 rats) diet from the fetal stage until adulthood or rats that were protein-restricted during intra-uterine life and lactation but subsequently recovered after weaning (R = 44 rats). Values are means and standard deviations represented by vertical bars. * Mean value was significantly different from that of the C group (P < 0·0001) according to the non-paired Student’s t test. a,b,c Mean values with unlike letters were significantly different (P < 0·05; least significant difference test).

On the 15th day of gestation, the body weight gain was similar in the LPP and RP groups, and both groups exhibited a body weight gain that was significantly lower than that of the CP group (P < 0·0001) (Fig. 2(A)). The final body weight of the recovered groups was higher than that of the low-protein groups but lower than that of the control groups (F 2,30 = 110·27, P < 0·0001). Pregnant rats showed a higher final body weight than that of the non-pregnant rats, regardless of nutritional status (F 1,30 = 39·37, P < 0·0001) (Fig. 2(B)). Total food intake was higher in pregnant rats than that in non-pregnant rats. However, the total food intake of RP and CP rats was higher than that of LPP rats (P < 0·01 and P < 0·05, respectively) (Fig. 2(C)). LPP and RP rats showed basal serum glucose concentrations similar to those observed in the LPNP and RNP groups, respectively, whereas CP rats had higher basal glycaemia levels in relation to CNP rats (P < 0·02). Moreover, the basal glucose levels in RP and CP rats were higher than those in LPP rats (P < 0·01) (Fig. 2(D)). The basal insulin concentrations were lower in pregnant rats than that in non-pregnant rats (F 1,29 = 6·977, P < 0·02) (Fig. 2(E)). The ISI composite was lower in the recovered groups than that in the low-protein groups or control groups (F 2,21 = 4·97, P < 0·02) and higher in pregnant rats than that in non-pregnant rats, regardless of nutritional status (F 1,21 = 24·00, P < 0·0001) (Fig. 2(F)). On the 20th day of gestation, the body weight gains of the recovered groups were similar to those of the control groups, and the recovered rats had higher body weight gains than low-protein rats (F 1,30 = 142·29, P < 0·0001).
(A and G) Body weight gain (n 6 rats/group), (B and H) final body weight (n 6 rats/group), (C and I) total food intake (n 6 rats/group), (D and J) basal serum glucose concentrations (n 5–6 rats/group), (E and K) basal serum insulin concentrations (n 5–6 rats/group), (F and L) insulin sensitivity index (ISI) composite for non-pregnant or pregnant rats (n 3–5 rats/group) maintained on a control diet (CNP and CP), low-protein diet (LPNP and LPP) or recovered after weaning (RNP and RP) on the 15th and 20th days of pregnancy, respectively. a,b,c Mean values with unlike superscript letters were significantly different (P < 0·05; least significant difference test). A,B,C Mean values were significantly different among rats with different nutritional statuses (P < 0·05; two-way ANOVA). † Mean values were significantly different between groups with different physiological statuses (P < 0·05; two-way ANOVA).

The body weight gain of pregnant rats was higher than that of non-pregnant rats (F 1,30 = 142·29, P < 0·0001) (Fig. 2(G)). The final body weight was higher in recovered rats than that in low-protein rats but lower than that in control rats (F 2,30 = 103·26, P < 0·0001). Regardless of nutritional status, the final body weight was higher in pregnant rats than that in non-pregnant rats (F 1,30 = 30·60, P < 0·0001) (Fig. 2(H)), whereas the basal glucose concentrations were lower in pregnant rats than that in non-pregnant rats (F 1,29 = 6·09, P < 0·02) (Fig. 2(J)). Basal insulin concentrations were similar among groups (Fig. 2(K)). The total food intake was lower (Fig. 2(I)), whereas the ISI composite (Fig. 2(L)) was higher in the recovered and low-protein groups in relation to the control group (F 2,30 = 13·73, P < 0·0001 and F 2,20 = 8·04, P < 0·01, respectively). Gestation increased the total food intake and ISI composite in all groups (F 1,30 = 13·73, P < 0·0001; F 1,20 = 15·76, P < 0·001, respectively).
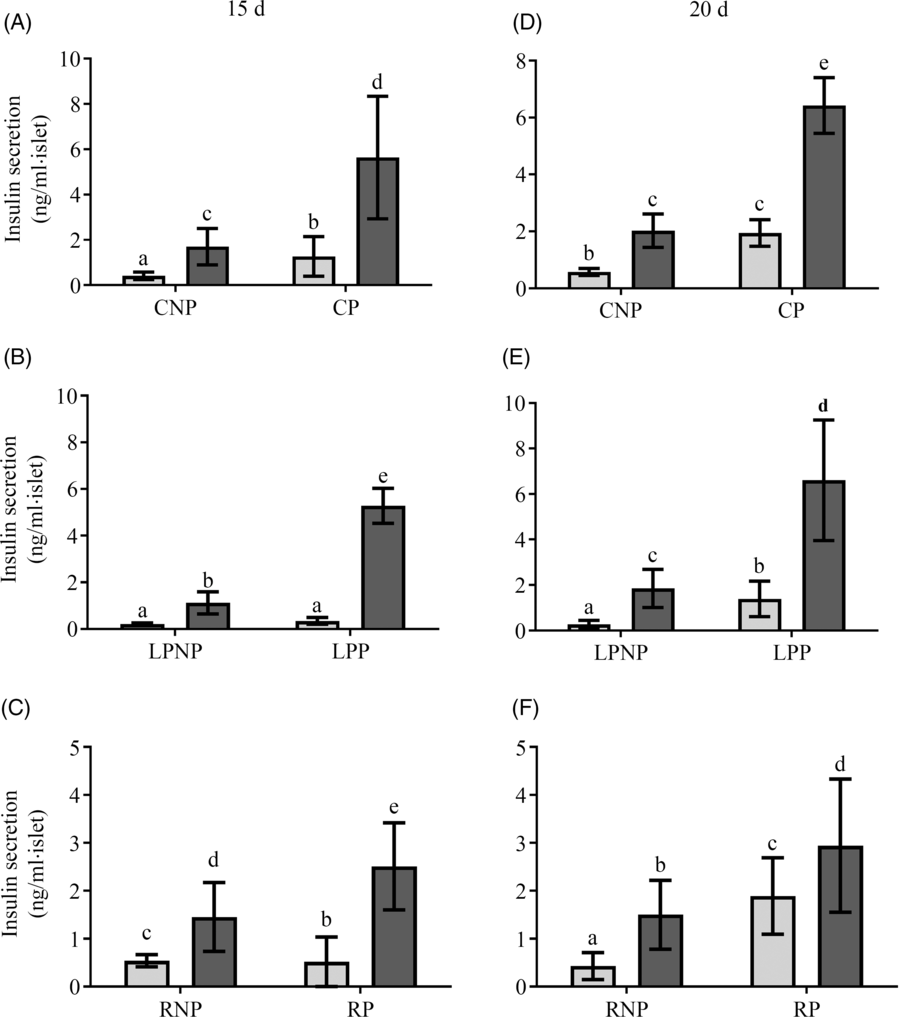
Fig. 3 shows insulin secretion by islets stimulated with low (2·8 mm) and physiological (8·3 mm) glucose concentrations. On the 15th day of gestation, insulin secretion in the presence of 2·8 mm glucose was similar in the RP and CP groups, and both groups had higher insulin secretion than the LPP group. In the presence of 8·3 mm glucose, insulin secretion was increased in islets from LPP (P < 0·0001) and CP rats (P < 0·0001) in relation to those in islets from the respective non-pregnant groups, whereas in the RP and RNP groups, insulin secretion was similar. Additionally, in response to 8·3 mm glucose, insulin secretion was higher than that observed in response to 2·8 mm glucose in the RP RP (P < 0·001), LPP (P < 0·0001) and CP (P < 0·0001) groups. However, insulin secretion in response to 8·3 mm glucose was lower in the RP and LPP groups than that in the CP group (P < 0·0001), (Fig. 3(A–C)). On the 20th day of gestation, insulin secretion in the presence of 2·8 mm glucose did not differ between RP and CP rats, and these groups had higher insulin secretion than the LPP group. In the presence of 8·3 mm glucose, insulin secretion was lower in RP and LPP rats than that in CP rats (P < 0·0001). In the RP and RNP groups (P < 0·05), LPP, LPNP, CP and CNP groups (P < 0·0001), 8·3 mm glucose elicited higher insulin secretion than 2·8 mm glucose (Fig. 3(D–F)).
Glucose stimulation of insulin secretion in islets from (A and D) control non-pregnant (CNP) and control pregnant (CP), (B and E) low-protein non-pregnant (LPNP) and low-protein pregnant (LPP) or (C and F) recovered non-pregnant (RNP) and recovered pregnant (RP) rats on the 15th and 20th days of pregnancy, respectively. Values are means and standard deviations, which are represented by vertical bars (n 6–9 groups of five islets). a–e Mean values within a vertical row with unlike letters were significantly different (P < 0·05; least significant difference test). ![]() , 2·8 mm;
, 2·8 mm; ![]() , 8·3 mm.
, 8·3 mm.
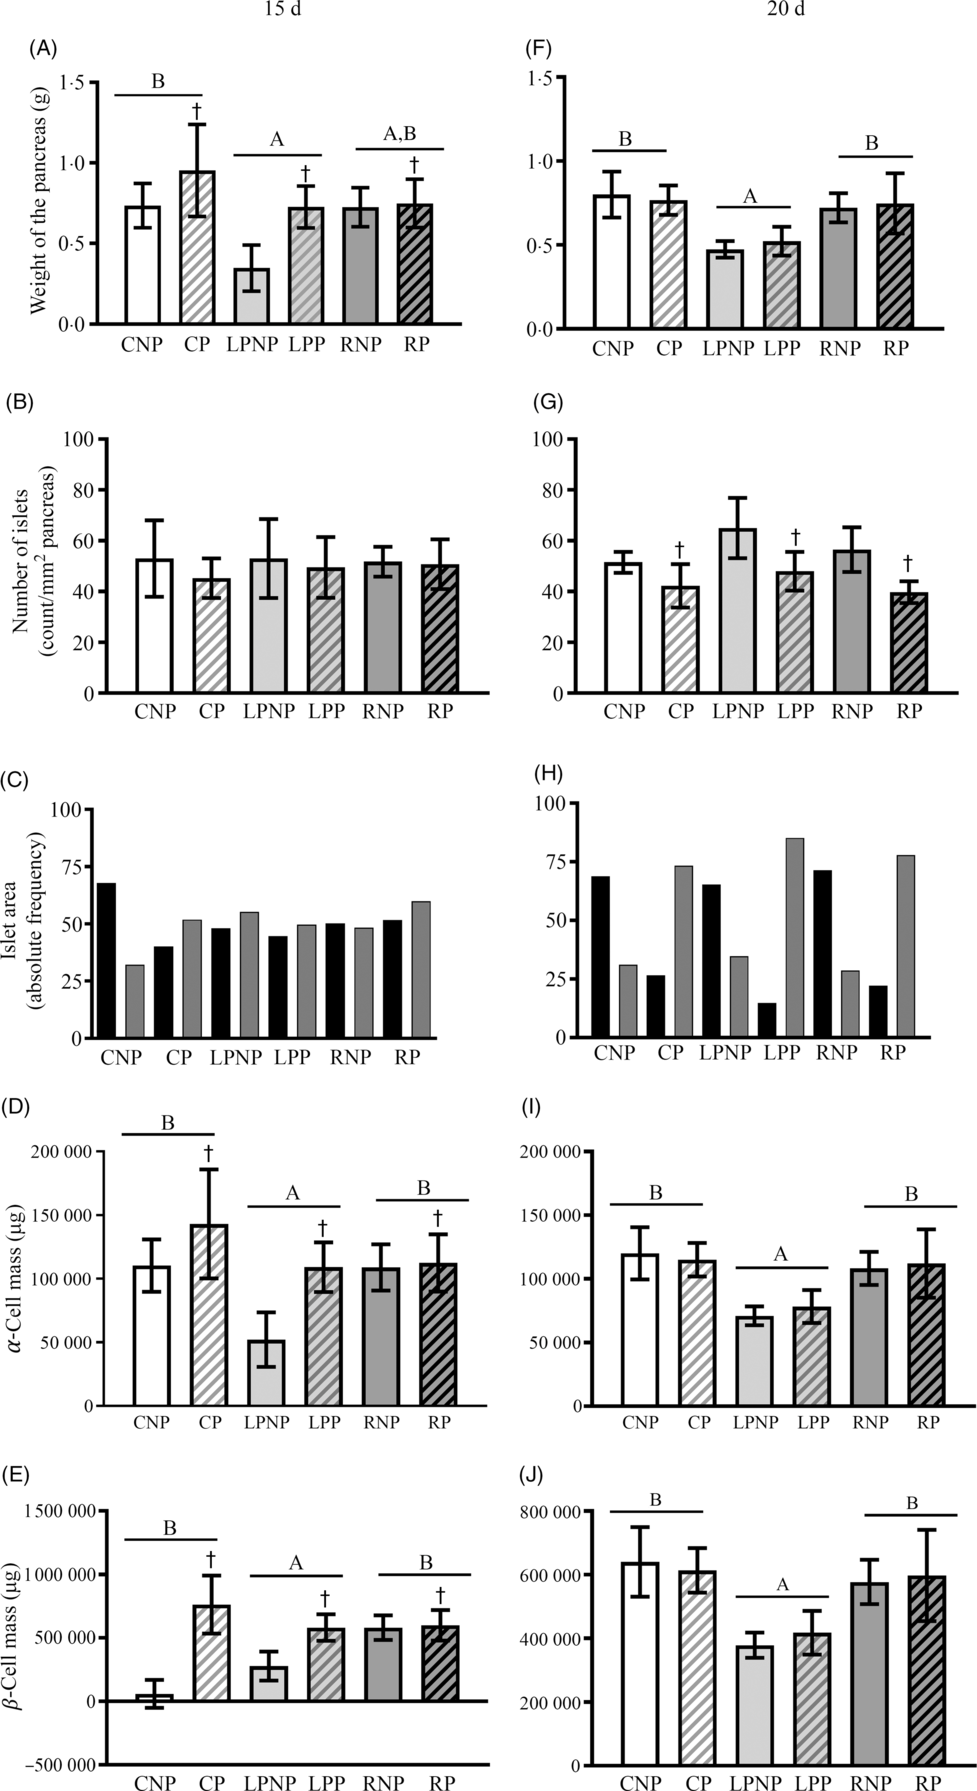
On the 15th day of gestation, the weight of the pancreas was influenced by nutritional status (F 2,18 = 6·69, P < 0·01) and was lower in the low-protein groups than that in the control groups. The recovered groups did not differ from the low protein and control groups. Gestation increased the weight of the pancreas, especially the pregnant control and pregnant low-protein groups (F 1,18 = 8·81, P < 0·01) (Fig. 4(A)). The number of islets per pancreas did not differ among groups (Fig. 4(B)). In the RNP and LPNP groups, the distribution of islets smaller and larger than the median was similar, in contrast with the CNP group, which had a higher proportion of smaller islets. Gestation did not change the pattern of the islet size distribution in the RP and LPP groups. The CP group showed a reversal of the pattern observed in the CNP group in that the proportion of islets was higher than the median (Fig. 4(C)). The masses of α- and β-cells (Fig. 4(D) and (E)) in the recovered and control groups were higher than those in the low-protein groups (F 2,18 = 6·69, P < 0·0067). Gestation increased the α- and β-cell masses, especially in the pregnant control and pregnant low-protein groups (F 1,18 = 8·80, P < 0·0083). On the 20th day, the low-protein groups showed lower pancreatic weights than the recovered and control groups (F 2,18 = 14·80, P < 0·001). Gestation did not modify the weight of the pancreas in all groups (Fig. 4(F)). The number of islets per pancreas was lower in pregnant rats than that in non-pregnant rats, regardless of nutritional status (F 1,18 = 19·23, P < 0·001) (Fig. 4(G)). The islet size distribution pattern did not differ between the RNP, LPNP and CNP groups, and there was a higher proportion of smaller islets than larger islets. The same pattern of islet size distribution was observed in the RP, LPP and CP groups, which had proportionately smaller islets than the median. However, in the LPP group, the difference in proportion was greater (Fig. 4(H)). The α- and β-cell masses (Fig. 4(I) and (J)) in the recovered and control groups were higher than those in the low-protein groups (Fig. 4(I) and (J)).
Weight of the pancreas expressed as g (A and F), number of islets expressed as count per mm2 of pancreas (B and G), the islet area frequency distribution expressed as the relative frequency (C and H), α-cell mass expressed as μg (D and I) and β-cell mass expressed as μg (E and J) on the 15th and 20th days of pregnancy. Values are means and standard deviations represented by vertical bars (n 4 animals/group). A,B Mean values were significantly different among rats with different nutritional statuses (P < 0·05; two-way ANOVA). † Mean values were significantly different between groups with different physiological statuses (P < 0·05; two-way ANOVA). ![]() , ≤9843·58 µm2;
, ≤9843·58 µm2; ![]() , >9843·58 µm2. CNP, control non-pregnant; CP, control pregnant; LPNP, low-protein non-pregnant; LPP, low-protein pregnant; RNP, recovered non-pregnant; RP, recovered pregnant.
, >9843·58 µm2. CNP, control non-pregnant; CP, control pregnant; LPNP, low-protein non-pregnant; LPP, low-protein pregnant; RNP, recovered non-pregnant; RP, recovered pregnant.
Representative islets with insulin-, glucagon-, Ki67- and PI-positive β-cells from CNP, CP, LPNP, LPP, RNP and RP rats on the 15th day of gestation are shown in Fig. 5(A).
Representative islets showing insulin-, glucagon-, Ki67-, and propidium iodide (PI)-positive β-cells from control non-pregnant (CNP), control pregnant (CP), low-protein non-pregnant (LPNP), low-protein pregnant (LPP), recovered non-pregnant (RNP) and recovered pregnant (RP) rats on the 15th and 20th days of pregnancy (A and G, respectively). Proliferating β-cell frequency on the 15th and 20th days of pregnancy (B and H, respectively). Proliferating α-cell frequency on the 15th and 20th days of pregnancy (C and I, respectively). β-Cell:α-cell proliferation ratio on the 15th and 20th days of pregnancy (D and J, respectively). PI-positive β-cells (apoptosis) on the 15th and 20th days of pregnancy (E and K, respectively). Ki67-insulin:PI-positive β-cell ratio on the 15th and 20th days of pregnancy (F and L, respectively). Values are means and standard deviations represented by vertical bars (n 4 animals/group). A–C Mean values were significantly different among rats with different nutritional statuses (P < 0·05; two-way ANOVA). † Mean values were significantly different between groups with different physiological statuses (P < 0·05; two-way ANOVA). a–c Mean values with unlike letters were significantly different (P < 0·05; least significant difference test).
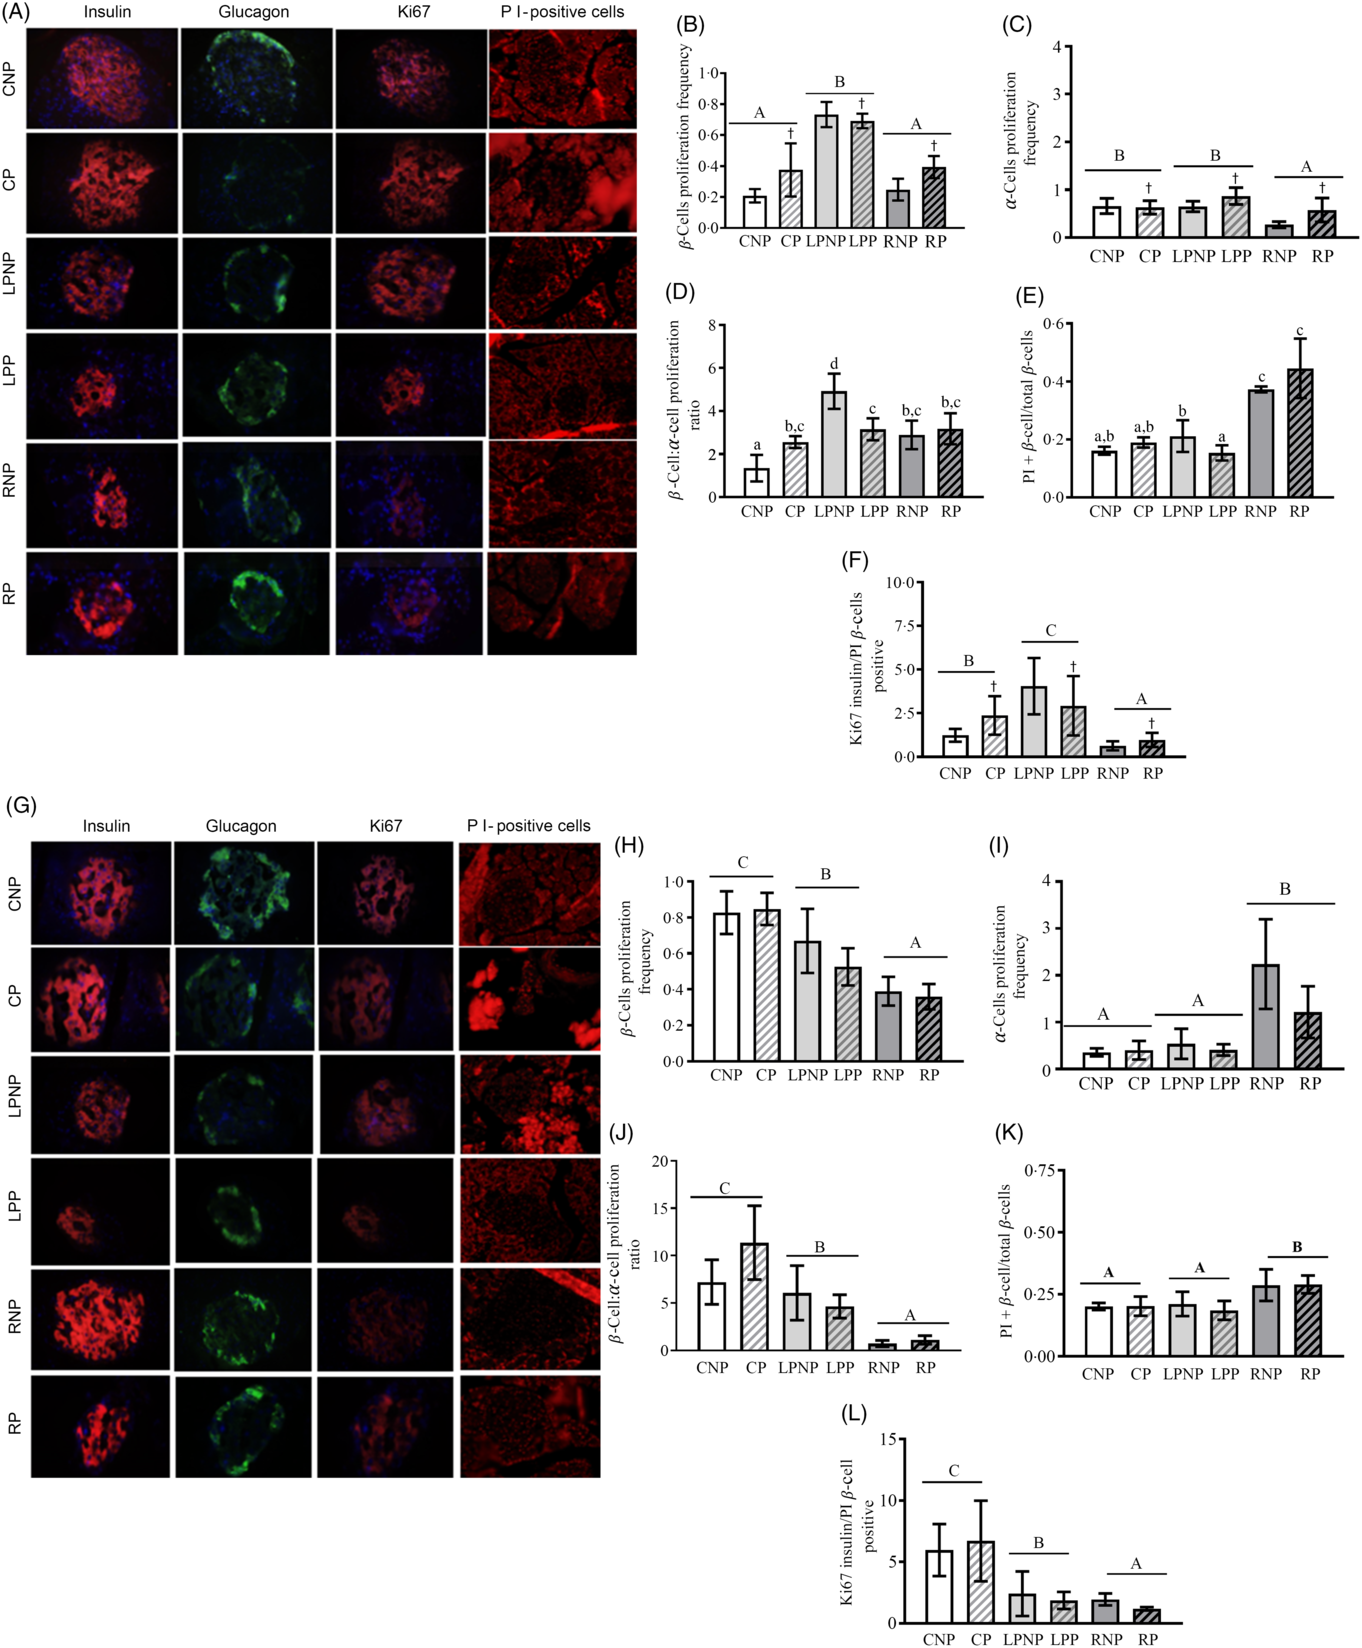
The proliferating β-cell frequency was higher in low-protein rats than that in recovered rats or control rats (F 2,18 = 52·73, P < 0·0001). Gestation enhanced the frequency of proliferating β-cells, especially in the control pregnant and recovered pregnant groups (F 1,18 = 5·86, P < 0·03; Fig. 5(B)). The frequency of proliferating α-cells was decreased in the recovered groups compared with that in the low-protein or control groups (F 2,18 = 8·90, P < 0·001). Moreover, the proliferating α-cell frequency was increased by gestation, especially in the low-protein pregnant and recovered pregnant groups (F 1,18 = 6·49, P < 0·03; Fig. 5(C)). The β-cell proliferation:α-cell proliferation ratio was higher in the RNP group than that in the CNP group (P < 0·002) but lower than that in the LPNP group (P < 0·0002). Gestation did not alter this ratio in the RP group in relation to that in the RNP group but reduced this ratio in the LPP group in relation to that in the LNP group and increased this ratio in the CP group compared with that in the CNP group (P < 0·01) (Fig. 5(D)). The frequency of PI-positive cells/islets was higher in RNP rats than that in LPNP and CNP rats (P < 0·0001), and this variable was similar in the latter two groups. The frequency of PI-positive β-cells/islets was not modified in the RP group in relation to that in the RNP group or in the CP group compared with that in the CNP group, whereas the frequency of PI-positive β-cells/islets was reduced in the LPP group in relation to that in the LPNP group. However, the LPP and CP groups exhibited similar frequencies of PI-positive β-cells/islets, and both groups showed significantly lower frequencies of PI-positive β-cells/islets in relation to the RP group (Fig. 5(E)). The Ki67-insulin:PI-positive β-cell ratio was lower in the recovered groups than that in the control groups as well as the low-protein groups. The highest Ki67-insulin:PI-positive β-cell ratio was observed in the low-protein groups (F 2,18 = 55·45, P < 0·0001). Moreover, gestation increased the ratio of Ki67-insulin:PI-positive β-cells, especially in the low-protein pregnant and control pregnant groups (F 1,18 = 5·95, P < 0·03) (Fig. 5(F)). Representative islets showing insulin-, glucagon-, Ki67- and PI-positive β-cells from CNP, CP, LPNP, LPP, RNP and RP rats on the 20th day of gestation are shown in Fig. 5(G). The frequency of proliferating β-cells was lower in the recovered groups than that in the low-protein or control groups. The low-protein groups had a lower frequency of proliferating β-cells in relation to the control groups (F 2,18 = 33·73, P < 0·0001) (Fig. 5(H)). However, the frequency of proliferating α-cells was higher in the recovered groups than that in the low-protein or control groups. The low-protein groups and control groups showed similar frequencies of proliferating α-cells (F 2,18 = 19·63, P < 0·0001) (Fig. 5(I)). The β-cell proliferation:α-cell proliferation ratio was lower in the recovered groups than that in the low-protein and control groups (F 2,18 = 15·85, P < 0·0001) (Fig. 5(J)). The recovered groups exhibited the highest frequency of PI-positive β-cells/islets compared with the low-protein or control groups. These latter groups had similar frequencies of PI-positive β-cells/islets (F 2,18 = 11·52, P < 0·001) (Fig. 5(K)). The Ki67-insulin:PI-positive β-cell ratio was lower in the recovered groups than that in the low-protein and control groups. The lowest Ki67-insulin:PI-positive β-cell ratio was observed in the recovered groups (F 2,18 = 27·06, P < 0·0001) (Fig. 5(L)).
On the 15th day of gestation, the frequency of insulin/glucagon colocalisation was affected by nutritional status (F 2,18 = 4·80, P < 0·02). Thus, the recovered groups had lower frequencies of insulin/glucagon colocalisation in relation to the control and low-protein groups (Fig. 6(A)).
Insulin/glucagon colocalisation frequency on the 15th day and 20th day of pregnancy (A and C, respectively) and islet or cluster duct association frequency (neogenesis) on the 15th and 20th days of pregnancy (B and D, respectively) in islets from control non-pregnant (CNP), control pregnant (CP), low-protein non-pregnant (LPNP), low-protein pregnant (LPP), recovered non-pregnant (RNP) and recovered pregnant (RP) rats on the 15th and 20th days of pregnancy (C). Values are means and standard deviations represented by vertical bars (n 4 animals/group). A,B Mean values were significantly different among rats with different nutritional statuses (P < 0·05; two-way ANOVA). † Mean values were significantly different between groups with different physiological statuses (P < 0·05; two-way ANOVA). a–d Mean values with unlike letters were significantly different (P < 0·05; least significant difference test). ND, none detected.

The frequency of islet or cluster-duct association was similar in the recovered and control groups. Both groups also showed higher frequencies of islet or cluster duct association than the low-protein groups. Regardless of nutritional status, gestation increased the frequency of islet or cluster-duct associations (F 1,18 = 13·34, P < 0·01) (Fig. 6(B)). On the 20th day of gestation, the frequency of insulin/glucagon colocalisation did not differ among groups (Fig. 6(C)). The frequency of islet or cluster-duct association was similar in the RNP, LPNP and CNP groups. In the RP and CP groups, the frequency of islet or cluster-duct association increased in relation to that in the RNP (P < 0·0001) and CNP (P < 0·01) groups, respectively, but there was no difference between the LPP and LPNP groups (Fig. 6(D)).
Representative islets showing pancreatic and duodenal homeobox-1 (PDX-1) and cleaved caspase 3 on the 15th day of gestation are shown in Fig. 7(A). PDX-1 was affected by physiological status (F 2,18 = 5·85, P < 0·05), as pregnant rats exhibited higher PDX-1 expression, regardless of nutritional status (Fig. 7(C)). Cleaved caspase 3 was increased in islets from pregnant rats compared with that in non-pregnant rats (F 1,18 = 4·57, P < 0·0) (Fig. 7(B)).
Representative islets showing sections double immunolabelled for cleaved caspase-3 and pancreatic and duodenal homeobox-1 (PDX-1) on the 15th and 20th days of pregnancy (A and D, respectively) from control non-pregnant (CNP), control pregnant (CP), low-protein non-pregnant (LPNP), low-protein pregnant (LPP), recovered non-pregnant (RNP) and recovered pregnant (RP) rats. Values are means and standard deviations represented by vertical bars (n 4 animals/group) as arbitrary units for cleaved caspase-3 on the 15th and 20th days of pregnancy (B and E, respectively) and PDX-1 on the 15th and 20th days of pregnancy (C and F, respectively). † Mean values were significantly different between groups with different physiological statuses (P < 0·05; two-way ANOVA).
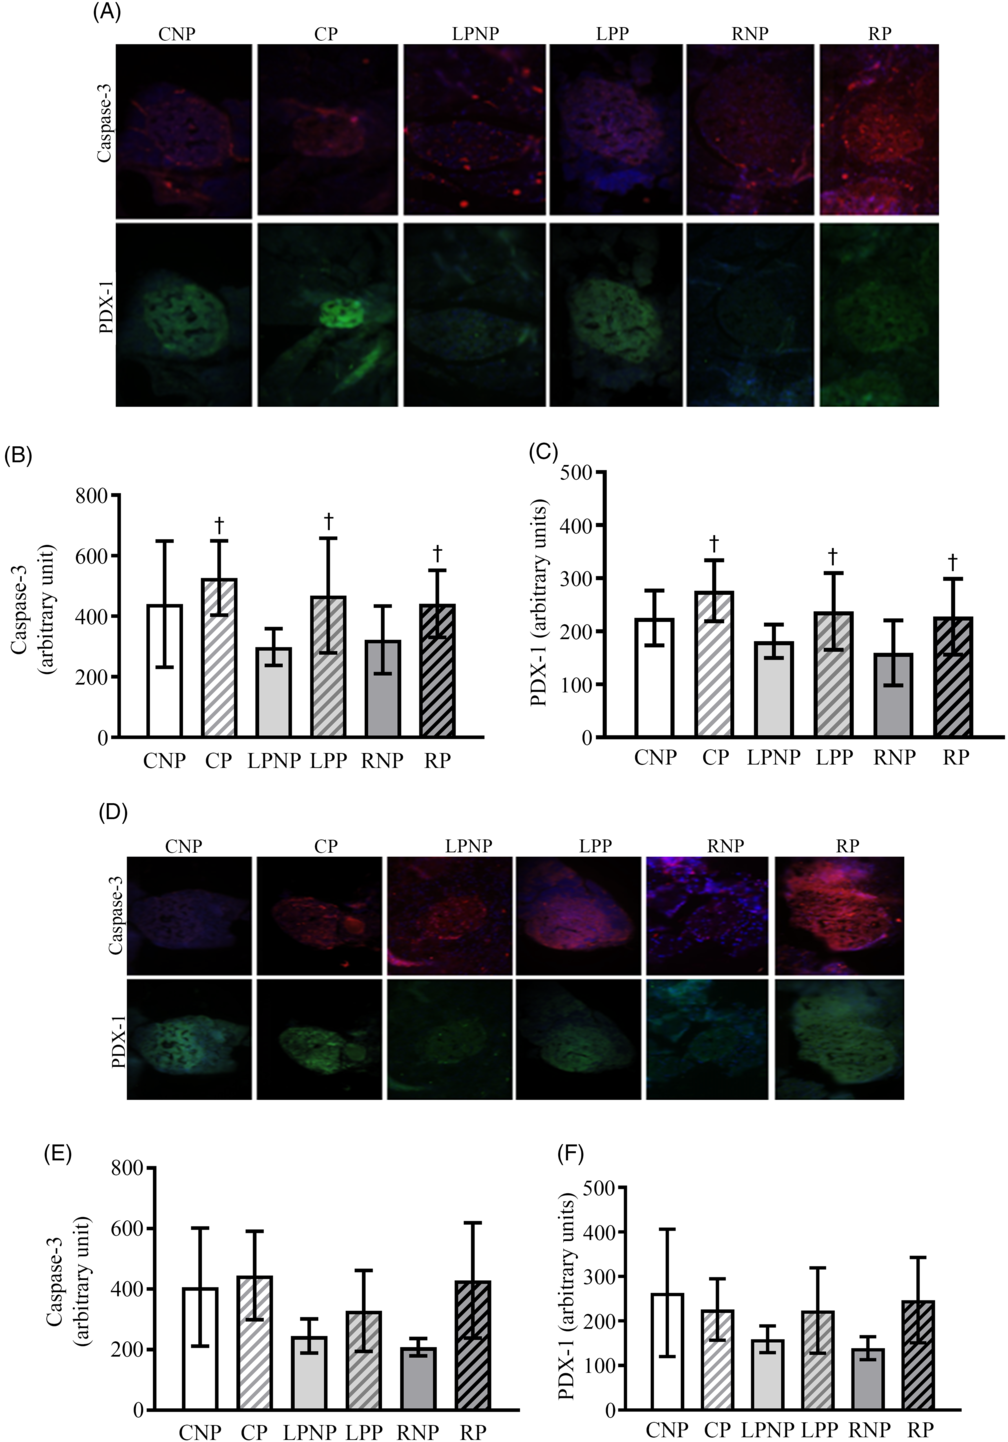
Caspase 3 mRNA transcription was higher in recovered rats (RNP = 8·74 (sd 1·04), n 3; RP = 10·01 (sd 1·65), n 3) (LPNP = 5·84 (sd 2·12), n 4; LPP = 5·70 (sd 0·77), n 3) and control (CNP = 6·89 (sd 0·45), n 3; CP = 6·57 (sd 0·78), n 3) rats (F2,13 = 11·97; P < 0·011). Caspase 8, Bax, Bcl-2 and Bcl-xl mRNA transcription as well as the Bcl-2:Bax ratio did not differ among groups (data not shown). Representative islets showing PDX-1 and cleaved caspase 3 from CNP, CP, LPNP, LPP, RNP and RP rats on the 20th day of gestation are shown in Fig. 7(D). The expression of cleaved caspase 3 (Fig. 7(E)) and PDX-1 (Fig. 7(F)) was similar in all groups.
Discussion
In the present study, we used a model of protein restriction during the intra-uterine stage and lactation to evaluate the morphometric adaptations of islets after nutritional recovery as well as the balance between mechanisms that increase (proliferation, neogenesis and transdifferentiation) and reduce (apoptosis) the mass of β-cells during gestation. Investigating these aspects in this animal model is important for clarifying the pathogenesis of gestational diabetes and could contribute to its prevention and advances in its treatment. We verified that on the 15th day of gestation, all groups showed an increase in pancreas weight, but there was no difference in the number of islets in relation to that observed in non-pregnant rats. The population of islets of Langerhans is heterogeneous, with a large number of small islets and a small number of large islets(Reference Lifson, Lassa and Dixit24,Reference Hellman25) . In the present study, the RNP and LPNP groups had equal proportions of small and large islets, whereas the CNP group exhibited a higher proportion of small islets. The increase in islet size commonly observed during gestation(Reference Sorenson and Brelje16) was not observed in the RP and LPP groups but did occur in the CP group. In addition to proliferation and neogenesis, hypertrophy of β-cells may have contributed to the increase in the size of the islets in the CP group.
Islet size is of major importance in predicting insulin secretion(Reference Reaven, Gold and Walker26). In the present study, there was no relationship between the distribution pattern of the islet size and the quantity of insulin secreted, particularly in the RP group. However, at least in the low protein groups, the reduction in the mass of β-cells was accompanied by a decrease in insulin secretion at physiological glucose concentrations. Gestation promoted the expansion of the β-cell mass, but insulin secretion in response to 8·3 mm glucose remained unchanged in the RP group compared with that in the RNP group. These findings reinforce previous indications that in the LPP group, diminished glucose-stimulated insulin secretion is due to reduced islet mass, whereas in the RP group, it is the result of functional defects(Reference Ignácio-Souza, Reis and Arantes27).
Large islets are major contributors to the total β-cell mass compared with smaller islets(Reference Skau, Pakkenberg and Buschard28), and gestation is associated with a compensatory increase in β-cell mass, reflecting an increased demand for insulin resulting from high food intake, which is further reinforced by the elevation of somatolactogenic hormone levels(Reference Nielsen29). Additionally, a strong and significant positive correlation was observed between β-cell mass and body weight(Reference Montanya, Nacher and Biarnés30). In the recovered groups, the increase in β-cell mass could be due to insulin resistance (based on the composite ISI). However, this argument does not explain the failure of the structural adaptation of β-cells from the low protein groups. In that case, the reduced β-cell mass may have resulted from low body weight and hypophagia. Notably, the increase in β-cell mass in all pregnant groups despite the increased sensitivity to insulin is noteworthy. Islet cells are also prone to alterations, depending on the blood glucose concentration(Reference Bonner-Weir, Deery and Leahy31). Chronic hypoglycaemia, which occurs because of insulin-secreting tumours, leads to marked cell atrophy(Reference Chen, Appel and Alam32), whereas hyperglycaemia induced by partial pancreatectomy increases β-cell size(Reference Jonas, Sharma and Hasenkamp33). In the present study, a direct relationship between basal glycaemia and islet size in the pregnant and non-pregnant groups was observed. Elevation of glycaemia also stimulates β-cell replication within 1 d(Reference Swenne34), and β-cell replication has also been observed in an in vivo model of glucose infusion in mice(Reference Alonso, Yokoe and Zhang35).
Increased β-cell replication (hyperplasia) and β-cell size (hypertrophy) are considered the principal mechanisms by which rodents increase β-cell mass during gestation(Reference Genevay, Pontes and Meda1). Intense β-cell replication starts at approximately day 10 and peaks at approximately the 14th day of gestation(Reference Parsons, Brelje and Sorenson9). In the present study, we observed increased proliferating β-cell and α-cell frequencies on the 15th day of gestation in all groups, regardless of nutritional status, but the β-cell:α-cell proliferation ratio was similar in the pregnant groups. Although the RP, LPP and CP groups exhibited similar β-cell:α-cell proliferation ratios, this variable was unaltered in relation to that in the RNP group, whereas this ratio was reduced in the LPP group and increased in the CP group in relation to that in the LPNP and CNP group, respectively. Notably, during rodent gestation, α-cells contribute to β-cell proliferation, as α-cells produce glucagon-like peptide 1, an important β-cell growth factor(Reference Kilimnik, Kim and Steiner36). Therefore, we hypothesised that modulation of β-cell proliferation by glucagon-like peptide 1 may be impaired in both the RP and LPP groups.
The frequencies of islets or clusters of β-cells associated with ducts were significantly increased, but insulin/glucagon colocalisation was not observed in islets from pregnant rats. Hence, in the animal model examined in the present study, neogenesis occurred, but transdifferentiation was not observed in islets from pregnant rats, which was consistent with the results of a previous study(Reference Abouna, Old and Pelengaris37).
α- and β-Cell replication, β-cell neogenesis and α- to β-cell transdifferentiation have been associated with the expression of the transcription factor pancreatic and duodenal homeobox-1 (PDX-1)(Reference Gao, McKenna and Li38–Reference Hayes, Moss and Schisler41). Consistently, we verified that islets from pregnant rats exhibiting increased PDX-1 staining also displayed elevated α- and β-cell proliferation and high β-cell neogenesis, regardless of nutritional status.
Fetal and adult islets from offspring subjected to protein restriction during the intra-uterine stage showed an increased rate of apoptosis compared with control islets incubated in the presence of cytokines, even when a normal diet was administered after weaning(Reference Merezak, Hardikar and Yajnik42–Reference Goosse, Balteau and Reusens44). In the present study, the PI assay revealed increased β-cell death in islets from RP and RNP rats. The recovered groups also showed elevated mRNA caspase-3 transcription. Several lines of evidence have shown that sustained increases in mitochondrial and cytoplasmic Ca2+ contribute to oxidative stress and cell death(Reference Smaili, Hirata and Ureshino45). Changes in intranuclear Ca2+ concentrations are likely to be involved in activating the cleavage of DNA by nucleases during programmed cell death(Reference Nicotera and Rossi46). Coincidently, a previous study in the same experimental model showed elevated intracellular Ca2+ concentrations in recovered rats compared with those in low protein and control rats(Reference Marin, de Lima Reis and de Fátima Silva Ramalho47). Immunostaining of cleaved caspase-3, a marker of β-cell apoptosis(Reference Tomita48), was elevated in all of the pregnant groups, in contrast with the results of the PI assay and with the observation that apoptosis is minimal during the first two-thirds of gestation(Reference Rieck and Kaestner12). However, it is important to emphasise that the cleaved caspase-3 data refer to apoptosis of all islet cell types. Moreover, caspases have non-apoptotic functions. In pancreatic cancer, for example, the activation of caspase-3 contributed to the proliferation of tumour cells(Reference Cheng, Tian and Ma49). Recently, caspase-3 activation has been shown to induce transcriptional changes, leading to positive regulation of genes involved in angiogenesis and negative regulation of genes involved in pro-apoptotic pathways(Reference Bernard, Chevrier and Beltjens50). Interestingly, during gestation, the increased replication of β-cells is accompanied by increased vascularisation of the islets(Reference Johansson, Mattsson and Andersson51).
On day 20 of gestation, the weight of the pancreas did not differ, but the majority of the islets of the pregnant rats were large, and the number of islets was reduced, regardless of nutritional status. Thus, the expansion of the islets occurred during the end of gestation in the RP and LPP groups without changing the mass of β-cells. This morphological pattern was accompanied by low body weight, lower insulin sensitivity, a similar basal glucose concentration and equal basal secretion of insulin in RP rats compared with those in CP rats. Despite a similar distribution in terms of islet size and β-cell mass, insulin secretion in response to glucose stimulation was reduced in the RP and LPP groups, indicating the impairment of islet function and structure, respectively.
The α- and β-cell proliferation frequencies, β-cell:α-cell proliferation ratio and PI assay showed that the Ki67-insulin:PI-positive β-cell ratio was not affected by gestation. There was a decline in β-cell proliferation during late gestation(Reference Parsons, Brelje and Sorenson9). In the present study, these variables were only affected by nutritional status, as the recovered groups were the most impaired. The recovered groups exhibited a reduced β-cell proliferation frequency and an increased α-cell proliferation frequency, resulting in a reduced β-cell:α-cell proliferation ratio in relation to the control and low-protein groups. Although malnourished rats exhibited higher β-cell proliferation frequencies, lower α-cell proliferation frequencies and higher β-cell:α-cell proliferation ratios than recovered rats, this pattern was problematic compared with that in control rats. Because relatively lower proportions of β-cells and α-cells have been observed in type 2 diabetes(Reference Klöppel, Löhr and Habich52,Reference Clark, Wells and Buley53) , we hypothesised that the recovered and malnourished animals are prone to diabetes.
It has been proposed that a low-protein diet during the intrauterine and neonatal life stages promotes differentiation at the expense of proliferation in the endocrine pancreas of offspring through upregulation of transcription factors(Reference Rodríguez-Trejo, Ortiz-López and Zambrano54). By contrast, we observed similar frequencies of β-cell neogenesis among the non-pregnant animals with different nutritional statuses. Moreover, gestation increased the frequency of β-cell neogenesis only in the recovered and control groups, despite the presence of similar PDX-1 staining in all groups.
Finally, the expected increase in apoptosis through the end of gestation(Reference Rieck and Kaestner12) was not observed in the pregnant groups, and this result was accompanied by a similar level of cleaved caspase-3 immunostaining in all groups. However, recovered rats exhibited increased β-cell death in relation to the malnourished and control groups. The low Ki67-insulin:PI-positive β-cell ratios observed in the recovered and malnourished groups indicate the loss of equilibrium between proliferation and apoptosis in both groups.
It is noteworthy that despite the increase in apoptosis at both of the time points evaluated, rats subjected to protein restriction early in life who recovered after weaning did not show a reduction in the mass of pancreatic β-cells. Since there were no differences in the frequencies of proliferation and neogenesis in this group compared with those in the control group, it is reasonable to suggest that the maintenance of β-cell mass may have resulted from hypertrophy to a higher degree in the recovered group than that in the control group. Hypertrophy could be a rapid response to increased insulin demand and a more efficient and economical mechanism than proliferation(Reference Bonner-Weir3) for rapid and transient compensation, since these cells should be eliminated shortly after the end of gestation.
Surprisingly, maintenance of the hypoprotein diet for life was less harmful than nutritional rehabilitation in terms of the mechanisms involved in the remodelling of the endocrine pancreas during gestation. Our results not only indicate that nutritional rehabilitation does not reverse the deleterious effects of protein restriction early in life but also suggests that it could be disadvantageous, since it is known that apoptosis is the major cause of β-cell death in animal models of diabetes.
Conclusion
The results of this study show that, especially in the first two-thirds of gestation, protein malnutrition early in life did not alter the mass of β-cells, despite the increase in apoptosis. However, the lack of adaptation during gestation was not sufficient to produce gestational diabetes.
Acknowledgements
The authors are grateful to Celso Roberto Afonso for the excellent technical assistance.
This work was supported by the Brazilian foundations: FAPEMAT (Fundação de Amparo à Pesquisa do Estado de Mato Grosso, grant no. 156079/2014); CAPES (Coordenação de Aperfeiçoamento de Pessoal de Nível Superior – Brasil, Finance Code 001; PROCAD 160638) and CNPq (Conselho Nacional de Desenvolvimento Científico e Tecnológico, grant no. 457987/2014-6). This work is part of a dissertation presented by D. S. V.-D. as a partial requirement for the Master’s degree in Bioscience, Faculdade de Nutrição, Universidade Federal de Mato Grosso.
C. A. R.-S. and L. R. S. carried out oral glucose tolerance tests, isolation of pancreatic islets, insulin secretion assays and insulin RIA. V. C. A., M. A. B. R., M. M. F., E. G. M., P. C. L. and E. M. C. revised the manuscript and approved the final version of the manuscript. D. S. V.-D. performed the experiments, analysed the data, prepared the figures and drafted the manuscript. A. S. D. conducted the histological assays, revised the manuscript and approved the final version of the manuscript. M. Q. L. analysed the data, interpreted the results of the experiments, drafted the manuscript and did the conception and design of the research. All authors read and approved the final manuscript.
The authors have no conflicts of interest.


