


Introduction
Labeling of additional dicamba-containing herbicides for over-the-top use in dicamba-resistant (DR) cotton (Gossypium hirsutum L.) and soybean (Anonymous 2016a, 2016b) will increase the amount and frequency of dicamba application. Approximately 50% of row-crop hectares in Arkansas were planted to soybean in 2015 (USDA-FSA 2016). Therefore, the likelihood of DR cultivars being planted near non-DR soybean is high.
Even with new formulations of dicamba said to have reduced volatility available, primary drift should still be a concern for growers (Norsworthy et al. Reference Norsworthy, Barber, Scott, Bond, Steckel and Reynolds2015). When DR soybean and cotton are planted adjacent to non-DR soybean, applicators must be aware of factors that could contribute to off-target movement due to high sensitivity of non-DR soybean, because rates as low as 0.08 g ae ha−1 may cause visible injury symptoms consistent with auxin herbicides (Weidenhamer et al. Reference Weidenhamer, Triplett and Sobotka1989). Correct nozzles, proper boom height, proper spray pressure, and approved mixtures will aid in keeping dicamba from moving off-target via physical drift to susceptible soybean (Anonymous 2017a, 2017b; Maybank et al. Reference Maybank, Yoshida and Grover1978; Wolf et al. Reference Wolf, Grover, Wallace, Shewchuk and Maybank1992).
Labeling of dicamba for DR cultivars has expanded current dicamba use from preplant burndown or POST corn (Zea mays L.) applications to in-crop POST applications on DR soybean and cotton, which range from May through August (USDA-NASS 2010). Off-target movement to soybean is less likely to occur from preplant or POST corn applications, because fewer soybean hectares have emerged, as soybean planting does not typically begin until after corn emergence in late April in most of Arkansas (USDA-NASS 2010). Likewise, the use rate of dicamba in corn is typically less than that labeled for use in DR cotton and soybean. In addition, March and April temperatures are usually mild, and precipitation is common. Conversely, average temperatures increase in all areas of the United States by summer, and precipitation has a tendency to become less frequent (NOAA 2018). High temperatures have been recognized to increase dicamba volatility, and rainfall has been documented to virtually eliminate dicamba volatility (Behrens and Lueschen Reference Behrens and Lueschen1979).
Dicamba is a phloem-mobile herbicide (Senseman Reference Senseman2007), meaning that when applied it will inherently move to areas of new growth. Soybean exposure to dicamba in the vegetative stage resulted in greater injury compared with reproductive-stage exposure (Griffin et al. 2013; Kelley et al. Reference Kelley, Wax, Hager and Riechers2005; Solomon and Bradley Reference Solomon and Bradley2014; Weidenhamer et al. Reference Weidenhamer, Triplett and Sobotka1989). Kelley et al. (Reference Kelley, Wax, Hager and Riechers2005) reported soybean injury increased from 25% to 37% when dicamba at 0.56 g ha−1 was applied at vegetative as opposed to reproductive stages. Solomon and Bradley (Reference Solomon and Bradley2014) documented an 11% decrease in soybean injury when application of dicamba at 0.28 g ha−1 was delayed from the vegetative stage to R2 growth stage. Once reproductive growth begins, vegetative growth in the form of new branches and trifoliate leaves declines as reproductive structures such as flowers and pods begin to form. Therefore, the amount of observable leaf malformation decreases. The amount of dicamba moving to leaves in pre-bloom stages is also likely greater than that of reproductive stages and therefore leads to a greater amount of leaf malformation.
Once soybean reaches its reproductive stages, exposure to dicamba may still result in extensive crop injury. Previous studies have documented as much as 17% and 25% soybean injury from dicamba at 0.28 and 0.56 g ha−1, respectively, applied at the R2 growth stage (Kelley et al. Reference Kelley, Wax, Hager and Riechers2005; Solomon and Bradley Reference Solomon and Bradley2014). The reduction in soybean leaf injury from reproductive exposure is accompanied by increased malformation in other meristematic regions such as pods. Soybean pod malformation can be a result of exposure to dicamba during flowering, with the later-developing pods being a possible metabolic sink for dicamba. Pod malformation has been previously documented as an outcome in soybean exposed to dicamba during flowering and early pod-forming stages (Auch and Arnold Reference Auch and Arnold1978; Weidenhamer et al. Reference Weidenhamer, Triplett and Sobotka1989). Percentage of pod malformation or percentage of pods showing malformed growth was not previously documented in these studies, only the presence or absence of pod malformation.
The effects of dicamba on soybean have also been documented to extend to the offspring in the form of germination reductions (Auch and Arnold Reference Auch and Arnold1978; Thompson and Egli Reference Thompson and Egli1973; Wax et al. Reference Wax, Knuth and Slife1969). Application of dicamba at 1 to 56 g ha−1 to vegetative soybean did not result in germination reductions (Auch and Arnold Reference Auch and Arnold1978). Germination was relatively unaffected (97%) by dicamba at 8.75 g ha−1 when applied to soybean in bloom (Wax et al. Reference Wax, Knuth and Slife1969). However, application of dicamba at 30 g ha−1 during pod-fill stages resulted in only 50% germination (Thompson and Egli Reference Thompson and Egli1973). Furthermore, soybean germination was reduced by 13% to 46% from early and late pod formation applications of dicamba at 11 to 56 g ha−1 (Auch and Arnold Reference Auch and Arnold1978).
In addition to germination reduction, offspring malformation occurs following soybean exposure to dicamba. After application of dicamba at 8.75 to 35 g ha−1 to parent soybean plants, offspring developed leaf malformation like that seen after dicamba exposure (Wax et al. Reference Wax, Knuth and Slife1969). In subsequent research, dicamba was applied at 30 to 560 g ha−1, and the effects were present in all treatments with severe trifoliate injury in 33% to 100% of offspring (Thompson and Egli Reference Thompson and Egli1973).
Soybean exposure to dicamba and subsequent evaluations of offspring have typically been studied after direct applications of low dosages of dicamba to plots rather than using seed from an actual drift event. In addition, past research did not document parameters past the V3 stage of soybean offspring. Therefore, the objective of this research was to examine the season-long effects of an actual dicamba drift event on soybean offspring planted in the field the subsequent season.
Materials and Methods
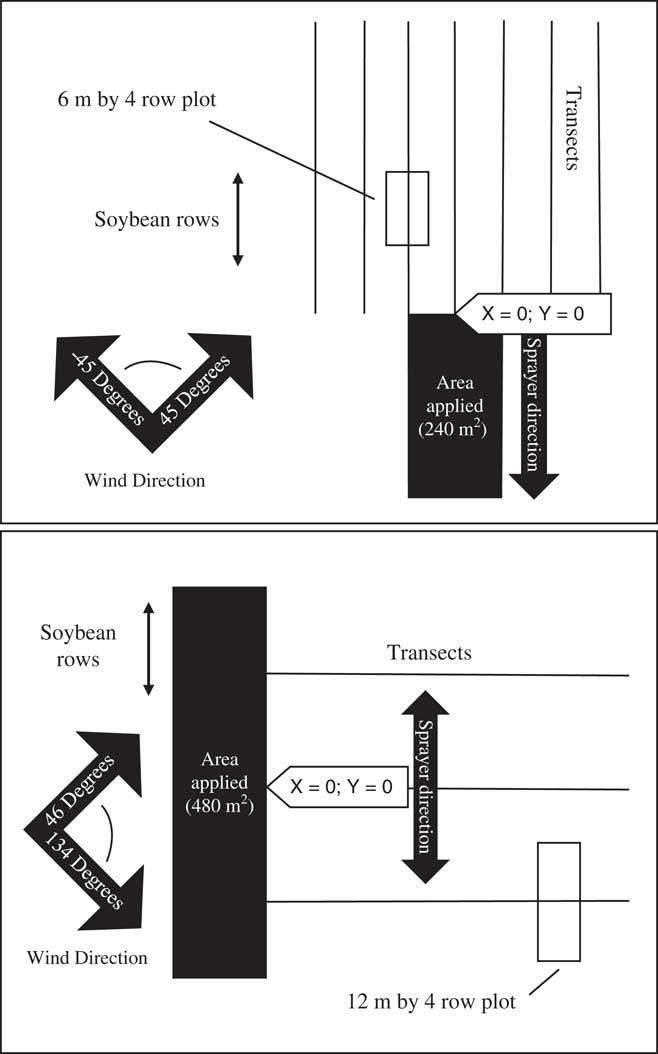
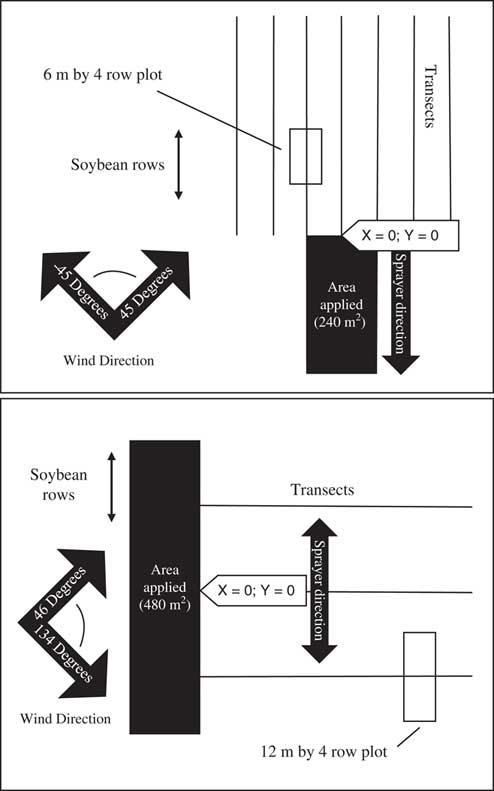
Field drift experiments were conducted in 2014 and 2015 at the University of Arkansas Northeast Research and Extension Center (NEREC) in Keiser, AR, and offspring experiments were completed at the Arkansas Agricultural Research and Extension Center (AAREC) in Fayetteville, AR, in 2015 and 2016. In 2014, eight dicamba drift experiments were established in commercial production fields at the NEREC, with two being treated with dicamba at the R3 growth stage and the remaining six treated at the R1 growth stage of soybean (Table 1). Eight additional dicamba drift experiments were established at the same location in 2015 to obtain data from dicamba application at growth stages R2, R3, R5, and R6. All trials were planted at 31 seed m−1 of row on 97-cm centers. Varieties used are listed in Table 1. A single 8-m-wide by 30- or 60-m-long pass was made with a Bowman Mudmaster (Bowman Manufacturing, Newport, AR) high-clearance sprayer during conditions conducive for a drift event (Figure 1). In the treated area, the diglycolamine form of dicamba was applied at 560 g ha−1 (Clarity®, BASF, Research Triangle Park, NC) to the same non-DR soybean variety that was planted throughout the rest of the field. Applications were made when average wind speeds ranged from 8.5 to 16.9 km h−1 to ensure adequate particle drift. A nonionic surfactant was also included in the spray solution at 0.25% v/v (Induce®, Helena Chemical, Collierville, TN). The spray boom was equipped with AIXR11003 nozzles (TeeJet® Technologies, Springfield, IL) and calibrated to deliver 94 L ha−1 at 275 kPa per the anticipated guidelines for the use of dicamba in DR crops (Anonymous 2013). Each application was made with a 60-cm boom height above the soybean canopy while traveling at 15 km h−1. The treated area was 30 m in length for applications when wind directions were less than 45° from the sprayer traveling direction. The field was grid sampled into four rows (spaced 97 cm apart) by 6-m-long plots extending from the application area until no injury was observed at 14 and 28 d after application (DAA). Applications occurring when the wind direction was greater than 45° from the application direction were 60 m in length. Transects were established at 15, 30, and 45 m along the application area that extended perpendicular to the rows. Four-row by 12-m plots were established along each transect until no injury was observed at 14 and 28 DAA. There were no buffer rows between plots along a given transect. Regardless of wind direction, only the center two rows of each plot within each transect were used for data collection.
Year, trial, soybean variety, growth stage, and number of observations in parent drift trials at the Northeast Research and Extension Center in Keiser, AR.

Illustration of drift trial layout for different wind directions.
Measurements on the center two rows of parent plants included visual estimates of leaf malformation on a 0% to 100% scale, with 100% being plant death, at 14 and 28 DAA; soybean height at 28 DAA and maturity (3 random plants per plot); percentage of malformed pods at maturity; and grain yield adjusted to 13% moisture. Height and yield measurements were later converted to percentages of the nontreated soybean plots. Five plots from each trial that were documented to have no leaf malformation at 28 DAA were used to calculate the nontreated check averages for height and yield. A 1-kg sample of soybean seed was taken from each plot after harvest and placed in a freezer maintained at −10 C until the following spring, when planting occurred.
Seeds collected from the 2014 and 2015 drift trials were planted at AAREC in 2015 and 2016, respectively, at 25 seed m−1 row in 6-m-long plots on a 91-cm spacing. The site consisted of a Captina silt loam (fine-silty, siliceous, active, mesic Typic Fragiudults) with a pH of 6.1 and 1.18% organic matter. The field was furrow irrigated weekly if less than 2.5 cm of rain fell. Initial planting in 2015 was April 26; however, injury in the form of stand loss was caused by PRE-applied flumioxazin (Valor® SX, Valent, Walnut Creek, CA), after which the test was replanted in an adjacent field on June 25. No PRE herbicides were used thereafter, to avoid herbicide injury. In 2016, initial planting occurred on May 19. Stand loss occurred due to soil crusting and pigeon (Columba livia Gmelin) feeding in isolated areas of the field to the extent that the experiment was replanted June 9. All varieties were glufosinate-resistant for ease of weed control (Table 1). Multiple varieties were used, but all were indeterminate growth habit to reduce variability in response. Currently there is no available research documenting differences in dicamba sensitivity of soybean within growth habit. Experiments were kept weed-free with a POST application of glufosinate (Bayer CropScience, Research Triangle Park, NC) at 595 g ai ha−1 and S-metolachlor (Syngenta, Greensboro, NC) at 1,390 g ai ha−1 at 21 d after planting (DAP) followed by a second application of glufosinate 2 wk later.
Measurements from the offspring included emergence (percent of planted seed emerged), vigor (1 to 5), injury at 21 DAP (percent visible injury on a 0% to 100% scale, with 100% being plant death; stunting, leaf malformation, epinasty, and terminal inhibition were taken into account), number of plants injury per plot (meaning the number of plants injured in the plot were divided by the total number of emerged plants and converted to a percentage of plants showing malformation), and grain yield adjusted to 13% moisture (kg ha−1). Soybean vigor was rated on a scale of 1 to 5 for each plot using the following criteria: 1=extremely low vigor (slow initial growth with delayed emergence or reduced emergence of >60% under field conditions), 2=poor vigor (slow initial growth and 30% to 60% reduction in emergence in the field), 3=moderately low vigor (average initial growth with slight reduction in emergence likely under good field conditions), 4=moderately high vigor (average initial growth with slight reduction in emergence likely in fields having suboptimal conditions), 5=extremely high vigor (rapid emergence and growth of seedlings with emergence likely under a wide array of field conditions). Although a standardized definition of vigor satisfactory to most investigators has yet to be realized, the concept of vigor and its importance in crop development are well accepted (Pollock and Roos Reference Pollock and Roos1972). Yield was later converted to percentages relative to the nontreated plots. Five plots from each parent drift trial the previous year that were documented to have no parent leaf malformation at 28 DAA were used to calculate the nontreated treatment averages for offspring yield. Data were subjected to correlation analysis using JMP 12 PRO (SAS Institute, Cary, NC) to determine Pearson pairwise correlations among parent and offspring observations.
Results and Discussion
R1 Drift Events
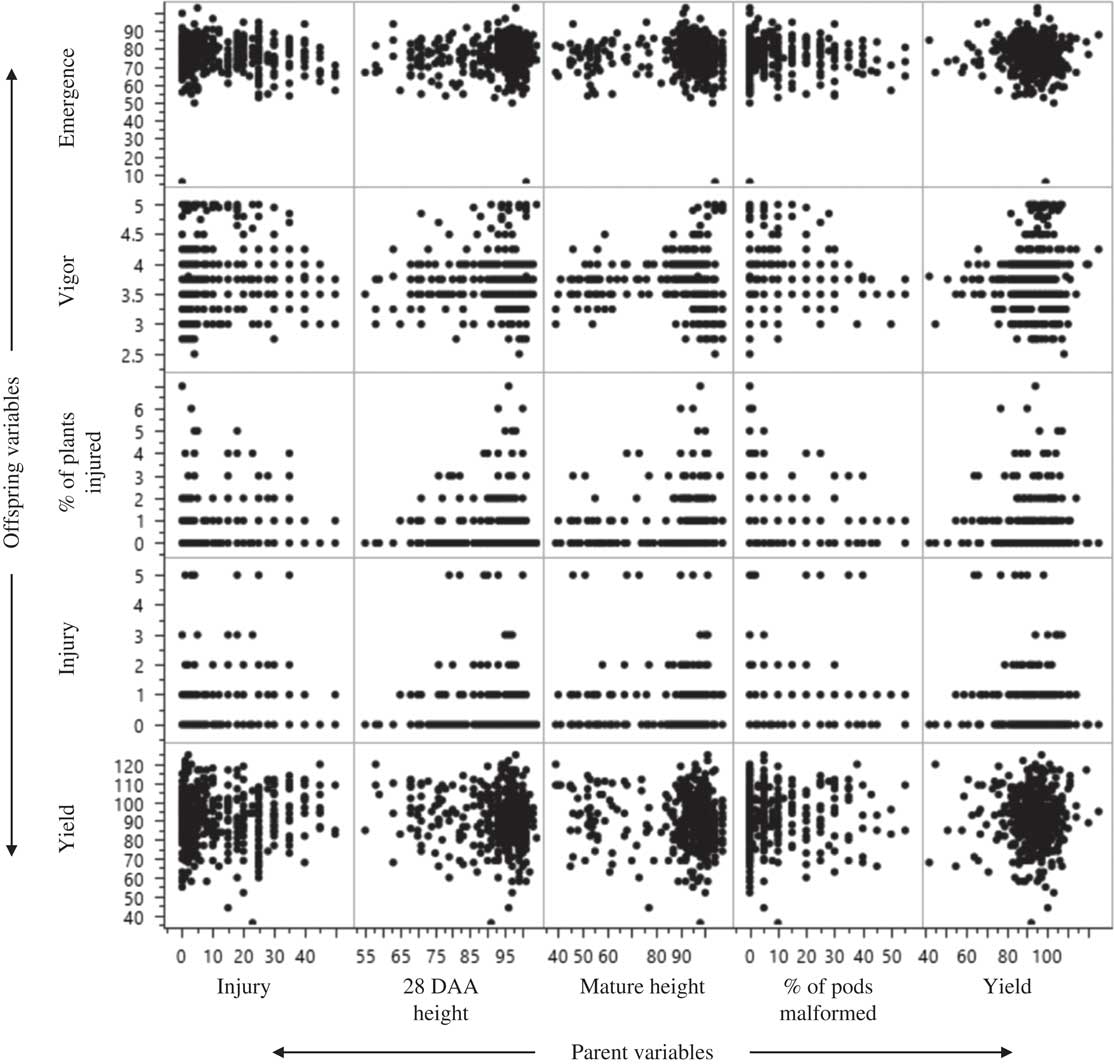
Previous research found soybean exposure to dicamba in flowering stages to be detrimental to grain yield (Auch and Arnold Reference Auch and Arnold1978; Wax et al. Reference Wax, Knuth and Slife1969). However, drift events occurring at the R1 growth stage resulted in only one significant correlation between parent and offspring variables. Relative mature height of the parent was significantly correlated with offspring injury (r=−0.13) (Table 2; Figure 2). Terminal node inhibition can occur to soybean exposed to dicamba (Behrens and Lueschen Reference Behrens and Lueschen1979). Events that lead to terminal node inhibition will likely result in height reduction at maturity. Solomon and Bradley (Reference Solomon and Bradley2014) documented yield loss to coincide with height reduction caused by dicamba concentrations as low as 2.8 g ha−1 or 1/400th of the labeled rate for DR soybean applied at early reproductive soybean stages. Height reduction may be the greatest predictor of yield of soybean directly exposed to dicamba, likely because plants experiencing terminal inhibition received the greatest concentration of dicamba. This may be of significance for soybean offspring. Soybean plants exposed to a drift event may have ample time to detoxify lower concentrations of dicamba; however, higher concentrations may remain active in the plant through seed fill and therefore may be transported to the seed.
Pearson’s correlation coefficients between parent and offspring variables at each respective growth stage.

a Sample sizes: R1, n=471; R2, n=320; R3, n=235; R5, n=52; R6, n=51.
b An asterisk (*) indicates significance to α=0.01.
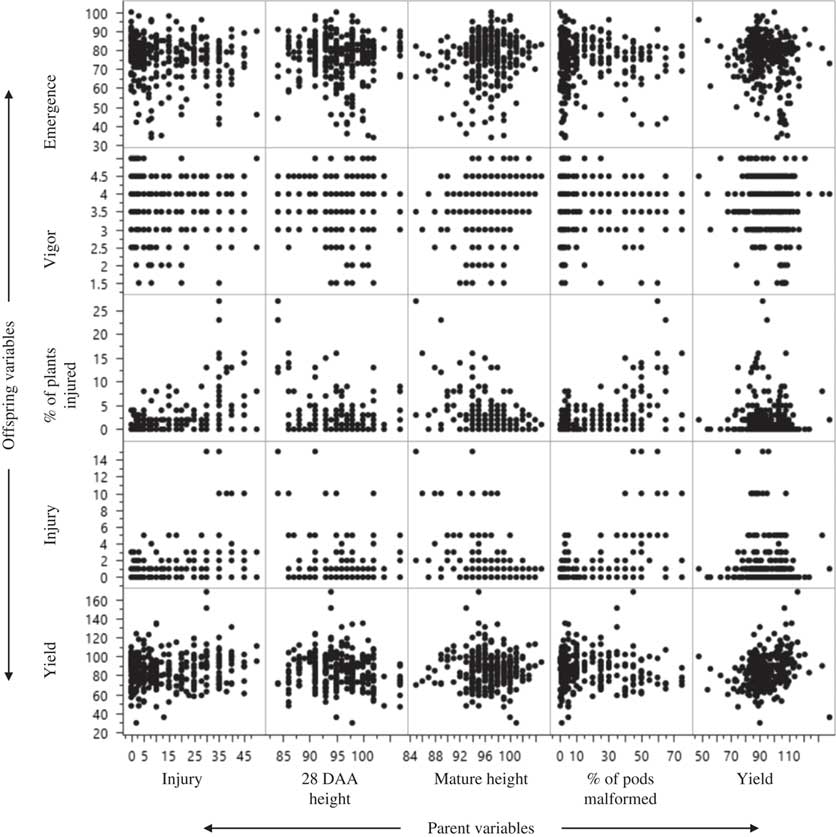
Scatter plot matrix for relationships between parent injury (% visible injury on a 0% to 100% scale, with 100% being plant death; stunting, leaf malformation, epinasty, and terminal inhibition were taken into account), 28 d after application (DAA) height (average height of 3 random plants later converted to % of check), mature height (average height of 3 random plants later converted to % of check), percent of pods malformed, and relative yield (%) and offspring emergence (% of planted seed emerged), vigor (1=extremely low vigor [slow initial growth with delayed emergence or reduced emergence of >60% under field conditions], 2=poor vigor [slow initial growth and 30% to 60% reduction in emergence in the field], 3=moderately low vigor [average initial growth with slight reduction in emergence likely under good field conditions], 4=moderately high vigor [average initial growth with slight reduction in emergence likely in fields having suboptimal conditions], 5=extremely high vigor [rapid emergence and growth of seedlings with emergence likely under a wide array of field conditions]), percent of injured plants (meaning the number of plants injured in the plot were divided by the total number of emerged plants and converted to % of plants showing malformation), injury (% visible injury on a 0% to 100% scale, with 100% being plant death; stunting, leaf malformation, epinasty, and terminal inhibition were taken into account), and relative yield (%) for R1 drift trials.
R2 Drift Events
A delay in drift events until R2 provided nine significant linear correlations between parent and offspring variables (Table 2). Soybean parent leaf malformation at 28 DAA was significantly correlated with offspring injury (r=0.46, P=<0.0001) and percent of offspring plants injured (r=0.47, P=<0.0001). Scatter plots visually document that increased parent leaf malformation leads to an increased risk for offspring injury and percent of plants injured (Figure 3). Although previous research has documented that visible estimates of injury from dicamba may be a poor indicator and may overestimate yield loss (Egan et al. Reference Egan, Barlow and Mortensen2014), these data reveal that increased leaf malformation to parent plants after exposure at R2 is a reliable indicator of the likelihood of dicamba-like symptomology being observed in the subsequent offspring.
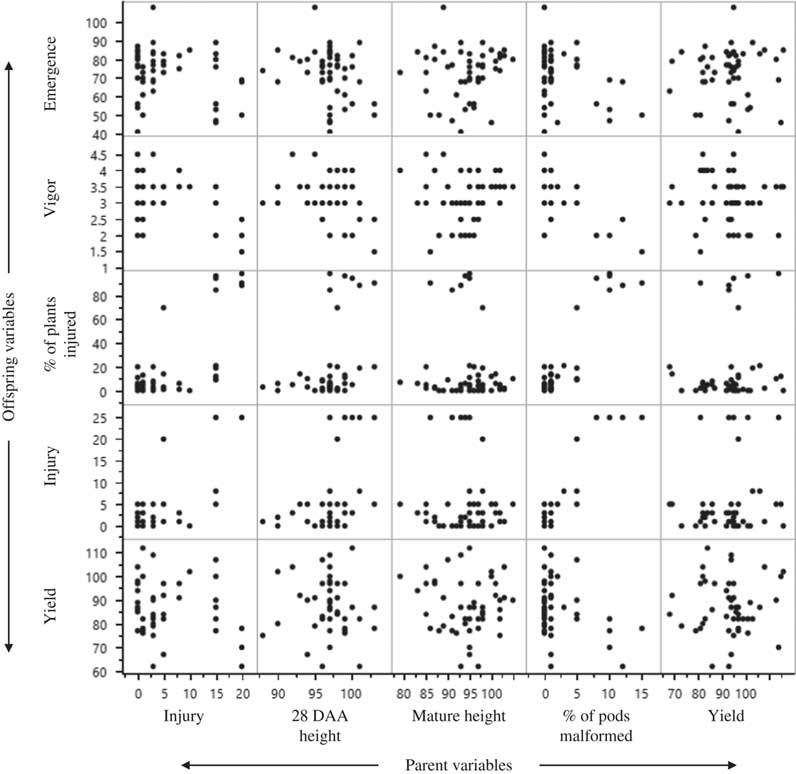
Scatter plot matrix for relationships between parent injury (% visible injury on a 0% to 100% scale, with 100% being plant death; stunting, leaf malformation, epinasty, and terminal inhibition were taken into account), 28 d after application (DAA) height (average height of 3 random plants later converted to % of check), mature height (average height of 3 random plants later converted to % of check), percent of pods malformed, and relative yield (%) and offspring emergence (% of planted seed emerged), vigor (1=extremely low vigor [slow initial growth with delayed emergence or reduced emergence of >60% under field conditions], 2=poor vigor [slow initial growth and 30% to 60% reduction in emergence in the field], 3=moderately low vigor [average initial growth with slight reduction in emergence likely under good field conditions], 4=moderately high vigor [average initial growth with slight reduction in emergence likely in fields having suboptimal conditions], 5=extremely high vigor [rapid emergence and growth of seedlings with emergence likely under a wide array of field conditions]), percent of injured plants (meaning the number of plants injured in the plot were divided by the total of emerged plants and converted to % of plants showing malformation), injury (% visible injury on a 0% to 100% scale, with 100% being plant death; stunting, leaf malformation, epinasty, and terminal inhibition were taken into account), and relative yield (%) for R2 drift trials.
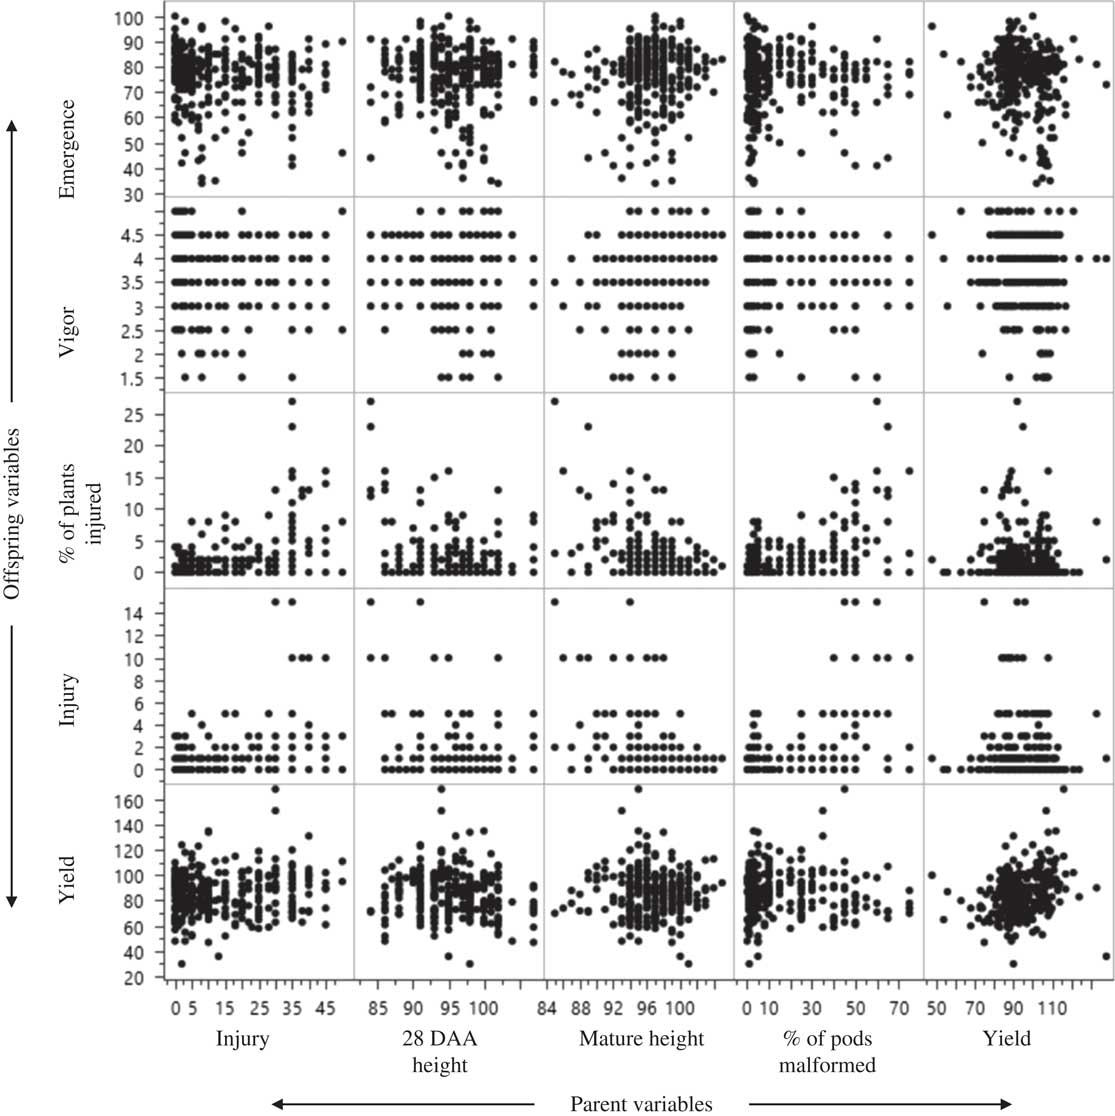
Parent height at 28 DAA and at maturity following an R2 dicamba drift event was correlated negatively with offspring injury (Table 2). Percent of offspring plants injury increased with a decrease in parent height at 28 DAA (r=−0.18, P=0.0011) and maturity (r=−0.39, P=<0.0001). As with R1 applications, it appears that parent height at maturity is a better indicator of possible effects on soybean offspring than height at 28 DAA. Soybean plants experience a decreased rate of vegetative growth as flowers begin to become an energy sink, and therefore, the effect on height reduction may not be realized until plants achieve maximum height.
The strongest correlation at the R2 growth stage existed between percentage of parent pods malformed and the offspring variable injury (r=0.59, P ≤ 0.0001) (Table 2). These findings document that a dicamba drift event before pod-forming stages may result in an excessive amount of injury in offspring. Dicamba drift onto R2 soybean resulted in up to 75% of pods being malformed nearest the source of the drift (unpublished data). Pod malformation may increase at this stage as a soybean plant is exposed to increasing amounts of dicamba, because more dicamba will remain active in the plant through the pod-forming stages. It is thought that nonmetabolized dicamba present in the plant after pod formation will likely be transported to the seed during seed-filling stages (Thompson and Egli Reference Thompson and Egli1973). Thus, a high number of malformed pods resulting from an R2 drift event is predictive of injury to offspring.
R3 Drift Events
Thompson and Egli (Reference Thompson and Egli1973) documented offspring trifoliate injury to increase 2-fold when low doses of dicamba were applied to parent plants during pod-forming stages compared with flowering. With an actual dicamba drift event, maximum percentage of offspring injured increased from 11% after R1 events to 50% after R3 drift events (unpublished data). Our assumption is that with delayed drift exposure, soybean has less time to metabolize dicamba before it is moved to the sink once seed fill begins.
Percentage of malformed parent pods displayed the highest correlation coefficients for offspring vigor, injury, and percentage of plants injured (Table 2; Figure 4). As with R2 drift events, parent plants exposed to R3 drift events displayed extensive pod malformation, from 0% to 70% depending on distance from the drift event (unpublished data). The vast range of pod malformation aided in picking up correlations among offspring variables when even slight changes in injury and vigor were noticed. Based on these data, the amount of pod malformation seen after an R3 drift event could be used to assess the likelihood of soybean offspring having reduced vigor and dicamba-like symptoms.
Scatter plot matrix for relationships between parent injury (% visible injury on a 0% to 100% scale, with 100% being plant death; stunting, leaf malformation, epinasty, and terminal inhibition were taken into account), 28 d after application (DAA) height (average height of 3 random plants later converted to % of check), mature height (average height of 3 random plants later converted to % of check), percent of pods malformed, and relative yield (%) and offspring emergence (% of planted seed emerged), vigor (1=extremely low vigor [slow initial growth with delayed emergence or reduced emergence of >60% under field conditions], 2=poor vigor [slow initial growth and 30% to 60% reduction in emergence in the field], 3=moderately low vigor [average initial growth with slight reduction in emergence likely under good field conditions], 4=moderately high vigor [average initial growth with slight reduction in emergence likely in fields having suboptimal conditions], 5=extremely high vigor [rapid emergence and growth of seedlings with emergence likely under a wide array of field conditions]), percent of injured plants (meaning the number of plants injured in the plot were divided by the total of emerged plants and converted to % of plants showing malformation), injury (% visible injury on a 0% to 100% scale, with 100% being plant death; stunting, leaf malformation, epinasty, and terminal inhibition were taken into account), and relative yield (%) for R3 drift trials.

R5 Drift Events
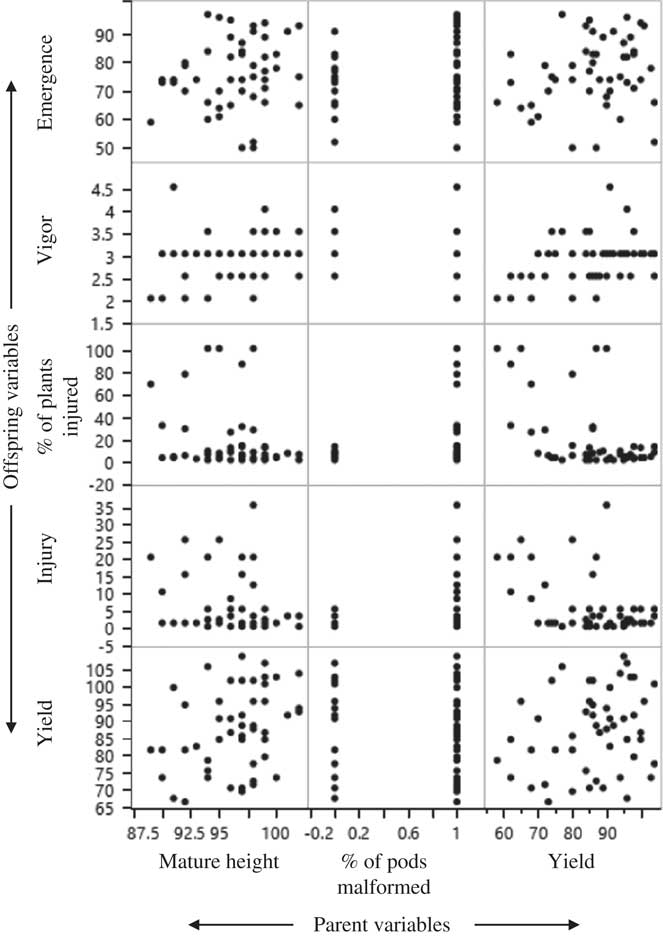
Drift events at R5 resulted in a significant correlation between parent pod malformation and offspring emergence (r=−0.37, P=0.0082), which was the only occurrence of a relationship with offspring emergence in these experiments (Table 2; Figure 5). It may be that the presence of dicamba at the beginning of seed formation allowed for more dicamba to be moved to the seed, resulting in a concentration high enough to reduce emergence. In other research, soybean exposure to a sublethal dose of dicamba at the R5 growth stage was shown to reduce germination of the offspring (Barber et al. Reference Barber, Norsworthy, Bond, Steckel and Reynolds2015).
Scatter plot matrix for relationships between parent injury (% visible injury on a 0% to 100% scale, with 100% being plant death; stunting, leaf malformation, epinasty, and terminal inhibition were taken into account), 28 d after application (DAA) height (average height of 3 random plants later converted to % of check), mature height (average height of 3 random plants later converted to % of check), percent of pods malformed, and relative yield (%) and offspring emergence (% of planted seed emerged), vigor (1=extremely low vigor [slow initial growth with delayed emergence or reduced emergence of >60% under field conditions], 2=poor vigor [slow initial growth and 30% to 60% reduction in emergence in the field], 3=moderately low vigor [average initial growth with slight reduction in emergence likely under good field conditions], 4=moderately high vigor [average initial growth with slight reduction in emergence likely in fields having suboptimal conditions], 5=extremely high vigor [rapid emergence and growth of seedlings with emergence likely under a wide array of field conditions]), percent of injured plants (meaning the number of plants injured in the plot were divided by the total of emerged plants and converted to % of plants showing malformation), injury (% visible injury on a 0% to 100% scale, with 100% being plant death; stunting, leaf malformation, epinasty, and terminal inhibition were taken into account), and relative yield (%) for R5 drift trials.

Percentage pod malformation of parent plants was significantly correlated with more offspring variables than any other parent variable. However, percentage of parent pods malformed was only 0% to 15%, which likely led to the steeper correlations (unpublished data). The decrease in pod malformation from 75% and 70% maximums at R2 and R3 to 15% at R5 (unpublished data) can be explained by the sink at the time of application. At R2, plants have yet to start pod formation, and R3 marks only the presence of a 0.5-cm pod on the upper four nodes, whereas R5 denotes the completion of pod formation and the beginning of seed growth (although the plant continues to flower and produce pods/seeds near the terminals). Dicamba remaining in the soybean plant after R2 and R3 exposure has the capacity to disrupt pod formation to a much greater extent than after R5 exposure, as pod formation has concluded by R5. However, pod malformation was still seen after R5 exposure due to the indeterminate growth habit of the soybean variety. Malformed pods were seen only in the uppermost nodes that were still showing growth. Furthermore, with the drift event occurring after most pods were formed, dicamba could rapidly move to the seed. Thus, an increase in the number of malformed offspring would be expected. In fact, the maximum number of plants injured per plot increased from 50% after R3 drift events to 99% after R5 drift events (unpublished data). Therefore, after an actual dicamba drift event at the R5 growth stage, high numbers of malformed parent pods may indicate the likelihood for more offspring plants to display abnormal growth and a higher percentage of offspring injury, as well as a possible decrease in offspring vigor and emergence.
R6 Drift Events
Parent injury and canopy heights at 28 DAA could not be recorded after R6 drift events, as leaf drop had started to occur approximately 2 wk after application and plants were mature in most cases at 28 DAA. Lack of growth after initiation of drift events to R6 soybean likely led to the absence of significant correlations with parent pod malformation and mature height. Furthermore, injury was observed only in plots within 24 m from the drift event. Parent mature height was reduced by a maximum of only 11% after R6 application, whereas earlier applications reduced mature height by as much as 61% (unpublished data). Parent pod malformation was nearly nonexistent and only ranged from 0% to 1% (Figure 6).
Scatter plot matrix for relationships between parent mature height (average height of 3 random plants later converted to % of check), percent of pods malformed, and relative yield (%) and offspring emergence (% of planted seed emerged), vigor (1=extremely low vigor [slow initial growth with delayed emergence or reduced emergence of >60% under field conditions], 2=poor vigor [slow initial growth and 30% to 60% reduction in emergence in the field], 3=moderately low vigor [average initial growth with slight reduction in emergence likely under good field conditions], 4=moderately high vigor [average initial growth with slight reduction in emergence likely in fields having suboptimal conditions], 5=extremely high vigor [rapid emergence and growth of seedlings with emergence likely under a wide array of field conditions]), percent of injured plants (meaning the number of plants injured in the plot were divided by the total of emerged plants and converted to % of plants showing malformation), injury (% visible injury on a 0% to 100% scale, with 100% being plant death; stunting, leaf malformation, epinasty, and terminal inhibition were taken into account), and relative yield (%) for R6 drift trials.
Relative yield of offspring was reduced by as much as 42% at R6 and was the only parent variable to be correlated with offspring variables. As the relative yield of parent plants decreased, so did offspring vigor (r=0.41, P=0.0028) (Table 2). Reductions in offspring injury (r=−0.43, P=0.0016) and percent of plants injured (r=−0.49, P=0.0028) were documented when parent relative yield was increased (Figure 6). Yield reduction may occur for a multitude of reasons, and this research documents that dicamba exposure to soybean at R6 may not show dicamba symptomology. For these reasons, dicamba exposure to soybean at R6 may be most worrisome to the seed production industry. General germination tests may not identify dicamba exposure, because offspring of soybean exposed to drift events at R6 did not have a noticeable reduction in emergence. If dicamba exposure is suspected, soybean offspring may need to be grown to the V1 to V2 stages to examine whether leaf malformation will appear.
Practical Implications
It is possible that the replanting of this study later in summer may have resulted in better growing conditions than those early in the spring; therefore, an even greater difference in vigor may result under less than ideal growing conditions following planting. Yield loss is perhaps the most important variable for most growers. The replanting of these trials coincided more with a double-crop planting date, likely resulting in reduced yield from full-season planting dates. Typically, double-crop soybean is planted in narrow rows to maximize yield, as reduced vegetative growth will occur when compared with full-season soybean (Harder et al. Reference Harder, Sprague and Renner2007; Johnson et al. Reference Johnson, Bailey, Wilson, Holshouser, Herbert and Hines2002). It is likely that a decrease in row spacing would have increased the capacity to yield by increasing leaf area index and shortening the amount of time until soybean canopy formation (Burnside Reference Burnside1979; De Bruin and Pedersen Reference De Bruin and Pedersen2008; Harder et al. Reference Harder, Sprague and Renner2007). Further research is needed to examine the relationship between offspring yield after parent exposure to dicamba.
The potential to have dicamba applied near fields of soybean that are already in reproductive stages is high in the midsouthern United States. In Arkansas, soybean has a wide window of planting time that ranges from April through July (USDA-NASS 2010). Therefore, early-planted soybean in reproductive development could be in close proximity to late-planted double-crop soybean in early stages of vegetative development. Hence, applications of dicamba to DR double-crop soybean would take place at a time when neighboring early-season soybean is in reproductive stages. It is well known that soybean is highly sensitive to dicamba, and this research documents that effects may be transmitted to offspring from actual drift events at reproductive stages.
One instance of concern is dicamba drift onto seed production fields. Dicamba symptomology was not readily visible when actual drift events occurred at seed-filling stages. For example, there was an overall reduction in parent leaf malformation caused by dicamba drift with progression of soybean maturity, as seen in Figures 2 to 6. Therefore, exposure to dicamba may not be realized without close inspection of fields during reproductive development. Subsequent germination tests may pick up seed exposed to higher rates of dicamba, as documented in previous research (Auch and Arnold Reference Auch and Arnold1978; Thompson and Egli Reference Thompson and Egli1973). However, these actual drift events only produced one significant relationship with offspring emergence, which occurred with parent pod malformation at R5 timing. Therefore, it is possible for contaminated seed to germinate normally, yet still display auxin-like symptomology after germination. Thus, seeds that have been unknowingly exposed to a dicamba drift event may be distributed to growers, and after emergence, plants may display dicamba-like symptoms and cause growers to place blame on others.
Although there is a need for DR technology to provide diversity in soybean weed control programs and to manage resistant weeds, the risk for damage to neighboring non-DR soybean fields and contamination of seed production fields is present. Previous studies have documented the dangers of dicamba to soybean seed production on a small scale with direct application; however, these experiments document that those effects can also be seen after actual dicamba drift events and that extreme caution is needed when applying dicamba in the vicinity of non-DR soybean.
Acknowledgments
This research was funded by the Arkansas Soybean Promotion Board. No conflicts of interest have been declared.


 Open access