


1. Background
Nine out of ten people worldwide breathe polluted air, with one out of nine deaths in 2012 attributed to air-pollution related conditions (WHO, 2016a). Air pollution represents the most significant environmental risk to health. Developing countries experience the worst of both household air pollution resulting from biomass fuels for cooking and the air pollution resulting from industry and transport. While it is widely recognised that outdoor air pollution levels in developing countries often exceed the World Health Organization (WHO) guidelines, India among other developing countries suffers severely due to household air pollution (HAP) arising primarily from biomass cooking fuels (Smith et al., Reference Smith, Bruce, Balakrishnan, Adair-Rohani, Balmes and Chafe2014; Jeuland et al., Reference Jeuland, Pattanayak and Bluffstone2015b). Approximately 3 billion people, mostly in low-income countries, continue to use solid fuels (fuelwood, animal dung and crop waste) for cooking and heating (WHO, 2014), contributing to both deforestation (Bailis et al., Reference Bailis, Drigo, Ghilardi and Masera2015) and global climate change (Ramanathan and Carmichael, Reference Ramanathan and Carmichael2008).
India and China together constitute more than 50 per cent of the world population still using solid fuels, with another 21 per cent living in Sub-Saharan Africa (Jeuland et al., Reference Jeuland, Pattanayak and Bluffstone2015b). The concentrations of HAP in biomass fuel using households are even higher than the high levels of urban outdoor air pollution. The typical 24-hour concentration of $PM_{10}$ (particulates smaller than 10 microns in diameter) in homes using biomass as fuels may range from 200 to 5000 $\mu g/m^{3}$
 or more, depending on the type of stove, fuel and housing (Ezzati and Kammen, Reference Ezzati and Kammen2002; Laumbach and Kipen, Reference Laumbach and Kipen2012). Since the pioneering work of Smith (Reference Smith1988) in epidemiology, it is believed that exposure to high levels of HAP causes substantial health effects in developing countries (Naeher et al., Reference Naeher, Brauer, Lipsett, Zelikoff, Simpson, Koenig and Smith2007; Smith, Reference Smith2013).
Exposure to air pollution results in a wide range of acute and chronic health outcomes ranging from minor physiological changes to death from respiratory and cardiac diseases (Bascom et al., Reference Bascom, Bromberg, Costa, Devlin, Dockery and Frampton1996; Dominici et al., Reference Dominici, McDermott, Zeger and Samet2003; Gauderman et al., Reference Gauderman, Urman, Avol, Berhane, McConnell and Rappaport2015, Reference Gauderman, Vora, McConnell, Berhane, Gilliland and Thomas2007). Epidemiological studies (Ezzati and Kammen, Reference Ezzati and Kammen2002; Salvi and Barnes, Reference Salvi and Barnes2009; Lozano et al., Reference Lozano, Naghavi, Foreman, Lim, Shibuya and Aboyans2012; Mannucci and Franchini, Reference Mannucci and Franchini2017) have estimated that in addition to ambient (or outdoor) air quality, there is robust evidence that HAP poses a serious threat to human health, especially in low-income countries that still use biomass fuels as an energy resource. The WHO estimated that air pollution was responsible for nearly seven million deaths every year, with 4.3 million due to HAP (WHO, 2014). Women and young children bear a disproportionately large burden of mortality, with 500,000 children under five that die due to acute respiratory infections (Langbein, Reference Langbein2017).
In addition to exposure to outdoor and household air pollution, workplace exposure could pose a potential risk to health. Millions of workers in a variety of occupations, such as mining, construction and abrasive blasting, are exposed to high levels of airborne dust particles. Inhalation of these particles may cause respiratory diseases such as bronchitis, silicosis and pneumoconiosis. Prevalence rate or trends in occupational respiratory problems in developing countries are mostly unknown, but the magnitude of the problem could be substantial (WHO, 2016b). The exposure to work-related pollution in our study includes a source of pollution not studied often, which is mining.
Jeuland et al. (Reference Jeuland, Pattanayak and Bluffstone2015b), in their review of HAP at a global level, used a conceptual model. Our attempt is to use a conceptual model in this specific, local context. In this study, we conceptualize an integrated framework to estimating cumulative exposure to air pollution over time and space that results in poor health, irrespective of whether it originates in a stove or a mine. Pollution is not only caused by mining and associated transport, but also by the combustion of fuels for cooking in the household. We estimate the simultaneous exposure to both outdoor and household air pollution by measuring pollutant concentrations and time spent in each location. We develop a model borrowing from conceptual foundations in environmental health sciences and the economics of households in developing countries. Specifically we draw from health production models (Harrington and Portney, Reference Harrington and Portney1987), agricultural household models (Singh et al., Reference Singh, Squire and Strauss1986), and a branch of environmental health sciences called Total Exposure Assessment (Smith, Reference Smith1993). Our analytical model examines the relationship between the cumulative exposure to air pollution from outdoor and cooking sources of individuals in a rural household in a developing country and their health. The empirical implementation of this framework that incorporates both household and outdoor air pollution required the use of a household questionnaire which included time budget questions, measurement of air pollution concentrations in different micro-environments, health diaries for self-reporting ailments and doctor visits, and clinical measurements of respiratory health.
Total exposure is the result of people spending time in different micro-environments (for example, indoors, in the kitchen, and outdoors) with different levels of air pollution concentration levels. Pitt et al. (Reference Pitt, Rosenzweig and Hassan2006) stressed the importance of gathering data on time allocation across different micro-environments. They used micro-data to examine how household structure affects the distribution of cooking time among women in rural Bangladeshi households, and the health effects of cooking time, as a proxy for exposure to HAP. Our study takes it further by unpacking the micro-environments into outdoor, indoor and work besides the kitchen. We chose a region where pollution due to iron ore mining and transportation activity heavily contributes to outdoor air quality, to study the relationship between cumulative exposure in different micro-environments and health.
The exposure is cumulative and over time leads to higher susceptibility to respiratory problems. As we aimed to study the relationship of total exposure with air pollution, we chose to study a region that characterises both household and outdoor air pollution in India. We collected data from regions which had varying levels and lengths of mining activity in Goa, India. In Goa, we studied this process in different mining clusters, with different levels of cumulative exposure among the population. The paper firstly examines the socio-economic correlates of time spent in polluting environments by individuals, followed by the choice of cooking fuel by households. We unpack the contributors to cumulative exposure, by apportioning it to different micro-environments, time spent in these environments and the type of fuel used. We finally examine the relationship between cumulative exposure to air pollution and respiratory health indicators.
We find that gender and age are associated with the time spent by individuals indoors, in the kitchen and outdoors, with middle-aged women spending much time cooking. We find that households in regions with higher mining activity had higher incomes on average and a higher proportion of cleaner fuels (LPG) used for cooking. Active mining clusters which experienced higher outdoor pollution levels had a significantly lower proportion of households that used polluting biomass fuels for cooking. In other words, HAP from biomass fuels is substituted with outdoor air pollution in regions with higher economic activity. Finally, we find that higher cumulative exposure is associated with higher levels of morbidity: (a) reported health measures are respiratory sick days and chronic respiratory sick days, and (b) observed clinical health measures are the doctor's diagnosis of the X-rays and lung function tests. Our use of two methods to measure health indicators – self-reported health and clinical examination – strengthens the validity of our results.
In section 2, we describe our study area and examine our data. In section 3, we develop our theoretical model and present our results in section 4. We discuss the results and conclude in section 5.
2. Study area and data
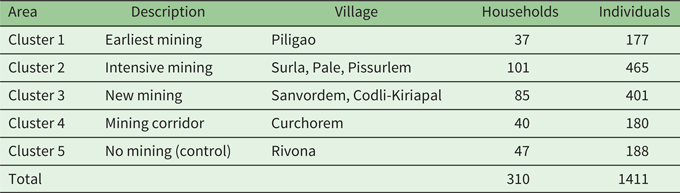
Our study area was the heavily iron ore mined regions of Goa, India. Iron ore mining was an integral part of the state's economy for almost fifty years and contributed to 60 per cent of India's iron ore exports at the time of the study (2003). Given the scale of iron ore mining in Goa and the documented environmental issues, it was an ideal setting to study total exposure to air pollution.Footnote 1 For the purposes of this study, we divided the mining regions of Goa into five clusters, including a control cluster with no mining activity at the time of data collection between June 2003 and May 2004. These clusters were chosen to have varying vintage and levels of mining activity. Cluster 1 was the mining region with the earliest mining activity (over 40 years at the time of the study) but where the activity had subsided relative to Cluster 2, the most intensively mined cluster, where mining had begun approximately 25 years prior to this study. Cluster 3 was the region where mining activity was relatively at its inception, having begun 15 years prior to the study. Cluster 4 was the mining corridor, that is, the region where trucks transported the ore from the mines to the barges or the coast. Cluster 5 was the control region that was away from the mining region and with no history of mining activity at the time of this study.
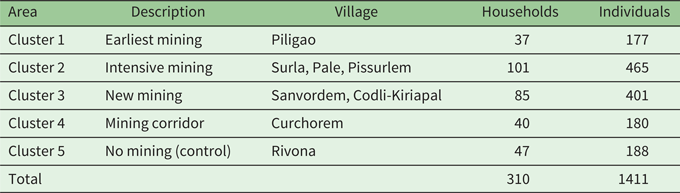
Table 1 presents the distribution of villages and the sample size of households and individuals selected for the study. We first selected the regions to represent the levels of mining activity across the state, and then randomly chose both the villages and (within these villages) the households from the census of the households. We surveyed 310 households and 1411 individuals from these households in the five clusters for a detailed assessment of individual and household characteristics, concentrations of pollutants ($PM_{10}$ ) in the micro-environments, and clinical and reported health measures.
Sample size distribution across villages and clusters
The survey questionnaire had two modules: household and individual. Both questionnaires were conducted as a personal interview between the enumerator and the individuals, including the head of the household, who also responded to the household questionnaire. The questionnaires were translated into the local language and pilot tested before the actual surveys were carried out by trained enumerators (mostly local social workers).
2.1. Household survey
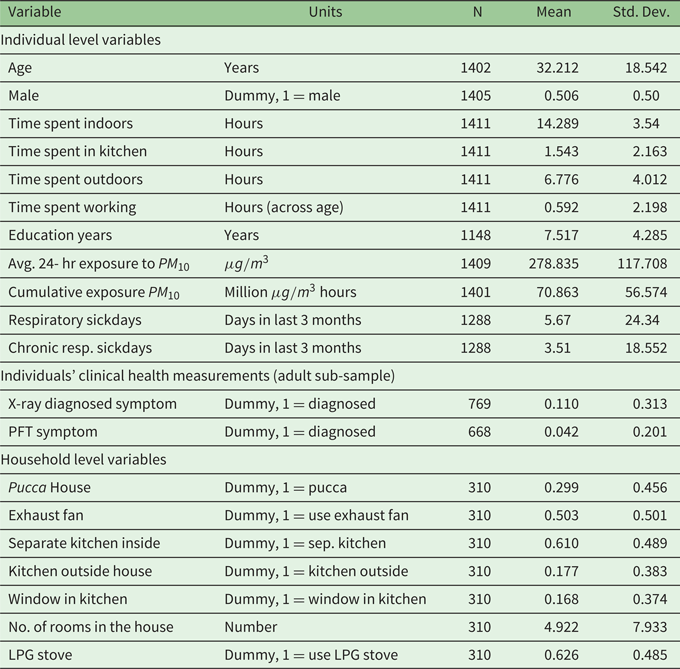
The first survey in the sampled households was administered to the head of the household and included questions eliciting demographic information, household income, housing characteristics (such as number of rooms, whether the kitchen has windows or exhaust fan), fuel and stove types (see the online appendix for the questionnaires and health diaries). Table 2 presents the summary statistics of the household characteristics used in the empirical analysis.
Summary of variables used in regressions
2.2. Individual survey
The individual survey was conducted with each member of the household to gather detailed information on smoking status, occupation, time spent in each micro-environment and health status. We used the standardized respiratory health questions of the British Medical Research Council. For children (those aged 15 or below) the individual surveys and time activity information was collected from their mothers (or primary caretakers). The surveys used the recall method to ascertain the specific health problems in the last three months that were self-reported by the individuals, including doctor visits and fees. Given the focus on respiratory health in this study, illnesses reported in the individual survey were classified into three groups by the cardio-respiratory specialist, namely: (1) upper respiratory (illnesses and symptoms related to the upper respiratory tract that could be linked to air pollution, but not necessarily prolonged exposure); (2) lower respiratory (chronic illnesses related to the lower respiratory tract that are likely to occur as a result of prolonged exposure to air pollution); and (3) all other illnesses. In our main estimations, we use the sick days attributed to upper respiratory illness as respiratory sick days and the sick days from lower respiratory illness as chronic respiratory sick days (Cooper et al., Reference Cooper, Sridharan, Uma, D'Souza, Murugesan and Dayal2006).
The time budget (or time spent in the various micro-environments) of these individuals in a day was collected through the individual questionnaire. Responses were further verified by a field assistant when making household measurements. In addition, subjects in each household were provided health diaries (in Marathi, the local language) and asked to record details on type and days of illness, visits to the doctor, doctor fees, work lost and cost of treatment. Table 2 summarizes the key individual level information collected.
2.3. Air pollution measurement
The air pollution monitoring component of the study measured the exposure to both outdoor and household air pollution of the individuals from the sampled households. Environmental monitoring and the time budget survey of individuals for the exposure assessment were carried out for the study (between May 2003 and April 2004). A preliminary survey was conducted which aided in identifying the essential micro-environments necessary for estimating daily exposure. Four micro-environments were selected for the study: (1) indoor or living room, (2) cooking area during cooking, (3) outdoor or ambient, and (4) work area (including mining workers and truck drivers). The assessment of daily exposure entailed measuring concentrations of $PM_{10}$ (respirable suspended particulate matter or RSPM) in these micro-environments. RSPM in cooking and living room micro-environments was collected on a conditioned and pre-weighed filter paper using low volume universal pump (SKC, UK). In the living room, sampling was done for a period of 24 hours in all the sampled households. In the cooking micro-environment, monitoring was carried out for a subset of households during the cooking period (covering 2 or 3 meals cooking in a day) which typically was about 2 to 3 hours in a day.
Outdoor air samples were collected through high volume air samplers (Envirotech, India). The outdoor concentrations were measured in three locations in each of the four mining clusters. One location was chosen for outdoor concentration measurement in the control cluster. The sampling in each location was continuous for three days in two seasons, and the filters were replaced every 8 hours. After sampling, RSPM levels were calculated by the gravimetric method (difference in the weight of filter paper after sampling divided by volume of air sampled). The daily 24-hour average concentration was derived for each cluster from this data. RSPM sampling in the workplace was carried out for working hours in a day (about 8 hours) with a low volume personal air sampler (SKC, UK) for a sub-sample of 18 subjects working in mining-related occupations.
2.4. Health tests and diagnosis
The clinical measures were conducted by trained technicians in local clinics for a sub-sample of individuals from the sampled households. We collected data on the chest X-rays for 769 adults (900 including children) and pulmonary lung function test (PFT) for 668 adults (782 including children). The chest X-ray and PFT reports were analyzed and diagnosed by a cardio-respiratory health specialist for chronic respiratory symptoms. The X-rays are expected to highlight the impacts of long-term exposure while PFT measures lung efficiency/capacity at the time of the test. We use the specialist's interpretation of the reports by creating dummy variables: X-ray symptom (equals 1, if diagnosed “not normal”) and PFT symptom (equals 1, if PFT results were diagnosed as “not okay”). The X-ray reports were provided to the subjects after the radiologist's and specialist's diagnosis.Footnote 2
Table 2 includes summary statistics of the individual characteristics, average 24-hr pollution exposure to $PM_{10}$ , respiratory sick days, clinical tests and medical diagnosis. In our sample, the mean age was 32 years and 50 per cent were male. Eleven per cent of the X-ray reports were diagnosed with respiratory problems and just over 4 per cent had below normal PFT measurements.
2.5. Fuel usage
In the overall sample, the fuel categories of biomass only, liquefied petroleum gas (LPG) only, and biomass and LPG account for almost equal proportions (table 3). However, there are sharp contrasts in the shares of fuels among the clusters. As expected, the control cluster, which is a relatively less connected region, has a very high proportion of households (79 per cent) that use biomass fuels only. In contrast, the corridor cluster, with better road connectivity and where we would expect the highest LPG availability, has the highest proportion of LPG only users (68 per cent). Clusters 1, 2 and 3 exhibited lower LPG usage than the corridor (but higher than the control region) and lower biomass only use compared to the control cluster (but higher than the corridor). The control cluster also had the highest number of kitchens located outside the house, while the corridor had the least. The mean income in the corridor was the highest (lowest in the control region) and the corridor correspondingly has the highest percentage of separate kitchens inside the household (the control the lowest). The income distributions among clusters observed in table 3 partly explain the fuel usage patterns, where the households with higher income (mining activity regions) had higher usage of cleaner fuels compared to the control cluster which had the lowest mean income.Footnote 3
Fuel usage, income and concentration across clusters (%)
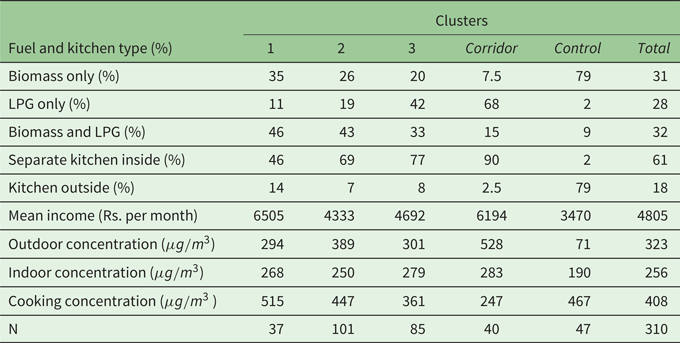
Note: Indoor concentration was measured in each household; outdoor in three locations per cluster.
Cooking concentration was measured in a sub-sample for each fuel type which was used to estimate the household concentration based on the fuels used. The fuel use percentages do not add up to 100% as some households did not have a kitchen (or do not report cooking).
Table 3 also shows that the outdoor air quality (discussed in detail in the next subsection) was the worst in the corridor, more than seven times higher than the control. Due to high LPG usage, the cooking concentration is the lowest among households in the corridor. Note that the indoor concentration will be affected both by outdoor air quality (due to infiltration) as well as cooking. The high concentration of $PM_{10}$ indoors among households in the corridor region (despite having the lowest cooking concentration) suggests that infiltration of pollutants from the outside can affect indoor air quality.
2.6. Air quality and exposure
We construct the total 24-hr exposure for each individual by computing the exposure in each micro-environment (share of the day spent in the micro-environment $\times$ concentration in the micro-environment) and summing it over all the micro-environments. We measured outdoor at the village level and indoor in the living area of all households, while cooking measurements from a subset were used with information about the fuel choice in the household to get the cooking concentration.
Table 4 illustrates the data and calculations for one of the individuals (anonymized) in the sample. We multiply the concentration in each micro-environment by the time spent by the individual in each micro-environment in a day, to arrive at the 24-hr exposure (see the last column in table 4). We then divide the total 24-hr exposure by 24 hours to arrive at the average 24-hr exposure. Thus, the units of concentration and total exposure (this is a weighted average of concentrations, with weights being the fraction of time spent in each micro-environment) are the same, $\mu g/m^{3}$ . Although the workplace exposure was measured for those working in the mines, mining offices or driving, for most individuals in the sample, workplace exposure was not applicable (as in the case of the individual in table 4).
Illustration of total exposure calculation for an individual
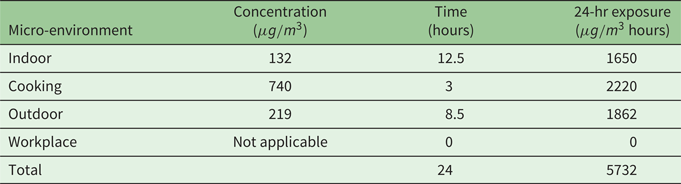
The average 24-hr exposure for this individual is equal to:

2.7. Cumulative exposure
The cumulative exposure to air pollution is the total 24-hr exposure to pollutants summed up over the years of residence for the individual in the regionFootnote 4 as:
Cumulative exposure$_{i}$ = total 24-hr exposure$_{i}\times 365 \times$
 exposure years$_{i},$
 which captures the accumulated exposure to air pollution over the years for each individual living in a particular environment which determines respiratory health. Therefore by construction, time spent in polluting micro-environments and their concentration will have a positive relationship with cumulative exposure. Biomass fuel usage will directly enter cumulative exposure via higher concentrations in the kitchen and indoor environment and correspondingly affect health (Das et al., Reference Das, Pedit, Handa and Jagger2018; Jeuland et al., Reference Jeuland, Soo J-S and Shindell2018; Pattanayak et al., Reference Pattanayak, Jeuland, Lewis, Usmani, Brooks and Bhojvaid2019).
Figure 1 captures the key argument of this paper. In the top panels of figure 1, we see that the distribution of outdoor concentration is very different from that of indoor concentration and cumulative exposure. In the far left scatter plot in the bottom panels of figure 1, in which we have plotted indoor concentration on the y-axis and outdoor concentration on the x-axis, we can see that there is a very low correlation between the two. Some observations are characterised by high values of indoor concentration and low values of outdoor concentration. This reinforces the claim that using either as a measure of exposure is inadequate. Outdoor concentrations only vary by cluster, and would be particularly inadequate, though their measurements would be reasonably accurate. Studies which focus on ambient (outdoor) concentration or household (indoor) air pollution in isolation may also fail to document the relationship between outdoor and indoor air quality in such a setting. In the other two scatterplots in the bottom panels of figure 1, we see that cumulative exposure has a weak positive relationship with outdoor concentration and a relatively stronger positive relationship with indoor concentration.
Relationship among concentrations (${\mu} g/m^{3}$ ) and cumulative exposure (million ${\mu} g/m^{3}$
 hours). Top row shows distributions of outdoor, indoor concentrations and cumulative exposure; bottom row shows scatterplots.
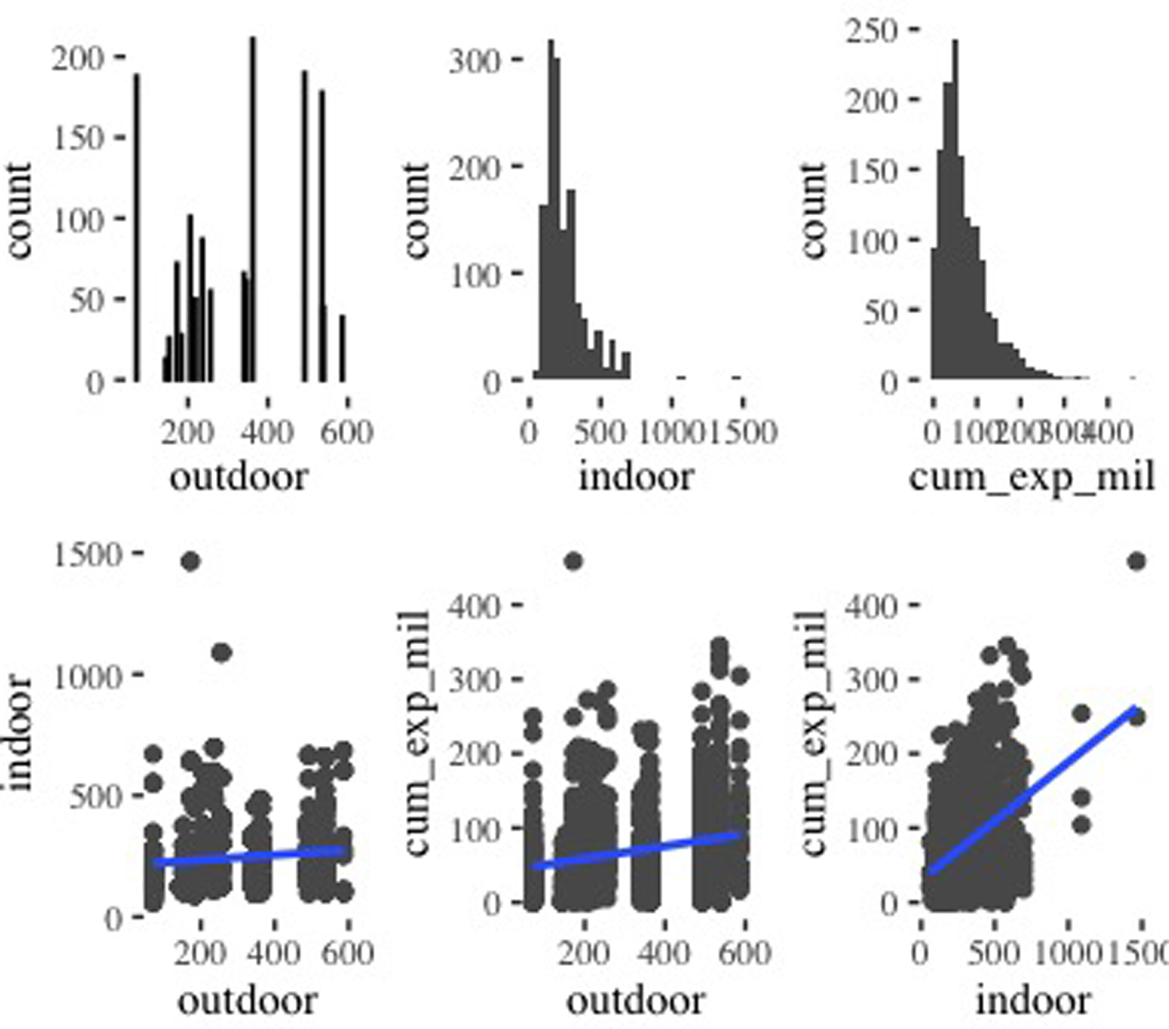
Table 5 presents the two sample t-test for difference of means in exposure for the four mining clusters compared to the control cluster. Outdoor exposure in column (1) is higher in all the clusters (with mining activity) compared to the control region (with no mining activity), with Cluster 4 (the mining corridor) recording the highest outdoor exposure. On the other hand, Cluster 3 and the Corridor have lower cooking exposure (column (3)) compared to the control region, due to a higher proportion of LPG usage. The average 24-hr exposure in column (4) is a weighted measure of exposure to different micro-environments and is higher for all four clusters compared to the control.
Difference in individuals’ exposure to $PM_{10}$ (vs. control)

Standard errors in parentheses; **$p<0.05$ , ***$p<0.01$
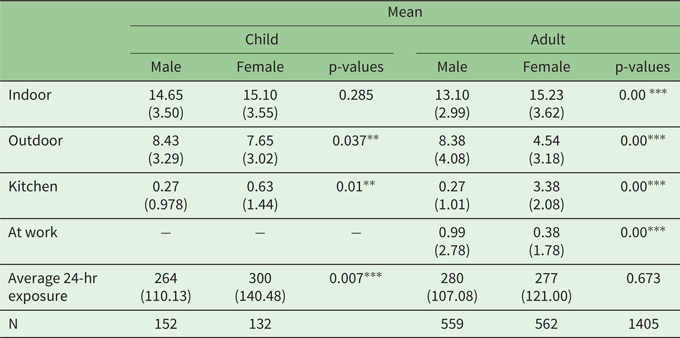
Table 6 reports the time spent in micro-environments as elicited in the individual recall survey. The field assistants were able to verify the reported time spent during the household air quality measurements, but this would not completely address the issues with recall methods. In the empirical results section, we discuss how we try to address this concern.
Time spent in micro-environments (hrs/day) and exposure
Standard deviation in parentheses; $^{\ast \ast }$ $p<0.05$
 , $^{\ast \ast \ast }$ $p<0.01$
 .
.
Men (adult males) spend 8.4 hours outdoors on average, and women (adult females) about half of that. Time spent by women in the kitchen on average is about 3.4 hours, while men on average spend less than half an hour. And yet, on average, the 24 hour average exposure is 280 micrograms per cubic metre for males and 277 for females, so total exposure balances out on average, in line with this paper's argument that we need to consider micro-environments together rather than separately.
3. The model
We now discuss how we conceptualize our theoretical model that accounts for exposure to air pollution across micro-environments. Jeuland et al. (Reference Jeuland, Pattanayak and Bluffstone2015b) use a conceptual model to help explain and think about issues in their excellent review of global HAP. We develop a model drawing on health production models (Harrington and Portney, Reference Harrington and Portney1987), agricultural household models (Singh et al., Reference Singh, Squire and Strauss1986), and a branch of environmental health sciences, Total Exposure Assessment (TEA) (Smith, Reference Smith1993). In health production models, health is an outcome of a production function. Agricultural household models try to model consumption and production activities of rural households in developing countries in the same model. TEA in the context of air pollution examines pathways from all sources of air pollution to exposure by humans.
We view the household model as an abstraction that captures key elements of HAP in Goa.Footnote 5 There is an obvious element of simplification and we note caveats at different points.
3.1. Theoretical model
We examine a household which consists of a child, an adult male and an adult female. We assume that a household aims to maximize its utility ($U$ ) which is a function of sickness ($S$
 ) experienced by the child (indexed by $C$
 ), the adult male (indexed by $AM$
 ) and the adult female (indexed by $AF$
 ), and non-food consumption $(C^{NF})$
 , so $U=U(S^{C},\,S^{AM},\,S^{AF},\,C^{NF}).$
We assume that sickness is a function of total exposure to air pollution ($E$ ), consumption of cooked food ($CF$
 ), doctor-visits ($D$
 ) and individual characteristics ($Z$
 ), so $S^{i}=S^{i}(E^{i},\,CF^{i},\,D^{i};Z^{i}),$
 where $i=C,\,AM,$
 and $AF$
 .
.
The kinds of sickness that result from poor nutrition and from household pollution are different. The knowledge of or beliefs in causes of sickness of different sorts is a key variable that influences the household's actions (Jeuland et al., Reference Jeuland, Pattanayak and Bluffstone2015b).
Total exposure is a weighted sum of exposure in different micro-environments, which in turn, are equal to the product of time spent in these micro-environments ($t$ ) and the concentrations of air pollution in these micro-environments ($e$
 ). We consider four micro-environments on which we have data: outdoors, indexed by $o$
 ; cooking, indexed by $c$
 ; work, indexed by $w$
 ; and indoors, indexed by $i$
 ,
,
$E^{i}=t_{o}^{i}e_{o}+t_{c}^{i}e_{c}+t_{w}^{i}e_{w}+t_{in}^{i}e_{in}.$
While the time spent in different micro-environments is person specific, the concentrations are not. To simplify, we assume that the time spent by the child in the four different micro-environments is the same as that of the adult female.
In our sample, almost all households cook with LPG or biomass. We take $t_{c}^{i}$ , the time in the cooking micro-environment, to be the sum of $t_{c}^{lpg}$
 and $t_{c}^{b}$
 , the time cooking with LPG and biomass, respectively. This is an approximation, since it is possible that LPG may be used with biomass at the same time. The key point though is that greater use of LPG is likely to reduce the amount of biomass burnt.
In our sample, cooking is mainly done by women, and so we assume that the adult female does the cooking. The concentration of air pollution in the cooking environment $(e_{c})$ is a function of the concentration outdoors (or ambient concentration) and the length and type of cooking, so

We note that the concentration outdoors will be influenced by the total cooking pattern in a village; most notably the contrast will be between a village where every household uses LPG only and a village where every household uses biomass only.
Similar to the concentration of air pollution in the cooking environment, the concentration indoors will depend on time cooking and the concentration outdoors, such that

The total amount of food cooked in the household is a function of the time spent cooking:

Equation (1) may give the impression that more cooked food requires more cooking time irrespective of fuel, but LPG cooking can reduce cooking time compared to biomass cooking.
$C_{F}^{i}$ , the amount of food consumed by each family member, is assumed to be some norm-based share $(\theta ^{i}\in \lbrack 0,\,1])$
 of the total amount of food cooked in the household. The amount of raw food consumed $(R_{F})$
 is assumed to be a linear function of the food cooked, $R_{F}=\eta _{1}C_{F},$
 where $\eta _{1}$
 is a constant; this is an approximation. With LPG we can quickly vary the intensity, from off to medium and high, but with biomass burning, it is more like a batch process. Similarly, the amount of fuel used ($q$
 ) is assumed to be a linear function of the time spent cooking:

We also assume that a certain proportion $(\eta _{4}\in \lbrack 0,\,1])$ of the biomass fuel is gathered and we assume that it is the adult female who gathers biomass fuel, $q^{BG}=\eta _{4}\eta _{3}t_{c}^{b}.$
The time spent in gathering this fuel $(t_{c}^{g})$ is proportional to the quantity to be gathered. This is an approximation; for example, the same person may gather the same amount of fuel from different locations at different times, taking different time to gather the same amount of fuel, because the gathering of fuel may be combined with some other activity, $(t_{c}^{g})=\eta _{5}\eta _{4}\eta _{3}t_{c}^{b}.$
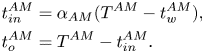
We assume, based on examining our data (see table 6 and associated discussion) that the amount an individual works is predetermined by the occupation of the person. In other words, the amount an individual works is not influenced by marginal cost and benefit considerations, and for this model, is predetermined. We assume that after cooking, working and gathering biomass, the adult female divides her remaining time in some given proportion $(\alpha _{AF})$ between the indoor $(t_{in}^{AF})$
 and outdoor micro-environments. Total time outside $(t_{o}^{AF})$
 is equal to remaining time spent outside and time gathering biomass,

Since the adult male does not cook or gather biomass, the expressions for time indoors and time outdoors are different in the case of the adult male,
The household maximizes utility subject to the following budget constraint:

by choosing $C_{NF},\,t_{c}^{lpg},\,t_{c}^{b}$ and $D^{i}.$
The first-order conditions are (denoting the Lagrange by L):

Equation (2) is the usual consumer theory condition for consumption and says that the marginal utility from an additional unit of consumption should equal the marginal cost in utility terms, which is the product of the multiplier and the price.

In equation (3) the marginal benefit of spending a unit of money on doctor visits of the $i^{\text {th}}$ person in the household is the marginal utility of lower sickness of the $i^{\text {th}}$
 person times the marginal product (in terms of lower sickness) from an additional doctor visit. The marginal cost is the price of a doctor visit multiplied by the multiplier, so that

A change in time spent cooking with LPG or biomass is associated with higher emissions and therefore higher exposure and sickness (of all members), and higher cooked food and therefore lower sickness. It will also entail greater cost concerning the gathering of biomass or expenditure on purchase of fuel and raw food. The household will have imperfect information about the effects of cooking on exposure. Moreover, cooking affects women and children more than adult males since they stay in the cooking micro-environment:

A change in time cooking has several effects on exposure, since it affects the time spent in different micro-environments (in the case of the adult female and the child) and the concentration in the indoor and cooking micro-environment. So, for example,

Our model is static for simplicity. However, in reality, what we witness today is the outcome of the past. Mining tends to follow a life-cycle, with the initial expansion of mining and economic activity in an area finally leading to a slowing down of mining as new areas are found and exploited. During this mining life-cycle, the economic context and the environment (of which air pollution is one indicator) of the households change. Moreover, human health is affected by cumulative exposure, especially in the case of chronic air pollution-related ailments. In our main estimations, we study the association between cumulative exposure and health.
4. Empirical analysis and results
Following from the theoretical model, our primary objective is to estimate the relationship between cumulative exposure to air pollution and measures of respiratory health. Secondly, we characterize the socio-economic associations of time spent in micro-environments with different pollutant concentrations, and of fuel-choice. We also estimate the relationship between fuel usage and concentrations in the micro-environments. We model our primary relationship between cumulative exposure to air pollution and respiratory health using the following regression equation:

where the dependent variable is the outcome of interest for individual $i$ , in household $h$
 , located in cluster $c$
 . The parameter of interest $\beta$
 is the coefficient on cumulative exposure levels. In equation (4), $I_{ihc}$
 refers to the individual level attributes including age, gender and education; $H_{hc}$
 refers to household characteristics like income. The $\lambda _{c}$
 represent cluster fixed effects. The dependent variables are either reported health measures or clinical health measures. Respiratory sick days (upper respiratory illness) and chronic respiratory sick days (lower respiratory illness) are the reported measures of respiratory health, while the specialist's diagnosis of respiratory issues based on the X-ray report and the lung function tests are our measures of observed clinical health. We use a reduced form estimation approach where the choice of control variables is guided by the theoretical model. We cluster standard errors in our estimates at the household level.
4.1. Time in micro-environments
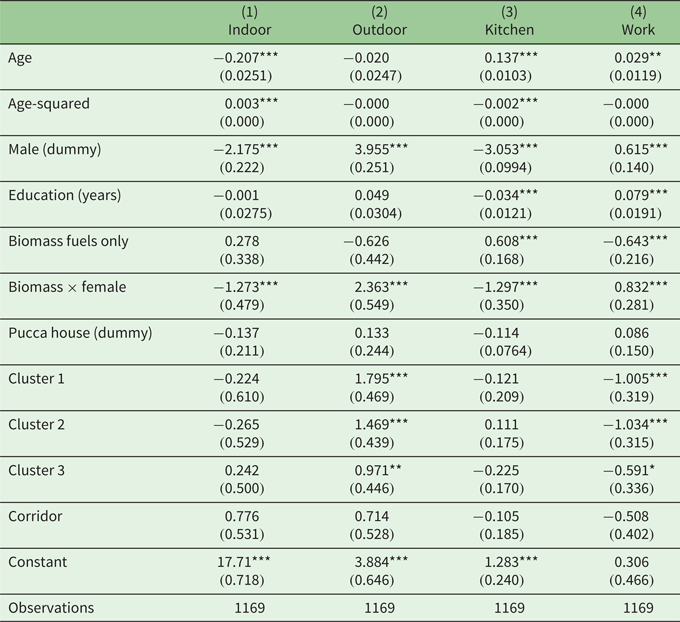
We begin by estimating the associations of time spent in micro-environments (reported in table 7), where we include biomass fuel usage and interact its usage with the female dummy along with the individual and household characteristics, as we discussed in theory (where we assumed that only females gathered biomass). The individual level attributes are age, age-squared, gender and never-smoker (dummy), and the household characteristics include the number of adults and children by gender and whether or not the house was pucca (constructed with solid materials as a permanent dwelling).
Time spent in micro-environments
OLS estimations at individual level; $^{\ast }$ $p<0.10$
 , $^{\ast \ast }$ $p<0.05$
 , $^{\ast \ast \ast }$ $p<0.01$
 .
.
Standard errors in parentheses and clustered at household level.
Other controls: number of adults and children (by gender).
Table 7 presents the results of regressions on the dependent variables of time spent: indoors, outdoors, in the kitchen and at work. We control for cluster level differences by including cluster dummies in our estimation. For time spent in the kitchen, we examine mean time spent in the kitchen by adults in the household. The time adults spend in the kitchen is expected to depend on the composition of adults and children, since one person can cook for several members. We therefore include the number of adults and children in the household by gender in these regressions.
Table 7 shows that age and gender are statistically significant regressors. Age is related negatively to time spent indoors, shown in column (1), but positively with time in the kitchen, shown in column (3). Males spent less time indoors and in the kitchen and more time outside the house or working. Age and education have a positive relationship with time spent working (column (4)). We call the reader's attention to the positive relationship between biomass fuel usage and time spent in the kitchen (column (3)). Also noteworthy is the positive relationship between biomass usage $\times$ female (dummy) on time spent outdoors (which is consistent with the assumption in our model that females spent time gathering biomass fuels).
4.2. Choice of fuel
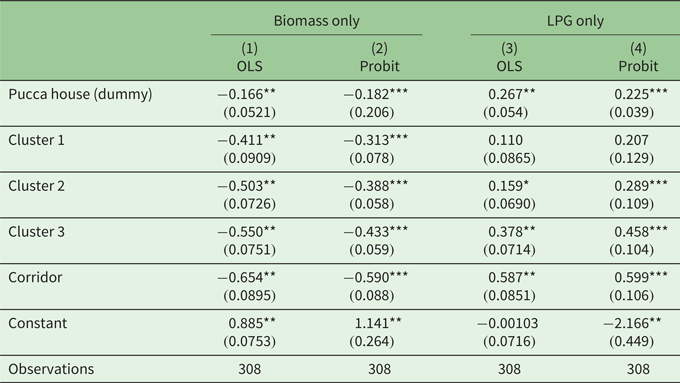
In table 8, we present the relationship between household characteristics and their choice of fuel, biomass or LPG. The unit of observation here is the household (N = 308) and we estimate a linear probability model.Footnote 6 As a robustness check, we estimated the models with a binary dependent variable using a maximum likelihood method and find similar results (see columns (2) and (4) in table 8).
Household fuel choice: biomass and LPG
Estimations at household level; probit marginal effects reported in columns (2) & (4).
Standard errors in parentheses; $^{\ast }$ $p<0.10$
 , $^{\ast \ast }$ $p<0.05$
 , $^{\ast \ast \ast }$ $p<0.01$
 .
.
Other controls: number of adults and children in the household (by gender).
The dependent variables in table 8 are households who used biomass or LPG for cooking. We include the cluster dummies in the specifications. The regressor pucca house (dummy) is negatively associated with biomass only used for cooking – columns (1) and (2) – and positively for LPG only – columns (3) and (4), as pucca house proxies for higher income households. As expected, all four (mining-related) clusters are negatively associated with biomass only used for cooking compared to the control cluster. Except for Cluster 1, the other three mining clusters are more likely to be using LPG for cooking.
4.3. Health indicators
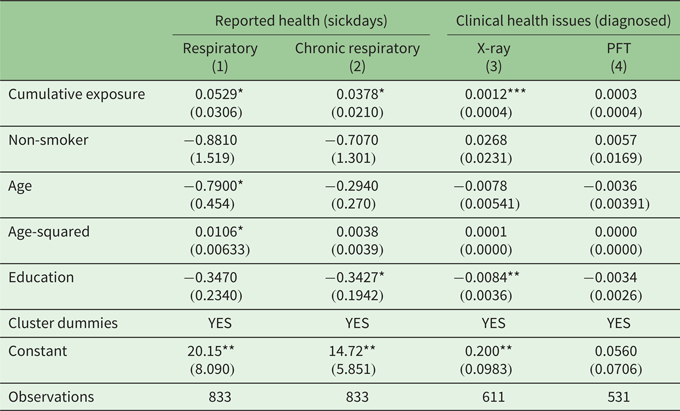
We now examine the association between cumulative exposure and health. In table 9, we present the results for both reported health indicators (respiratory and chronic respiratory sick days) and clinically-diagnosed respiratory health (expert's diagnosis of the X-ray and lung function test (PFT)). The respiratory sick days (e.g., laryngitis, sinusitis, pharyngitis) and chronic respiratory sick days (e.g., asthma, bronchitis, wheezing, emphysema) were self-reported by the participants. According to clinical experts, respiratory health (measured by X-ray reports) is a function of cumulative exposure rather than immediate exposure (Cooper et al., Reference Cooper, Sridharan, Uma, D'Souza, Murugesan and Dayal2006). As our key variable of interest is cumulative exposure to air pollution, the cardio-respiratory expert's diagnosis of X-rays provides the best measure of respiratory health for our purposes.Footnote 7 The pulmonary function test (as clinically measured with the peak flow meter instrument) indicates age-specific lung capacity and can be influenced by immediate 24-hr exposure.
Cumulative exposure and health indicators
Standard errors (clustered at household level) in parentheses.
*$p<0.10$ , **$p<0.05$
 , ***$p<0.01$
 . Other controls: male and pucca (dummies).
Estimated only for adults (so numbers lower than table 2).
Table 9 presents the main results of the paper, the association of health measures and cumulative exposure to air pollution for adults. In addition to the detailed survey questionnaire administered by local enumerators, sampled households were provided with individual health diaries to record the type of ailment, date, number of days sick, number of visits to the doctor, doctor's fees and any additional comments. We chose the self-reported sick days for respiratory and chronic respiratory illness as the dependent variables for the results presented in columns (1) and (2). The key variable of interest, cumulative exposure, is statistically significant and positive, indicating a positive association between exposure and respiratory sick days. In all the estimates in table 9, we control for individual (age, age-squared, education, male dummy), household level pucca dummy and cluster dummies to account for fixed effects at the regional level. A one-unit change in cumulative exposure is associated with a 0.0529-unit change in respiratory sick days, shown in column (1), and a 0.0378-unit change in chronic respiratory sick days, shown in column (2). In terms of elasticity, a 1 per cent change in cumulative exposure (at the mean) is associated with a 0.79 per cent increase in respiratory sick days and a 0.86 per cent increase in chronic respiratory sick days.
Lastly, a crucial concern in the literature when using self-reported measures of health as the dependent variable are issues of under- (or over-) reporting (Short et al., Reference Short, Goetzel, Pei, Tabrizi, Ozminkowski and Gibson2009; Vaillant and Wolff, Reference Vaillant and Wolff2012). The use of health diaries may mitigate the concerns with self-reported health based on recall methods but does not completely address issues of the heterogeneity problem in reporting, since different populations may use different threshold levels when asked about their health (Shmueli, Reference Shmueli2003; Lindeboom and Van Doorslaer, Reference Lindeboom and Van Doorslaer2004). Studies find correlations between attributes such as education and self-reported health which may arise from measurement errors in self-assessment. We ameliorate some of these concerns by controlling for education and income. Furthermore, the results in columns (3) and (4) in table 9, where the dependent variables are diagnosed clinical measures of health, are consistent with our findings with self-reported health.
As noted, we were advised by the cardio-respiratory specialist that respiratory health (indicated by X-ray reports) is a function of cumulative exposure. Therefore we argue that a diagnosed respiratory issue with the X-ray reports is the key health indicator in our study (column (3) in table 9). The pulmonary function test (as clinically measured with the peak flow meter instrument) indicates age-specific lung capacity and can be influenced by immediate 24-hr exposure, so it will be more responsive to 24-hr average exposure as a determinant.
Columns (3) and (4) in table 9 present the results for the relationship between cumulative exposure and clinically-diagnosed respiratory health status. A sub-sample (about 50 per cent of the total) of individuals volunteered for these medical tests that were offered for free and these observations are therefore lower than previous individual level regressions. In column (3) we use the X-ray diagnosis by the respiratory health expert and find a positive relationship between cumulative exposure to air pollution and an X-ray report diagnosed with respiratory problems. In terms of elasticity, a 1 per cent change in cumulative exposure is associated with a 0.90 per cent change in the likelihood of an X-ray report diagnosing a respiratory issue. Column (4) reports a positive association between cumulative exposure and the lung function test (i.e., ‘PFT not okay’) although not statistically significant. A 1 per cent change in exposure is associated with a 0.75 per cent change in the PFT measure recording an abnormality. As we noted, PFT is responsive to recent exposure and therefore noisily captures long-run effects.
The finding in our study that the relationship between cumulative exposure and health indicators is similar (in terms of sign and significance for X-ray measure) for both self-reported measures as well as clinical assessments is useful to related studies. The detailed clinical assessment and medical expert diagnosis, as in our study, may be infeasible to collect or the data and resources may not be available. The positive correlation we find between clinical and self-reported health illustrates the value of other field studies even if they only use self-reported health.
4.4. Study limitations
Our study has some limitations. Firstly, part of the study uses survey data and the recall method for self-reported health, which is open to measurement errors and biases. Self-reports are amenable to social desirability biases when responding to questions about health (Ezzati et al., Reference Ezzati, Martin, Skjold, Hoorn and Murray2006), for example, when responding to questions about smoking habits in our survey. Our provision of health diaries at the start of the study to all sampled households could have potentially improved participant's recording and recall during the health survey. We find consistent results with the clinical measures of health. Participants’ reports of time spent in micro-environments can be affected by such biases as well, but the presence of field assistants in the households during the indoor and kitchen concentration measurements and their independent verification of time spent should constrain the bias.
Although we cannot make causal claims in the paper about the effect of mining or traditional fuel usage on health, our elaborate data collection allows us to make careful inferences about source apportionment for pollution. We treat the assignment of mining activity as exogenous to households in our computation of cumulative exposure, but selective in- or out-migration could bias our estimates. Even if we do not deal with the out-migration issue, the fact that 77 per cent of our sampled households were originally from the cluster (the main results are qualitatively similar when restricting the analysis to this sub-sample) allows us to have confidence in the results.
Despite our attempts to tie the theory closely to the data collection process that allowed us to apportion exposure to pollution sources, we were still limited in our empirical strategy by the data. Our measure of cumulative exposure assumes that the current 24-hr exposure is indicative of exposure across the years for the individuals living in the location. But pollution levels could have varied considerably over the years in the locations which we do not account for in our exposure construction. Similarly, we do not measure cumulative smoking years of individuals. Moreover, we measured $PM_{10}$ rather than $PM_{2.5}$
 , which could arguably be a better indicator of respirable pollutants. We only measured particulate matter concentrations while health is also impacted by other noxious matter (e.g., sulphur oxides).
Sophisticated treatments of costs and benefits have been published since the data collection for this study (Jeuland et al., Reference Jeuland, Bhojvaid, Kar, Lewis, Patange and Pattanayak2015a, Reference Jeuland, Soo J-S and Shindell2018). Our particular contribution is the incorporation of total exposure and micro-environments. Air pollution valuation studies may to some extent abstract from that or, at times, simply ignore HAP.
5. Conclusions
Our study develops an integrated empirical model to study the association between respiratory health and total air pollution (household and outdoor). The two distinct features of this paper are: (1) proposing an integrated empirical model of health effects of air pollution, and (2) using dis-aggregate data on exposure in different environments to test the empirical implications from the model. The delineation of exposure levels from different micro-environments offers insights into the comparative magnitude of impacts from both household and outdoor pollution. This approach has allowed us to examine the relationship between respiratory health and household and outdoor air pollution together.
In our empirical analysis, we examine: (a) the association between individual characteristics and time spent in different micro-environments, (b) the distribution of concentrations in the micro-environments among clusters, (c) the relationship between clusters and household fuel usage, and (d) the relationship between cumulative exposure to air pollution and health outcomes. To highlight, we found that: (a) biomass use was positively associated with time spent in the kitchen, which may be due to the lower efficiency and higher cooking time associated with biomass fuels; (b) there is a positive association between outdoor air pollution and LPG usage (negative between outdoor and biomass use) which, along with associated results on the cluster dummies, implies that regions with mining activity had a higher likelihood of LPG usage; (c) cumulative exposure is positively related to biomass fuel usage, time spent in the kitchen where biomass fuels were used, household and outdoor air quality; and (d) cumulative exposure to air pollution is positively associated with self-reported and clinically-diagnosed respiratory issues.
Our results emphasize the findings in several studies that HAP from traditional cooking technologies adversely affects respiratory health (Duflo et al., Reference Duflo, Greenstone and Hanna2008; Langbein, Reference Langbein2017; Jeuland et al., Reference Jeuland, Soo J-S and Shindell2018; Pattanayak et al., Reference Pattanayak, Jeuland, Lewis, Usmani, Brooks and Bhojvaid2019). We find that switching from traditional biomass cooking to LPG stoves is associated with a substantial reduction in cumulative exposure, which is similar to findings in the literature on fuel switching (Shupler et al., Reference Shupler, Godwin, Frostad, Gustafson, Arku and Brauer2018).
Findings from such a cross-disciplinary team can offer several direct implications for policy making. We chose a setting with a recognized outdoor air quality problem – a heavily-mined region in India – to study the relationship of both outdoor and household air pollution with health. Our design and data allowed us to compute total exposure to air pollution as an outcome of air quality and time spent in the micro-environment. Thus policies should not just focus on improving cooking technology and fuel choice, but also provide information that improves time allocations in polluted environments, including household kitchens.
In rural areas of developing countries – particularly in households using biomass fuels and poor kitchen ventilation – HAP is a relatively more significant health hazard. In our study, clusters with mining activity had a higher proportion of cleaner cooking fuel usage (LPG) than the control cluster, which relied on biomass fuels. Correspondingly, clusters with mining activity experienced an increase in outdoor air pollution and reduced HAP as they switched away from biomass fuels. The findings suggest that there may be trade-offs between indoor and outdoor air pollution: mining activity – while adversely impacting outdoor air pollution – may simultaneously increase income and reduce the costs of accessing cleaner stoves and fuels (LPG, electricity), therefore reducing HAP. The findings from this study can be treated as a proof of concept that economists can usefully borrow from the environmental health sciences (TEA). Further research is required to comprehensively identify and evaluate these trade-offs on health and other welfare outcomes.
Supplementary material
The supplementary material for this article can be found at https://doi.org/10.1017/S1355770X21000152.
Acknowledgments
We thank the two anonymous referees, Anna Alberini, Dana Andersen, Kenneth McConnell, and numerous seminar participants at the University of Arizona and University of Maryland, College Park for their comments and suggestions; and Meena Sehgal and Sunil K. Chabbra for their input. We acknowledge the contribution and guidance of Sanghamitra Das who sadly passed away unexpectedly. We thank the International Development Research Center for their financial support.


 Open access

