


1. Introduction
Aeroacoustic resonances are present in a range of flow configurations associated with high-speed flight. These processes produce high-amplitude tones that may interact with the natural frequencies of aircraft components, potentially leading to structural failure (see for instance Berndt Reference Berndt1984). Some of the most well-known aeroacoustic feedback processes are screech (Powell Reference Powell1953; Raman Reference Raman1998; Edgington-Mitchell Reference Edgington-Mitchell2019), impingement tones (Marsh Reference Marsh1961; Wagner Reference Wagner1971; Powell Reference Powell1988; Henderson Reference Henderson2002; Henderson, Bridges & Wernet Reference Henderson, Bridges and Wernet2005) and the more recently discovered high-subsonic jet resonance (Schmidt et al. Reference Schmidt, Towne, Colonius, Cavalieri, Jordan and Brès2017; Towne et al. Reference Towne, Cavalieri, Jordan, Colonius, Schmidt, Jaunet and Brès2017). Despite the complexity of the underlying turbulent flows in each of these processes, they can still be well described with very simple models such as the one proposed by Powell (Reference Powell1953), which has four main stages: (i) the propagation of energy in the downstream direction; (ii) the conversion of this energy into an upstream-travelling wave; (iii) the upstream propagation of energy; and (iv) the conversion of this energy back into a downstream-travelling wave, closing the resonance loop. Although there is a broad range of aeroacoustic phenomena, this framework still captures a key element that must underpin any resonance process: the existence of two wave-like structures that can transport energy upstream and downstream.
In his early description of screech, Powell (Reference Powell1953) identified the downstream- and upstream-travelling waves involved in resonance as being large-scale vortices and acoustic waves, respectively. These large-scale vortices have their origin in the Kelvin–Helmholtz instability, first studied by Rayleigh (Reference Rayleigh1880) and later explored by a number of researchers (Lessen, Fox & Zien Reference Lessen, Fox and Zien1965; Michalke Reference Michalke1964, Reference Michalke1965). These vortices extract energy from the mean flow and grow exponentially for the first few diameters of the jet; as the shear layer thickens, the vortices become stable and start decaying as they travel in the streamwise direction. While early descriptions of resonance treated these vortices as discrete entities, it is now well established that a train of these vortices is best described as a single coherent structure called a wavepacket (Mollo-Christensen Reference Mollo-Christensen1967; Crow & Champagne Reference Crow and Champagne1971; Cavalieri et al. Reference Cavalieri, Rodríguez, Jordan, Colonius and Gervais2013). Since the work of Powell, significant effort has been expended in the study of this downstream-travelling structure, a structure which underpins a range of noise-generation phenomena (Tinney & Jordan Reference Tinney and Jordan2008; Cavalieri et al. Reference Cavalieri, Jordan, Colonius and Gervais2012; Jordan & Colonius Reference Jordan and Colonius2013; Cavalieri et al. Reference Cavalieri, Jordan, Wolf and Gervais2014; Baqui et al. Reference Baqui, Agarwal, Cavalieri and Sinayoko2015; Cavalieri, Jordan & Lesshafft Reference Cavalieri, Jordan and Lesshafft2019; Wong et al. Reference Wong, Jordan, Maia, Cavalieri, Kirby, Fava and Edgington- Mitchell2021). The characteristics of wavepackets are generally well predicted by linear-stability models; locally parallel models can predict the generation of these structures (Crow & Champagne Reference Crow and Champagne1971; Michalke Reference Michalke1984; Nogueira & Edgington-Mitchell Reference Nogueira and Edgington-Mitchell2021), spatial-marching methods can capture their growth and decay (Cavalieri et al. Reference Cavalieri, Rodríguez, Jordan, Colonius and Gervais2013; Sinha et al. Reference Sinha, Rodríguez, Brès and Colonius2014; Towne & Colonius Reference Towne and Colonius2015; Sasaki et al. Reference Sasaki, Cavalieri, Jordan, Schmidt, Colonius and Brès2017) and even the modulation of the wavepacket by shocks within the flow can be predicted (Nogueira et al. Reference Nogueira, Self, Towne and Edgington-Mitchell2022a). These wavepackets constitute the downstream component of both screech and impingement tones; in high-subsonic jet resonance, it is replaced by a downstream-travelling neutral duct-like mode, which is acoustic in nature (Towne et al. Reference Towne, Cavalieri, Jordan, Colonius, Schmidt, Jaunet and Brès2017).
The upstream component of the resonance loops has been the object of more debate. In screech and impingement tones, early works such as Wagner (Reference Wagner1971) and Powell (Reference Powell1953) assume that the upstream propagation of energy takes the form of an acoustic wave generated by an interaction between the Kelvin–Helmholtz wavepacket and the shocks. This assumption went unchallenged for decades, until the works of Tam & Ahuja (Reference Tam and Ahuja1990) and Tam & Norum (Reference Tam and Norum1992). Inspired by the inability of contemporary models to capture an experimentally observed Mach-number cutoff, the authors proposed that the feedback loop in impinging jets is closed by neutral discrete acoustic-like waves. These waves had been first identified in the linear-stability calculations of Tam & Hu (Reference Tam and Hu1989), inspired by experimental observations of Oertel (Reference Oertel1980). The presence of these neutral waves and their role in impinging-jet resonance found empirical support in the numerical simulations of Gojon, Bogey & Marsden (Reference Gojon, Bogey and Marsden2016). A similar role for these waves in jet screech was hypothesised by Shen & Tam (Reference Shen and Tam2002) and further suggested numerically and experimentally by Gojon, Bogey & Mihaescu (Reference Gojon, Bogey and Mihaescu2018) and Edgington-Mitchell et al. (Reference Edgington-Mitchell, Jaunet, Jordan, Towne, Soria and Honnery2018), who showed that screech tones were only observed at frequencies where these discrete waves were neutrally stable. Further confirmation that this upstream wave is involved in the screech resonance loop was provided by Mancinelli et al. (Reference Mancinelli, Jaunet, Jordan and Towne2019, Reference Mancinelli, Jaunet, Jordan and Towne2021), who demonstrated that predictions using the neutral wave were in better agreement with experimental data than predictions based on a model that assumed the upstream wave was purely acoustic. Finally, Nogueira et al. (Reference Nogueira, Jaunet, Mancinelli, Jordan and Edgington-Mitchell2022b,Reference Nogueira, Jordan, Jaunet, Cavalieri, Towne and Edgington-Mitchellc) showed that screech is triggered by an absolute instability mechanism involving the Kelvin–Helmholtz mode and this upstream wave (which has recently been referred to as the guided-jet mode), and Edgington-Mitchell et al. (Reference Edgington-Mitchell, Li, Liu, He, Wong, Mackenzie and Nogueira2022) demonstrated that the upstream-travelling waves in these flows are almost always slower than the ambient speed of sound. In high-subsonic jet resonance, the characteristics of the guided-jet mode, including how it is supported by the flow and its interaction with other duct-like modes, is the actual mechanism that drives resonance; this mechanism has also been studied by a number of recent works (Bogey Reference Bogey2021, Reference Bogey2022b; Zaman, Fagan & Upadhyay Reference Zaman, Fagan and Upadhyay2022; Bogey Reference Bogey2022a). In supersonic impinging jets, it has been shown that free-stream acoustic waves seem to be relevant in the resonance loop at some conditions (Weightman et al. Reference Weightman, Amili, Honnery, Edgington-Mitchell and Soria2019), while others seem to be governed by the guided-jet mode (Varé & Bogey Reference Varé and Bogey2023). The same wave was also shown to trigger resonance in jet–plate interaction problems (Jordan et al. Reference Jordan, Jaunet, Towne, Cavalieri, Colonius, Schmidt and Agarwal2018; Tam & Chandramouli Reference Tam and Chandramouli2020).
Despite the plethora of evidence for the role of the guided-jet mode in resonance and the predictive power of models that incorporate it, the exact nature of this wave has remained something of an enigma. The wave travels with phase velocities lower than the sound speed, yet it appears to find its genesis in the continuous acoustic branch of the linearised Navier–Stokes spectrum (Towne et al. Reference Towne, Cavalieri, Jordan, Colonius, Schmidt, Jaunet and Brès2017). Should this wave then be referred to as an ‘acoustic’ wave? Results from Tam & Hu (Reference Tam and Hu1989) and Edgington-Mitchell et al. (Reference Edgington-Mitchell, Jaunet, Jordan, Towne, Soria and Honnery2018) suggest that the wave must be acoustic in nature, but how then to explain the subsonic phase velocity, predicted by theory and observed in experiment? An additional complication is that the guided-jet mode is only predicted to be neutrally stable for a finite band of frequencies and wavenumbers, yet free-stream acoustic waves can exist at all frequencies. Lastly, the guided-jet mode exhibits behaviour that is difficult to reconcile with simple free-stream acoustic waves; interactions between this wave and downstream-propagating duct-like waves produce saddle points in the complex-valued eigenspectra predicted by linear-stability theory.
The purpose of this paper is thus to determine the nature of this important but enigmatic ‘guided-jet mode’. Given the role it plays in a range of noise-generating jets, a better understanding of its theoretical underpinnings may be critical in the mitigation of sound produced by high-speed shear flows. Given the similarities between these modes and the duct-like modes analysed in Towne et al. (Reference Towne, Cavalieri, Jordan, Colonius, Schmidt, Jaunet and Brès2017), one could hypothesise that internal reflection is one of the driving dynamics of this wave. To confirm this, in an attempt to reconcile the acoustic properties it possesses with its subsonic phase velocity, the guided-jet mode will be considered in the context of an acoustic-scattering problem, as suggested by Martini, Cavalieri & Jordan (Reference Martini, Cavalieri and Jordan2019). The acoustic-scattering framework is well established, but has not yet been applied to the study of this particular flow structure. As will be seen, considering the problem from this perspective will both provide insight into the nature of the guided-jet mode and also provide explanations for much of the behaviour predicted by linear-stability theory.
The paper is divided as follows: in § 2 the mathematical formulations of the acoustic-scattering problem and vortex-sheet model are presented. After that, results of scattering are shown and compared with the overall behaviour of the guided-jet mode predicted from the vortex-sheet dispersion relation in § 4. Section 5 provides an explanation for the direction of propagation of the guided-jet mode, and results are extended to the tri-dimensional case in § 6. Finally, § 7 highlights the importance of the current results in the context of resonance, and the main conclusions of the analysis are then reviewed in § 8.
2. Mathematical formulation
Most of this work is based on the two-dimensional Cartesian linearised compressible Euler equations in the frequency–wavenumber domain. As will be seen in the next sections, the planar problem allows for a more detailed exploration than the cylindrical one, but the conclusions will later be extended to round jets. As in previous works (Lessen et al. Reference Lessen, Fox and Zien1965; Martini et al. Reference Martini, Cavalieri and Jordan2019), the mean velocity is considered to only have a non-zero component in the streamwise direction, and all quantities are normalised by the free-stream sound speed  $c_\infty$, specific volume $\nu _\infty$ and a length $h$ (which was chosen here to be the distance between the two shear layers in the case of a planar jet). Under these assumptions and normalisation, the governing equations reduce to
 $$\begin{gather} -\mathrm{i} \omega \nu + \mathrm{i} \alpha U \nu + v \frac{\partial \bar{\nu}}{\partial y} - \bar{\nu} \left(\mathrm{i} \alpha u + \frac{\partial v}{\partial y}\right) = 0, \end{gather}$$
 $$\begin{gather}-\mathrm{i} \omega u + \mathrm{i} \alpha U u + v \frac{\partial U}{\partial y} + \mathrm{i} \alpha \bar{\nu} p = 0, \end{gather}$$
 $$\begin{gather}-\mathrm{i} \omega v + \mathrm{i} \alpha U v + \bar{\nu} \frac{\partial p}{\partial y} + \nu \frac{\partial P}{\partial y}= 0, \end{gather}$$
 $$\begin{gather}-\mathrm{i} \omega p + \mathrm{i} \alpha U p + v \frac{\partial P}{\partial y} + \gamma P \left(\mathrm{i} \alpha u + \frac{\partial v}{\partial y}\right) = 0, \end{gather}$$
where  $U$,
$U$,  $P$ and $\bar {\nu }$ are the mean streamwise velocity, pressure and specific volume, and $(\nu,u,v,p)$ are the fluctuations of specific volume, streamwise and normal velocity and pressure, respectively (Towne et al. Reference Towne, Cavalieri, Jordan, Colonius, Schmidt, Jaunet and Brès2017). The pairs $(\omega, \alpha )$ are the perturbation frequency and wavenumber, following the normal-mode ansatz, which assumes each component of the flow disturbances to have the form $\tilde {q}(x,y,t)=q(y)\exp (-\mathrm {i}\omega t + \mathrm {i} \alpha x )$. The system (2.1)–(2.4) may be further simplified by dividing the flow into separate domains, each of which is assumed to have a constant velocity – this constitutes one of the main simplifications of the vortex-sheet model, as developed by Lessen et al. (Reference Lessen, Fox and Zien1965). Following this simplification, after some further algebra, one may obtain
 \begin{equation} \left[ \frac{\mathrm{d}}{\mathrm{d} y^2} -\alpha^2 + \frac{(\omega -\alpha M_{i,o})^2}{T_{i,o}} \right] p_{i,o} = 0, \end{equation}
where  $M=U/c_\infty$ is the acoustic Mach number, $T$ is the temperature ratio (which is simply the ratio between $\nu$ in the different regions for an ideal isobaric jet) and the subscripts $_{i,o}$ are associated with the different regions of the jet, $o$ for the outer (quiescent) region and $i$ for the inner (flow) region, not to be mistaken with the incident waves introduced in the next section. Considering a jet discharged into a medium at rest, these parameters reduce to $M_o=0$, $T_o=1$, $M_i=M$ and $T_i=T$. Even though the resulting equation is dependent on the temperature ratio, this work will focus on isothermal jets, as the fundamental features of the guided-jet mode are basically independent of that parameter. This is the same equation solved by Lessen et al. (Reference Lessen, Fox and Zien1965) and Martini et al. (Reference Martini, Cavalieri and Jordan2019) for the double vortex-sheet (DVS) problem.
The general solution of (2.5) is given by
 \begin{equation} p_{i,o}(y) = A_{i,o} \exp({\gamma_{i,o} y}) + B_{i,o} \exp({-\gamma_{i,o} y}), \end{equation}
where
 \begin{equation} \gamma_{i,o} = \mathrm{i} \sqrt{\frac{(\omega-\alpha M_{i,o})^2}{T_{i,o}}-\alpha^2}. \end{equation}
Note that the branch cut was chosen such that  $\text {Im}(\gamma _{i,o}) \geqslant 0$. As will be seen shortly, the coefficients $A_{i,o}$, $B_{i,o}$ define the amplitudes of incoming/outgoing waves when $\text {Re}(\gamma _{i,o})=0$. When $\text {Re}(\gamma _{i,o})$ is non-zero, the appropriate coefficient is set to zero to ensure bounded disturbances far from the vortex sheet. The coefficients in the different parts of the domain, $A_{i,o}$ and $B_{i,o}$, may be obtained after consideration of the symmetry of the problem and the relevant boundary and matching conditions. In the following sections, (2.6) and (2.7) will be solved in the form of an acoustic-scattering problem for a single vortex sheet (SVS) in § 2.1 and in the form of linear-stability problems for a planar DVS in § 2.2 and for a cylindrical vortex sheet in § 2.3. One of the main advantages of the scattering formulation is the fact that the problem may be discussed in terms of incident, reflected and transmitted waves, which brings an element of causality that is absent in all eigen-analyses of these flows – the resulting wave will be a function of the characteristics of the incident one. A sketch of the different formulations with their respective characteristic inputs and outputs is shown in figure 1.

Figure 1. Sketch of the different models considered in this work.
2.1. The acoustic-scattering problem – single vortex sheet
The formulation presented in (2.6) may be used to study the problem of acoustic waves reflected by and transmitted through the shear layer in the SVS. This problem will be divided into two parts: (i) the scattering of waves coming from the quiescent region into the SVS; (ii) the scattering of waves coming from the flow region into the SVS. A sketch with the two configurations is provided in figure 2.

Figure 2. Sample pressure fields associated with the scattering of waves coming from the quiescent region into the SVS (a,b) and the scattering of waves coming from the flow region into the SVS (c,d). Both incident (a,c) and resulting (b,d) pressure are shown. Note that the amplitudes of the reflected waves are small in these cases.
2.1.1. The scattering of waves generated in the quiescent region
For waves originating in the quiescent region, following Campos & Kobayashi (Reference Campos and Kobayashi2000), the resulting pressure field in the quiescent region contains contributions from both the incident and reflected waves, as given by
 \begin{equation} p_{o}(y) = \chi_o \mathrm{e}^{\gamma_i y} + \mathrm{e}^{-\gamma_i y} \ (y>0), \end{equation}
while in the flow region, only transmitted waves exist
 \begin{equation} p_{i}(y) = \tau_o \mathrm{e}^{-\gamma_i y} \ (y<0). \end{equation}
Here, the numbers  $\chi _o$ and $\tau _o$ are the complex-valued reflection and transmission coefficients for this problem. Without loss of generality, incident waves will have unit amplitude $\iota =1$ in this problem; the other coefficients are then obtained as ratios of $\iota$. In order to calculate the resulting reflection and transmission coefficients, pressure and displacement must be matched at the vortex-sheet position, resulting in the following expression for the outer-scattering problem in the SVS:
 $$\begin{gather} \chi_o={-}\frac{1-E_{SVS}}{1+E_{SVS}}, \end{gather}$$
 $$\begin{gather}\tau_o=\chi_o+1, \end{gather}$$
with
 \begin{equation} E_{SVS}=\left( 1- \frac{\alpha M}{\omega} \right)^2 \frac{1}{T} \frac{\gamma_o}{\gamma_i}. \end{equation}
Note that the expression for the reflection coefficient  $\chi _o$ is similar to the one obtained for a wave incident on an impedance wall (Rienstra & Hirschberg Reference Rienstra and Hirschberg2002), in which case $E_{SVS}$ may be interpreted as an impedance term. As we are dealing with acoustic waves that are oscillatory in the quiescent medium, the wavenumbers in (2.12) should be real valued and restricted to $|\alpha | \leqslant \omega$. This is equivalent to defining the branch cut of the square-root function so as to obtain bounded disturbances at infinity. One should note that, in this range of wavenumbers, both $\gamma _i$ and $\gamma _o$ are pure imaginary numbers; thus $E_{SVS}$ is a real number, leading to real transmission and reflection coefficients.
It is possible to include the edge of a plate or nozzle at the origin of the shear layer (Crighton & Leppington Reference Crighton and Leppington1974), which couples the acoustic-scattering problem with the Kelvin–Helmholtz instability of the shear layer in order to satisfy an unsteady Kutta condition at the edge. This is not carried out here, for consistency with the local stability problem which does not include the edge.
2.1.2. The scattering of waves generated in the flow region
The scattering problem for waves coming from the flow region is similar, but requires more care; waves that are oscillatory in the flow region may not be oscillatory in the quiescent region. The opposite does not occur for negative wavenumbers, rendering the quiescent-region analysis more straightforward. Again considering only waves that are oscillatory in the quiescent medium ( $|\alpha | \leqslant \omega$), the pressure field in this quiescent medium contains only transmitted waves, as given by
 \begin{equation} p_{o}(y) = \tau_i \mathrm{e}^{\gamma_o y} \ (y>0), \end{equation}
whereas the pressure field in the flow region contains both incident and reflected waves
 \begin{equation} p_{i}(y) = \mathrm{e}^{\gamma_i y} + \chi_i \mathrm{e}^{-\gamma_i y} \ (y<0). \end{equation}
 Note that both transmitted and incident waves have the same exponential sign, ensuring that transmitted waves travel away from the vortex sheet. This is valid for incident waves with phase velocities in  $y$ pointing upwards, which is the case in the present work. The appropriate exponential sign may also be obtained by analysing the sign of the group velocity in $y$. Furthermore, for $|\alpha | \leqslant \omega$, all disturbances are bounded as the parameters $\gamma _{i,o}$ are pure imaginary numbers. Implementing the same boundary conditions of matched pressure and displacement leads to the reflection and transmission coefficients
 $$\begin{gather} \chi_i=\frac{1-E_{SVS}}{1+E_{SVS}}, \end{gather}$$
 $$\begin{gather}\tau_i=\chi_o+1. \end{gather}$$
 These expressions are valid for  $|\alpha | \leqslant \omega$, but acoustic waves in the flow region exist for all wavenumbers in the interval ${(\omega -\alpha M)^2}/{T}-\alpha ^2>0$. Thus, for subsonic flows and negative wavenumbers, there is an interval ${-\omega }/{\sqrt {T}-M} \leqslant \alpha < -\omega$ in which waves are oscillatory in the flow region and decaying in the quiescent region. The upper and lower limits of this interval are associated with oscillatory waves in the quiescent region travelling at $90^\circ$ in the quiescent medium (but travelling at an angle in the flow medium), and travelling at $90^\circ$ in the flow region (but decaying in the quiescent medium) with respect to the shear layer, respectively. This is shown schematically in figure 3. In this interval, the pressure for $y>0$ is given by
 \begin{equation} p_{o}(y) = \tau_i \mathrm{e}^{-\gamma_o y} \ (y>0), \end{equation}
to ensure bounded pressure in both parts of the domain. Then, the reflection coefficient is given by
 \begin{equation} \chi_i=\frac{1+E_{SVS}}{1-E_{SVS}}. \end{equation}
Note that plane waves generated in the flow region must be written in the framework moving with the jet, which is already considered by the Doppler-shifted frequency in  $\gamma _i$. Thus, the phase velocity of plane waves parallel to the $y$-axis (travelling directly upstream) matches the speed of sound $c$ in the quiescent medium; waves parallel to the same axis in the flow medium travel at speed $M-c$ (in the isothermal case), due to the convection by the mean flow. This will be further explored in § 5. A summary of the different expressions for the scattering problem is shown in table 1.

Figure 3. Sketch showing the wavenumbers associated with oscillatory waves in the different regions of the flow and the propagation angles in the limit cases. Here,  $\theta _i \approx 146^\circ$ is the incidence angle computed for $\alpha =-\omega$.
Table 1. Summary of the different expressions for the scattering problem.

2.2. The linear-stability problem – double vortex sheet
The dispersion relation for the DVS formulation as derived by Lessen et al. (Reference Lessen, Fox and Zien1965) is reviewed here for clarity. The governing equation is given by (2.5), whose solution is of the form (2.6). Taking the symmetry of the problem into account, one may simplify the expression for the pressure field as
 $$\begin{gather} p_{o}(y) = A \,\mathrm{e}^{-\gamma_o y} \ (y>0.5), \end{gather}$$
 $$\begin{gather}p_{o}(y) ={\pm} A \,\mathrm{e}^{\gamma_o y} \ (y<{-}0.5), \end{gather}$$
and
 \begin{equation} p_{i}(y) = \mathrm{e}^{\gamma_i y} \pm \mathrm{e}^{-\gamma_i y} \ (|y|<0.5), \end{equation}
where the parameter  $A$ in (2.19) may be obtained by matching the pressure solutions at the interface between the two media. The dispersion relation is then obtained by imposing that the displacement of the vortex sheet be the same in both sides, as in Lessen et al. (Reference Lessen, Fox and Zien1965). These boundary conditions are the same as those imposed in the acoustic-scattering SVS, although the consideration of problem symmetry results in different coefficients for the pressure fields. The amplitude ratio is
 \begin{equation} A=\frac{\mathrm{e}^{\gamma_i/2}\pm\mathrm{e}^{-\gamma_i/2}}{\mathrm{e}^{-\gamma_o/2}}, \end{equation}
and the dispersion relation may be written as
 \begin{equation} \frac{1}{T}\left(1-\frac{\alpha M}{\omega}\right)^2+\frac{\gamma_i}{\gamma_o} \left( \frac{\mathrm{e}^{\gamma_i/2}\mp\mathrm{e}^{-\gamma_i/2}}{\mathrm{e}^{\gamma_i/2}\pm\mathrm{e}^{-\gamma_i/2}} \right) = 0. \end{equation}
The equation above may be used to obtain the frequency and wavenumber pairs of the waves supported by the flow in the limit of a very thin shear layer. The pressure eigenfunctions are then obtained using (2.19), (2.20) and (2.21). This formulation supports Kelvin–Helmholtz, duct-like and guided-jet modes, as studied in Martini et al. (Reference Martini, Cavalieri and Jordan2019), being the Cartesian equivalent of the formulation used in Towne et al. (Reference Towne, Cavalieri, Jordan, Colonius, Schmidt, Jaunet and Brès2017) and Jordan et al. (Reference Jordan, Jaunet, Towne, Cavalieri, Colonius, Schmidt and Agarwal2018).
2.3. The linear-stability problem – round-jet vortex sheet
A similar problem may be analysed in cylindrical-polar coordinates, modelling the waves supported by an axisymmetric jet with an infinitesimal shear layer. The polar problem is inherently confined (similar to the DVS) and does not allow for an inner-scattering formulation. However, the linearised cylindrical Navier–Stokes equations may still be used to derive a dispersion relation for the jet, following the same process as in the DVS. This is given by (Lessen et al. Reference Lessen, Fox and Zien1965; Michalke Reference Michalke1970; Towne et al. Reference Towne, Cavalieri, Jordan, Colonius, Schmidt, Jaunet and Brès2017)
 \begin{equation} \frac{1}{\left(1-\dfrac{\alpha M}{\omega}\right)^2} + \frac{1}{T} \frac{{\rm I}_m(\gamma_i/2)}{{\rm K}_m(\gamma_o/2)} \left( \frac{\gamma_o {\rm K}_{m-1}(\gamma_o/2) + 2 m {\rm K}_{m}(\gamma_o/2) }{\gamma_i {\rm I}_{m-1}(\gamma_i/2) - 2 m {\rm I}_{m}(\gamma_i/2) } \right) = 0, \end{equation}
where  ${\rm I}_m$ and ${\rm K}_m$ are the modified Bessel functions of the first and second kind, respectively. This expression assumes a normal-mode ansatz in the form $\tilde {q}(x,r,\theta,t)=q(r)\exp (-\mathrm {i}\omega t + \mathrm {i} \alpha x + \mathrm {i} m \theta )$, with $m$ the azimuthal wavenumber. As in the DVS, the cylindrical vortex sheet (CVS) supports a range of downstream- and upstream-travelling waves, including the guided-jet mode.
3. An overview of the guided-jet mode
The existence of the guided-jet mode has been theorised since the seminal work of Tam & Hu (Reference Tam and Hu1989), who identified this mode as being a subsonic wave that travels upstream for a limited range of frequencies. There now exists a surfeit of evidence for, not only the existence of this wave, but its role in a range of jet-noise problems (Towne et al. Reference Towne, Cavalieri, Jordan, Colonius, Schmidt, Jaunet and Brès2017; Jordan et al. Reference Jordan, Jaunet, Towne, Cavalieri, Colonius, Schmidt and Agarwal2018; Edgington-Mitchell et al. Reference Edgington-Mitchell, Jaunet, Jordan, Towne, Soria and Honnery2018, Reference Edgington-Mitchell, Wang, Nogueira, Schmidt, Jaunet, Duke, Jordan and Towne2021a; Gojon et al. Reference Gojon, Bogey and Mihaescu2018; Gojon, Gutmark & Mihaescu Reference Gojon, Gutmark and Mihaescu2019; Mancinelli et al. Reference Mancinelli, Jaunet, Jordan and Towne2019, Reference Mancinelli, Jaunet, Jordan and Towne2021; Bogey Reference Bogey2021; Nogueira et al. Reference Nogueira, Jordan, Jaunet, Cavalieri, Towne and Edgington-Mitchell2022c). This section aims to provide an overview of the general characteristics of this mode and other duct-like modes that share some of its attributes. These modes are located in the negative-wavenumber region of the eigenspectrum of the linearised Navier–Stokes system in a locally parallel framework.
Figure 4 shows exemplar dispersion-relation plots associated with negative-wavenumber modes from the DVS and CVS, generated for  $M=0.8$, $T=1$ and symmetric/axisymmetric ( $m=0$) modes, up to Strouhal number $St=2$, where $St=\frac{\omega L}{2 {\rm \pi}U}$ and L is the relevant characteristic length of the jet (the width in the DVS, or the diameter in the CVS). No discrete neutral modes are predicted by the vortex sheet (in either Cartesian or cylindrical form) for $-\omega <\alpha <0$; this region of the spectrum is associated with acoustic waves travelling at a range of angles (Gloor, Obrist & Kleiser Reference Gloor, Obrist and Kleiser2013), which cannot be captured by the classical vortex-sheet formulation used here (Mancinelli et al. Reference Mancinelli, Martini, Jaunet and Jordan2022). However, discrete modes are observed for $\alpha <-\omega$. As frequency is increased, new solution branches appear, emerging from the continuous acoustic branch; the first appearance of a new branch is always at a wavenumber equal to the free-stream sonic velocity. The frequency at which the first point of each solution branch appears in the dispersion relation is called a branch point. As the frequency is increased, the $\omega,\alpha$ pairs corresponding to the solution branch shift further from the sonic line. This phenomenon repeats itself several times in the dispersion relation, with a mode appearing at the sonic line, and moving further away from that line as frequency is increased.

Figure 4. Sample dispersion relations (a,b) and pressure eigenfunction (c,d) plots for neutral modes ( $\alpha _i=0$) with negative phase speed for both DVS (a,c) and CVS (b,d). Results generated for $M=0.8$, $T=1$ and the symmetric/axisymmetric modes of first and second radial orders. The sonic line is depicted by the black dashed line in the dispersion relation. Pressure is plotted for modes with phase velocity $c=-0.9$.
Each separate solution branch in the dispersion relation represents a wave with distinct normal/radial structure. For a wave starting at the  $n{\rm th}$ branch point, $n$ peaks will be observed inside of the jet, as shown in figure 4. This is true for both the Cartesian case, where peaks of equal amplitudes are observed (following a cosine-like shape), and the cylindrical case, where the solution can be represented by a sum of Bessel functions. This behaviour of the pressure solution in the inner region is qualitatively the same for all frequencies along the same branch. The solution in the outer region (in the quiescent region, in this case) is, however, quite different. Instead of displaying an oscillatory behaviour, the wave is exponentially damped in the $y$ (or $r$) direction. The rate of decay of this wave is a function of its phase velocity; it is nearly zero for a wave at the branch point, but it increases strongly as the streamwise wavenumber increases in magnitude. This is exemplified in figure 5. High pressure amplitudes are observed in the outside region for phase velocities close to $-1$ but the mode is progressively confined inside of the jet as the magnitude of the phase velocity decreases.

Figure 5. Absolute value of the pressure solution for  $n=0$ (a) and $n=1$ (b) branches for the DVS as a function of the phase velocity of the wave. All modes are normalised by their value at the centreline of the jet.
The overall behaviour of the pressure solution of these modes is qualitatively unchanged for increasing Mach number. However, the classification of the modes regarding their nature and direction of propagation changes drastically at two Mach numbers (Towne et al. Reference Towne, Cavalieri, Jordan, Colonius, Schmidt, Jaunet and Brès2017). For sufficiently low Mach numbers ( $M<0.82$ in the CVS case, for $n=1$) the resulting wave is upstream travelling for all frequencies, which is confirmed by the slope of the dispersion relation shown in figure 4; note that, for these neutral waves, the group velocity is given by $\mathrm {d} \omega /\mathrm {d} \alpha$, such that the slope of lines in figures 4 and 6 indicates the direction of propagation. For higher subsonic Mach numbers, the slope of the branch changes twice; now waves belonging to a single branch may either be upstream or downstream travelling, depending on their wavenumber. Also, a single frequency could now support either one or three different modes with different wavenumbers at this range of subsonic Mach numbers. The behaviour of the branch changes again for supersonic Mach numbers, where two regions of the branch may be identified, one in which the wave is upstream travelling, and one where it is downstream travelling. In this regime, the upstream-travelling wave is usually called the guided-jet mode, while the downstream-travelling part of the branch is called the duct-like mode; the point where they meet is known as the saddle point, due to its characteristic behaviour in the eigenspectrum (Towne et al. Reference Towne, Cavalieri, Jordan, Colonius, Schmidt, Jaunet and Brès2017). After the saddle point, the two solutions behave as evanescent waves in $x$, with a non-zero spatial decay rate. The same overall behaviour is observed in the DVS (dispersion relations for $M=0.9$ and $1.2$ are shown in figure 6). A detailed discussion of how these modes change as functions of Mach number and frequency in the CVS formulation can be found in Towne et al. (Reference Towne, Cavalieri, Jordan, Colonius, Schmidt, Jaunet and Brès2017) and Jordan et al. (Reference Jordan, Jaunet, Towne, Cavalieri, Colonius, Schmidt and Agarwal2018). Note that most of these analyses (including the present one) considers a locally parallel framework to study the characteristics of the guided-jet mode, which usually provides a good approximation for this wave, even when shocks are present in the flow (Edgington-Mitchell et al. Reference Edgington-Mitchell, Jaunet, Jordan, Towne, Soria and Honnery2018; Gojon et al. Reference Gojon, Bogey and Mihaescu2018; Mancinelli et al. Reference Mancinelli, Jaunet, Jordan and Towne2019, Reference Mancinelli, Jaunet, Jordan and Towne2021). This was also confirmed in Nogueira et al. (Reference Nogueira, Jaunet, Mancinelli, Jordan and Edgington-Mitchell2022b), who showed that linear-stability predictions using an experimental mean flow that includes shocks are in line with those from a (shock-free) vortex-sheet and a spatially periodic model. Thus, the DVS model based on a velocity profile using the ideally expanded jet Mach number can still be used to predict some of the features of this wave for imperfectly expanded jets, even though shock-cell modulation may still affect its overall shape in real cases (Nogueira et al. Reference Nogueira, Self, Towne and Edgington-Mitchell2022a).

Figure 6. Sample dispersion relations for the DVS. Results generated for  $M=0.9$ (a) and $M=1.2$ (b), with $T=1$. The sonic line is depicted by the black dashed line.
The overall dynamics of the duct modes has likewise been thoroughly explored in Towne et al. (Reference Towne, Cavalieri, Jordan, Colonius, Schmidt, Jaunet and Brès2017), including the role of this mode in high-subsonic jet resonance. The nature of the guided-jet mode, however, has been a constant topic of discussion recently, considering its key role in closing several resonance mechanisms (Tam & Ahuja Reference Tam and Ahuja1990; Edgington-Mitchell et al. Reference Edgington-Mitchell, Jaunet, Jordan, Towne, Soria and Honnery2018; Gojon et al. Reference Gojon, Bogey and Mihaescu2018; Jordan et al. Reference Jordan, Jaunet, Towne, Cavalieri, Colonius, Schmidt and Agarwal2018; Mancinelli et al. Reference Mancinelli, Jaunet, Jordan and Towne2019, Reference Mancinelli, Jaunet, Jordan and Towne2021; Nogueira et al. Reference Nogueira, Jaunet, Mancinelli, Jordan and Edgington-Mitchell2022b,Reference Nogueira, Jordan, Jaunet, Cavalieri, Towne and Edgington-Mitchellc). At this point, it is clear that this mode is not an acoustic wave in the classical sense, as it travels at subsonic velocities in the free stream and its radial decay does not follow the expected behaviour for acoustic waves in general. The fact that resonance is seldom observed in jets at conditions for which this wave is not supported suggests that the guided-jet mode somehow transmits energy upstream more efficiently than free-stream acoustic waves. However, considering that the branch point can be associated with an acoustic wave travelling directly upstream, there seems to be a natural connection between the guided-jet mode and acoustics, but this link remains elusive in the confined vortex-sheet (both DVS and CVS) formulations.
4. Transmission and reflection of acoustic waves in a single vortex sheet
Given that the guided-jet mode shares several, but not all, attributes of free-stream acoustic waves, it could be expected that this mode may be the consequence of reflection and transmission of acoustic waves. It has been shown in Towne et al. (Reference Towne, Cavalieri, Jordan, Colonius, Schmidt, Jaunet and Brès2017) that the duct-like mode is dictated by a total reflection, and Martini et al. (Reference Martini, Cavalieri and Jordan2019) showed that this is due to a vanishing vortex-sheet impedance for large  $\alpha$. A natural departure point for this study is a consideration of how planar acoustic waves are scattered by a shear layer, as a function of their origin and angle of incidence. The same problem has been analysed by a number of prior authors (Keller Reference Keller1955; Miles Reference Miles1957; Ribner Reference Ribner1957; Ingard Reference Ingard1959; Crighton & Leppington Reference Crighton and Leppington1974; Campos & Kobayashi Reference Campos and Kobayashi2000), but it is useful to review some of these results here, and particularise them for the case of an upstream-travelling wave. Waves that are generated outside of the flow are discussed first, then waves that are generated within it. Note that many times these waves will be categorised as oscillatory or decaying; these labels refer specifically to the behaviour of these waves in the $y$ direction. Decaying then refers to exponentially decaying wave shapes in $y$, and oscillatory refers to a oscillatory (cosine-like) shape in that direction. These are also denoted propagative and evanescent waves in the acoustics literature (see, for instance, Rienstra & Hirschberg Reference Rienstra and Hirschberg2002), but we choose to adopt an alternative nomenclature to avoid confusion with stable/unstable waves in the $x$-direction. In this section, most results will be presented for a high-subsonic ( $M=0.8$) jet, as some of the interesting features of the guided-jet mode (such as the presence of two saddle points in the eigenspectrum) are observed around this Mach number. However, the general characteristics of the phenomenon are very similar regardless of the Mach number; when applicable, the differences between supersonic and subsonic regimes will be mentioned in the analysis.
4.1. Waves generated in the quiescent region
Let us first consider the case of an acoustic wave generated in the quiescent region ( $\kern0.05em y > 0)$, where there is no flow. For an acoustic wave travelling upstream, the limits of the analysis are $-\omega \leqslant \alpha \leqslant 0$; this range of wavenumbers span all possible angles of incidence from $90^\circ$ to $180^\circ$. As we are most interested in building a model for the guided-jet mode, the most interesting parts of the analysis are obtained when the wavenumber of the wave is close to sonic $c=-1$ (when the quiescent waves are almost aligned with the vortex sheet); however, for completeness, the following plots will be restricted to a minimum phase velocity $c=\omega /\alpha =-10$. Figure 7 shows the imaginary part of the coefficients $\gamma _{i,o}$, which may be interpreted as the wavenumber of the waves in the $y$-direction. In this interval, the waves are oscillatory in both streams (the real parts of the coefficients are zero), leading to a purely oscillatory behaviour in both regions of the domain. As the phase velocity tends to $-1$, the coefficient $\gamma _o$ tends to zero – this is the limit in which the outer wave travels in a direction opposite to the flow. However, even at this limit, $\gamma _i$ is still a purely imaginary number, leading to a transmitted wave that is oscillatory in the flow region. The angles of propagation (calculated as $\theta _{i,o}=\text {atan}(\alpha /\gamma _{i,o})$) are shown in the same figure. As expected, the incidence angle ranges from $\theta _o=180^\circ$ (waves travelling directly towards the shear layer, in the limit $c \to -\infty$) to $\theta _o=90^\circ$, (waves travelling directly upstream), as shown schematically in figure 3. The angle of the transmitted wave has a somewhat slower variation, starting at $\theta _i=180^\circ$ at $c \to -\infty$, and reaching $\theta _i \approx 146^\circ$ for this case.

Figure 7. Imaginary parts of the coefficients  $\gamma _{i,o}$ (a,b) and their associated propagation angles (c,d) for upstream-travelling waves generated in the quiescent region. Red dashed lines: $\alpha =-\omega$. Black dashed lines: $\alpha =-\omega /(\sqrt {T}-M)$. Results for $M=0.8$, $T=1$.
The preceding analysis of the angles of propagation elucidates the behaviour of the transmitted wave as a function of the incidence angle, but it does not reveal anything about the amplitude of the reflected and transmitted waves; amplitude information is only contained in the coefficients  $\chi$ and $\tau$. The coefficients are shown in figure 8. These plots display two noteworthy features. The first is that there is a value of incidence angle for which all waves are transmitted and there is no reflection – the frequency–wavenumber pairs associated with zero reflection are also a solution of the SVS dispersion relation. Perhaps more interesting is the fact that the transmission coefficient tends to zero as $c$ tends to $-1$ (or as $\theta _o$ tends to $90^\circ$); this also leads to a reflection coefficient of $-1$, meaning that incident and reflected waves are in perfect phase opposition. Substitution of these values into (2.8) and (2.9) results in a complete cancellation of the wave by the scattering. Critically, this result demonstrates that planar waves travelling directly upstream cannot be transmitted to the flow region, at least under the hypotheses of this simplified model. Thus, if the waves originate from the quiescent region, there is no linear mechanism in which a planar wave travelling parallel to the stream produces pressure disturbances in the flow region. This result suggests that, although the guided-jet mode shares some properties with free-stream acoustic waves, it cannot simply be interpreted as the signature of an upstream-travelling acoustic wave interacting with the flow. The guided-jet mode is characterised by higher-magnitude pressure fluctuations within the jet core than external to it; the preceding analysis demonstrates this cannot arise due to the transmission of a wave generated outside the flow.

Figure 8. Reflection and transmission coefficients for upstream-travelling waves generated in the quiescent region  $M=0.8$ and $T=1$. Coefficients shown as a function of $\alpha$ and $\omega$ (a,b) and as a function of the quiescent medium wave incidence angle $\theta _o$ (c). Red dashed lines: $\alpha =-\omega$. Black dashed lines: $\alpha =-\omega /(\sqrt {T}-M)$.
4.2. Waves generated in the flow region
Let us now analyse a similar problem, but with waves generated in the flow region. As in the previous case, these waves will be transmitted and reflected by the shear layer; the difference now is that the transmitted wave may also be decaying, which could not occur in the previous case. Figure 9 shows the values of  $\gamma _{i,o}$ as a function of $\alpha$ for all the allowable angles of incidence in the flow region (the angles that correspond to oscillatory waves in that region), and the respective resultant angles. Red dashed lines indicate the wavenumbers of an acoustic wave travelling upstream in the quiescent region ( $\alpha =-\omega$) and black dashed lines indicate the wavenumbers associated with a wave travelling directly upstream in the flow region ( $\alpha =-\omega /(\sqrt {T}-M)$). It is clear that, between these two lines, the imaginary part of $\gamma _o$ is zero, leading to waves that travel at $90^\circ$ in that part of the domain for a range of incidence angles. As both frequency and wavenumber are real in (2.7), this also means that $\gamma _o$ is a real number; thus, following (2.6), this wave is exponentially damped in $y$ for these angles. Also, even though this wave is travelling at sonic speeds in the flow region (see Miles Reference Miles1957), it is effectively subsonic in the quiescent region when the transmission leads to decaying waves in the quiescent medium. In the higher limit ( $\alpha =-\omega$), the wave travels at the speed of sound in $x$, but has supersonic phase velocity in $x$ in the flow medium.

Figure 9. Imaginary parts of the coefficients  $\gamma _{i,o}$ (a,b) and their associated propagation angles (c,d) for upstream-travelling waves generated in the flow region. Red dashed lines: $\alpha =-\omega$. Black dashed lines: $\alpha =-\omega /(\sqrt {T}-M)$. Results for $M=0.8$, $T=1$.
As before, information regarding wave amplitude is contained within the reflection and transmission coefficients. The magnitudes of the reflection coefficient for incidence angles at which waves are oscillatory in the quiescent medium are somewhat similar to those observed in figure 8; outside that band of phase velocities, however, the reflection coefficient has unit magnitude for all angles, characteristic of the total-reflection mechanism studied in Keller (Reference Keller1955) and Miles (Reference Miles1957). At the sonic line  $\alpha =-\omega$, the reflection coefficient is 1, leading to a transmission coefficient of 2 – this is the last wavenumber that leads to oscillatory waves in the quiescent region, which assumes the shape of a planar wave going directly upstream. Note that the resulting transmitted wave has maximum amplitude for that value of $\alpha$; for $\alpha <-\omega$, the magnitude of the transmission coefficient decreases rapidly. This indicates that, in addition to being $y$-decaying, the amplitude of the wave in the quiescent region even at positions very close to the shear layer decreases as the magnitude of $\alpha$ is increased.
A close look at figure 10 reveals that the computed transmission coefficients may be higher than unity. This is a feature also observed in previous scattering analyses (see, for instance, Keller Reference Keller1955) and is related to the fact that the present model is not necessarily constrained to conserve energy. In fact, amplitudes of the different waves are obtained by applying the boundary conditions at the interface, which is the only necessary condition in the model. This is also true for a range of linear-stability tools, including the vortex sheet. In these models, it is usually assumed that the energy input for each physical phenomenon may be extracted from the mean flow, which is also the case in the scattering problem. Thus, even though energy may not be conserved in a strict sense, it is expected that it will be conserved in a global sense. An example of how instability waves extract energy from the mean flow in a dynamical system can be found in Nogueira & Cavalieri (Reference Nogueira and Cavalieri2021).

Figure 10. Absolute value of reflection and transmission coefficients for upstream-travelling waves generated in the flow region for  $M=0.8$ and $T=1$. Coefficients shown as a function of $\alpha$ and $\omega$ (a,b) and as a function of the flow medium wave incidence angle $\theta _i$ (c).
An illustration of what happens close to the sonic line is shown in figure 11, for  $c=\omega /\alpha =-1.01$, $-1$ and $-0.99$. For supersonic disturbances ( $c=\omega /\alpha < -1$), the transmitted wave is oscillatory at an angle (in this case, $c=-1.01$ is close to $90^\circ$). In the flow region, a constructive/destructive interference pattern is observed, but with a significantly stronger contribution from the incident wave. At $c=-1$, the transmitted wave in the quiescent medium travels perpendicularly to the shear layer, and a standing-wave pattern is observed in the flow region. This pattern remains basically unchanged as $c$ increases further, but the transmitted wave for these values of phase velocity decays exponentially with distance from the shear layer.

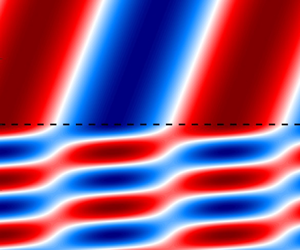
Figure 11. Real part of pressure for the incident (a,c,e) and resulting fields after scattering (b,d,f). Results are shown for incidence angles associated with  $c=\omega /\alpha =-1.01$ (a,b), $-1$ (c,d) and $-0.99$ (e,f) for $M=0.8$ and $T=1$.
To clarify the behaviour of the scattered pressure field as a function of the incidence angle, its absolute value as a function of the phase velocity  $c$ is shown in figure 12 for $\omega =1$. In this plot, $c<-1$ ( $\alpha >-1$) indicates supersonic (propagating in the quiescent region) wavenumbers, while $c>-1$ ( $\alpha <-1$) indicates waves that are oscillatory inside and decaying outside. It is clear that, while the pressure amplitude (and the equivalent acoustic energy) is somewhat uniformly distributed in the entire domain for the supersonic region, this amplitude in the flow region is considerably larger for $c>-1$. In fact, if this flow region is considered as a surrogate of the inside of a planar jet, this suggests that incidence angles associated with $y$-decaying behaviour in the quiescent region may lead to the highest flow response. Keeping in mind that energy is not conserved in the scattering problem, this is still in line with the expected physical behaviour for these systems: as the wave is totally trapped, energy cannot escape from the flow region, leading to high flow responses.

Figure 12. Absolute value of pressure of the resulting field as a function of the phase velocity  $c$ for $\omega =1$, $M=0.8$ and $T=1$.
4.3. Linking the scattering problem to the linear-stability problem
As shown in § 3, the guided-jet mode for the DVS exists only at select frequencies, and for these frequencies only at subsonic phase velocities  $\alpha \leqslant -\omega$. It presents a decaying behaviour in the quiescent region, while being energetic and displaying a standing-wave-like behaviour in the flow region (compare figures 5 and 12). These are all characteristics shared by the current scattering model when considering waves originating in the flow region, despite the absence of a second shear layer. These observations suggest that the guided-jet mode might be a result of transmission and reflection of acoustic waves generated within the flow, as assumed in Towne et al. (Reference Towne, Cavalieri, Jordan, Colonius, Schmidt, Jaunet and Brès2017) and Martini et al. (Reference Martini, Cavalieri and Jordan2019). The transmitted component manifests as a subsonic wave in the quiescent region, similar to the surface waves explored in Rienstra & Hirschberg (Reference Rienstra and Hirschberg2002). However, so far, the model does not capture one of the most important characteristics of the guided-jet mode, which is the finite bands of frequency where it exists as a neutral wave in the eigenspectrum. In fact, in the scattering problem, guided-jet-like waves exist for a wide range of wavenumbers for a given frequency, between phase velocities associated with perpendicular waves in the quiescent and flow regions.
A stronger connection between the guided-jet mode and the current model may be obtained by considering the standing-wave behaviour in the flow region. As shown in figure 12, the most marked characteristic of the resulting wave as the phase velocity becomes subsonic is the presence of a standing wave in the  $y$-direction, with $|\chi _i|=1$. With the magnitude of the reflection coefficient at unity, the value of the reflection coefficient may be represented only in terms of its phase $\chi _i=\mathrm {e}^{\mathrm {i}\phi }$, with $-{\rm \pi} \leqslant \phi < {\rm \pi}$, and the resulting pressure field in the flow region may be represented as
 \begin{equation} p_{i}(y) = \mathrm{e}^{\gamma_i y} + \mathrm{e}^{\mathrm{i}\phi} \mathrm{e}^{-\gamma_i y} = 2 \mathrm{e}^{\mathrm{i}\phi/2} \cos \left( \gamma_i y/\mathrm{i} -\phi/2 \right). \end{equation}
The dependence of  $p$ on the cosine of $y$ in the above expression highlights the standing-wave behaviour of the pressure in the flow region. Note that (4.1) is an alternative way to write the dispersion relation presented in § 2.1.2, which is now broken into individual pieces. This is shown in Appendix A.
To connect this behaviour to what is observed in jets requires the imposition of an additional condition: the wavelength of the pressure standing wave in the flow region must be matched to the width of the jet to account for the symmetry of the problem, as symmetry or anti-symmetry can only be imposed if an integer number of half-wavelengths fits within the bounds of the jet. Mathematically, if the jet has width  $h$, this is equivalent to solving
 \begin{equation} \cos \left( -\gamma_i h/\mathrm{i} -\phi/2 \right) ={\pm} \cos \left( -\phi/2 \right), \end{equation}
where the  $\pm$ signs indicate symmetric and anti-symmetric modes, respectively. Each symmetry has two possible solutions
 \begin{equation} \gamma_i h/\mathrm{i} ={-}\phi + 2 n {\rm \pi}, \end{equation}
for symmetric modes and
 \begin{equation} \gamma_i h/\mathrm{i} ={-}\phi + (2 n + 1){\rm \pi} ,\end{equation}
for antisymmetric modes, where  $n$ is an integer (another solution for each symmetry may be obtained if $\phi$ is set as zero, which will also be considered shortly). Considering $\phi$ a free parameter, these equations may solved directly, leading to
 \begin{equation} \omega=M\alpha \pm \sqrt{T}\sqrt{\alpha^2+(k {\rm \pi}- \phi)^2}. \end{equation}
Here, the integer  $k$ replaces $n$ in (4.3)–(4.4), with symmetric/anti-symmetric modes being associated with even/odd values of $k$. The integer $k$ must also be positive to ensure positive values for $\gamma _i$. The $\pm$ in (4.5) represents the two possible frequencies in the problem, but only the solution associated with the positive sign leads to positive frequencies for negative streamwise wavenumbers. Also note that the factor $h$ was incorporated in the normalisation of $\alpha$ and $\omega$ in the current expression.
Equation (4.5) is precisely the dispersion relation of a planar duct with an assumed impedance at the wall (Rienstra & Hirschberg Reference Rienstra and Hirschberg2002); the limiting cases  $\phi =-{\rm \pi}$ and $\phi =0$ are associated with soft- ( $\,p=0$) (impedance $Z=0$) and hard-wall ( $\partial p / \partial y =0$) $|Z|=\infty$ boundary conditions. Any value of impedance in between these values may be represented by the reflection phase $\phi$, and the connection between this parameter and the impedance of the wall $Z$ may be obtained using the definition
 \begin{equation} Z=Z_{re}+\mathrm{i} Z_{im}=\left.\frac{p}{v}\right|_{y=0}=\left( \frac{1+\chi_i}{1-\chi_i} \right) \frac{(\mathrm{i} \omega -\mathrm{i} \alpha M)}{T\gamma_i}=\left( \frac{1+\mathrm{e}^{\mathrm{i}\phi}}{1-\mathrm{e}^{\mathrm{i}\phi}} \right) \frac{(\mathrm{i} \omega -\mathrm{i} \alpha M)}{\gamma_i T}. \end{equation}
The real and imaginary parts of impedance in (4.6) are also connected to the physical behaviour of the mean transmitting sound. As described in Rienstra & Hirschberg (Reference Rienstra and Hirschberg2002), the imaginary component of impedance represents the inertia and elasticity of the medium transmitting sound, while the real part is associated with resistance to the passage of acoustic waves (or the absorption of energy by the surface). We are most interested in the cases with total reflection ( $|\chi |=1$), such that $Z$ has zero real part and is purely imaginary.
Figure 13 shows the values of reflection phase and the equivalent imaginary part of the impedance of the shear layer for  $M=0.8$ and $T=1$ for frequencies and wavenumbers where total reflection occurs. Note that the real part of the impedance for these waves (associated with $|\chi _i=1|$) is always zero. The plots in figure 13 show that the reflection phase $\phi$ varies from zero (close to the sonic line) to $-{\rm \pi}$ (incident angles close to $90^\circ$). The calculated impedance follows the expected behaviour for these reflection angles, going from $Z_{im} \to -\infty$ close to the sonic line to $0$ as the incidence angle approaches $90^\circ$ – again, these two limits are associated with hard- and soft-wall boundary conditions. The behaviour of the impedance is quite different from the one observed for supersonic phase velocities (oscillatory waves in the quiescent region), shown in figure 14. For these frequency–wavenumber pairs, the imaginary part of the impedance is always zero, except very close to the sonic line (represented by the red-dashed line in figure 14b), where it becomes very high in magnitude. The real part, however, has non-trivial amplitudes in that region. All these features are seen more clearly in figure 14(c), which shows the impedance values for $\omega =1$ and phase velocities close to $c=-1$. Especially clear in this plot is the fact that the real and imaginary parts of the impedance become very high in magnitude as they approach the sonic line. These results suggest that, when total reflection occurs, the shear layer behaves in a manner analogous to an elastic sheet that allows for pressure transmission to the outside. This transmission leads to strong-but-evanescent (or decaying) waves that can still carry significant amounts of energy in the upstream direction, as will be seen shortly.

Figure 13. Reflection phase  $\phi$ (a) and calculated imaginary part of the impedance $Z$ at the shear layer (b) for $M=0.8$ and $T=1$ and subsonic phase velocities.

Figure 14. Real (a) and imaginary (b) parts of the impedance  $Z$ at the shear layer for $M=0.8$ and $T=1$ and supersonic phase velocities. Behaviour of $Z$ as function of phase velocity of the wave close to $c=-1$ (c).
Equation (4.5) may be used to predict the frequency–wavenumber pairs for which the standing wave in the scattering problem would fit inside of a jet of height  $h$. This may be done by finding the values of $(\omega,\alpha )$ for which the phase of the reflection $\phi$ satisfies (4.5). This solution is depicted by the red squares in figure 15, for both the symmetric and anti-symmetric modes at $M=0.8$ and $M=1.2$. In the same figure, the soft- and hard-wall duct dispersion relations are plotted, as well as the guided-jet mode solution obtained from the DVS. It is clear that the behaviour of the mode for higher magnitudes of $\alpha$ is well captured by the soft-wall duct dispersion relation, a result also observed in Towne et al. (Reference Towne, Cavalieri, Jordan, Colonius, Schmidt, Jaunet and Brès2017) for circular jets. However, the key new result here is that the branch point (which must occur at the line $\alpha =-\omega$) of the guided-jet mode is bound by the hard-wall duct dispersion relation; the intersection between this dispersion relation and the sonic line matches the DVS branch point perfectly. This is consistent with the results of figure 13 that the shear layer acts as a wall with the hard-wall boundary condition ( $Z_{im} \to -\infty$) for sonic phase speeds in the scattering problem (at least if only two-dimensional disturbances are considered). It is worth noting that this trend is also similar to the one identified in Martini et al. (Reference Martini, Cavalieri and Jordan2019) when studying downstream-travelling supersonic modes, suggesting that hard-walled duct behaviour is usually found for $|c|=1$ for modes of similar nature. Finally, the comparison between results from the DVS and the dispersion relation obtained from the standing-wave argument leads to a perfect match, providing final proof that, at least in a planar jet, wave reflection and transmission underpin the structure known as the guided-jet mode. A derivation showing the equivalence of (4.5) and (2.23) is presented in Appendix A.

Figure 15. Prediction of cut-on frequency–wavenumber pairs of totally reflected acoustic waves based on the wavelength of standing waves. Solution for symmetric (a,c) and anti-symmetric (b,d) modes for  $M=0.8$ (a,b) and $1.2$ (c,d), with $T=1$. Dotted (..) blue lines indicate the sonic line, magenta solid (-) and dashed (- -) lines indicate the soft- and hard-wall duct dispersion relations, black dash-dot (-.-) lines indicate the guided-jet mode obtained from the DVS dispersion relation and red squares ( $\square$) show the frequencies obtained from the standing-wave argument using the SVS.
As the solution at the branch point is associated with a hard-wall boundary condition, a closed expression for that point may be obtained from the dispersion relation. After some algebra, the Strouhal numbers of the branch points for symmetric modes are found to be
 \begin{equation} St_{br,S}=\frac{2 n}{2M\sqrt{\dfrac{(M+1)^2}{T}-1}}, \end{equation}
and, for anti-symmetric modes,
 \begin{equation} St_{br,A}=\frac{2 n + 1}{2M\sqrt{\dfrac{(M+1)^2}{T}-1}}, \end{equation}
where  $n$ is a non-negative integer. One should note that no branch point is recovered if $M<\sqrt {T}-1$. This is to be expected, as total reflection only occurs for $\alpha =-\omega$ and $-\omega \geqslant \alpha \geqslant -\omega /(\sqrt {T}-M)$ – no value of $\alpha$ is within this interval for $M<\sqrt {T}-1$. Figure 16 shows the behaviour of $St_{br}$ as a function of Mach number, which is in line with results from the literature (Gojon et al. Reference Gojon, Gutmark and Mihaescu2019). These are also the equivalent forms of the expressions obtained by Tam & Norum (Reference Tam and Norum1992) for a planar jet, derived by simply replacing $\alpha =-\omega$ in the DVS dispersion relation.

Figure 16. Branch points for the symmetric (a) and anti-symmetric (b) solutions and  $T=1$ as a function of Mach number. Note that the first symmetric branch point is at zero frequency.
5. Wave propagation and energy flux
The analysis in the previous section provides insight into the dynamics of the guided-jet mode, including the location where it is generated, its spatial support and a reasoning for its discrete frequency–wavenumber behaviour. However, it does not provide any explanation for its direction of propagation. As mentioned in § 3, the guided-jet mode may be defined as the upstream-travelling part of the neutral discrete waves supported by a jet at negative wavenumbers; if one follows each branch of the dispersion relation, it is clear that, depending on the Mach number, waves belonging to that branch could be either upstream or downstream travelling. We now proceed to uncover why this change in direction of propagation occurs.
Considering first the part of the wave that is transmitted to the quiescent medium, for the range of incidence angles considered in this work, it is straightforward to see that any transmitted wave will travel upstream ( $90^\circ \leqslant \theta _o \leqslant 180^\circ$). Even for the waves with subsonic phase speed in the axial direction, there is no mechanism by which acoustic waves in the quiescent region can produce a downstream propagation of energy. This is not true in the flow region. Recalling that planar waves are defined in the frame of reference of the stream, in the frame of reference at rest, waves impinging directly on the shear layer ( $\theta _i=180^\circ$) must be convected downstream. On the other hand, for subsonic Mach numbers, waves travelling perpendicular to the shear ( $\theta _i=90^\circ$) will carry energy in the upstream direction. The angle at which the transition between upstream and downstream transport of energy occurs can be obtained by rewriting the velocity of the wave in the stationary frame of reference
 \begin{equation} v_x=\sqrt{T}[M-\sin{({\rm \pi}-\theta_i)}]. \end{equation}
The phase velocity associated with zero streamwise velocity is then given by
 \begin{equation} c_0=M-\sqrt{T(b^{{-}2}+1)}, \end{equation}
with
 \begin{equation} b=\tan{({\rm \pi}-\text{asin}\,{M})}. \end{equation}
 The expression above defines the minimum phase velocity of acoustic waves that carry energy in the upstream direction; if  $c< c_0$ (or $\alpha >\omega /c_0$), the wave will transport energy in the downstream direction. This value of phase velocity is also the one associated with saddle points predicted in the spatial analysis of planar ducts (similar to Rienstra & Hirschberg Reference Rienstra and Hirschberg2002; Towne et al. Reference Towne, Cavalieri, Jordan, Colonius, Schmidt, Jaunet and Brès2017).
5.1. Energy flux
To quantify the transport of energy by these waves, a streamwise energy flux (or intensity)  ${\rm I}_{x,i}$ per unit $z$ may be defined in the same fashion as in Rienstra & Hirschberg (Reference Rienstra and Hirschberg2002), which can be rewritten consistent with the current normalisation as
 \begin{equation} {\rm I}_{x,(i,o)}=\int \frac{1}{T_{i,o}} \text{Re}\left[ (1+M_{i,o}^2) p_{i,o}u^*_{i,o}+M_{i,o} u_{i,o} u^*_{i,o}+M_{i,o} p_{i,o}p^*_{i,o} \right] {\rm d}y, \end{equation}
where the superscript  $^*$ indicates the complex conjugate, which leads to a real-valued energy flux. Here, this flux is integrated between $y=-h/2$ and $0$ (or half the width of a planar jet) in the flow region, and between $y=0$ and $\infty$ in the quiescent region. The integration limits are defined considering the symmetry of the problem, so as to provide a clearer connection to the planar-jet problem. It is important to note that the flux is not a well-defined quantity in linearised acoustics (Morfey Reference Morfey1971), and it can only provide an approximation of the direction energy is carried in the flow. Eigen-analysis of these flows leads to modes (frequency–wavenumber pairs associated with different waves in the flow) that carry energy in the upstream or downstream direction; the propagation direction in this case is well defined by the Briggs–Bers criterion (Briggs Reference Briggs1964). Modes are not defined in the scattering problem, but it may be expected that (5.4) provides a good approximation for the energy flux associated with each frequency–wavenumber pair, at least if waves are acoustic-like and neutrally stable.
We start the analysis with the different flux components for the  $M=0.8$ case. Figure 17 shows the flux obtained from (5.4) in both the quiescent (a) and flow (b) regions. As expected, the energy flux is negative in the quiescent region as the energy is transported in the direction of propagation of the wave; there is no mechanism by which this wave could transport energy downstream in this region. The flux magnitude in the quiescent region is maximum at the sonic line ( $\alpha =-\omega$), which is due to two factors. First, the transmission coefficient is maximum at this point, which naturally increases the flux. The second (and more important) factor is that the wave is oscillatory at the sonic line, and becomes progressively more decaying in the $y$-direction as its phase velocity decreases in magnitude. Given the integration is performed between the shear layer and infinity, the damping of the wave with increasing distance from the shear layer means the contribution of these perturbations to the integral (5.4) becomes vanishingly small as the wave becomes increasingly confined.

Figure 17. Streamwise energy flux for waves travelling in the quiescent region (a) and flow region (b) as a function of frequency and wavenumber for  $M=0.8$. Logarithms of the absolute value of the ratio between the fluxes (c) and the total-energy flux (d) are also shown. Black dashed lines indicate wavenumber–frequency pairs where total reflection occurs, and the red dashed line indicates the phase speed associated with no energy propagation in the streamwise direction. Grey dot-dashed lines indicate regions where the flux is zero, and magenta dots represent the dispersion relation of the guided-jet mode.
In the flow region, the behaviour of the flux is qualitatively different, as shown in figure 17(b). The flux may be positive or negative depending on the angle of propagation of the wave, with the propagation angle that produces no net-energy propagation indicated with the dashed red line. For wavenumbers to the left of the red line (blue region of the plot), the energy flux is negative and energy is transported in the upstream direction. As the incidence angles steepens (or as  $\alpha$ increases in magnitude), more and more energy is transmitted in the upstream direction, which is in line with the expected physical behaviour for these acoustic waves. The equivalent behaviour is observed for wavenumbers to the right of the red line (red region), where energy is transported downstream; the wave is convected by the flow.
Since the fluxes in the flow and quiescent regions may have different signs depending on the propagation angle, the frequency–wavenumber space may be divided into three distinct zones, based on contribution of each region to the overall flux and the resultant direction of net energy propagation. This is shown as  $\log (|{\rm I}_{x,o}|/|{\rm I}_{x,i}|)$ in figure 17(c); magenta zones in these plots indicate that the energy flux is dominated by the quiescent region (which only carries energy upstream), and green zones indicate that the propagation of energy is dominated by the flow region (which may carry energy upstream or downstream). In this plot, it is clear that the quiescent region dominates the energy flux for waves with phase velocity close to the quiescent-region speed of sound (zone 1). The behaviour as streamwise wavenumber becomes more negative is not monotonic, with three zero crossings and one discontinuity. The most complex behaviour is evident in zone 2, which exhibits the following trends with reductions in the magnitude of streamwise phase velocity: first, the relative contribution of the quiescent region to the total flux reduces until the first zero crossing is reached, at which point the regions contribute equally. With further reduction, the contribution from the flow region decreases until it reaches another minimum; although the fluxes in both regions are reducing, the reduction is more rapid in the flow stream. This then leads to a second zero crossing, before the ratio becomes discontinuous as the phase velocity corresponding to no energy propagation ( $c=c_0$) in the flow region is reached. From this point onwards, the trends are monotonic, with one final point of equal contribution before the flow region increasingly dominates as the phase velocity reduces in magnitude; this monotonic region is referred to as zone 3.
To produce a final explicit link between the results of the acoustic-scattering problem and the dispersion relation of the vortex sheet, we consider the total net flux across the entire integration region. A comparison between this total flux and the dispersion relation of the guided-jet modes is shown in figure 17(d). The group velocity of the discrete waves predicted by the DVS is in close agreement with the values of flux computed in the scattering problem; whenever the slope is negative (associated with upstream-travelling waves), the mode is found to be in the blue region of the plot, while positive-group-velocity waves are co-located with positive (downstream) energy flux. The magnitude of the phase velocity also follows the strength of the flux computed by the model. The comparison is not perfect; when the flux is very close to zero the scattering problem and the DVS predict slightly different points of zero group velocity. Nonetheless, this result not only reinforces the link between the two models, but also provides a lens through which to understand the behaviour of the guided-jet mode: changes in the group velocity of the guided-jet mode can be linked to changes in the total-energy flux between the jet and its environment.
5.2. The effect of Mach number
As detailed in Towne et al. (Reference Towne, Cavalieri, Jordan, Colonius, Schmidt, Jaunet and Brès2017), the guided-jet mode exhibits a complicated dependence on Mach number. Additionally, one of the least intuitive aspects of this mode is that it can transport energy upstream in a supersonic jet, despite having peak amplitudes within the supersonic core of the flow. We now consider the effect of Mach number, with four values chosen to span the range over which the guided-jet mode exhibits qualitative changes in behaviour, as shown in figures 18 (for the flow-region flux) and 19 (for the total flux, with the results of the DVS superposed). The behaviour in the quiescent region remains qualitatively the same as a function of  $M$ and is omitted for brevity. For sufficiently low Mach number, the phase speed associated with stationary waves in the flow ( $c=c_0$, the dashed red line in figure 17) is located to the right of the sonic line, meaning that all subsonic waves are upstream travelling. This is exemplified in figure 18(a) for $M=0.6$. As such, for any incident wave with an upstream component, the resultant total-energy flux must be negative; no downstream-travelling waves can be produced in this region at this Mach number for upstream-travelling incident waves. This is confirmed by the results of the DVS in figure 19(a); all discrete modes are upstream travelling for this case (see also Jordan et al. Reference Jordan, Jaunet, Towne, Cavalieri, Colonius, Schmidt and Agarwal2018). As the Mach number increases, the line $\omega /\alpha =c_0$ crosses the sonic line, allowing for downstream-travelling disturbances in the flow region to be produced by the interaction of upstream-propagating waves with the shear layer for this rage of frequencies and wavenumbers. Increasing $M$ further decreases the slope of the $\omega /\alpha =c_0$ line, increasing the size of the parameter space where downstream-travelling waves are allowed, while constricting the values of $\omega$ and $\alpha$ that correspond to negative energy flux. Finally, at supersonic Mach numbers, no upstream-travelling wave is allowed within the flow, and all waves in the flow will transfer energy in the downstream direction. This is an entirely expected result, as no acoustic perturbation can propagate in the upstream direction (in a frame of reference at rest) in a supersonic flow.

Figure 18. Streamwise energy flux for waves travelling in the flow region, integrated between  $y=-h/2$ and $0$ as a function of frequency and wavenumber for $M=0.6$ (a), $M=0.7$ (b), $M=0.9$ (c) and $M=1.2$ (d). Black dashed lines indicate the region where total reflection occurs, and the red dashed line indicates the phase speed associated with no energy propagation in the streamwise direction.

Figure 19. Total-energy flux as a function of frequency and wavenumber for  $M=0.6$ (a), $M=0.7$ (b), $M=0.9$ (c) and $M=1.2$ (d). Black dashed lines indicate the frequency and wavenumber pairs where total reflection occurs, and the red dashed line indicates the phase speed associated with no energy propagation in the streamwise direction in the flow region. Grey dash-dot lines indicate the frequency/wavenumber pairs where the flux is zero. The magenta dots indicate the frequencies and wavenumbers of the guided-jet mode.
Considering the propagation of waves in the flow region offers some insight into the behaviour of the guided-jet mode, particularly in the region  $0.8 \leqslant M < 1$. The total flux, as presented in figure 19 can be examined to provide insight into the broad role of the guided-jet mode. The grey lines in this figure indicate regions where the fluxes in both regions are equal in magnitude and opposite in direction. These indicate regions where the total energy of the wave does not travel in either direction – or the energy flux in the quiescent region is perfectly counterbalanced by the one in the flow region. Inspection of figure 19 shows that these grey lines are very close to the position of the saddle points of the guided-jet and duct-like modes, but they do not match perfectly. The reason for this slight mismatch is not clear, but one possibility is that the definition of energy flux given in Rienstra & Hirschberg (Reference Rienstra and Hirschberg2002) (which considers acoustic homentropic disturbances and uniform flow) may not be the most appropriate choice for the description of the present phenomenon (Morfey Reference Morfey1971; Campos & Kobayashi Reference Campos and Kobayashi2013). Still, the energy fluxes provide a very good first approximation of the saddle points and the direction of propagation of the different waves in the flow, indicating that the upstream energy flux of the quiescent medium is a key ingredient of the physics of this mode.
The flux analysis provides the final piece of the guided-jet mode puzzle. It shows that the direction of propagation of the discrete waves with negative phase velocity from the spatial Navier–Stokes spectrum can be approximated by their energy flux, which can be defined in the context of an acoustic-scattering problem. This is the key to understanding why the modes close to the acoustic line propagate in the upstream direction, even in supersonic jets; due to the large outreach and high transmission coefficient of the transmitted wave in the quiescent medium, its energy flux is so strong for those wavenumbers that it overcomes the flux magnitude of the wave inside of the jet, which carries energy downstream. It also explains the presence of different neutral saddle points in the spectrum, which are associated with a change in flux direction; a change in flux also leads to a change in group velocity of the wave. Finally, the analysis of the flux also explains the behaviour of the guided-jet and duct modes as a function of Mach number, as the flux in the flow region changes considerably with that parameter.
6. Three-dimensional disturbances
6.1. Oblique waves
The previous sections connected the overall behaviour of the guided-jet mode with the acoustic-scattering problem, shedding light on several characteristics of this mode. While most of these conclusions may be naturally extended to the three-dimensional case, some differences may be expected. A key difference is the position of the branch points and the frequencies and wavenumbers where an acoustic wave can be oscillatory in the media. The simplest way to consider three-dimensionality is to introduce a wavenumber in the  $z$ direction, $\beta$, so that the normal-mode ansatz becomes $\tilde {q}(x,y,z,t)=q(y) \exp (-\mathrm {i}\omega t + \mathrm {i} \alpha x + \mathrm {i} \beta z)$, where $q$ is any of the flow variables introduced in § 2 or the $z$-velocity. The final equation for pressure may be obtained using the three-dimensional linearised Euler equations in the same fashion as in the two-dimensional case, and is given by
 \begin{equation} \left[ \frac{\mathrm{d}}{\mathrm{d} y^2} -(\alpha^2 + \beta^2) + \frac{(\omega -\alpha M_{i,o})^2}{T_{i,o}} \right] p_{i,o} = 0. \end{equation}
Thus, the introduction of a  $z$-wavenumber leads to changes in the definition of the resulting wavenumber in $y$, as $\gamma _{i,o}$ now take the form
 \begin{equation} \gamma_{i,o} = \mathrm{i} \sqrt{\frac{(\omega-\alpha M_{i,o})^2}{T_{i,o}}-(\alpha^2+\beta^2)}. \end{equation}
 The equation above tells us that, for oblique waves ( $\beta \neq 0$), the wavenumbers $\alpha$ in which waves may be oscillatory (defined as the frequencies and wavenumbers at which $\gamma _{i,o}$ are purely imaginary numbers) in either media are not the same as in the two-dimensional case. This is shown in figure 20. For disturbances travelling in the quiescent region, the range of frequencies and wavenumbers at which the transmitted waves are oscillatory shrinks considerably, and the limiting point for which plane waves travelling directly upstream are supported in that region now fall in the parabola $\alpha ^2+\beta ^2=\omega ^2$, and a similar phenomenon occurs for disturbances travelling in the flow region. This also impacts the reflection and transmission coefficients resulting from the scattering problem, also shown in figure 20 (note that results of these coefficients for non-oscillatory waves in the fast region should be disregarded). The behaviour of both coefficients is quite similar to what has been observed in the two-dimensional case, but the region where total reflection occurs has a significant change in its shape, going from a perfect triangle to a deformed/curved one. This also changes the frequencies and wavenumbers at which the guided-jet mode is expected to be present, especially its branch point, which is now observed to occur at supersonic streamwise wavenumbers. Interestingly, the inclusion of a wavenumber in $z$ also precludes the support of a guided-jet mode under the curve ${(\omega -\alpha M)^2}/{T}-(\alpha ^2+\beta ^2)=0$, as waves are not oscillatory in the fast-stream region. This is confirmed in the vortex-sheet calculations including $\beta$, also shown in figure 20. The overall behaviour of the modes is very similar to the two-dimensional case, but the first branch is obtained for $(\omega,\alpha )=(\beta,0)$, instead of $(0,0)$. Also, the first symmetric mode does not have an upstream-travelling region close to the branch point, and only the soft-duct-like behaviour is recovered for that mode. Modes of higher order follow their usual behaviour, with modes varying from upstream to downstream travelling depending on their frequency and wavenumber.

Figure 20. Imaginary part of  $\gamma _o$ (a) and $\gamma _i$ (b) and the respective absolute value of reflection (c) and transmission coefficients (d) for $M=0.8$, $T=1$ and $\beta =5$. Region between the two red dashed lines indicates where total reflection occurs in the $\beta =0$ case, while the region between the two black dot-dashed lines indicates where total reflection occurs in the $\beta =5$ case. Cyan solid lines indicate the dispersion relation obtained from the planar vortex sheet for $\beta =5$.
6.2. Cylindrical waves
The cylindrical-polar formulation does not lend itself to an inner-scattering problem in a straightforward manner, so the present results cannot be directly extended to round jets. However, some of the features identified in the planar-jet case can also be observed in the cylindrical one. This is seen in figure 21, where the hard- and soft-duct dispersion relations are overlaid with the guided-jet mode one for  $M=0.8$, $1.2$ and $m=0, 1$. As expected (see Towne et al. Reference Towne, Cavalieri, Jordan, Colonius, Schmidt, Jaunet and Brès2017), the dispersion relation obtained from the CVS matches the soft-duct one for higher frequencies – this is the region where the wave behaves like a confined duct mode. For $m=0$, the branch point is bounded by the hard-duct dispersion relation for both Mach numbers, as in the planar-jet case. However, the comparison deteriorates for $m=1$; while each branch is still contained between the dispersion relations of hard- and soft-wall ducts, the branch point occurs at a significantly higher frequency than predicted by the hard-duct modes. These results are not new. Both in Tam & Hu (Reference Tam and Hu1989) and Tam & Ahuja (Reference Tam and Ahuja1990), the authors recover the branch points (or cutoff points) directly from the cylindrical dispersion relation. While the connection with duct modes is not made in these works, it is clear that the reduced dispersion relations obtained for $m=0$ modes match perfectly that of the hard-duct modes, namely ${\rm J}'_0(\gamma _i/2)=0$ (Rienstra & Hirschberg Reference Rienstra and Hirschberg2002). For $m>0$, however, these branch points are predicted by the expression
 \begin{equation} 2 m {\rm I}_m \left( \frac{\gamma_i}{2} \right)+\frac{\gamma_i}{2}\frac{T}{(1+M)^2}\left[ {\rm I}_{m+1}\left(\frac{\gamma_i}{2}\right) + {\rm I}_{m-1}\left(\frac{\gamma_i}{2}\right) \right] = 0, \end{equation}
with  $\gamma _i$ evaluated at $\omega =-\alpha$. The first and second terms of the sum are associated with the soft- and hard-duct dispersion relations, respectively; since both are non-zero for $m>0$, the branch point may be interpreted as connected to the behaviour of a duct with a complex impedance between $-\mathrm {i} \infty$ and $0$ for the helical case. This behaviour could also be reminiscent of the behaviour of the guided-jet mode for oblique disturbances, which displays saddle points significantly closer to the sonic line compared with the planar case.

Figure 21. Solution for  $m=0$ (a,c) and $m=1$ (b,d) modes for $M=0.8$ (a,b) and $1.2$ (c,d) and $T=1$. Dotted (..) blue lines indicate the sonic line, magenta solid (-) and dashed (- -) lines indicate the soft- and hard-wall duct dispersion relations, black dash-dot (-.-) lines indicate the guided-jet mode obtained from the DVS dispersion relation. Red circles indicate predictions of the branch points from Tam & Ahuja (Reference Tam and Ahuja1990).
7. The guided-jet modes as a necessary condition for resonance
In the previous sections, the most fundamental characteristics of the guided-jet mode were linked to the behaviour of acoustic waves predicted by the Navier–Stokes equations. In summary, it is now apparent that the guided-jet mode is a manifestation of total-internal-reflection mechanisms, arising from the shear layer behaving like a hard duct. After total reflection, only discrete streamwise wavenumbers may be supported by the flow, with these wavenumbers dictated by the fact that the standing wave formed inside of the jet must fit between the two shear layers. Close to the sonic line, the transmission of this mode to the outside is maximum, leading to a net-energy flux directed upstream, which dictates the direction of propagation of this mode in the eigenspectrum, providing a clear connection to the more well-known soft-duct mode identified in Towne et al. (Reference Towne, Cavalieri, Jordan, Colonius, Schmidt, Jaunet and Brès2017). However, these results do not tell us why the guided-jet mode is important for resonance. This section aims to provide some insight on this phenomenon, by considering two possible explanations.
First, we recapitulate what is known about the role of the guided-jet mode in screeching and impinging jets. Since the first clear evidence for this wave in screeching jets was provided in Gojon et al. (Reference Gojon, Bogey and Mihaescu2018), to the best of our knowledge there have been no published examples of screech occurring at conditions where the guided-jet mode is not predicted to exist, and a plethora of examples of screech occurring when it does (Edgington-Mitchell et al. Reference Edgington-Mitchell, Jaunet, Jordan, Towne, Soria and Honnery2018; Gojon et al. Reference Gojon, Gutmark and Mihaescu2019; Li et al. Reference Li, Zhang, Hao and He2020, Reference Li, Liu, Hao, Zhang and He2021; Sheng et al. Reference Sheng, Li, Wang, Hao, Zhang and He2022; Karnam, Saleem & Gutmark Reference Karnam, Saleem and Gutmark2023). For impinging jets, the evidence is more mixed, with many, but not all, tones falling within the expected bands of the guided-jet mode (Gojon et al. Reference Gojon, Bogey and Marsden2016; Bogey & Gojon Reference Bogey and Gojon2017; Jaunet et al. Reference Jaunet, Mancinelli, Jordan, Towne, Edgington-Mitchell, Lehnasch and Girard2019; Liu et al. Reference Liu, Li, Liu, Hao, Zhang and He2021; Li et al. Reference Li, Wu, Liu, Zhang, Hao and He2023; Varé & Bogey Reference Varé and Bogey2023). Evidently, jet screech cannot occur without the guided-jet mode, while impingement tones are frequently, but not always, supported by the guided-jet mode. Why does screech require the guided jet mode, while the resonance of an impinging jet does not? In Edgington-Mitchell & Nogueira (Reference Edgington-Mitchell and Nogueira2023) and other works, we have suggested that the guided-jet mode must be somehow more ‘efficient’ at carrying energy upstream in the resonance cycle, essentially increasing one parameter of the gain equation first proposed by Powell (Reference Powell1953). As impingement tones are typically much stronger than screech tones, we had previously argued that the upstream component of resonance could therefore afford a wider range of efficiencies, permitting either a free-stream acoustic wave or our theorised more efficient guided-jet mode. We now proffer a different explanation.
In screeching jets, we now believe it is clear that the triadic-interaction mechanism proposed by Tam & Tanna (Reference Tam and Tanna1982) is responsible for the conversion of some fraction of the downstream-propagating energy into upstream-propagating energy; extensive empirical evidence is provided for this argument in Edgington-Mitchell et al. (Reference Edgington-Mitchell, Li, Liu, He, Wong, Mackenzie and Nogueira2022). As this interaction is occurring between the Kelvin–Helmholtz wavepacket and the shocks, and the shocks are bounded by the shear layer of the jet (more specifically the sonic line), it follows that the upstream-propagating wave can only be produced inside the shear layer of the jet. Any wave produced inside the jet will inevitably be subject to reflection and transmission at the jet boundaries, and as already discussed, what is the guided-jet mode but a representation of an acoustic wave generated inside of the jet with particular transmission and reflection characteristics? Critically, however, as detailed in § 4, the required total-reflection mechanisms can only occur for particular wavenumber–frequency combinations, which correspond to the wavenumber–frequency ranges over which the guided-jet mode exists in the vortex-sheet dispersion relation. At these conditions, the wave is transmitted to the outside of the jet, displaying an exponential decay rate with increasing radius that is dependent on how close the phase velocity is to the sonic line. This transmitted component travels upstream and closes the feedback loop. We can thus state:
What has been termed the guided-jet mode is an acoustic wave generated within the flow, at an angle and frequency such that the wave propagates upstream with a slow radial decay. In a screeching jet, energy from the interaction of the downstream-propagating Kelvin–Helmholtz wavepacket and the quasi-stationary shock cells is redistributed in the form of pressure fluctuations. These fluctuations are generated inside the jet, and, if the aforementioned angle and frequency conditions are satisfied, they propagate strongly in the upstream direction due to a high degree of transmission through the shear layer, and lead to high flow responses inside the jet. This suggests that screech can only occur if some region of the flow is able to support the guided-jet mode.
We distinguish the mechanism by which resonance is closed from the mechanism for the generation of far-field sound, which may instead be associated with shock-leakage processes at the boundary of the jet as per Suzuki & Lele (Reference Suzuki and Lele2003), Shariff & Manning (Reference Shariff and Manning2013) and Edgington-Mitchell et al. (Reference Edgington-Mitchell, Weightman, Lock, Kirby, Nair, Soria and Honnery2021b); the relative contribution of each remains an open question. We also note that the fact that in the vortex-sheet dispersion relation the guided-jet mode appears as a discrete wave is essential to its role as a component in describing the resonance process as an absolute instability (Nogueira et al. Reference Nogueira, Jordan, Jaunet, Cavalieri, Towne and Edgington-Mitchell2022c). As an additional note, we wish to emphasise the degree to which the aforementioned conclusions have been suggested implicitly or explicitly in the various works of Professor C. Tam. From the identification of triadic interaction as the mechanism of energy transfer (Tam & Tanna Reference Tam and Tanna1982; Tam, Seiner & Yu Reference Tam, Seiner and Yu1986), to the link between the structure of the guided-jet mode and the jet behaving as an acoustic waveguide (Tam & Hu Reference Tam and Hu1989; Tam & Ahuja Reference Tam and Ahuja1990; Tam & Norum Reference Tam and Norum1992), much of what we show here has been predicted, suggested or demonstrated in another form in Professor Tam's body of work, and we are indebted to him for this.
Why then, is the guided-jet mode always necessary for jet screech, but appears to only sometimes govern the resonance of impinging jets? The mechanism by which the downstream-propagating wavepacket transfers energy to the upstream-propagating wave is quite different in the case of impingement on a surface or edge. A consideration of the extant literature on jet impingement tones reveals significant variation in the identified sound source mechanism and location. Considering imperfectly expanded jets, Henderson et al. (Reference Henderson, Bridges and Wernet2005) identified fluctuations of the wall jet at a radial distance of  $1.3D$ from the centreline impingement point as the source of upstream-propagating waves, and Weightman et al. (Reference Weightman, Amili, Honnery, Soria and Edgington-Mitchell2017) observed a transient shocklet at this distance producing a sharp upstream-propagating wavefront. In contrast, in the nearly ideally expanded numerical simulations of Bogey & Gojon (Reference Bogey and Gojon2017) and Varé & Bogey (Reference Varé and Bogey2023), the effective source appears to be at the impingement point itself, i.e. contained within the core of the jet. This then would explain why in some configurations the guided-jet mode appears to dictate impingement tones, while in others it does not; the conversion of downstream-propagating energy into the upstream may occur outside the jet (which is especially relevant in shock-dominated impingement phenomena), in which case the guided-jet mode is irrelevant, or it may occur within the core of the jet, in which case it is a requirement.
8. Conclusions
In the present work, the behaviour of discrete modes with negative phase velocity (namely the guided-jet mode and duct-like modes) in the linearised Navier–Stokes spectrum was analysed by connecting it with an acoustic-scattering problem. Recent works have highlighted the importance of these modes in a myriad of resonance phenomena including screech (Edgington-Mitchell et al. Reference Edgington-Mitchell, Jaunet, Jordan, Towne, Soria and Honnery2018; Gojon et al. Reference Gojon, Bogey and Mihaescu2018; Mancinelli et al. Reference Mancinelli, Jaunet, Jordan and Towne2019; Nogueira et al. Reference Nogueira, Jordan, Jaunet, Cavalieri, Towne and Edgington-Mitchell2022c), impingement/edge tones (Tam & Ahuja Reference Tam and Ahuja1990; Tam & Norum Reference Tam and Norum1992; Jordan et al. Reference Jordan, Jaunet, Towne, Cavalieri, Colonius, Schmidt and Agarwal2018) and high-subsonic jet resonance (Towne et al. Reference Towne, Cavalieri, Jordan, Colonius, Schmidt, Jaunet and Brès2017). However, the nature of this mode and a clear explanation for its behaviour as a function of frequency have not been expounded.
Analysis of the scattering problem with waves originating in the quiescent region reveals that there is no mechanism through which a planar wave travelling directly upstream can be transmitted to the flow region, precluding the generation of patterns such as that associated with the guided-jet mode. On the other hand, waves generated in the flow region can experience total reflection for a range of frequencies and wavenumbers, and the range of frequency and wavenumber pairs over which this occurs matches the range for which discrete modes are observed in the planar-jet vortex sheet. In this range, the phase of the reflection determines the wavelength of the standing wave formed in the flow region. Even though the reflection coefficient is unitary in this range, maximum transmission is observed when disturbances are sonic (despite the fact that disturbances in the quiescent region are decaying, as highlighted by Keller Reference Keller1955); the transmission coefficient then rapidly decreases as this wave becomes more and more subsonic, leading to mode structures confined to the flow region, which assume the shape of a standing wave in  $y$. By imposing a requirement that this structure must match with the width of a planar jet, the dispersion relation of the discrete modes is recovered perfectly.
To obtain the direction of propagation of the resulting wave, the energy flux in the streamwise direction was calculated and compared with the dispersion relation obtained from the DVS model. It was shown that, at frequency–wavenumber pairs close to the sonic line, the energy flux is dominated by the quiescent-region direction (a consequence of high transmission values in this regime), with increases in wavenumber producing a concomitant increase in the flux associated with the flow region. Depending on the Mach number, both upstream- and downstream-travelling waves are obtained from the flux calculation, which closely match the behaviour of the group velocity of the discrete modes from the vortex-sheet model. The frequency–wavenumber pairs for which the net flux over both regions is zero closely approximate the saddle points from the vortex-sheet model.
These results altogether suggest that the discrete modes in the negative part of the Navier–Stokes spectrum are of acoustic origin, with the particularity that disturbances are totally reflected (or trapped) inside of the jet. For high wavenumbers, this trapped wave has no support in the quiescent region, with the jet behaving almost like a soft duct. However, for wavenumbers close to the sonic line, the amplitude of the transmission is strong, but the wave is nonetheless evanescent/decaying in  $y$. Even though it decays exponentially in $y$, this wave still carries significant amounts of energy in the upstream direction, critical to the function of the guided-jet mode in closing resonance. The current results build upon the work of Martini et al. (Reference Martini, Cavalieri and Jordan2019) in unifying the different eigenvalues in the negative-wavenumber half-plane previously studied by Tam & Hu (Reference Tam and Hu1989) and Towne et al. (Reference Towne, Cavalieri, Jordan, Colonius, Schmidt, Jaunet and Brès2017) under a single label: acoustic duct-like modes. While they seem to share the same nature, details such as direction of propagation, transmission rate and spatial support are defined by their streamwise wavenumber and the other physical parameters of the problem, such as Mach number and temperature ratio.
As a way to introduce some three-dimensionality to the problem, oblique waves were also considered. The analysis shows that the regions where one may expect to find discrete modes in the spectrum is deformed for non-zero  $z$-wavenumbers; in fact, the branch point occurs for subsonic streamwise wavenumber, and the flow displays a region in which no discrete mode may be found. Despite the simplicity of the model, this result suggests that carefully breaking the $z$ symmetry (by means of chevrons or vortex generators, as in Samimy et al. Reference Samimy, Kim, Clancy and Martens1998) in high-aspect-ratio rectangular jets may mitigate resonance, as neutral upstream-travelling discrete modes are not predicted in these cases. Finally, the round-jet problem is briefly analysed in light of the results obtained in the planar problem. Overall, the trends are very similar, with differences observed mainly for azimuthal modes $m>1$. For these values of $m$, the frequency–wavenumber pairs at the branch point do not fall on the hard-duct dispersion relation, which is also predicted directly in the CVS problem. In fact, these pairs could be associated with a duct with an impedance-wall boundary condition that is dependent on the azimuthal wavenumber analysed.
Finally, an explanation is proffered for why resonance in screeching jets always seems to depend on the existence of the guided-jet mode, while in impinging jets the dependence is less clear. The guided-jet mode is simply a representation of the reflection and transmission of pressure fluctuations generated within the bounds of the jet, fluctuations that can only transmit energy upstream for certain combinations of frequency and wavenumber. In screeching jets, the current understanding suggests that the pressure fluctuations relevant to resonance are always generated in the core of the jet, thus screech requires the guided-jet mode, i.e. the duct-like acoustic mode, to be sustained. Impinging jets can, depending on the operating condition, generate the upstream-propagating pressure fluctuation either inside or outside the jet, and thus only require the guided-jet mode to be supported for resonance in some configurations.
Funding
This work was sponsored by both the Australian Research Council through the Discovery Project scheme (DP220103873) and the Office of Naval Research (ONR), under grant number  $\#$N00014-22-1-2503. The views and conclusions contained herein are those of the authors only and should not be interpreted as representing those of ONR, the U.S. Navy or the U.S. Government.
Declaration of interests
The authors report no conflict of interest.
Appendix A. Equivalence between the standing-wave argument and the DVS dispersion relation
It has been shown in § 4.3 that the scattering problem recovers the same neutral modes from the DVS dispersion relation if the standing wave resulting from total reflection is forced to fit inside the width of a jet. In this section we provide mathematical proof of this result. Starting from (4.2) one may write, using trigonometric identities and angle addition theorems,
 \begin{equation} \cos \left( 2 \gamma_i h/\mathrm{i} + \phi \right) = \cos \phi. \end{equation}
Applying angle addition formulae twice, after some manipulation, leads to
 \begin{equation} \cos^2 \left( \gamma_i h/\mathrm{i} \right) - \cos \left( \gamma_i h/\mathrm{i} \right) \sin \left( \gamma_i h/\mathrm{i} \right) \tan \phi = 1, \end{equation}
which results in
 \begin{equation} \tan \left( \gamma_i h/\mathrm{i} \right) ={-}\tan \phi. \end{equation}
In order to recover (2.23), all terms should be expressed as a function of  $\gamma _i/2$. Using the angle addition theorem again leads to
 \begin{equation} \tan^2 \left( \frac{\gamma_i h}{2\mathrm{i}} \right) - \frac{2}{\tan \phi} \tan \left( \frac{\gamma_i h}{2\mathrm{i}} \right) -1 =0. \end{equation}
Solving for  $\tan ( {\gamma _i h}/{2\mathrm {i}} )$ leads to
 \begin{equation} \tan \left( \frac{\gamma_i h}{2\mathrm{i}} \right) = \frac{1\pm\sqrt{1+\tan^2\phi}}{\tan\phi}. \end{equation}
 For any real angle  $\psi$, the tangent may be written as
 \begin{equation} \tan\psi = \frac{1}{\mathrm{i}} \left( \frac{\mathrm{e}^{\mathrm{i} \psi}-\mathrm{e}^{-\mathrm{i} \psi}}{\mathrm{e}^{\mathrm{i} \psi}+\mathrm{e}^{-\mathrm{i} \psi}} \right). \end{equation}
Using the above expression in conjunction with (2.18) allows us to write  $\tan \phi$ as
 \begin{equation} \tan\phi = \frac{1}{\mathrm{i}} \left( \frac{\mathrm{e}^{\mathrm{i} \phi}-\mathrm{e}^{-\mathrm{i} \phi}}{\mathrm{e}^{\mathrm{i} \phi}+\mathrm{e}^{-\mathrm{i} \phi}} \right) = \frac{1}{\mathrm{i}} \left( \frac{2 E_{SVS}}{1+E^2_{SVS}} \right). \end{equation}
Replacing (A7) into (A5), after some manipulation, leads to
 \begin{equation} \tan \left( \frac{\gamma_i h}{2\mathrm{i}} \right) = \mathrm{i} E^{{\pm} 1}_{SVS}. \end{equation}
Finally, using (A6) again results in
 \begin{equation} E_{SVS} + \left( \frac{\mathrm{e}^{\gamma_i h / 2}-\mathrm{e}^{-\gamma_i h / 2}}{\mathrm{e}^{\gamma_i h / 2}+\mathrm{e}^{-\gamma_i h / 2}} \right)^{{\pm} 1} = E_{SVS} + \left( \frac{\mathrm{e}^{\gamma_i h / 2} \mp \mathrm{e}^{-\gamma_i h / 2}}{\mathrm{e}^{\gamma_i h / 2}\pm\mathrm{e}^{-\gamma_i h / 2}} \right) = 0, \end{equation}
which, after replacing the expression for  $E_{SVS}$ (2.12), leads to
 \begin{equation} \left( 1- \frac{\alpha M}{\omega} \right)^2 \frac{1}{T} \frac{\gamma_o}{\gamma_i} + \left( \frac{\mathrm{e}^{\gamma_i h / 2} \mp \mathrm{e}^{-\gamma_i h / 2}}{\mathrm{e}^{\gamma_i h / 2}\pm\mathrm{e}^{-\gamma_i h / 2}} \right) = 0, \end{equation}
or
 \begin{equation} \frac{1}{T} \left( 1- \frac{\alpha M}{\omega} \right)^2 + \frac{\gamma_i}{\gamma_o} \left( \frac{\mathrm{e}^{\gamma_i h / 2} \mp \mathrm{e}^{-\gamma_i h / 2}}{\mathrm{e}^{\gamma_i h / 2}\pm\mathrm{e}^{-\gamma_i h / 2}} \right) = 0. \end{equation}
Expression (A11) is identical to the DVS dispersion relation (2.23) once the frequency and wavenumbers are scaled by the jet width  $h$ (the natural scaling for the DVS), showing that the equivalence obtained in figure 15 is exact.


 Open access