


Introduction
Echinococcosis is among the most common and seriously neglected zoonotic and lethal parasitic diseases prevalent in agricultural and pastoral areas worldwide. Echinococcosis is among the major infectious endemic diseases to be prevented in China (Wen et al., Reference Wen, Vuitton, Tuxun, Li, Vuitton, Zhang and Mcmanus2019). Clinically, hepatic alveolar echinococcosis (HAE), which is caused by Echinococcus multilocularis (Em) infection, is more common (Sun et al., Reference Sun, Wang, Qiu, Shen, Yang, Yang, Huang and Wang2021). Radical liver resection (Du et al., Reference Du, Liu, Yang, Yan, Li, Wen, Yang, Xu, Chen and Wang2016) or liver transplantation (Yang et al., Reference Yang, Qiu, Huang, Wang, Shen, Feng, Wei, Lei, Zhao, Li, Wen and Yan2018, Reference Yang, Wang, Kong, Huang and Wang2020) combined with anti-hydatid drugs are the most effective treatment options for HAE. However, HAE patients exhibit no clinical symptoms in the early stage, and most patients are in the middle and late stages when they enter the hospital (Qiu et al., Reference Qiu, Yang, Wang, Shen, Yang, Huang and Wang2021). Most of the normal liver tissue is eroded and destroyed by Em. Early screening and early diagnosis are among the most important means of preventing and controlling hydatid disease. The current screening method only involves ultrasonography (Cai et al., Reference Cai, Wang, Wang, Jiang, Luo and Li2017), which has a low early detection rate, poor objectivity, high human and material resource requirements and is time-consuming. The specificity and sensitivity of the existing serological detection methods are insufficient, and the new liquid biopsy (Fan et al., Reference Fan, Gai, Zhang, Ma, Wang, Chen, Dong, Zhang, Bao, Zhou, Ren, Cairang, Hou, Ren, Wang, Wang and Song2021; Zhao et al., Reference Zhao, Shen, Jin, Wang, Li and Chen2021), echinococcus-specific DNA fragments involves high detection conditions and cannot be used as a rapid on-site screening method in the short term.
Therefore, it is necessary to develop a simple, rapid, and highly sensitive diagnostic kit that works alongside ultrasound screening to improve the rate of early diagnosis and treatment and to assist with diagnosing and identifying high-risk and suspicious cases in which typical imaging structural features are not present, but there are lesions or small lesions. In addition, the kit should aid in the diagnosis and monitoring of high-risk groups, postoperative follow-up, etc. Some hot research direction for hydatid disease diagnostic kits is screening out genetically engineered strains of echinococcosis that exhibit high expressions of specific antigens through genetic information technology and recombinant technology and obtaining recombinant antigens (Grimm et al., Reference Grimm, Nell, Hillenbrand, Henne-Bruns, Schmidberger, Kratzer, Gruener, Graeter, Reinehr, Weber, Deplazes, Moller, Beck and Barth2020; Shams et al., Reference Shams, Javanmardi, Nosrati, Ghasemi, Shamsinia, Yousefi, Kordi, Majidiani and Nourmohammadi2021), including rEm18 and rAgB. In this paper, the echinococcosis-specific antigens Eg95, AgB8/1 and Em18 were fused and expressed as novel recombinant antigens rAgB8/1-Em18-Eg95 (T3) and rEm18-Eg95 (T2), which were used for encapsulation. For the diagnosis of echinococcosis disease, an enzyme-linked immunosorbent assay (ELISA) kit was prepared to evaluate the serological diagnostic value of the kit.
Materials and methods
Serum samples
This research protocol was approved by the Ethics Committee of West China Hospital of Sichuan University and the Ethics Committee of Ganzi Prefecture People's Hospital and was guided by the Sichuan Clinical Research Center of Hydatid Disease. The ethics approval number was (2018-02). All patients whose serum was collected provided informed consent. The echinococcosis positive and negative sera originated from West China Hospital and Ganzi Prefecture People's Hospital and were confirmed by surgery, imaging, puncture, and pathology. The serum samples of hepatic schistosomiasis, cysticercosis, and schistosomiasis in the control group were obtained from West China Hospital and the Department of Parasites of Sichuan University. Liver benign and malignant tumours and normal healthy human serum (provided by voluntary liver donors for living donor liver transplantation) were obtained from the Department of Liver Surgery of West China Hospital. All the above sera were aliquoted and stored at −80°C for later use.
Design and construction of T3 and T2 recombinant plasmids
The AgB8/1 gene sequence (GenBank accession number: AF143813.1), Em18 gene sequence (GenBank accession number: AY513264.1) (Jiang et al., Reference Jiang, Wen and Ito2001, Reference Jiang, Xu, Li, Xue and Feng2004), and Eg95 gene sequence (GenBank ID number: LN901900.1) were obtained using Primer Primers designed with Premier 5.0 software. The transcribed expression sequence was constructed as follows: the signal peptide and transmembrane region were removed, GGGGSGGGG was used for tandem expression between different proteins, the sequence for rare codons was optimized (ExpOptimizer tool) and transferred to E. coli for gene synthesis (Invention patent), the selection vector pET-22b (+), the site was NdeI-XhoI, and the C-terminal or N-terminal fusion histidine tag (His-tag) was used for easy protein detection and purification, plasmid vector selection and insertion ampicillin-resistant (Amp) gene sequence. After the plasmid was successfully constructed, lysis sequencing was performed to analyse whether the transformation was successful (Anhui Universal Synthesis, Wuhan Jinkairui Gene Synthesis).
Expression and purification of recombinant T3 and T2 proteins
After the prepared competent BL21 cells were thawed, T3/T2 plasmid DNA [pET-22b (+)] was added by the heat shock transformation method. After resuscitation, the transformed bacterial solution was sent for sequencing (Shanghai Shenggong) and BLAST alignment after sequencing. A single clone in 5 tubes of LB medium containing antibiotics (Amp, 1000:1) was selected and cultured at 37°C until the OD600 of the cells was 0.6–0.8, and isopropyl-β-D-thiogalactoside (IPTG) was added to the final concentration. After culturing for 4 h, centrifuge, the bacteria were collected for sample preparation and analysed by SDS‒PAGE and Western blot; the inoculated and protected bacteria that were cultured to an OD600 of 0.6–0.8 with a final concentration of 0.2 and 1 mm were incubated at 37°C and 15°C at 220 rpm for 4 and 16 h, respectively, then IPTG was added to the 4 tubes of culture to induced fusion protein expression. SDS‒PAGE analysis of samples prepared under each condition was performed; the bacterial cells were collected by centrifugation with each condition in the previous step and were crushed. Buffer (Tris-NaCl) or ultrasonic breaker was applied to lyse the bacteria (time 8 s, interval 4 s, power 500 W, total length 3 min), and the supernatant precipitates were prepared separately and analysed by SDS‒PAGE. Finally, the concentration of BCA protein was determined.
T3 and T2 serological evaluation
After the recombinant protein was purified, rAgB8/1-Em18-Eg95 (T3) antigen and rEm18-Eg95 (T2) antigen were dissolved in 1xPBS solution at concentrations of 1.5 and 0.5 mg mL−1, respectively. The commercial ELISA kit was purchased from Zhuhai Haitai Company under the trade name of hydatid IgG antibody detection kit (an ELISA with a cyst fluid antigen; the main component is AgB8/1), which is hereinafter referred to as H reagent (serum was detected according to the instructions).
Four negative serum samples and 4 positive serum samples from the hydatid disease screening and diagnosis serum were randomly selected and set according to the routine parameters of the diagnostic kit as follows: blank control OD450 < 0.1, negative sample ⩽0.35, positive sample ⩽5.00. The negative and positive sera were clearly separated, and it was difficult to form a precipitate. Follow-up diagnostic experiments and kit preparation were performed according to the higher overall coincidence rate of T2 or T3. The new recombinant antigen was coated with the enzyme plate at concentrations of 0.25, 0.5, 1, and 2 μg mL−1 overnight at 4 degrees Celsius, washed with PBST, and immersed in 5% nonfat milk powder for 2 h to create a 96 T test plate for later use. The Checkerboard titration method (square array method) was used to determine the optimal antigen dilution concentration and enzyme reaction working concentration (secondary antibody: conventional goat anti-human IgG-HRP diluted 1:4000); the serum to be tested was 1:10, 1:100, 1:200, 1:400, 1:800, 1:1600 and other dilutions for later use; after mixing the negative serum of two different patients, the serum was used as a negative control group, and two OD values were measured to obtain the mean value X and the standard deviation s.d., and the cutoff value was used. (Cutoff) value = 2 × s.d. + X was a negative control; if the value is greater than Cutoff, it is considered positive, otherwise it is negative. The samples to be tested were detected, and the stability and repeatability of the kit were evaluated.
Statistical data analysis
The experimental data were organized and analysed using Excel 2016, SPSS 26.0, and GraphPad 6.0. The paired chi-square test (χ 2) was used for statistical comparison of serum count data for detecting different antigens. When the expected value of a certain table is less than 1 or n < 40, Fisher's χ 2 was used; when n ⩾ 40 and any value was 1 ⩽ expected value < 5, the χ 2 was corrected by Yates. The difference in the mean absorbance of different serum and antigen reactions was analysed by a t test. Finally, the receiver operating characteristic (ROC) curve and the area under the curve (AUC) were used to evaluate the diagnostic performance. Pearson's test was used, and the test level was two-sided α = 0.05. The correlation coefficient r value of 0.8~1.0 is a very strong correlation, 0.6~0.8 is a strong correlation, and less than 0.2 is a very weak correlation or no correlation. Taking OD as the independent variable and lesion diameter as the dependent variable, a linear regression prediction model was established, and the efficiency of the model was tested by Durbin Watson.
Results
Characteristics of T3 and T2 recombinant proteins
rAgB8/1-Em18-Eg9 (T3) constructed and expressed the amino acid sequence with a CAI value of 0.69. After removing the signal peptide and transmembrane region and adding a G sequence to connect, the optimized CAI value was 0.82, and the optimized GC content was 49.56%. According to the prediction results of ProtParam, the number of amino acids was 766, the relative molecular mass was 88 067.08, approximately 88.067 kDa, the theoretical isoelectric point was 8.47, the estimated half-life in E. coli was >10 h, and the T3 instability coefficient was 46.03. It was speculated that the protein was unstable, the total average hydrophilicity was −0.795, and the protein was easily soluble in water. The number of T2 amino acids was 691, the relative molecular mass was 79 854.56, approximately 79.855 kDa, the theoretical isoelectric point was 8.37, and the protein instability coefficient was 46.16. It was speculated that the protein was unstable, and the overall average hydrophilicity was −0.848.
Cloning and validation of recombinant gene fragments
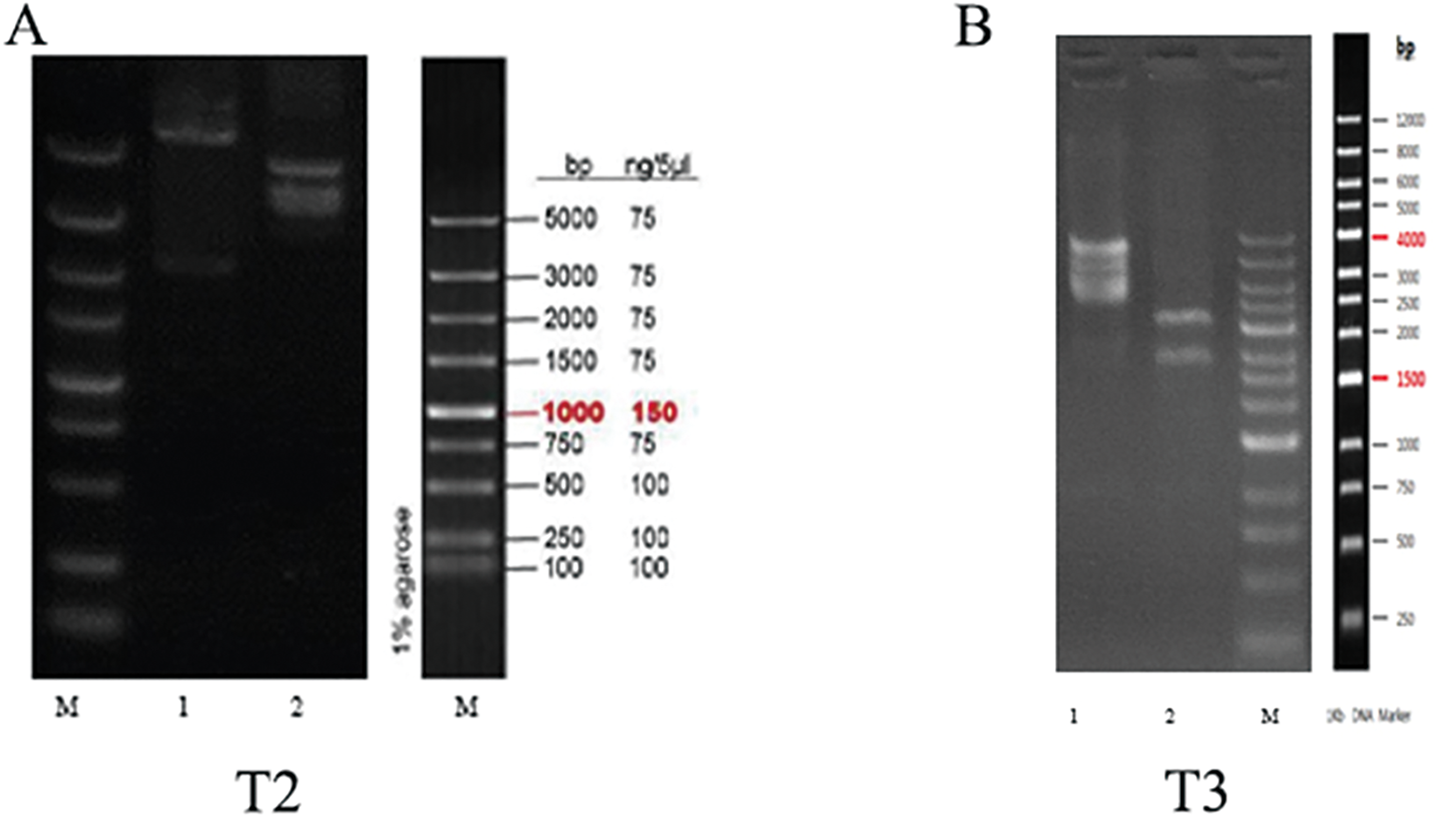
The pET-22b (+) vector was 5493 bp in size and contained the PelB signal peptide sequence. The plasmid gene expression direction was ampicillin gene (Amp), head and tail restriction S sites (Ndel-CATATG-, XhoI-CTCGAG), and insert T3 base. The base pair was approximately 2283 bp, and the T2 base pair was inserted at approximately 2072 bp. After the formation of the BL21 strain monoclonal bacteria, the drug-resistant monoclonal bacteria group was selected, the recombinant plasmid with the head and tail ends of the recombinant plasmid was digested, and fragments of approximately 2283 and 2072 bp appeared (Fig. 1). The origin was 100%, and the sequencing results confirmed that the sequence of the inserted fragment was correct, confirming that the recombinant expression plasmid was successfully constructed.
Synthesis results of T2 and T3 plasmid expression vectors. (A). T2 recombinant protein particles, (B). T3 recombinant protein particles all showed bands at the expected sites after cleavage.
Recombinant protein expression and purification validation
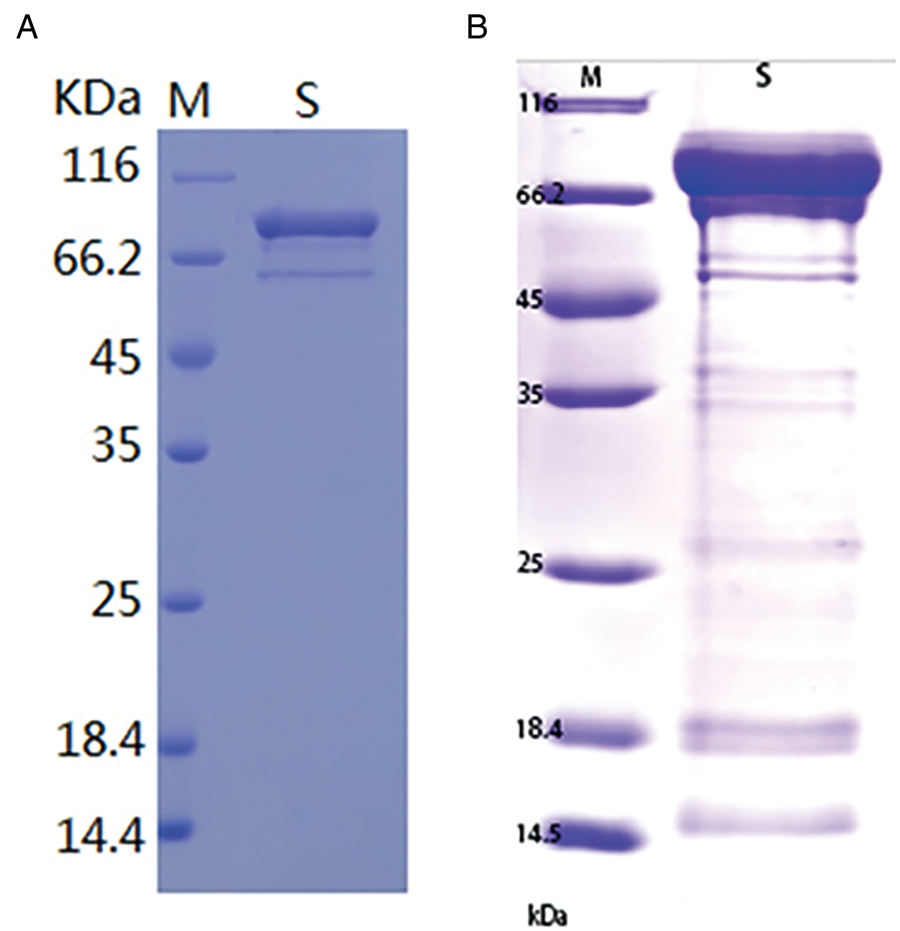
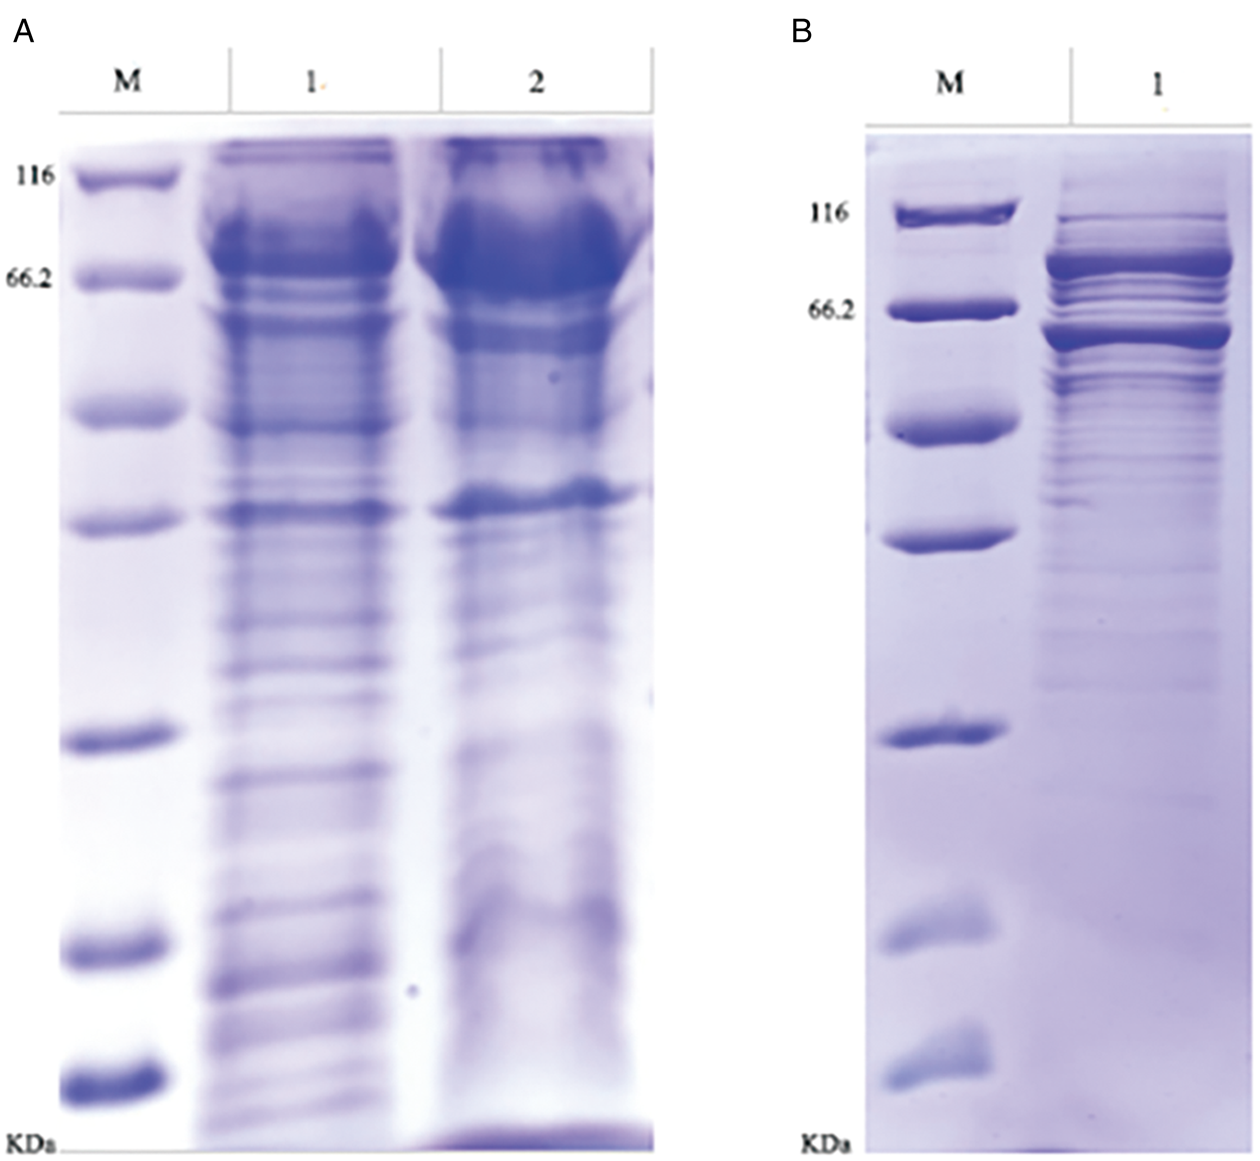
The target protein was expressed after IPTG induction, and it was slightly solubilized at 15°C. The results of dialysis concentrated T3 and WB identification showed that the expression of the target protein was obvious, and the molecular weight was close to 89 kDa (Fig. 2). Finally, the protein concentration of BCA was 1.5 mg mL−1, and the purity was 80%. After the T2 plasmid was transformed into BL21 (DE3) cells, the target molecular weight protein appeared on SDS PAGE after IPTG induction, with a molecular weight of approximately 81 kDa. The protein can be detected in both the supernatant and pellet. The protein concentration in the wash-off liquid at 0.5 mg mL−1 was determined. On SDS‒PAGE and WB, there were two obvious bands, and the purity was still low (<50%) after repeated optimization (Fig. 3).
T3 dialysis and concentrated SDS‒PAGE verification. (A). Diagram of dialysis of T3 recombinant protein; (B). Diagram of purification and concentration of supernatant (NTA-60).
T2 protein SDS‒PAGE verification. (A). After the bacteria were broken, the supernatant (lane 1) and the precipitate (lane 2) were selected for SDS‒PAGE, and the target band at approximately 80 kDa could be seen. After the supernatant was purified and concentrated, there were more obvious bands, including the following: one band was approximately 80 kDa, and the other was approximately 60 kDa. M. Marker (5 μL, 0.1 mg mL−1) 116/66.2/45/35/25/18.4/14.5 kDa.
The diagnostic performance of T3 and T2 serology
T3 serological diagnosis was better than that of T2
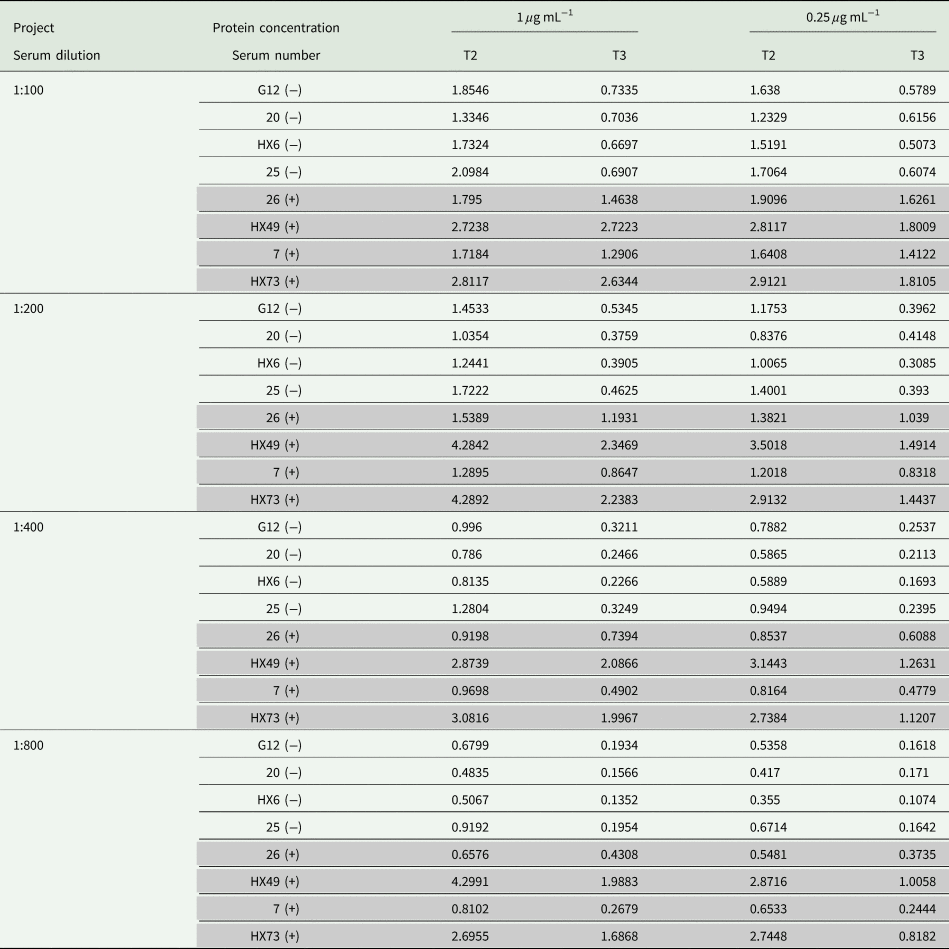
The sera confirmed by clinicopathology and verified by a commercial kit (H) were selected and divided into 4 cases with positive serum (26, HX49, 7, HX73) and 4 cases with negative serum (G12, 20, HX6, 25). The 8 serum samples from Tibetan women aged 30–45 were randomly selected from the sample library. When the protein concentration was 1 μg mL−1 and the serum was diluted 1:10, the mean OD450 of T2 antigen was 3.2418, and the mean of T3 was 2.3810, which were both high, so the concentration and dilution ratio should be further reduced. Finally, the measurement results are shown in Table 1. The overall coincidence rate of T3 was better, and the negative and positive samples could not be distinguished with T2.
Determination of different serum dilution concentrations and protein concentrations of T2 and T3
T3 kit protein concentration and stability
Twenty-four positive samples were randomly selected for detection. When T3 protein was coated with 0.25, 0.5, and 1 μg mL−1, positive serum could be detected at 1:200–1:800. The indirect ELISA kits were prepared by coating the T3 recombinant antigen at 0.5 and 1 μg mL−1. The average decrease rate on the 7th day in the 1 μg mL−1 group was 22 and 19%, and the average decrease in the 0.5 μg mL−1 group on the 7th day was 20 and 17%, respectively. The thermal stability of both coating concentrations was as expected. The repeatability test showed that the positive, negative and normal human serum groups were tested 24 times, 12 times and 12 times, respectively. The coefficient of variation (CV) of the batch difference test was 1.075, 2.549 and 4.125%, respectively. All were lower than 10%, the diagnostic performance of the diagnostic kit was relatively stable within 7 days, and the variation in the repeatable measurement data was small. Finally, to better distinguish negative samples, a T3 ELISA 96 T kit was constructed by using a T3 antigen 1.0 μg mL−1 plate, a cutoff value of 0.5271, and a serum dilution ratio of 1:400.
Serological diagnostic performance of the T3 kit
Serum source and types
A total of 272 serum samples were collected, including 192 cases of echinococcosis (116 cases of AE, 76 cases of CE), 60 cases of liver non-echinococcosis (28 cases of hepatocellular carcinoma, 8 cases of liver cyst, 12 cases of hepatic hemangioma, 2 cases of hepatic adenoma, 2 cases of focal nodular hyperplasia), 8 cases of healthy people, and 20 cases of other human parasites (8 cases of liver fluke, 8 cases of Schistosoma japonicum, 4 cases of cysticercosis).
Diagnosis of T3 and commercial H reagents
After the serum detection was performed for the above 272 samples, the sensitivity of T3 was 93.8% (95% confidence interval (CI) 89.1–96.6%), the specificity was 83.3% (95% CI 71.0–91.3%), the Youden coefficient was 77.1%, and the parasites cross-reaction was 30.0% (6/20, 95% CI 12.8–54.3%). The sensitivity of the commercial H reagent was 88.9% (95% CI 83.5–92.8%), the specificity was 93.3% (95% CI 83.0–97.8%), the Youden coefficient was 82.2%, and the parasite cross-reaction was 20.0% (4/20, 95% CI 6.6–44.3%). The sensitivity and specificity of the two reagents were not significantly different. The specific correlation index was shown in Table 2, and the significant difference was shown in Table 3.
Validation results for the new T3 diagnostic antigen and commercial H reagent paired with large sample serum
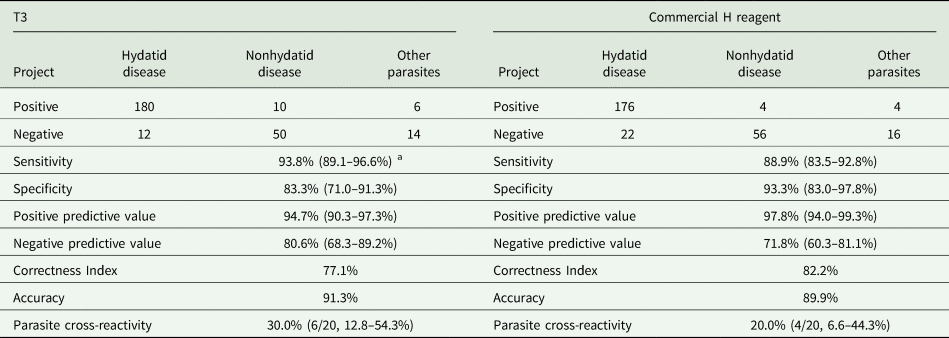
a Brackets represent the 95% confidence interval.
Statistical value of the diagnostic efficacy of the novel T3 diagnostic antigen and commercial H reagent
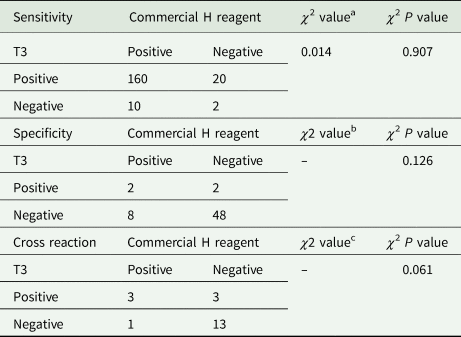
a Yates corrected χ 2 value
b Fisher exact χ 2
c Fisher's exact χ 2 value, ##diagnostic consistency in general
Correlation analysis between the measured OD450 nm value of T3 and the diameter of hydatid lesions
The maximum diameter measured by clinical specimens from 192 patients was used as the lesion diameter. The average age of 192 patients was 42 years (12–82 years), with 68.2% in females and a BMI of 22.5 kg m−2 (16.3–32.5 kg m−2), which were not correlated with the OD values of T3 or H reagents (P > 0.05). After Pearson correlation analysis was performed with the lesion diameter, the Pearson correlation coefficient (r) of recombinant antigen T3 was 0.707 (95% CI 0.628–0.771), which was a strong correlation (P < 0.0001, Fig. 4A). The Pearson correlation coefficient of the H reagent was 0.073, indicating very weak or no correlation (P = 0.315, Fig. 4B). A regression prediction model is established for T3 using OD value as the independent variable and diameter dependent variable. The linear function equation for T3 was as follows: Y predicted diameter = 4.27 × X OD value + 3.32 (F value 189.48, P < 0.01, Fig. 4C). The OD value of T3 can effectively predict the diameter of lesions, which is of great significance for clinical screening or postoperative follow-up monitoring for recurrence.
OD450 nm results of the new recombinant antigen T3 and commercial H reagent ELISA. The abscissa was the diagnostic reagent, and the ordinate was the OD value, P < 0.0001 (***). (A) There was a linear relationship between lesion diameter and OD value in T3 group, r = 0.707; (B) Commercial H reagents had no linear relationship; (C) Regression model for predicting lesion diameter using T3 OD value. Y axis, predicted diameter (cm), X axis, OD value. (D)The OD value of AE was significantly higher than that of CE, while the OD value of AE and CE determined by H reagent showed no significant difference. (ns), the small plot was the 95% confidence interval.
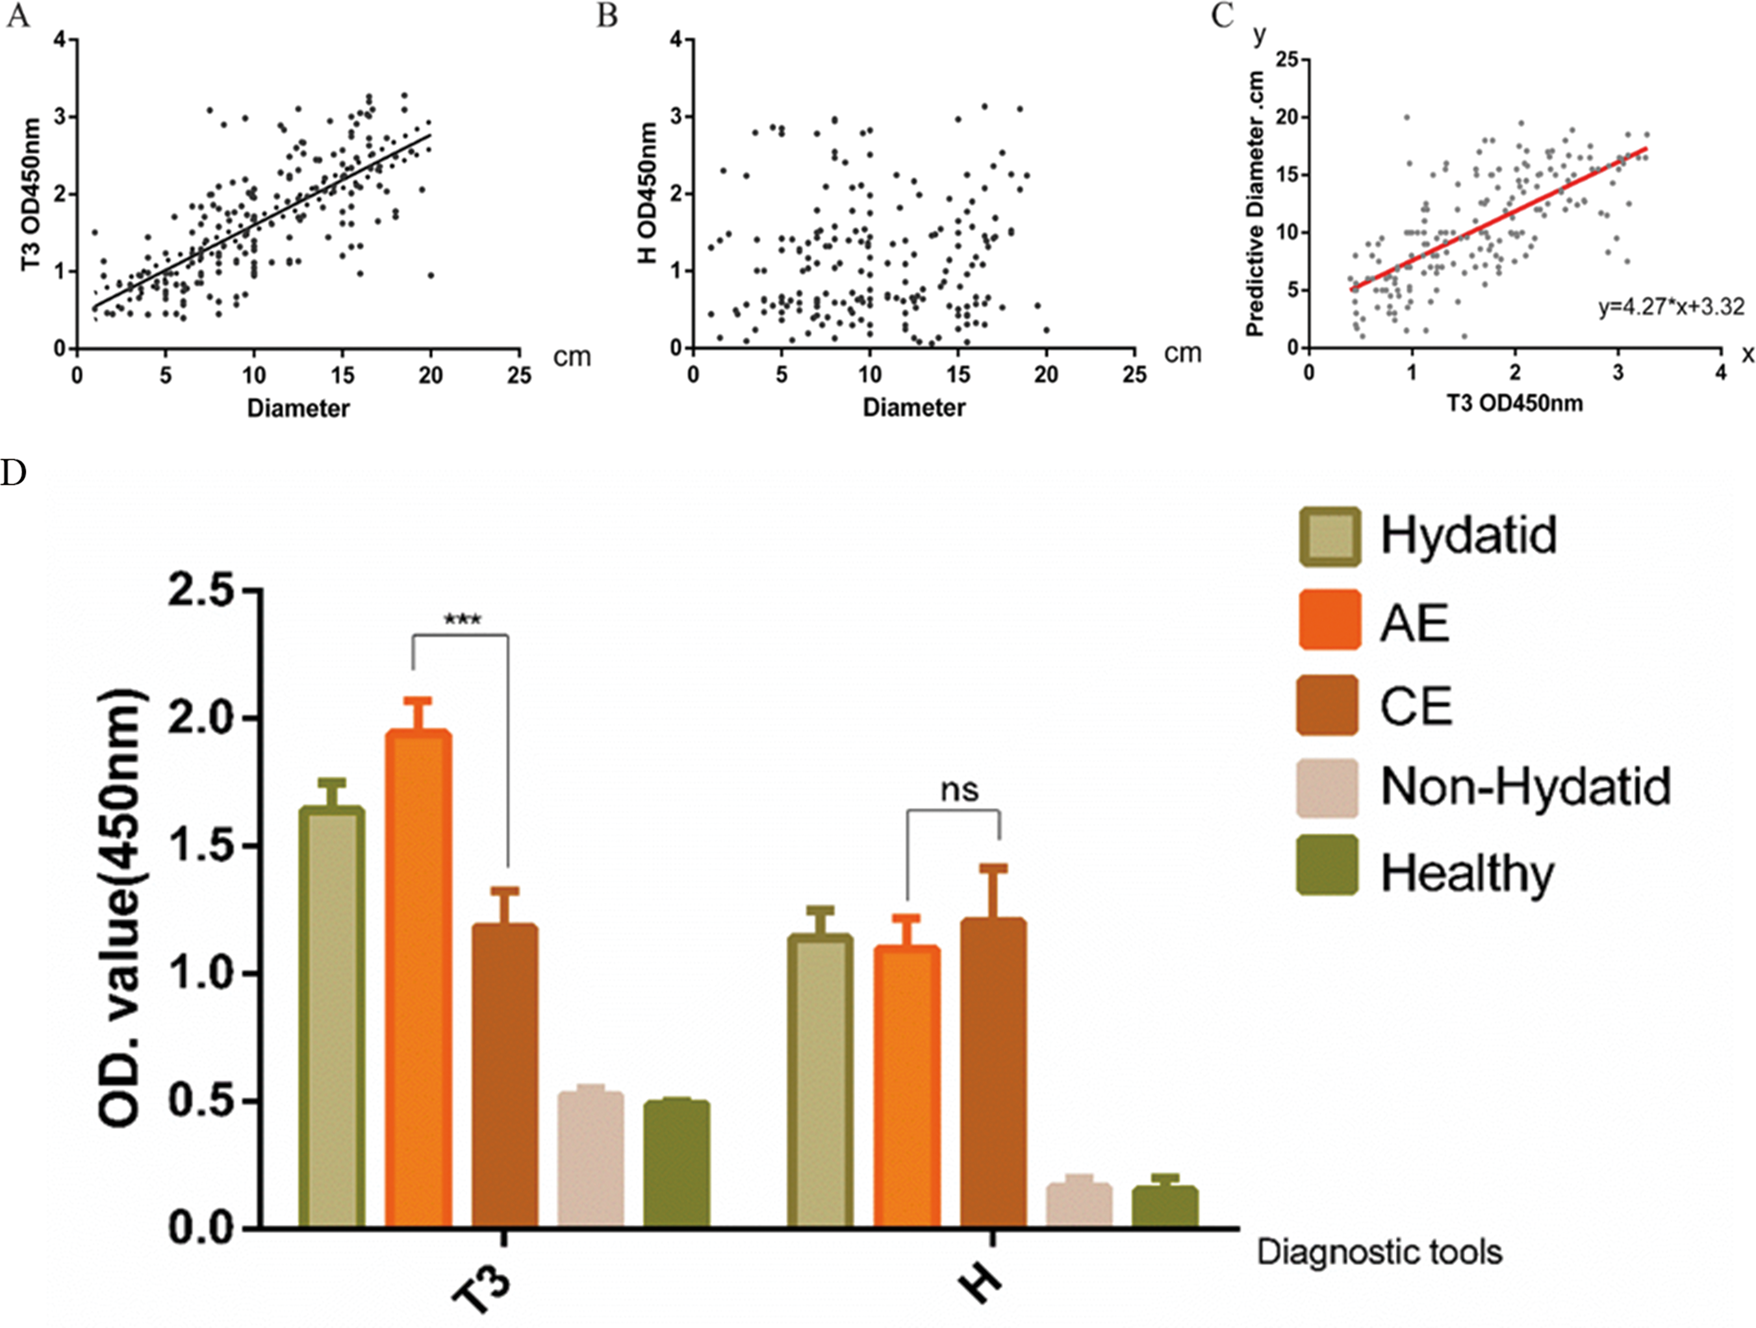
Differential diagnostic value of T3 and the commercial H reagent AE/CE
The OD450 nm value of the T3 diagnostic reagent was analysed; the OD value of AE was 1.9414 ± 0.6976, and the CE value was 1.1816 ± 0.6236, both P < 0.0001. In the H reagent, the OD value of AE was 1.0978 ± 0.6485, and the CE was 1.2036 ± 0.9198. When the two were tested by a nonparametric test, P = 0.642, and there was no significant difference. The OD value was significantly higher for AE than CE (Fig. 4D). After 192 cases of AE/CE OD values were included, the best cutoff value was 0.7821 according to the ROC curve, and a value greater than 0.7821 was considered to be AE. There were 114 cases above the cutoff value in the AE group and 51 cases in the CE group. At this time, the sensitivity was 98.28%, the specificity was 67.11%, the Youden index was 65.3%, the accuracy was 85.94%, the positive predictive value was 82.01%, and the negative predictive value was 96.23%. The AUC was 0.791 (95% CI 0.725–0.857). When the concentration of the T3 antigen-coated plate was 1.0 μg mL−1, the serum dilution ratio was 1:400, a critical value > 0.7821 was helpful for diagnosing AE, and the diagnostic value was evaluated as moderate.
Discussion
In recent years, hydatid serological diagnosis has received increasing attention for health purposes and preventing epidemics. For echinococcosis, serum diagnostic reagents are convenient for physicians to diagnose in medical centres or clinics, and are also used for preliminary screening of patients in high-altitude areas, with the latter being the most urgent. When looking for echinococcosis-specific diagnostic antigens from the initial crude antigen extraction of sheep sac fluid, the popular ‘liquid biopsy’ method, genetically engineered recombinant antigens, etc., the low early diagnosis rate of hydatid disease remains a problem that needs to be solved (Brattig et al., Reference Brattig, Bergquist, Qian, Zhou and Utzinger2020; Wang et al., Reference Wang, Yang, Wang, Zhang, Zhong, Wu, Zheng, Liao, Yu, He, Wang, Chen, Li, Huang, Yao and Zhou2020). In 2020, Sánchez et al. (Sanchez-Ovejero et al., Reference Sanchez-Ovejero, Akdur, Manzano-Roman, Hernandez-Gonzalez, Gonzalez-Sanchez, Becerro-Recio, Gonzalez-Miguel, Akhan, Cretu, Vutova, Tamarozzi, Mariconti, Brunetti, Vola, Fabiani, Casulli and Siles-Lucas2020). reported that an IgG-ELISA diagnostic kit was prepared by combining AgB1-AgB2-Ag5 peptides in recombinant cyst fluid, and this kit exhibits a significant advantage. Feng et al. (Feng et al., Reference Feng, Wen, Zhang, Chen, Ma, Zhang, Qi, Bradshaw, Vuitton and Craig2010). developed 3-min rapid dot immunogold filtration assay (DIGFA) kits that included four native antigen preparations, crude and partially purified hydatid cyst fluid extracts from Echinococcus granulosus (EgCF and AgB), E. granulosus protoscolex extract (EgP) and E. multilocularis metacestode antigen (Em2). The overall sensitivity of DIGFA in a hospital diagnostic setting was 80.7% for CE (n = 857) and 92.9% for human AE (n = 42). The excretory/secretory proteins, structural proteins, lipids, enzyme reactants, small molecules and other components released into the blood by echinococcosis in different life history stages of the human body are complex and have different degrees of antigenicity and immunogenicity. The development of specific diagnostic antigens and vaccines for echinococcosis involves great difficulties. At present, serological diagnosis mainly relies on separately testing a single antigen component or 2 to 4 antigens, and the source is purified natural antigen or recombinant antigen. Natural antigens, such as cystic fluid crude antigens and cephalic segment antigens, originate from live animals, involve complex preparation processes, are difficult to purify, produce insufficient yield and are prone to pollute the environment. Recombinant antigens, such as rAgB8/1, rEm18 and rEm2, can better diagnose hydatid infection, but they cannot be well differentiated for cross-positive and other positive parasitic diseases, samples and serum dilutions must be added multiple times, the operation is cumbersome and the results are complicated to interpret. The early imaging manifestations of the two types of hydatid disease exhibit little difference, and the drugs used to control the progression of the lesions are basically the same (WHO and Chinese consensus recommends albendazole). Therefore, compared to early identification of the two specific types of echinococcosis, early detection of whether a patient has been infected with echinococcosis is more urgent. In this study, a novel triple multivalent fusion protein was reconstituted, and the target protein was successfully constructed and expressed, which laid the foundation for subsequent diagnostic experiments and immunogenicity. For lesions without conclusive imaging findings, the T3 kit test results can guide clinical management from the following three aspects. Firstly, in areas where hydatid disease is prevalent, positive results often indicate a high possibility of hydatid infection or recurrence, and further CT or MRI examinations are needed to confirm the diagnosis. Secondly, for non-epidemic areas, positive results provide a way for patients to diagnose parasitic diseases, rather than blindly treating them as malignant tumours. Furthermore, by dynamically observing serum OD values and imaging lesion characteristics at intervals of 1 month, 3 months, 6 months, etc., evidence is provided for a clear diagnosis.
In this study, through repeated testing and optimization, it was found that T3 protein was superior to T2 protein in diagnosing antigenicity, probably because the B-cell epitopes exposed by T3 protein were more abundant than those of T2. The validation can be obtained from the 2 online analysis tools, Bcepred (https://webs.iiitd.edu.in/raghava/bcepred) and IEDB (http://tools.iedb.org/bcell), and the actual serum validation was confirmed in Table 1. However, in the small sample antigenicity test, the overall OD value distribution of the T2 group was higher than that of the T3 group, indicating that the specificity of T2 was poor and it was easy to form precipitates. This may be due to the difficulty of purifying T2 and the inclusion of other mixed antigen components, which cannot guarantee sufficient purity of the specific antigen and was not suitable for the next diagnostic experiment. The main component of the commercial kit H is the crude cyst fluid antigen (HCF), and the extraction process was complicated. In this paper, the OD value for CE was slightly higher after verification, but it cannot be significantly different between AE and CE. Although there was no significant difference in sensitivity, specificity or cross-reaction rate between the T3 kit and the commercial H kit, judging from the OD value, T3 exhibited more advantages in the diagnosis of AE. In addition, according to the linear analysis of the relationship between the OD value and the largest lesion diameter, T3 can better distinguish the size of the lesions, suggesting that T3 can relatively distinguish the early stage of the disease. This was contrary to the results of a study of 95 AE patients from Kyrgyz (Bebezov et al., Reference Bebezov, Mamashev, Umetaliev, Ziadinov, Craig, Joekel, Deplazes, Grimm and Torgerson2018), which could be related to the large sample size (192 cases) of this study, mixed analysis of lesion diameters for AE and CE, and predominantly female. However, this study was similar to the recent one from Qinghai (Fan et al., Reference Fan, Gai, Zhang, Ma, Wang, Chen, Dong, Zhang, Bao, Zhou, Ren, Cairang, Hou, Ren, Wang, Wang and Song2021), an endemic area in China, which suggested that circulating free DNA could reflect meaningful information about lesion size in preoperative AE patients. Since patients with hydatid disease are in the middle and late stages of disease when treated, follow-up studies and larger sample sizes are needed to determine the relationship between the OD value and clinical PNM and CE stages, as well as for the changes in antibodies during postoperative follow-up and after albendazole treatment.
The T3 protein contains 2 antigens that are specifically expressed in different periods of Echinococcus, and the detection efficiency of serodiagnostic antigenicity was basically in line with expectations. Among them, AgB8/1 was the most abundant thermostable lipoprotein in the CE cyst fluid. Although its molecular weight is small, AgB8/1 has abundant exposed epitopes and good antigenicity (Mamuti et al., Reference Mamuti, Sako, Xiao, Nakaya, Nakao, Yamasaki, Lightowlers, Craig and Ito2006). In addition, the diagnostic performance of other synthetic polypeptide subunits of AgB was close to 85%, which was similar to the results of the recombinant AgB8/1 peptide in this paper, further indicating that the recombinant protein was successfully constructed. Although Eg95 is often used as a protective antigen, a team from Xinjiang. China (Tianli et al., Reference Tianli, Xifeng, Zhenzhong, Lixia, Xingxing, Jun, Qingling, Shasha, Ying and Xuepeng2019) found that the recombinant fusion protein (Eg mefAg-1) showed high sensitivity (93.41%) and specificity (99.31%) in ELISA after fusing 8 major antigen epitopes, including the linear antigen epitope of Eg95 protein (AF465599), in sheep serum. However, there are few reports on this in human serum. Jiang Li et al (Jiang et al., Reference Jiang, Xu, Li, Xue and Feng2004) performed a rEm18 ELISA on 237 confirmed sera that would be tested and showed that the serodiagnosis efficiency of recombinant rEm18 subunit antigen for AE was 90.3% and 92.4%, respectively, and was closely related to the diameter of the lesion. The new T3 kit in this study exhibited a higher OD value in the AE serum reaction, and the sensitivity was as high as 98.28% in the hydatid subspecies category, which may be due to the abundant exposure of Em18 peptides or the use of the Em18 whole genome sequence, resulting in the loss of less antigenic components. This study showed that there was an approximately 30% cross-reaction rate with S. japonicum and cysticercosis, which was consistent with related reports (Yu et al., Reference Yu, Wang, Yin, Zhang, Cao, Cao and Shen2018). In parasitic endemic areas, a 30% cross reactivity rate has very little impact on disease diagnosis. For example, echinococcosis is mainly prevalent among farmers and herdsmen in the Qinghai Tibet Plateau region of western China, while schistosomiasis and filariasis are prevalent in the eastern region of China, where rice is the main crop. In the future, we can further study and clarify the specific targeting site of the T3 antigen and reduce the function of nonspecific reactions and improve the diagnostic efficiency.
In addition, T3 uses the gene sequence of E. multilocularis isolated from the Sichuan strain, which may exhibit a higher affinity for the sera of localized hydatid infection patients. The ELISA method was the cornerstone of serological diagnosis. The good performance of T3 laboratory diagnosis will lay a solid foundation for the development of colloidal gold, magnetic bead diagnosis, combined antigen diagnosis, etc. T3 expected to be a new diagnostic reagent for echinococcosis in China.
Data availability statement
The datasets generated and analysed during the current study are available from the corresponding author on reasonable request.
Authors’ contributions
Xianwei Yang designed the study, wrote the article and performed statistical analyses. West China Liver Surgery Groups (Tao Wang and Wentao Wang) and Yin Chen gave critical revision of the manuscript for important intellectual content. All authors have approved the submitted manuscript.
Financial support
This research was sponsored by the National Natural Science Foundation of China (No. 82202548), the Natural Science Foundation of Sichuan, China (No. 2022NSFSC0665), the author Xianwei Yang is the guarantor.
Competing interests
None.
Ethical standards
This research protocol was approved by the Ethics Committee of West China Hospital of Sichuan University and the Ethics Committee of Ganzi Prefecture People's Hospital and was guided by the Sichuan Clinical Research Center of Hydatid Disease. The ethics approval number was (2018-02). All patients whose serum was collected provided informed consent.


 Open access