

Education is a widely recognized social determinant of health, conferring multiple economic and psychosocial advantages across the life course( Reference Cohen and Syme 1 – Reference Hayward, Hummer and Sasson 4 ). In the USA, state and federal student aid programmes have significantly increased the accessibility of higher education over the past 50 years( Reference Baum, Kurose and McPherson 5 ). As a result, the demographic composition of US college and university student bodies has changed considerably, with more low-income, first-generation and racial/ethnic minority students enrolled than ever before( Reference Baum, Kurose and McPherson 5 ). Limited research has focused on the social and economic challenges these students face, and the impact these challenges might have on student health and well-being( Reference Broton and Goldrick-Rab 6 ). An increasing number of studies have documented a high prevalence of food insecurity, or a lack of ‘access, at all times, to enough food for an active, healthy life’( Reference Coleman-Jensen, Rabbitt and Gregory 7 ), on college and university campuses across the USA( Reference Bruening, Argo and Payne-Sturges 8 ). Associated with numerous poor health( Reference Gundersen and Ziliak 9 – Reference Bruening, Dinour and Chavez 11 ) and academic outcomes( Reference Jyoti, Frongillo and Jones 12 – Reference Alaimo, Olson and Frongillo 14 ), food insecurity may hinder student achievement and undermine the potential for increased educational access to reduce health disparities.
A recent systematic review estimated that the average prevalence of food insecurity on US college and university campuses is 33 %( Reference Bruening, Argo and Payne-Sturges 8 ), nearly three times the national prevalence of 12·3 % in 2015( Reference Coleman-Jensen, Rabbitt and Gregory 7 ). Across studies, food insecurity was more common among students who were financially independent, caring for dependent children, younger and from racial/ethnic minority groups( Reference Bruening, Argo and Payne-Sturges 8 ). Although existing research is largely descriptive, a growing body of evidence suggests that food insecurity is associated with poorer health and academic outcomes among college and university students. Food-insecure students were more likely to report their health as fair or poor at universities in Oregon, USA( Reference Patton-Lopez, Lopez-Cevallos and Cancel-Tirado 15 ), Brisbane, Australia( Reference Gallegos, Ramsey and Ong 16 ), and Alberta, Canada( Reference Farahbakhsh, Hanbazaza and Ball 17 ), and food insecurity was associated with higher odds of stress( Reference Bruening, van Woerden and Todd 18 ) and depression( Reference Bruening, van Woerden and Todd 18 , Reference Bruening, Brennhofer and van Woerden 19 ) among university freshman in Arizona, USA. Regarding academic performance, food insecurity was inversely associated with grade point average (GPA) among students attending a rural university in Oregon, USA( Reference Patton-Lopez, Lopez-Cevallos and Cancel-Tirado 15 ), two community colleges in Maryland, USA( Reference Maroto, Snelling and Linck 20 ), and four public universities in Illinois, USA( Reference Morris, Smith and Davis 21 ).
To date, no studies have examined the specific pathways through which food insecurity may affect academic performance among college and university students. Existing research on the relationship between food insecurity and academic achievement has primarily focused on early childhood( Reference Perez-Escamilla and Pinheiro de Toledo Vianna 22 ). Food insecurity has been prospectively associated with lower mental proficiency in toddlers( Reference Zaslow, Bronte-Tinkew and Capps 23 ), as well as impaired reading and mathematical performance( Reference Jyoti, Frongillo and Jones 12 ) and inadequate standardized test scores( Reference Faught, Williams and Willows 24 ) among school-aged children. The psychological and emotional stress that often results from the experience of food insecurity is hypothesized to be a key mediator of this association( Reference Jyoti, Frongillo and Jones 12 , Reference Alaimo, Olson and Frongillo 14 , Reference Perez-Escamilla and Pinheiro de Toledo Vianna 22 , Reference Whitaker, Phillips and Orzol 25 , Reference Knowles, Rabinowich and Ettinger de Cuba 26 ). Although few studies have explicitly tested this hypothesis, psychosocial factors have been found to mediate the association between food insecurity and various health outcomes including weight status( Reference Willis and Fitzpatrick 27 ), sleep quality( Reference Bermudez-Millan, Perez-Escamilla and Segura-Perez 28 ) and child cognitive development( Reference Zaslow, Bronte-Tinkew and Capps 23 ). The exploration of similar pathways among college and university students may help to elucidate the complex mechanisms that likely underlie early evidence for the association of food insecurity with poorer health and academic outcomes.
Using a longitudinal design, the present study leverages a life-course perspective on health( Reference Halfon and Hochstein 29 – Reference Lynch and Smith 31 ) and aims to fill an important gap in the literature regarding the associations between food insecurity and the risk of poor health and academic performance. Within a diverse group of college and university students in Georgia, USA, we aimed to: (i) assess the prevalence of food insecurity and identify sociodemographic characteristics associated with higher risk; (ii) assess the associations of food insecurity with indicators of psychosocial health including depression, anxiety and hope, and with GPA; and (iii) examine whether psychosocial health mediates the association between food insecurity and GPA. The present study is the first to examine the pathways through which food insecurity may impact academic performance among post-secondary students.
Methods
Study population and data collection
Data are from Project DECOY, a six-wave longitudinal cohort study examining tobacco use among college and university students in Georgia, USA. Study sampling, recruitment and retention procedures are described in detail elsewhere( Reference Berg, Haardorfer and Lewis 32 ). Briefly, eligible students (i.e. those between the ages of 18 and 25 years, enrolled as a student at least part-time and able to speak English) were sampled from seven Georgia colleges and universities. Three thousand students were randomly selected from each of three colleges/universities with student populations over 3000, and a census approach was used to recruit students from the remaining four colleges/universities with student populations less than 3000. A total of 15 607 students were contacted via email and recruited over a period of 48 h to 1 week, depending upon the college/university and the amount of time needed to reach the targeted recruitment goal at each institution. The total response rate within the recruitment time frame was 22·9 % (3574/15 607) and met sample size targets. One week after completion of the baseline survey, participants were asked via email to confirm their participation in the study, of whom 95·6 % (3418/3574) confirmed their participation and were enrolled in the study. The present study uses data from the baseline survey and Waves 2–4, which had retention rates of 86·9 % (n 2969), 83·9 % (n 2867) and 85·5 % (n 2922), respectively. For analyses, we retained participants who participated in all three waves (n 2645). An additional 268 participants (10·1 %) were excluded as they were missing data on covariates; missing data were not associated with the outcome. The final analytic sample size was 2377. Web-based surveys were used to collect data every four months between autumn 2014 and summer 2016. The baseline survey was administered in October/November 2014, and Waves 2–4 were administered in February/March 2015, June/July 2015 and October/November 2015, respectively. This study was conducted according to the guidelines laid down in the Declaration of Helsinki and all procedures involving human subjects were approved by the Institutional Review Boards of Emory University, ICF Macro International, Albany State University, Berry College, University of North Georgia and Valdosta State University. Electronic informed consent was obtained from all subjects.
Exposure: food security status
We assessed food security status at Wave 3 using the US Department of Agriculture’s US Household Food Security Survey Module Six-Item Short Form( 33 ). The six survey items increase in severity, ranging from ‘The food I bought just didn’t last, and I didn’t have money to get more. Was that often, sometimes, or never true for you in the last 12 months?’ to ‘In the last 12 months were you ever hungry, but didn’t eat because there wasn’t enough money for food?’ Following US Department of Agriculture coding guidelines, participants who responded affirmatively to two or more questions were classified as food insecure; all others were classified as food secure. When tested against the US Department of Agriculture’s full eighteen-item scale, the six-item scale correctly classified 97·7 % of households( Reference Blumberg, Bialostosky and Hamilton 34 ).
Mediator: psychosocial health
Our hypothesized mediator, psychosocial health, was operationalized as a latent factor with three indicators: depression, anxiety and hope. For the structural equation modelling (SEM), each indicator was coded such that a higher score indicates poorer psychosocial health.
Depression. Depression was measured at Wave 4 using the nine-item Patient Depression Questionnaire (PHQ-9)( Reference Kroenke, Spitzer and Williams 35 ). The PHQ-9 is a measure of depression severity, which asks participants how often, in the previous two weeks, they have experienced nine symptoms of depression. Example symptoms include ‘little interest or pleasure in doing things’, ‘trouble falling or staying asleep, or sleeping too much’ and ‘feeling bad about yourself or that you are a failure or have let yourself or your family down’. Answer choices and scores include: ‘not at all’=0, ‘several days’=1, ‘more than half the days’=3 and ‘nearly every day’=3. Scores for each of the nine items are then summed to create a continuous variable ranging from 0 to 27. Cronbach’s α in the analytic sample was 0·90.
Anxiety. Anxiety was measured at Wave 4 using the eighteen-item Anxiety Sensitivity Index – 3 (ASI-3)( Reference Taylor, Zvolensky and Cox 36 ). The ASI-3 measures anxiety sensitivity, or a fear of arousal-related sensations. Participants are asked to indicate the extent to which they agree with eighteen statements including ‘When my chest feels tight, I get scared that I won’t be able to breathe properly’, ‘It scares me when I blush in front of people’ and ‘When I have trouble thinking clearly, I worry that there is something wrong with me’. Answer choices and scores include: ‘very little’=0, ‘little’=1, ‘some’=2, ‘much’=3 and ‘very much’=4. If participants have not had a particular experience, they are asked to answer based on how they anticipate feeling if they were to have such an experience. Index items are summed to create a continuous variable ranging from 0 to 72. Cronbach’s α in the analytic sample was 0·93.
Hope. Hope was measured at Wave 3 using the six-item Adult State Hope Scale( Reference Snyder, Sympson and Ybasco 37 ). The scale measures participant hope, or belief in their capacity to take action towards reaching their goals and belief in their capacity to generate routes to reach those goals. Participates indicate the degree to which, at present, each item is true or false. Example items include ‘At the present time, I am energetically pursuing my goals’, ‘There are lots of ways around any problem that I am facing right now’ and ‘I can think of many ways to reach my current goals’. Answer choices and scores include: ‘definitely false’=1, ‘mostly false’=2, ‘somewhat false’=3, ‘slightly false’=4, ‘slightly true’=5, ‘somewhat true’=6, ‘mostly true’=7 or ‘definitely true’=8. Scale items are summed to create a continuous variable ranging from 6 to 48. Cronbach’s α in the analytic sample was 0·91. (Note that, in order to minimize respondent burden, not all measures could be included at all waves. However, test–retest reliability exceeds 0·73 over 8- to 10-week periods among college students( Reference Edwards, Rand and Lopez 38 – Reference Yoshinobu 41 ).)
Outcome: grade point average
At Wave 4, participants self-reported their GPA in response to the question ‘Which of the below is the closest reflection of your GPA?’ There were six possible responses: ‘4·0 or mostly As’; ‘3·5 or half As and half Bs’; ‘3·0 or mostly Bs’; ‘2·5 or half Bs and half Cs’; ‘2·0 or mostly Cs’; and ‘less than 2·0 or less than a C average’. GPA was treated as a continuous variable in all analyses.
Control variables: sociodemographic and socio-economic characteristics
Self-reported sociodemographic and socio-economic characteristics used as covariates in analyses include: gender (male; female); age (continuous); race/ethnicity (Black; White; Asian; Hispanic; other); type of college/university attended (technical college; public university; private college/university; Historically Black Colleges and Universities (HBCU)); parent’s educational attainment (high-school diploma or less; some college or associate’s degree; bachelor’s degree or higher); living situation (college/university housing; living at home with parents; living off-campus, but not with parents); employment status (not employed; employed part-time; employed full-time); receiving Supplemental Nutrition Assistance Program (SNAP) benefits (yes; no); monthly discretionary budget (≤$US 200; $US 201–400; $US 401–600; ≥$US 601); and parental status (yes; no).
Adverse childhood experiences (ACE; 0; 1; 2; 3; ≥4)( Reference Felitti, Anda and Nordenberg 42 ) was also included as a covariate in all analyses. Defined as abuse, neglect or household dysfunction occurring in the first 18 years of life( 43 ), ACE are a well-established predictor of food insecurity( Reference Sun, Knowles and Patel 44 ), psychosocial health( Reference Edwards, Holden and Felitti 45 ) and academic performance( Reference Romano, Babchishin and Marquis 46 ). Accordingly, we controlled for ACE in all analyses to reduce any bias in our estimated direct and indirect effects introduced by exposure–outcome, mediator–outcome or exposure–mediator confounding( Reference VanderWeele 47 ).
Analysis
Descriptive statistics were calculated for each variable to check for outliers and assess the normality of distributions for continuous variables. Chi-square test statistics were calculated to assess differences in sociodemographic characteristics by food security status. Prior to specifying the structural equation model (SEM), bivariate analyses and linear regression models were run between the exogenous variable, food security status, and each endogenous variable (i.e. depression, anxiety, hope and GPA) to confirm the presence of significant associations warranting further investigation in an SEM framework. In addition, a logistic regression model, with food security status as the outcome, was estimated to identify sociodemographic characteristics associated with food security status. Regression models were adjusted for all sociodemographic characteristics detailed above. Descriptive statistics and adjusted regression models were calculated in the statistical software package SAS version 9.4 and SEM was performed using MPlus 8 (Muthén & Muthén: Los Angeles, CA, USA).
For the SEM analysis, we used a two-step modelling approach(Reference Kline48). Before specifying the structural regression model, we used confirmatory factor analysis to estimate the measurement portion of the model. Each indicator variable of the latent psychosocial health factor (i.e. depression, anxiety and hope) had an adequate standardized factor loading (i.e. >0·30). Because this was a saturated measurement model, no model fit indices could be obtained. We then estimated the structural regression model to test the hypothesized direct and indirect effects. All models were estimated using maximum likelihood estimation. Model fit was assessed using the following indices: standardized root-mean-square residual (a value below 0·08 indicates good model fit); root-mean-square error of approximation (a value below 0·05 indicates good model fit); comparative fit index (a value greater than or equal to 0·95 indicates good model fit); and χ 2 test (although P<0·05 is considered to indicate good model fit, the test is sensitive to sample size and was expected to be significant). Modification indices were examined, and model re-specifications considered on theoretical grounds. We report standardized parameter estimates and corresponding P values (significance assessed at P<0·05).
Results
Student sociodemographic and socio-economic characteristics
The majority of students were women (64 %) and the average age was 21 years old (Table 1). Approximately 62 % of students self-identified as White, 20 % as Black, 8 % as Hispanic, 7 % as Asian and 3 % as another race/ethnicity. Over half of students had parents who had received a bachelor’s degree or higher, while 29 % had parents who had completed some college, and 16 % had parents who had obtained a high-school diploma or less. Slightly over a quarter of students were not employed, while approximately half were working part-time and the remaining quarter were working full-time. Students lived in a variety of residence types, with 38 % living in university housing, 23 % living in their parent’s home and 39 % living in another type of off-campus housing. Overall, 29 % of students were food insecure. Prevalence of low and very low food insecurity varied by college/university type: 23 % of private college/university students, 33 % of HBCU students, 34 % of public university students and 37 % of technical college students.
Sociodemographic characteristics of college and university students (n 2377) from seven institutions in Georgia, USA, autumn 2014–autumn 2015
HBCU, Historically Black Colleges and Universities; SNAP, Supplemental Nutrition Assistance Program.
Data presented are n and % unless indicated otherwise.
Sociodemographic and socio-economic characteristics associated with food security status
In adjusted logistic regression models, numerous student sociodemographic and socio-economic characteristics were associated with food security status (Table 2). Compared with students working full-time, students who were not employed had lower odds of food insecurity (OR=0·73; 95 % CI 0·55, 0·96, P=0·02), and students who were living off-campus had higher odds of food insecurity than those who were living in university housing (OR=1·42; 95 % CI 1·08, 1·87, P=0·01). In addition, students receiving SNAP benefits (OR=2·36; 95 % CI 1·72, 3·23, P<0·0001) and students with lower monthly discretionary budgets had higher odds of food insecurity (≤$US 200 v. ≥$US 601: OR=1·89; 95 % CI 1·28, 2·80, P=0·001; $US 201–400 v. ≥$US 601: OR=1·50; 95 % CI 1·00, 2·26, P=0·05). Students whose parents had obtained a high-school diploma or less, or whose parents had completed some college or an associate’s degree, had higher odds of food insecurity than students whose parents had a bachelor’s degree or higher (OR=1·64; 95 % CI 1·24, 2·16, P=0·001; OR=1·45; 95 % CI 1·16, 1·83, P=0·001, respectively). Finally, compared with students who did not report any adverse childhood experiences, students who reported at least one ACE had increasingly higher odds of food insecurity with each additional ACE experienced (1 v. 0 ACE: OR=1·50; 95 % CI 1·17, 1·92, P=0·001; 2 v. 0 ACE: OR=1·73; 95 % CI 1·29, 2·33, P=0·0003; 3 v. 0 ACE: OR=2·10; 95 % CI 1·47, 3·00, P<0·0001; ≥4 v. 0 ACE: OR=3·12; 95 % CI 2·32, 4·20, P<0·0001). College/university type was not associated with food security status after adjusting for other covariates.
Sociodemographic characteristics associated with food security status among college and university students (n 2377) from seven institutions in Georgia, USA, autumn 2014–autumn 2015
Ref., reference category; HBCU, Historically Black Colleges and Universities; SNAP, Supplemental Nutrition Assistance Program.
P<0·05 indicates statistical significance.
Adjusted associations between food insecurity, psychosocial health and grade point average
In adjusted linear regression models, food insecurity was associated with each indicator of psychosocial health as well as with GPA (Table 3). Food insecurity was associated with a 1·83-point increase in depression score (se=0·25, P<0·0001), a 3·68-point increase in anxiety score (se=0·69, P<0·0001) and a 2·16-point decrease in hope score (se=0·36, P<0·0001). Food insecurity was associated with a 0·14-point decrease in GPA (se=0·04, P=0·002).
Adjusted linear regression models of the associations between food insecurity, psychosocial health and grade point average (GPA) in college and university students (n 2377) from seven institutions in Georgia, USA, autumn 2014–autumn 2015

P<0·05 indicates statistical significance.
Structural equation model
Our final SEM achieved good model fit (Fig. 1). Empirically derived modification indices suggested the addition of covariance between depression and anxiety, as well as between depression and hope, to improve model fit. We included these changes as they were theoretically sound and did not affect our a priori hypothesis. Except for the χ 2 test, all fit indices met standard thresholds for good model fit.
Final structural equation model testing whether psychosocial health mediates the association between food security status and grade point average (GPA) among college and university students (n 2377) from seven institutions in Georgia, USA, autumn 2014–autumn 2015: ———, direct effects; – – – – –, indirect effects; path coefficients are standardized; ***P<0·0001 (model fit: χ 2=131·92 (df=50), P<0·0001; standardized root-mean-square residual=0·01; root-mean-square error of approximation=0·03 (90 % CI 0·02, 0·03); comparative fit index=0·95; R 2 (GPA)=0·17)
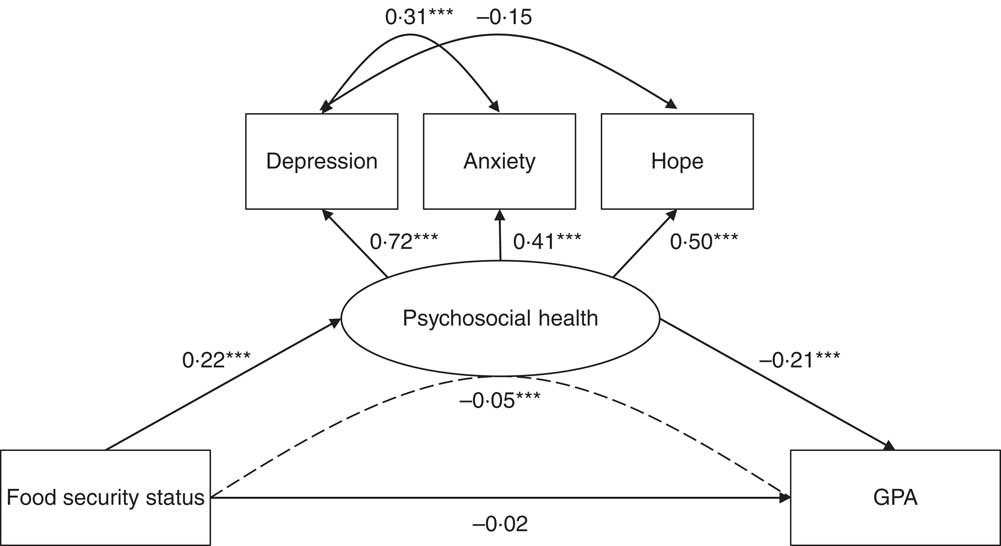
The final SEM supported our hypothesis that psychosocial health fully mediates the association between food security status and GPA. Food insecurity was associated with poorer psychosocial health (standardized β=0·22, se=0·03, P<0·0001) and poorer psychosocial health was associated with a lower GPA (standardized β=−0·21, se=0·03, P<0·0001). The total effect of food security status on GPA was significant (standardized β=−0·06, se=0·02, P=0·002). When decomposed into indirect and direct effects, the indirect effect of food security status on GPA, as mediated by psychosocial health, was significant (standardized β=−0·05, se=0·01, P<0·0001) and accounted for 73 % of the total effect. After accounting for psychosocial health, the direct effect of food security status on GPA was not significant (standardized β=−0·02, se=0·02, P=0·43). The full SEM, including covariates, accounted for approximately 17 % of the variance in GPA (R 2=0·17).
Discussion
The present study examined associations among food insecurity, psychosocial health and academic performance among college and university students in Georgia, USA. Approximately 29 % of students experienced food insecurity during the previous 12 months, and food insecurity was associated with poorer psychosocial health and academic performance. Notably, we found that psychosocial health fully mediated the association between food insecurity and academic performance. Our findings support and extend growing evidence for the high prevalence of food insecurity on college and university campuses and its deleterious effects on student health and success( Reference Broton and Goldrick-Rab 6 , Reference Bruening, Argo and Payne-Sturges 8 ). As the first study to use a longitudinal design to identify a potential mechanism through which food insecurity affects academic performance, our study offers useful insights for the development, targeting and implementation of programmatic and policy interventions that seek to reduce food insecurity and its consequences.
The prevalence of food insecurity in our sample was comparable to the recently estimated US college and university prevalence of 33 %( Reference Bruening, Argo and Payne-Sturges 8 ). Although the proportion of students in our sample experiencing food insecurity was highest among those attending technical college (37 %), it was still nearly one-quarter among private college/university students. Across college/university types, the rising cost of college attendance has outpaced spending on financial aid( Reference Broton and Goldrick-Rab 49 ); coupled with the shifting demographics of college enrolment, these financial constraints have created more economically vulnerable student bodies and are key factors underlying substantial socio-economic disparities in degree completion( Reference Kena, Musu-Gillette and Robinson 50 ). In a nationally representative survey of young adults who had completed some higher education, the inability to afford tuition and fees, and the need to work in order to make money were the top reasons reported for leaving prior to obtaining a degree( Reference Johnson and Rochkind 51 ). Broton and Goldrick-Rab( Reference Broton and Goldrick-Rab 49 ) invoke Maslow’s( Reference Maslow 52 ) hierarchy of needs in their discussion of food and housing insecurity among college and university students: if students’ basic needs are not met, they will be unable to engage in the higher-level learning required of them in college.
Similar to previous studies, we found that students who were employed, living off-campus without parents and receiving SNAP benefits experienced higher odds of food insecurity( Reference Patton-Lopez, Lopez-Cevallos and Cancel-Tirado 15 ). Representing various dimensions of socio-economic status, these factors illustrate the difficulties that students of lower socio-economic status face in fulfilling their basic material needs, despite working, budgeting and taking advantage of available benefits( Reference Broton and Goldrick-Rab 49 ). From a life-course perspective( Reference Halfon and Hochstein 29 – Reference Lynch and Smith 31 ), lower parental educational attainment and ACE may confer additional vulnerability to food insecurity. ACE have been associated with a higher likelihood of experiencing food insecurity among adult women and are hypothesized to negatively affect the formation of stable social relationships, educational attainment and the ability to maintain employment – factors that may buffer against food insecurity( Reference Sun, Knowles and Patel 44 ). Given the well-documented and far-reaching negative effects of ACE on adult health and well-being( Reference Felitti, Anda and Nordenberg 42 ), this association may warrant further investigation in college populations. Screening students for ACE, if done using trauma-informed and non-stigmatizing approaches( Reference Oral, Ramirez and Coohey 53 ), may help identify students at higher risk for food insecurity and other adverse health behaviours and outcomes.
Food insecurity was associated with all three indicators of psychosocial health: depression, anxiety and hope. Our findings are consistent with the limited literature on food insecurity and psychosocial health among college and university students( Reference Bruening, van Woerden and Todd 18 , Reference Bruening, Brennhofer and van Woerden 19 ), as well as broader literature on the associations between food insecurity and mental health. Food insecurity has been repeatedly associated with higher levels of depression, anxiety and stress in developed( Reference Bruening, Dinour and Chavez 11 ) and developing country settings( Reference Weaver and Hadley 54 ), and is hypothesized to contribute to poor mental health by acting as a ‘toxic’ stressor( Reference Knowles, Rabinowich and Ettinger de Cuba 26 ) that disrupts physiological functioning and impairs mental health( Reference Shonkoff and Garner 55 ). Other stressors experienced during college, when students are establishing independence from their families and learning to balance multiple responsibilities such as school, work and personal relationships( Reference Towbes and Cohen 56 ), may compound food insecurity-related stress. Additional research is needed to understand the temporal relationships between food insecurity and psychosocial health among college and university students. Only one other study has examined the longitudinal effects of food insecurity in this population( Reference Bruening, van Woerden and Todd 18 ). While the authors did not find evidence that food insecurity was prospectively associated with psychosocial health, they did find that food insecurity was concurrently associated with stress and depression. Understanding the temporal features of student food insecurity (e.g. frequency, seasonality, duration), and the time frames within which health effects occur, can help guide the development and targeting of mental health promotion and treatment efforts to high-risk students.
Importantly, we found that psychosocial health fully mediated the association between food insecurity and GPA. While our study is the first to identify a mechanism through which food insecurity affects academic performance, the individual pathways identified are supported by existing literature. In addition to previously identified negative associations between food insecurity and GPA( Reference Patton-Lopez, Lopez-Cevallos and Cancel-Tirado 15 , Reference Maroto, Snelling and Linck 20 , Reference Morris, Smith and Davis 21 ), depression( Reference Eisenberg, Golberstein and Hunt 57 , Reference Hysenbegasi, Hass and Rowland 58 ), anxiety( Reference Eisenberg, Golberstein and Hunt 57 ) and low hope( Reference Snyder, Shorey and Cheavens 59 ) have been associated with poorer academic performance, including GPA and degree completion, among college students. Poor mental health, particularly anxiety and depression, is hypothesized to hinder academic performance through various factors, such as reduced energy, difficulty making decisions, difficulty concentrating and decreased interest in the future( Reference Eisenberg, Golberstein and Hunt 57 ). While addressing the underlying socio-economic conditions and life-course exposures that give rise to food insecurity among college students is imperative, it must be accompanied by efforts to alleviate existing food insecurity and intervene on the psychosocial mechanisms through which it affects academic performance.
With the increased attention that campus food insecurity has received in the academic literature( Reference Bruening, Argo and Payne-Sturges 8 ) as well as the popular press( Reference Goldrick-Rab 60 , Reference Dewey 61 ), a number of colleges and universities have begun to acknowledge and address student food insecurity. Campus-based food pantries, which procure, store and distribute free food directly to students in need, and student financial literacy programmes have been the most common responses to student food insecurity( Reference Bruening, Argo and Payne-Sturges 8 ). The College and University Food Bank Alliance was started in 2012 to support colleges/universities in developing and sustaining student food pantries, and currently has over 600 members( 62 ). The majority of college students are ineligible for SNAP, the primary tool for preventing and alleviating food insecurity in the USA.Footnote * As a result, several campuses and organizations have advocated for expanding SNAP eligibility and ensuring that campus food vendors are enrolled in the electronic benefits transfer system and able to accept SNAP benefits( Reference Bruening, Argo and Payne-Sturges 8 ). For food-insecure students, these critical solutions can provide the immediate support needed to meet basic food needs. However, multicomponent interventions that also address co-occurring mental health and academic concerns will likely be required to comprehensively address the needs of food-insecure students.
Strengths and limitations
The present study has several notable strengths. Most importantly, it was the first to use a longitudinal design to assess the association between food insecurity and academic performance, and identify the potential mediating role of psychosocial health, among college/university students. While existing research has largely examined bivariate associations using cross-sectional data, we used SEM with indicators measured at two time points to test our mediation hypothesis. Our study was further strengthened by a large sample size and the ability to compare across multiple types of colleges and universities. The majority of existing research is based on smaller samples collected from individual institutions. In addition, we used well-established indicators of psychosocial health, which demonstrated excellent reliability in our sample.
Despite these strengths, our study was subject to several important limitations. While we used existing literature to support our conceptualization of food insecurity as a predictor of psychosocial health, the causal relationship is likely bidirectional( Reference Bruening, Dinour and Chavez 11 ). Future research should employ more advanced longitudinal study designs and analytical techniques to further understand the dynamic relationship between food insecurity and psychosocial health. Additionally, our data set required the use of mediator and outcome variables measured at the same time point, as well as one indicator of psychosocial health measured concurrently with food insecurity. Ideally, we would have measured hope at Wave 4 with the other psychosocial health indicators, but the importance of minimizing participant burden precluded us from doing so. However, as discussed, the Hope Scale has demonstrated high test–retest reliability over 8- to 10-week periods in college populations( Reference Edwards, Rand and Lopez 38 – Reference Yoshinobu 41 ). While our study advances existing literature by measuring food insecurity prior to health and academic outcomes, future studies should include additional waves of data to more definitively support the temporal relationships between the exposure, mediator and outcome. Another limitation is that GPA was self-reported. Objectively measured GPA, as well as additional indicators of academic performance, can advance our understanding of how food insecurity affects academic performance among college and university students. In addition, although the sample was comprised of diverse young adults in terms of race, ethnicity and socio-economic backgrounds; diverse college types (e.g. private, public, technical, HBCU); and students in rural and urban settings, the sample was comprised of college students from Georgia, limiting the generalizability of our results to the broader young adult population. Finally, despite the sample characteristics being representative of age and racial/ethnic characteristics of the student populations, the sample was comprised of a slightly higher proportion of women than is representative of the student population.
Conclusions
Food insecurity is a significant problem on college and university campuses, and has important implications for psychosocial health and academic performance. Our study provides initial evidence that the experience of food insecurity hinders academic performance through its harmful effects on psychosocial health. For higher education to fulfil its potential as an engine of social mobility, immediate efforts to address student food insecurity are needed to ensure that all students have the resources they need to succeed. Programmes and policies should prioritize students at greatest risk for food insecurity, including those who have experienced life-course and current socio-economic disadvantage. The development and evaluation of multicomponent interventions, which jointly address food insecurity and its consequences, will be an important next step in understanding and addressing food insecurity among college and university students.
Acknowledgements
Acknowledgements: The authors would like to thank their Campus Advisory Board members across the state of Georgia in developing and assisting in administering this survey. They also would like to thank ICF International for their scientific input and technical support in conducting this research. Financial support: This research was supported by the National Cancer Institute (Principal Investigator: C.J.B., grant number 1R01CA179422-01). I.G.R. was supported by the National Heart, Lung, and Blood Institute (NHLBI) Predoctoral T32 Multidisciplinary Research Training to Reduce Inequities in Cardiovascular Health (grant number 5T32HL130025). The funders had no role in the design, analysis or writing of this article. Conflict of interest: None. Authorship: I.G.R. formulated the research question, conducted the analyses and drafted the manuscript. R.H. provided oversight and support for all statistical analyses and aided in the interpretation of results. C.J.B. designed and implemented the study. All authors provided feedback on multiple drafts of the manuscript and approved the version submitted for publication. Ethics of human subject participation: This study was conducted according to the guidelines laid down in the Declaration of Helsinki and all procedures involving human subjects were approved by the Institutional Review Boards of Emory University, ICF Macro International, Albany State University, Berry College, University of North Georgia and Valdosta State University. Electronic informed consent was obtained from all subjects.


