






1. Introduction
For decades, it has been understood that the Reynolds number ( $Re$
) profoundly affects properties of a spatially developing turbulent boundary layer (TBL). Both the mean-velocity profile and the ‘structure of turbulence’, typically referring to the wall-normal distribution of averaged turbulent stresses, are affected fundamentally by the change in
$Re$
) profoundly affects properties of a spatially developing turbulent boundary layer (TBL). Both the mean-velocity profile and the ‘structure of turbulence’, typically referring to the wall-normal distribution of averaged turbulent stresses, are affected fundamentally by the change in $Re$
regime. For instance, this change manifests itself in a distinctly modified streamwise progression of the friction coefficient
$Re$
regime. For instance, this change manifests itself in a distinctly modified streamwise progression of the friction coefficient $c_f = 2 \tau _w / (\rho _\infty u_\infty ^2)$
at roughly
$c_f = 2 \tau _w / (\rho _\infty u_\infty ^2)$
at roughly $4000\lessapprox Re_\theta \lessapprox 5000$
, where
$4000\lessapprox Re_\theta \lessapprox 5000$
, where $\tau _w$
is the averaged wall shear stress,
$\tau _w$
is the averaged wall shear stress, $\rho _\infty$
and
$\rho _\infty$
and $u_\infty$
are the mass density and streamwise velocity of the free-stream flow and
$u_\infty$
are the mass density and streamwise velocity of the free-stream flow and $Re_\theta = \theta u_\infty \rho / \mu$
is the Reynolds number formulated with the momentum thickness
$Re_\theta = \theta u_\infty \rho / \mu$
is the Reynolds number formulated with the momentum thickness $\theta$
and dynamic viscosity
$\theta$
and dynamic viscosity $\mu$
. The progression of
$\mu$
. The progression of $c_f(Re_\theta )$
is usually approximated by a corresponding low-
$c_f(Re_\theta )$
is usually approximated by a corresponding low- $Re$
or high-
$Re$
or high- $Re$
correlation, for example that of Smits, Matheson & Joubert (Reference Smits, Matheson and Joubert1983) or the ‘Coles–Fernholz 2’ correlation of Nagib, Chauhan & Monkewitz (Reference Nagib, Chauhan and Monkewitz2007). In approximately the same
$Re$
correlation, for example that of Smits, Matheson & Joubert (Reference Smits, Matheson and Joubert1983) or the ‘Coles–Fernholz 2’ correlation of Nagib, Chauhan & Monkewitz (Reference Nagib, Chauhan and Monkewitz2007). In approximately the same $Re$
range as the change in
$Re$
range as the change in $c_f$
, the wake parameter (to be defined later) becomes roughly constant. However, such trends are largely based on fits determined from a multitude of numerical and experimental data, potentially hiding finer details due to data scatter. The wake parameter
$c_f$
, the wake parameter (to be defined later) becomes roughly constant. However, such trends are largely based on fits determined from a multitude of numerical and experimental data, potentially hiding finer details due to data scatter. The wake parameter $\Pi$
in particular (but also
$\Pi$
in particular (but also $c_f$
) shows a surprisingly strong data scatter as seen in Fernholz & Finley (Reference Fernholz and Finley1980), Panton (Reference Panton2005), Chauhan, Monkewitz & Nagib (Reference Chauhan, Monkewitz and Nagib2009) and Sanmiguel Vila et al. (Reference Sanmiguel Vila, Vinuesa, Discetti, Ianiro, Schlatter and Örlü2017). Historically, such has allowed a consensus as to large-scale trends over a wide
$c_f$
) shows a surprisingly strong data scatter as seen in Fernholz & Finley (Reference Fernholz and Finley1980), Panton (Reference Panton2005), Chauhan, Monkewitz & Nagib (Reference Chauhan, Monkewitz and Nagib2009) and Sanmiguel Vila et al. (Reference Sanmiguel Vila, Vinuesa, Discetti, Ianiro, Schlatter and Örlü2017). Historically, such has allowed a consensus as to large-scale trends over a wide $Re$
range, however, clear and detailed discussion about its particular characteristic in the range
$Re$
range, however, clear and detailed discussion about its particular characteristic in the range $4000\lessapprox Re_\theta \lessapprox 5000$
has not been possible. The mentioned Reynolds-number range represents an effective ‘blind spot’ rarely covered by both numerical and experimental studies with particular emphasis on the upstream development of the turbulent wake, limiting an accurate discussion of fine edge-to-wall trends.
$4000\lessapprox Re_\theta \lessapprox 5000$
has not been possible. The mentioned Reynolds-number range represents an effective ‘blind spot’ rarely covered by both numerical and experimental studies with particular emphasis on the upstream development of the turbulent wake, limiting an accurate discussion of fine edge-to-wall trends.
From a numerical point of view, the principal challenge in obtaining reliable TBL data in this Reynolds-number region (and beyond) is the strong dependence of the boundary-layer properties on the turbulent inflow boundary condition, which has been addressed in Schlatter & Örlü (Reference Schlatter and Örlü2012), Sillero, Jiménez & Moser (Reference Sillero, Jiménez and Moser2013), Sanmiguel Vila et al. (Reference Sanmiguel Vila, Vinuesa, Discetti, Ianiro, Schlatter and Örlü2017) and Ceci et al. (Reference Ceci, Palumbo, Larsson and Pirozzoli2022). Whereas the near-wall flow (and thus $c_f$
) generally develops rather quickly to a state with approximately
$c_f$
) generally develops rather quickly to a state with approximately $1{-}2\, \%$
uncertainty, the slow characteristic period of the outer layer can easily take several hundred inflow boundary-layer thicknesses
$1{-}2\, \%$
uncertainty, the slow characteristic period of the outer layer can easily take several hundred inflow boundary-layer thicknesses $\delta _0$
to reach a consistent, inflow-independent state, quickly escalating the computational cost of wake-converged direct numerical simulation (DNS) as covered in e.g. Sillero et al. (Reference Sillero, Jiménez and Moser2013) and Ceci et al. (Reference Ceci, Palumbo, Larsson and Pirozzoli2022). If, for instance, a DNS is aimed at covering a targeted
$\delta _0$
to reach a consistent, inflow-independent state, quickly escalating the computational cost of wake-converged direct numerical simulation (DNS) as covered in e.g. Sillero et al. (Reference Sillero, Jiménez and Moser2013) and Ceci et al. (Reference Ceci, Palumbo, Larsson and Pirozzoli2022). If, for instance, a DNS is aimed at covering a targeted $Re$
in the range
$Re$
in the range $4000 \lessapprox Re_\theta \lessapprox 5000$
with a well-developed wake (with respect to metrics like shape factor, etc.), a numerical domain would already have to start at
$4000 \lessapprox Re_\theta \lessapprox 5000$
with a well-developed wake (with respect to metrics like shape factor, etc.), a numerical domain would already have to start at $Re_{\theta } \approx 780$
if an inflow relaxation length of
$Re_{\theta } \approx 780$
if an inflow relaxation length of $200\delta _0$
is to be guaranteed upstream of e.g.
$200\delta _0$
is to be guaranteed upstream of e.g. $Re_\theta \approx 3000$
, allowing some buffer for physical development. Here,
$Re_\theta \approx 3000$
, allowing some buffer for physical development. Here, $200\delta _0$
can be seen as a rough consensus of recent studies, based on the authors’ own assessments, through evaluation of Schlatter & Örlü (Reference Schlatter and Örlü2010), Sillero et al. (Reference Sillero, Jiménez and Moser2013) and Eitel-Amor, Örlü & Schlatter (Reference Eitel-Amor, Örlü and Schlatter2014) among others. This finding applies particularly to studies using a recycling strategy, which often show a pronounced initial drop in
$200\delta _0$
can be seen as a rough consensus of recent studies, based on the authors’ own assessments, through evaluation of Schlatter & Örlü (Reference Schlatter and Örlü2010), Sillero et al. (Reference Sillero, Jiménez and Moser2013) and Eitel-Amor, Örlü & Schlatter (Reference Eitel-Amor, Örlü and Schlatter2014) among others. This finding applies particularly to studies using a recycling strategy, which often show a pronounced initial drop in $\Pi$
immediately downstream of the inlet before slowly converging towards an expected value from below, see Sillero et al. (Reference Sillero, Jiménez and Moser2013) and Ceci et al. (Reference Ceci, Palumbo, Larsson and Pirozzoli2022). Most likely, this drop can be attributed to the fact that traditional recycling approaches only rescale the turbulent flow field in the wall-normal direction but not in the spanwise direction. Consequently, highly reliable DNS of TBLs require careful application of inflow boundary conditions in combination with simulation domains of very large spatial extent that enable the physically representative, inflow-independent evolution of the boundary layer as explored in Wenzel (Reference Wenzel2019). Mainly due to the sheer computational demand needed to establish an inflow length of
$\Pi$
immediately downstream of the inlet before slowly converging towards an expected value from below, see Sillero et al. (Reference Sillero, Jiménez and Moser2013) and Ceci et al. (Reference Ceci, Palumbo, Larsson and Pirozzoli2022). Most likely, this drop can be attributed to the fact that traditional recycling approaches only rescale the turbulent flow field in the wall-normal direction but not in the spanwise direction. Consequently, highly reliable DNS of TBLs require careful application of inflow boundary conditions in combination with simulation domains of very large spatial extent that enable the physically representative, inflow-independent evolution of the boundary layer as explored in Wenzel (Reference Wenzel2019). Mainly due to the sheer computational demand needed to establish an inflow length of ${\gt }200 \delta _0$
for DNS data reaching
${\gt }200 \delta _0$
for DNS data reaching $Re_\theta \gtrapprox 4000$
, Ceci et al. (Reference Ceci, Palumbo, Larsson and Pirozzoli2022), however, concluded that ‘very few studies have used such long domains, which raises questions about the reliability of reference data’.
$Re_\theta \gtrapprox 4000$
, Ceci et al. (Reference Ceci, Palumbo, Larsson and Pirozzoli2022), however, concluded that ‘very few studies have used such long domains, which raises questions about the reliability of reference data’.
In a physical experiment, the challenges are not dissimilar to those of numerical simulation in the low- $Re$
regime. For example, the effects of the leading edge of the flat plate or the choice of transition method (natural transition, trip wire, etc.) can influence the boundary-layer growth at low
$Re$
regime. For example, the effects of the leading edge of the flat plate or the choice of transition method (natural transition, trip wire, etc.) can influence the boundary-layer growth at low $Re$
considerably, as discussed in e.g. Smits et al. (Reference Smits, Matheson and Joubert1983) and Erm & Joubert (Reference Erm and Joubert1991). In addition, local
$Re$
considerably, as discussed in e.g. Smits et al. (Reference Smits, Matheson and Joubert1983) and Erm & Joubert (Reference Erm and Joubert1991). In addition, local $\tau _w$
is difficult to directly measure in experiment, thus
$\tau _w$
is difficult to directly measure in experiment, thus $c_f$
is often estimated indirectly through calibration of the streamwise velocity profile based on an assumed logarithmic-layer profile, for example through the Clauser fitting method. The most reliable experimental data for
$c_f$
is often estimated indirectly through calibration of the streamwise velocity profile based on an assumed logarithmic-layer profile, for example through the Clauser fitting method. The most reliable experimental data for $c_f$
are those which have been obtained using oil-film interferometry (OFI), a technique capable of directly measuring local
$c_f$
are those which have been obtained using oil-film interferometry (OFI), a technique capable of directly measuring local $\tau _w$
, discussed in depth in Fernholz et al. (Reference Fernholz, Janke, Schober, Wagner and Warnack1996). Further difficulties, especially concerning the discussion of the spatial development of the turbulent wake, arise from its sensitivity to uncertainties in the direct determination of
$\tau _w$
, discussed in depth in Fernholz et al. (Reference Fernholz, Janke, Schober, Wagner and Warnack1996). Further difficulties, especially concerning the discussion of the spatial development of the turbulent wake, arise from its sensitivity to uncertainties in the direct determination of $\tau _w$
, as well as the practical feasibility of performing measurements with very high streamwise resolution. Perhaps the best-known OFI experiments are those of Österlund et al. (Reference Österlund, Johansson, Nagib and Hites2000) and Nagib et al. (Reference Nagib, Christophorou and Monkewitz2006), whose datasets, however, start at
$\tau _w$
, as well as the practical feasibility of performing measurements with very high streamwise resolution. Perhaps the best-known OFI experiments are those of Österlund et al. (Reference Österlund, Johansson, Nagib and Hites2000) and Nagib et al. (Reference Nagib, Christophorou and Monkewitz2006), whose datasets, however, start at $Re_\theta \gtrapprox 6700$
and
$Re_\theta \gtrapprox 6700$
and $Re_\theta \gtrapprox 12\,200$
, respectively, thus being well above the ‘blind spot’ at
$Re_\theta \gtrapprox 12\,200$
, respectively, thus being well above the ‘blind spot’ at $4000\lessapprox Re_\theta \lessapprox 5000$
.
$4000\lessapprox Re_\theta \lessapprox 5000$
.
1.1. Objectives
The primary objective of the present work is to zoom in to the $Re$
range where low-
$Re$
range where low- $Re$
and high-
$Re$
and high- $Re$
correlations meet (
$Re$
correlations meet ( $4000 \lessapprox Re_\theta \lessapprox 5000$
) with a DNS that is likely devoid of spurious inflow effects. To this end, DNS data of a supersonic compressible boundary layer are considered starting at a low inflow
$4000 \lessapprox Re_\theta \lessapprox 5000$
) with a DNS that is likely devoid of spurious inflow effects. To this end, DNS data of a supersonic compressible boundary layer are considered starting at a low inflow $Re$
and ending notably past
$Re$
and ending notably past $Re_\theta \approx 5000$
, enabling trends to become clearly visible. Here, the low inflow
$Re_\theta \approx 5000$
, enabling trends to become clearly visible. Here, the low inflow $Re$
allows the data to be considered effectively free of inlet artefacts by discarding the first
$Re$
allows the data to be considered effectively free of inlet artefacts by discarding the first ${\sim }300 \delta _0$
worth of domain extent, as seen in figure 5. Moreover, the downstream state in excess of
${\sim }300 \delta _0$
worth of domain extent, as seen in figure 5. Moreover, the downstream state in excess of $Re_\theta \gtrapprox 5000$
allows confirmation of trends established upstream. The main question addressed is: What physical changes occur in the mean flow of the TBL as it develops from a low to moderate Reynolds number, i.e. (i) how clearly can a TBL be characterised as being either a low or moderate
$Re_\theta \gtrapprox 5000$
allows confirmation of trends established upstream. The main question addressed is: What physical changes occur in the mean flow of the TBL as it develops from a low to moderate Reynolds number, i.e. (i) how clearly can a TBL be characterised as being either a low or moderate $Re$
TBL, or in other words, how distinctly does this change manifest itself in e.g. the
$Re$
TBL, or in other words, how distinctly does this change manifest itself in e.g. the $c_f$
distribution? (ii) How clearly can this behaviour be associated with turbulent wake saturation, i.e. the turbulent wake’s arrival at a self-similar state? (iii) What is the connection between early moderate-
$c_f$
distribution? (ii) How clearly can this behaviour be associated with turbulent wake saturation, i.e. the turbulent wake’s arrival at a self-similar state? (iii) What is the connection between early moderate- $Re$
behaviour and the early development of the logarithmic layer? By considering all questions in the context of existing literature data, the consistency of the conclusions is strengthened.
$Re$
behaviour and the early development of the logarithmic layer? By considering all questions in the context of existing literature data, the consistency of the conclusions is strengthened.
Use of a compressible boundary layer in this study is motivated by greater computational efficiency as compared with incompressible solvers which require the solution of a Poisson equation for pressure. In fact, whereas DNS of incompressible boundary layers is still limited to the work of Sillero et al. (Reference Sillero, Jiménez and Moser2013), reaching $Re_{\tau } \approx 2000$
, higher Reynolds numbers have been achieved with DNS of compressible boundary layers (Pirozzoli & Bernardini Reference Pirozzoli and Bernardini2013). Despite obvious differences between low- and high-speed shear layers, evidence is provided that the reported results also extend to the incompressible case.
$Re_{\tau } \approx 2000$
, higher Reynolds numbers have been achieved with DNS of compressible boundary layers (Pirozzoli & Bernardini Reference Pirozzoli and Bernardini2013). Despite obvious differences between low- and high-speed shear layers, evidence is provided that the reported results also extend to the incompressible case.
1.2. Nomenclature and conventions
In the present study, the streamwise, wall-normal and spanwise directions are denoted by $[x,y,z]$
respectively. Inlet free-stream values are designated by a subscript ‘
$[x,y,z]$
respectively. Inlet free-stream values are designated by a subscript ‘ $0$
’. Overlined values (
$0$
’. Overlined values ( $\bar {f}$
) refer to Reynolds-averaged values, where
$\bar {f}$
) refer to Reynolds-averaged values, where $f$
is an arbitrary quantity. Mean-removed quantities are denoted by a single prime (
$f$
is an arbitrary quantity. Mean-removed quantities are denoted by a single prime ( $f^\prime = f - \bar {f}$
). Quantities normalised by viscous characteristic scales are denoted by a superscript ‘
$f^\prime = f - \bar {f}$
). Quantities normalised by viscous characteristic scales are denoted by a superscript ‘ $+$
’ and the subscript ‘
$+$
’ and the subscript ‘ $w$
’ refers to quantities at the wall (
$w$
’ refers to quantities at the wall ( $y=0$
). Boundary-layer edge values (subscript ‘
$y=0$
). Boundary-layer edge values (subscript ‘ $e$
’) are defined at the minimum
$e$
’) are defined at the minimum $y$
position where the inner-scaled mean
$y$
position where the inner-scaled mean $z$
vorticity magnitude falls below a small numerical-noise tolerance
$z$
vorticity magnitude falls below a small numerical-noise tolerance $\epsilon$
, i.e.
$\epsilon$
, i.e. $y_e = \min (y : |\bar {\omega }_z^+ |{\lt }\epsilon )$
, and represent the local free-stream state. The 99 % hydrodynamic boundary-layer thickness
$y_e = \min (y : |\bar {\omega }_z^+ |{\lt }\epsilon )$
, and represent the local free-stream state. The 99 % hydrodynamic boundary-layer thickness $\delta _{99}$
is determined as
$\delta _{99}$
is determined as $\delta _{99} = ( y : \breve {u} = 0.99 \breve {u}_e )$
, where the pseudo-velocity
$\delta _{99} = ( y : \breve {u} = 0.99 \breve {u}_e )$
, where the pseudo-velocity $\breve {u}_e$
results from wall-normal integration of
$\breve {u}_e$
results from wall-normal integration of $-\bar {\omega }_z$
(Spalart & Strelets Reference Spalart and Strelets2000). Values at
$-\bar {\omega }_z$
(Spalart & Strelets Reference Spalart and Strelets2000). Values at $y = \delta _{99}$
are denoted by the subscript ‘
$y = \delta _{99}$
are denoted by the subscript ‘ $99$
’.
$99$
’.
The present study is structured as follows. The DNS set-up is summarised in § 2, results are discussed in § 3 and concluding remarks are made in § 4.
2. Simulation details
For this study, a DNS of a compressible zero-pressure-gradient TBL is computed at an inlet free-stream Mach number of $M_0 = 2$
with adiabatic wall conditions. As shown by Pirozzoli & Bernardini (Reference Pirozzoli and Bernardini2011), use of the van Driest compressibility transformation is well proven to compensate for compressibility effects in adiabatic cases, guaranteeing universality of even higher-order velocity moments as skewness and flatness in the inner layer, see e.g. Guarini et al. (Reference Guarini, Moser, Shariff and Wray2000) and Bernardini & Pirozzoli (Reference Bernardini and Pirozzoli2011). Therefore, the conclusions drawn here for the compressible regime apply equally to the incompressible regime, with the relevant caveats highlighted. For all following discussions, the compressible data are considered in their equivalent incompressible representation using viscosity or density scaling. The equivalent form of the incompressible momentum thickness Reynolds number
$M_0 = 2$
with adiabatic wall conditions. As shown by Pirozzoli & Bernardini (Reference Pirozzoli and Bernardini2011), use of the van Driest compressibility transformation is well proven to compensate for compressibility effects in adiabatic cases, guaranteeing universality of even higher-order velocity moments as skewness and flatness in the inner layer, see e.g. Guarini et al. (Reference Guarini, Moser, Shariff and Wray2000) and Bernardini & Pirozzoli (Reference Bernardini and Pirozzoli2011). Therefore, the conclusions drawn here for the compressible regime apply equally to the incompressible regime, with the relevant caveats highlighted. For all following discussions, the compressible data are considered in their equivalent incompressible representation using viscosity or density scaling. The equivalent form of the incompressible momentum thickness Reynolds number $Re_\theta$
is defined as
$Re_\theta$
is defined as $Re_{\theta _i} = Re_{\delta _2} = ({\bar {\mu }_e}/{\bar {\mu }_w} ) Re_{\theta _c}$
following van Driest (Reference van Driest1956). Here,
$Re_{\theta _i} = Re_{\delta _2} = ({\bar {\mu }_e}/{\bar {\mu }_w} ) Re_{\theta _c}$
following van Driest (Reference van Driest1956). Here, $Re_{\theta _c}$
refers to the momentum thickness Reynolds number as defined before when considering variable density and viscosity, i.e.
$Re_{\theta _c}$
refers to the momentum thickness Reynolds number as defined before when considering variable density and viscosity, i.e. $Re_{\theta _c} = \theta \bar {u}_e \bar {\rho }_e / \bar {\mu }_e$
. With this convention, the inflow Reynolds number of the DNS domain is located at
$Re_{\theta _c} = \theta \bar {u}_e \bar {\rho }_e / \bar {\mu }_e$
. With this convention, the inflow Reynolds number of the DNS domain is located at $Re_{\theta _i} \approx 153$
, sufficiently low such that the buffer layer effectively abuts the wake. A generous post-inlet relaxation region of
$Re_{\theta _i} \approx 153$
, sufficiently low such that the buffer layer effectively abuts the wake. A generous post-inlet relaxation region of $300 \delta _0$
assures that the turbulent wake is well recovered from the inflow, yielding an area of interest of
$300 \delta _0$
assures that the turbulent wake is well recovered from the inflow, yielding an area of interest of $1180 \lessapprox Re_{\theta _i} \lessapprox 5660$
, thereby covering the target region in the range
$1180 \lessapprox Re_{\theta _i} \lessapprox 5660$
, thereby covering the target region in the range $4000 \lessapprox Re_{\theta _i} \lessapprox 5000$
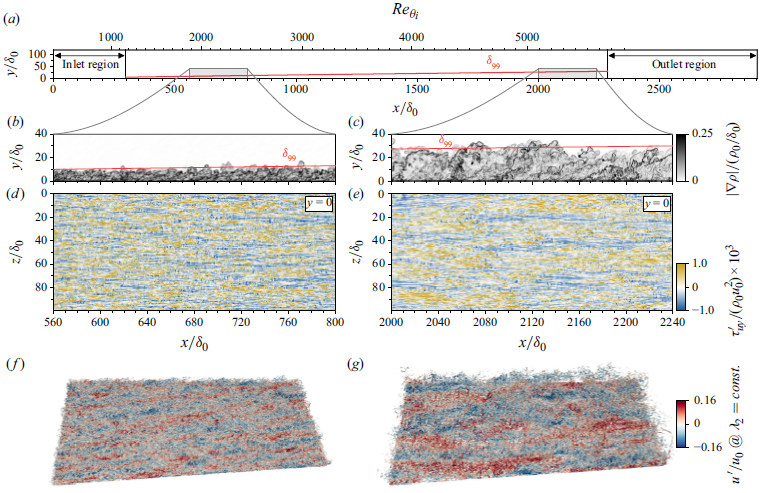
. Figure 5 illustrates the domain layout, along with snapshots of the instantaneous flow field.
$4000 \lessapprox Re_{\theta _i} \lessapprox 5000$
. Figure 5 illustrates the domain layout, along with snapshots of the instantaneous flow field.
2.1. Numerical method
The DNS has been performed with the compressible code ‘NS3D’, which solves the three-dimensional dimensionless compressible Navier–Stokes equations together with the continuity and energy equations in conservative formulation on a block-structured curvilinear grid. More details of the code and its numerical procedure can be found in Keller & Kloker (Reference Keller and Kloker2015, Reference Keller and Kloker2017) and Wenzel et al. (Reference Wenzel, Selent, Kloker and Rist2018). For spatial discretisation, sixth-order subdomain-compact finite differences in all three directions are used (Keller & Kloker Reference Keller and Kloker2013). For time stepping, the classical fourth-order Runge–Kutta scheme is employed, coupled with alternating forward- and backward-biased finite differences for the convective first derivatives (Kloker Reference Kloker1997; Babucke Reference Babucke2009). A spatial tenth-order implicit filter is used to attenuate numerical noise associated with discretisation error. At the solid wall, the flow is treated as fully adiabatic at every time instant with $(\partial T / \partial y)_w=0$
, which suppresses any heat exchange between the wall and fluid; the pressure at the wall is calculated by
$(\partial T / \partial y)_w=0$
, which suppresses any heat exchange between the wall and fluid; the pressure at the wall is calculated by $(\partial p / \partial y)_w=0$
. The zero-gradient wall conditions for both
$(\partial p / \partial y)_w=0$
. The zero-gradient wall conditions for both $T,p$
are calculated using an optimised one-sided fifth-order stencil (Kloker Reference Kloker1997). At the outflow, the time derivative, respectively the complete space operator, is extrapolated with
$T,p$
are calculated using an optimised one-sided fifth-order stencil (Kloker Reference Kloker1997). At the outflow, the time derivative, respectively the complete space operator, is extrapolated with $ \partial \boldsymbol{Q}/\partial t|_i= \partial \boldsymbol{Q}/\partial t|_{i-1}$
corresponding to a first-order extrapolation, where
$ \partial \boldsymbol{Q}/\partial t|_i= \partial \boldsymbol{Q}/\partial t|_{i-1}$
corresponding to a first-order extrapolation, where $\boldsymbol{Q}$
is the dimensionless conservative solution vector and
$\boldsymbol{Q}$
is the dimensionless conservative solution vector and $i$
represents the grid index in
$i$
represents the grid index in $x$
. At the top of the simulation domain, a characteristic outflow condition is applied (Wenzel Reference Wenzel2019); a validation of the zero-pressure-gradient condition can be found in Wenzel et al. (Reference Wenzel, Gibis, Kloker and Rist2019). At the inflow, a digital-filtering approach is used to generate an unsteady turbulent inflow condition, as discussed in Wenzel et al. (Reference Wenzel, Selent, Kloker and Rist2018) and Wenzel (Reference Wenzel2019). The spanwise direction is treated as periodic. The specific gas constant
$x$
. At the top of the simulation domain, a characteristic outflow condition is applied (Wenzel Reference Wenzel2019); a validation of the zero-pressure-gradient condition can be found in Wenzel et al. (Reference Wenzel, Gibis, Kloker and Rist2019). At the inflow, a digital-filtering approach is used to generate an unsteady turbulent inflow condition, as discussed in Wenzel et al. (Reference Wenzel, Selent, Kloker and Rist2018) and Wenzel (Reference Wenzel2019). The spanwise direction is treated as periodic. The specific gas constant $R$
, the ratio of specific heats
$R$
, the ratio of specific heats $\gamma = c_p/c_v = 1.4$
and the Prandtl number
$\gamma = c_p/c_v = 1.4$
and the Prandtl number ${Pr} = 0.71$
are constant.
${Pr} = 0.71$
are constant.
2.2. Domain grid and dimensions
The rectilinear grid is constructed as an orthogonal projection of three one-dimensional coordinate arrays. The grid is uniform in $x$
in the domain area of interest such that
$x$
in the domain area of interest such that $\Delta x^+ \lessapprox\,7$
. The grid is stretched in
$\Delta x^+ \lessapprox\,7$
. The grid is stretched in $y$
such that
$y$
such that $\Delta y^+_{w_{max}} \lessapprox 0.7$
and
$\Delta y^+_{w_{max}} \lessapprox 0.7$
and $\Delta y^+_{99} \lessapprox 5$
. In
$\Delta y^+_{99} \lessapprox 5$
. In $z$
, a uniform grid is defined such that
$z$
, a uniform grid is defined such that $\Delta z^+ \lessapprox 4$
. The domain height
$\Delta z^+ \lessapprox 4$
. The domain height $L_y$
and width
$L_y$
and width $L_z$
are dimensioned such that
$L_z$
are dimensioned such that $L_y / \delta _{{99}_{max}} \gtrapprox 4$
and
$L_y / \delta _{{99}_{max}} \gtrapprox 4$
and $L_z / \delta _{{99}_{max}} \gtrapprox 3$
, where
$L_z / \delta _{{99}_{max}} \gtrapprox 3$
, where $\delta _{{99}_{max}}$
is the maximum 99 % boundary-layer thickness in the area of interest. Table 1 summarises information about the computational domain. The friction Reynolds number is defined
$\delta _{{99}_{max}}$
is the maximum 99 % boundary-layer thickness in the area of interest. Table 1 summarises information about the computational domain. The friction Reynolds number is defined $Re_\tau = \delta _{99}^+ = \delta _{99} u_\tau \bar {\rho }_w / \bar {\mu }_w$
, where the friction velocity is
$Re_\tau = \delta _{99}^+ = \delta _{99} u_\tau \bar {\rho }_w / \bar {\mu }_w$
, where the friction velocity is $u_\tau = \sqrt {\tau _w/\bar {\rho }_w}$
and the mean wall shear stress is evaluated as
$u_\tau = \sqrt {\tau _w/\bar {\rho }_w}$
and the mean wall shear stress is evaluated as $\tau _w = \bar {\mu }_w ( \partial \bar {u} / \partial y )_w$
. The full grid contains over 25 billion points. The grid stretching and sponge-zone definition is based on the numerical set-up used by Wenzel et al. (Reference Wenzel, Selent, Kloker and Rist2018, Reference Wenzel, Vogler, Peter, Kloker and Rist2021), which ‘may be regarded as essentially devoid of spurious inflow effects’ according to the analysis of Ceci et al. (Reference Ceci, Palumbo, Larsson and Pirozzoli2022). After an initial transient phase of
$\tau _w = \bar {\mu }_w ( \partial \bar {u} / \partial y )_w$
. The full grid contains over 25 billion points. The grid stretching and sponge-zone definition is based on the numerical set-up used by Wenzel et al. (Reference Wenzel, Selent, Kloker and Rist2018, Reference Wenzel, Vogler, Peter, Kloker and Rist2021), which ‘may be regarded as essentially devoid of spurious inflow effects’ according to the analysis of Ceci et al. (Reference Ceci, Palumbo, Larsson and Pirozzoli2022). After an initial transient phase of $\Delta t / (L_x/u_0) \gtrapprox 2$
, a measurement phase is started in which statistical averaging and output of unsteady data are performed. The duration of the measurement phase is such that
$\Delta t / (L_x/u_0) \gtrapprox 2$
, a measurement phase is started in which statistical averaging and output of unsteady data are performed. The duration of the measurement phase is such that $\Delta t / (\delta _{99}/u_\tau )_{max} \gtrapprox 12$
, where
$\Delta t / (\delta _{99}/u_\tau )_{max} \gtrapprox 12$
, where $(\delta _{99}/u_\tau )_{max}$
denotes the maximum i.e. downstream-most local eddy-turnover period within the area of interest.
$(\delta _{99}/u_\tau )_{max}$
denotes the maximum i.e. downstream-most local eddy-turnover period within the area of interest.
The DNS domain and grid properties. $L$
and
$L$
and $N$
indicate the length and number of grid points per direction.
$N$
indicate the length and number of grid points per direction. $Re$
ranges and viscous resolutions correspond to the area of interest.
$Re$
ranges and viscous resolutions correspond to the area of interest.

3. Results and discussion
The following section examines the physical changes that occur in a spatially evolving boundary layer as it develops beyond the low- $Re$
range. To this end, the friction coefficient and turbulent wake are examined, as well as the connection between both quantities to the early development of the logarithmic layer.
$Re$
range. To this end, the friction coefficient and turbulent wake are examined, as well as the connection between both quantities to the early development of the logarithmic layer.
3.1. Introductory comment
In the following section, mainly the three incompressible DNS/Large-Eddy Simulation (LES) of Schlatter et al. (Reference Schlatter, Örlü, Li, Brethouwer, Fransson, Johansson, Alfredsson and Henningson2009), Schlatter & Örlü (Reference Schlatter and Örlü2010), Sillero et al. (Reference Sillero, Jiménez and Moser2013) and Eitel-Amor et al. (Reference Eitel-Amor, Örlü and Schlatter2014) are frequently referred to in order to support the conclusions drawn and to link them with existing data. However, since these data either do not cover the ‘blind spot’ in the range $4000 \lessapprox Re_\theta \lessapprox 5000$
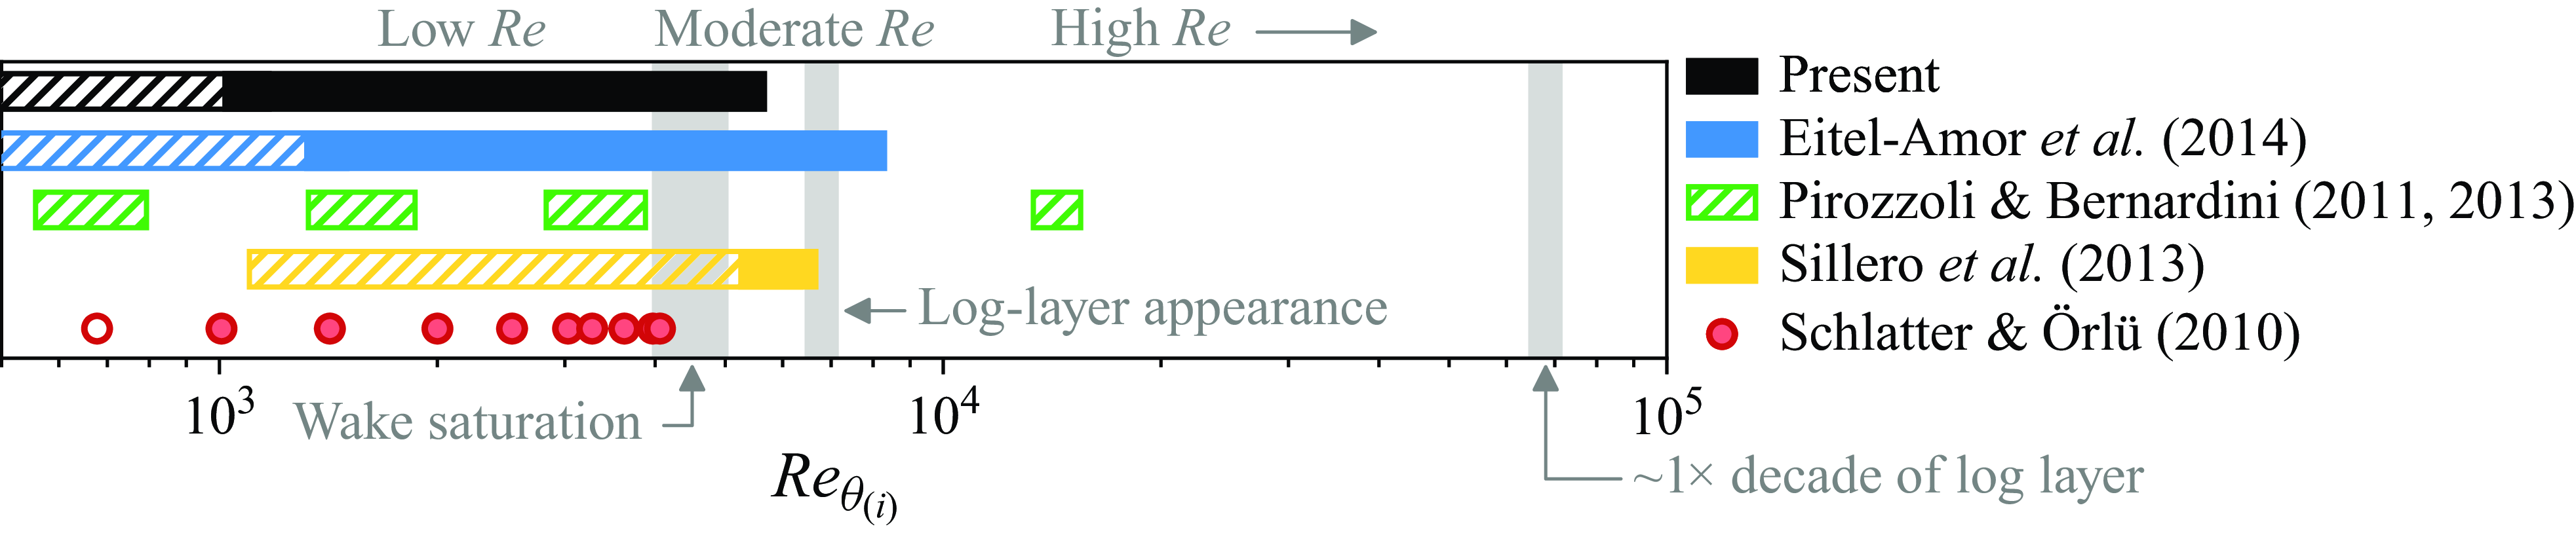
, or inlet independence of the outer layer cannot be ensured within this region, an assessment of the respective data is necessary. To this end, figure 1 illustrates the
$4000 \lessapprox Re_\theta \lessapprox 5000$
, or inlet independence of the outer layer cannot be ensured within this region, an assessment of the respective data is necessary. To this end, figure 1 illustrates the $Re_\theta$
range covered by the simulations mentioned above. For all datasets depicted, the inflow lengths are represented as hatched lines or open markers until either
$Re_\theta$
range covered by the simulations mentioned above. For all datasets depicted, the inflow lengths are represented as hatched lines or open markers until either $x \gtrapprox 200\delta _0$
or, if later, where the authors report confidence in shape factor, etc. Although it varies depending on the choice of inflow,
$x \gtrapprox 200\delta _0$
or, if later, where the authors report confidence in shape factor, etc. Although it varies depending on the choice of inflow, $200\delta _0$
roughly represents a typical transit length for necessary turbulent wake recovery, compare with e.g. Sillero et al. (Reference Sillero, Jiménez and Moser2013), where
$200\delta _0$
roughly represents a typical transit length for necessary turbulent wake recovery, compare with e.g. Sillero et al. (Reference Sillero, Jiménez and Moser2013), where ${\sim }250 \delta _0$
are required to span
${\sim }250 \delta _0$
are required to span $1100\lt Re_\theta \lt 4800$
. For the present dataset, the inflow length has been extended to
$1100\lt Re_\theta \lt 4800$
. For the present dataset, the inflow length has been extended to $300\delta _0$
to increase confidence of all following discussions. Note that such strictness is only necessary for highly sensitive quantities like the turbulent wake or shape factors.
$300\delta _0$
to increase confidence of all following discussions. Note that such strictness is only necessary for highly sensitive quantities like the turbulent wake or shape factors.
The $Re$
ranges of numerical zero pressure gradient (ZPG) TBL studies. Hatched bars or open markers indicate either
$Re$
ranges of numerical zero pressure gradient (ZPG) TBL studies. Hatched bars or open markers indicate either $\lessapprox 200\delta _0$
of development space or area upstream of where authors report confidence. The rationale behind the placement (in
$\lessapprox 200\delta _0$
of development space or area upstream of where authors report confidence. The rationale behind the placement (in $Re_\theta$
) of the logarithmic-layer ‘appearance’ and establishment of one decade of wall-normal extent can be found in Appendix A.
$Re_\theta$
) of the logarithmic-layer ‘appearance’ and establishment of one decade of wall-normal extent can be found in Appendix A.
3.2. Friction coefficient
In figure 2, the effect of $Re$
on
$Re$
on $c_f$
is examined. To compare compressible and incompressible data, both the present compressible DNS as well as the datasets of Pirozzoli & Bernardini (Reference Pirozzoli and Bernardini2011, Reference Pirozzoli and Bernardini2013) are transformed into their equivalent incompressible representation (subscript
$c_f$
is examined. To compare compressible and incompressible data, both the present compressible DNS as well as the datasets of Pirozzoli & Bernardini (Reference Pirozzoli and Bernardini2011, Reference Pirozzoli and Bernardini2013) are transformed into their equivalent incompressible representation (subscript $i$
) by applying the ‘van Driest II’ transformation, which for an adiabatic wall reduces to
$i$
) by applying the ‘van Driest II’ transformation, which for an adiabatic wall reduces to
 \begin{equation} c_{f_i} = F_c \, c_{f_c}, \quad F_c = \frac {\big(\bar {T}_w/\bar {T}_e-1\big)}{\arcsin \left ( \sqrt {1-\bar {T}_e/\bar {T}_w} \right )^2} . \end{equation}
Here, $c_{f_i}$
is the transformed incompressible counterpart to
$c_{f_i}$
is the transformed incompressible counterpart to $c_{f_c}$
, where
$c_{f_c}$
, where $c_{f_c} = 2 \tau _w / (\bar {\rho }_e \bar {u}_e^2)$
for compressible cases. In addition to the DNS/LES data already introduced in figure 1, figure 2 shows experimental data from the OFI measurements of Österlund et al. (Reference Österlund, Johansson, Nagib and Hites2000) and Nagib et al. (Reference Nagib, Christophorou and Monkewitz2006), representative of the state of the art in direct measurement of
$c_{f_c} = 2 \tau _w / (\bar {\rho }_e \bar {u}_e^2)$
for compressible cases. In addition to the DNS/LES data already introduced in figure 1, figure 2 shows experimental data from the OFI measurements of Österlund et al. (Reference Österlund, Johansson, Nagib and Hites2000) and Nagib et al. (Reference Nagib, Christophorou and Monkewitz2006), representative of the state of the art in direct measurement of $\tau _w$
. The low-
$\tau _w$
. The low- $Re$
power-law correlation of Smits et al. (Reference Smits, Matheson and Joubert1983)
$Re$
power-law correlation of Smits et al. (Reference Smits, Matheson and Joubert1983)
 \begin{equation} c_f \approx 0.024 \, Re_\theta ^{-0.25} \end{equation}
is plotted, as well as a curve of the form
 \begin{equation} c_f \approx a \, Re_\theta ^b + \frac {c}{Re_\theta }, \quad \text{ with }\; a = 0.01844,\ b = -0.2235,\ c = 0.2979 . \end{equation}
The latter simply represents an empirical best fit to the present data to highlight trends in panels ( $b$
) and (
$b$
) and ( $c$
). Note that the addition of a
$c$
). Note that the addition of a $c/Re$
term also better captures the
$c/Re$
term also better captures the $c_f$
trend for the low-
$c_f$
trend for the low- $Re$
region of the dataset of Schlatter & Örlü (Reference Schlatter and Örlü2010) rather than a pure power-law relationship. For the high-
$Re$
region of the dataset of Schlatter & Örlü (Reference Schlatter and Örlü2010) rather than a pure power-law relationship. For the high- $Re$
regime, the ‘Coles–Fernholz 2’ correlation
$Re$
regime, the ‘Coles–Fernholz 2’ correlation
 \begin{equation} c_f \approx 2 \big[ \kappa ^{-1} \ln (Re_\theta ) + C \big]^{-2} \quad \text{ with }\; \kappa = 0.384,\ C = 4.127 \end{equation}
is plotted (Fernholz & Finley Reference Fernholz and Finley1996; Nagib et al. Reference Nagib, Chauhan and Monkewitz2007). Note that $\kappa = 0.384$
is used in accordance with its high-
$\kappa = 0.384$
is used in accordance with its high- $Re$
calibration in Nagib et al. (Reference Nagib, Chauhan and Monkewitz2007), whereas later
$Re$
calibration in Nagib et al. (Reference Nagib, Chauhan and Monkewitz2007), whereas later $\kappa = 0.41$
is consistently utilised as a fixed constant for cross-comparing primarily low- and moderate-
$\kappa = 0.41$
is consistently utilised as a fixed constant for cross-comparing primarily low- and moderate- $Re$
datasets.
$Re$
datasets.
Friction coefficient $c_f$
vs
$c_f$
vs $Re_\theta$
with compressible scaling (a,b) and compensated representation (c,d). Panels (b,d) are zooms of (a,c), respectively.
$Re_\theta$
with compressible scaling (a,b) and compensated representation (c,d). Panels (b,d) are zooms of (a,c), respectively.
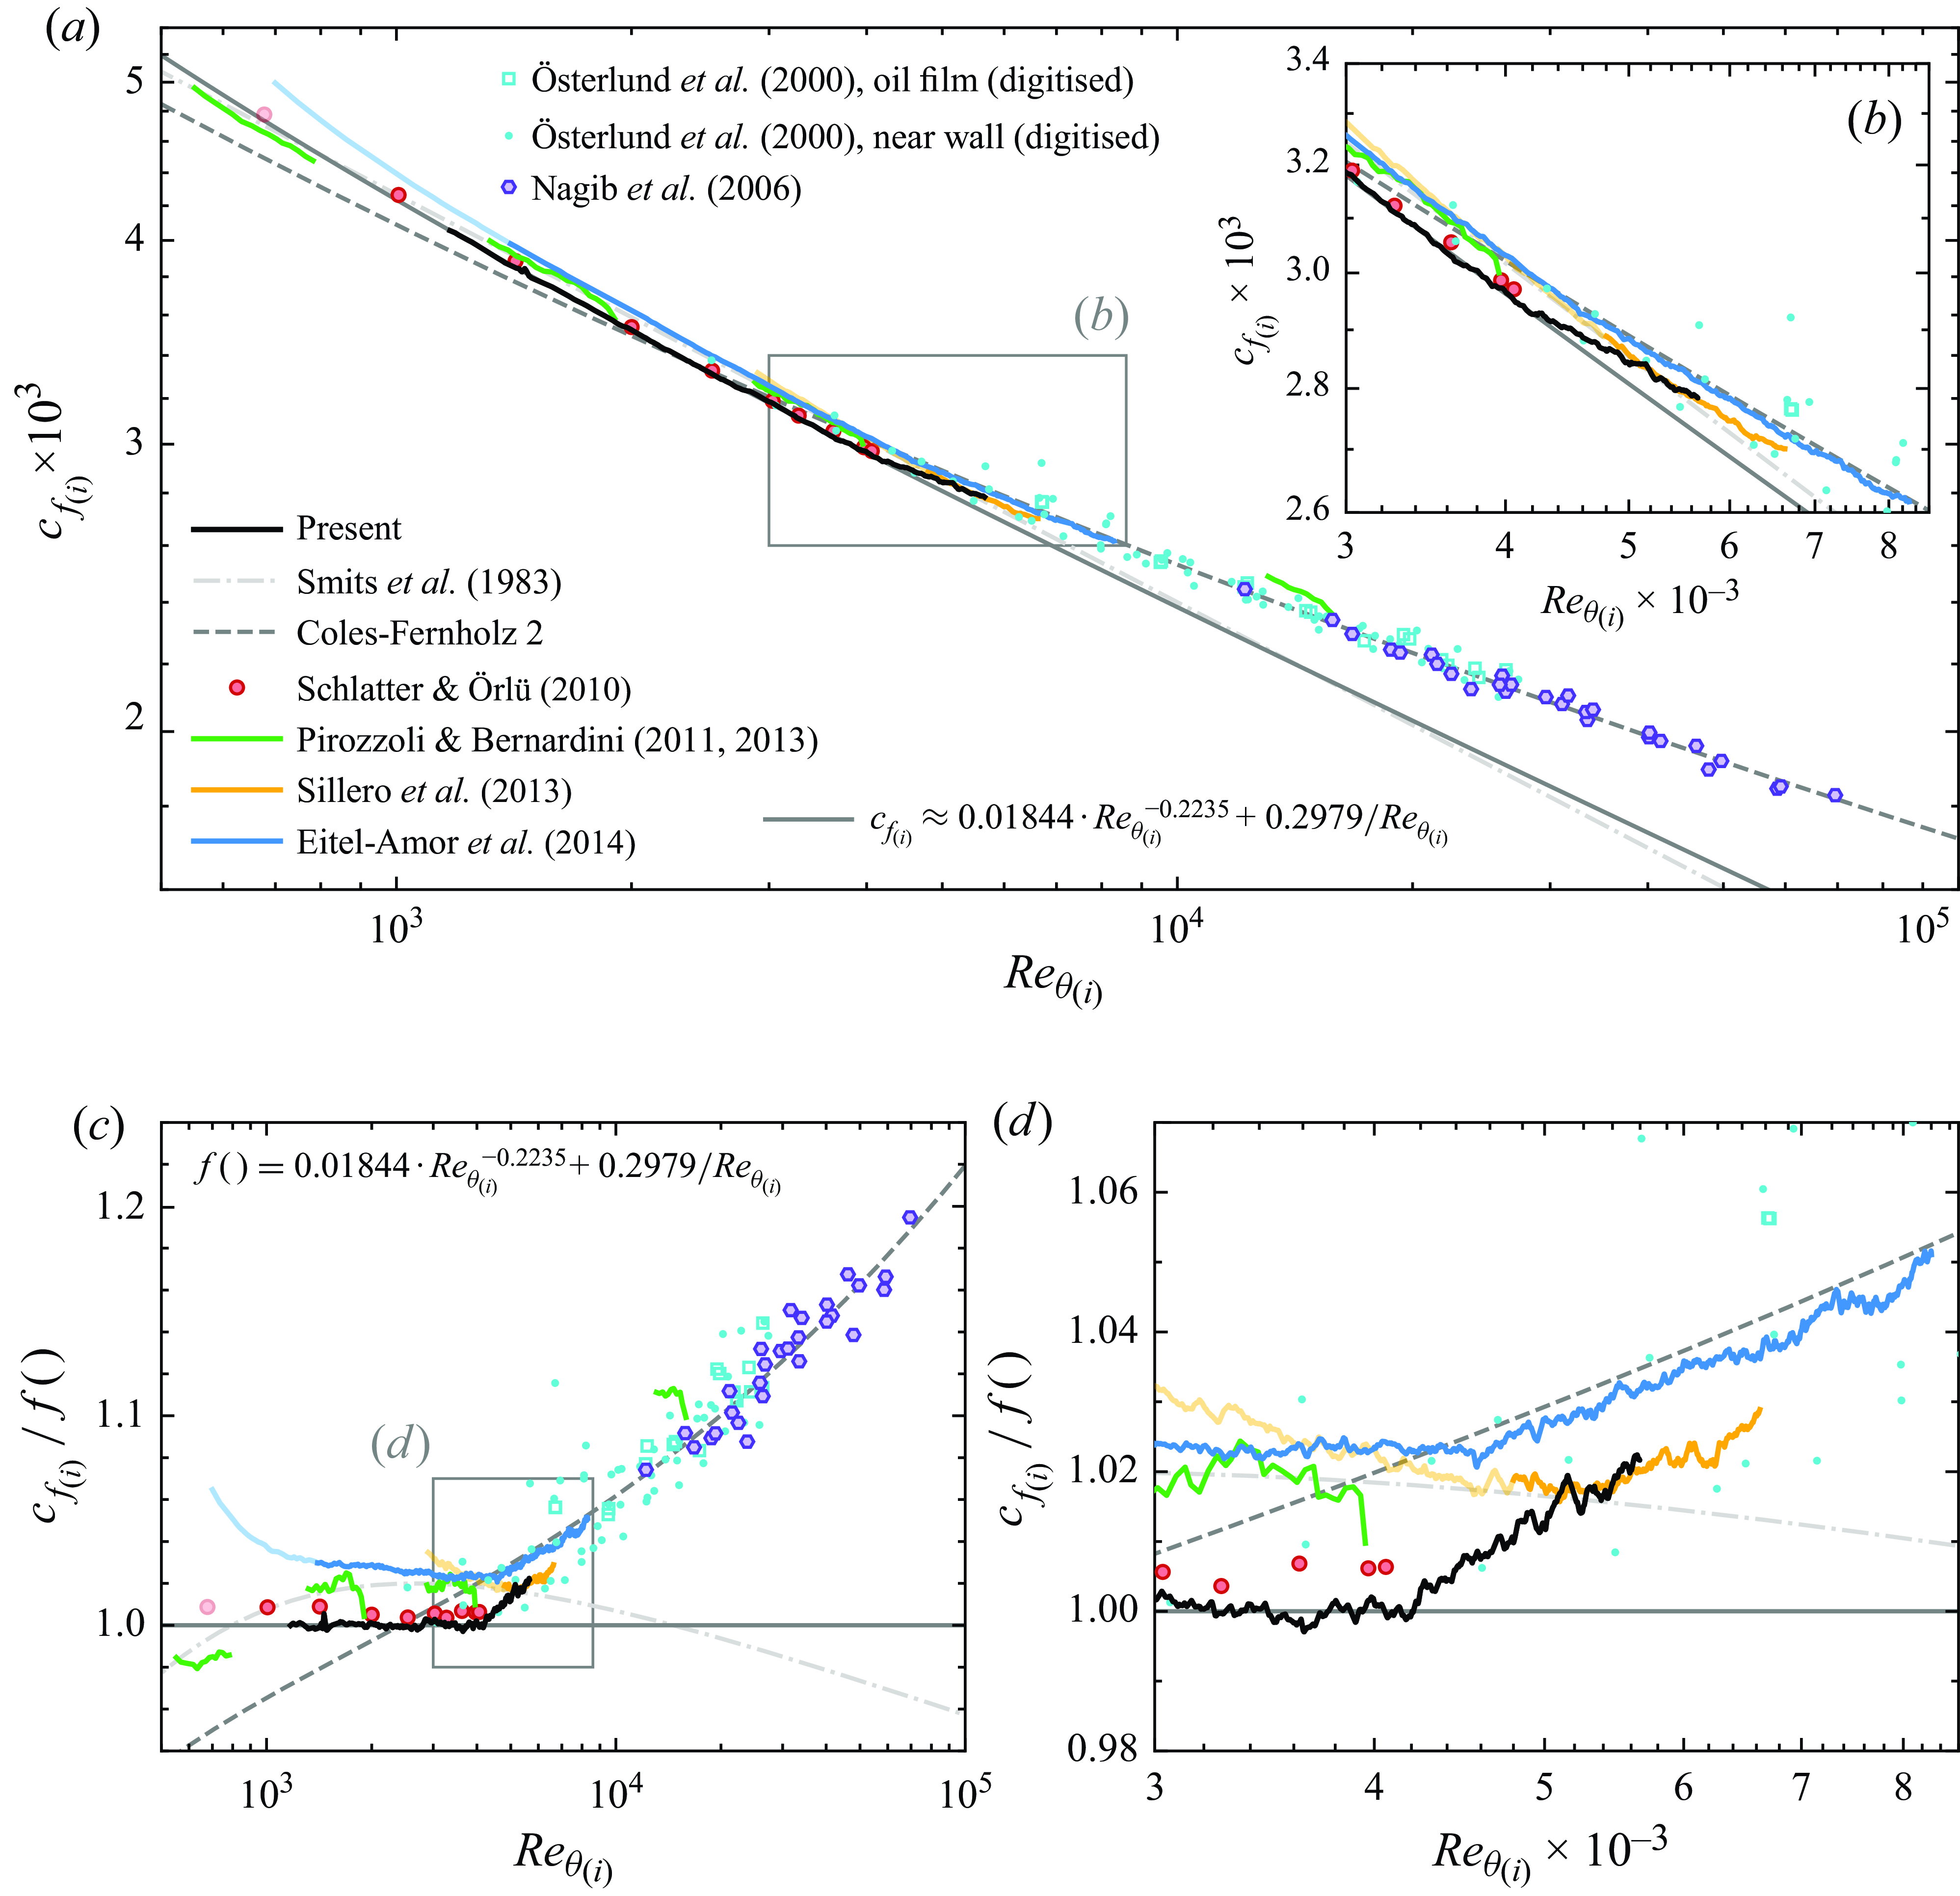
As was previously shown in a variety of studies, e.g. Schlatter & Örlü (Reference Schlatter and Örlü2010), the low- $Re$
numerical data align generally well with the low-
$Re$
numerical data align generally well with the low- $Re$
power-law behaviour in panels (
$Re$
power-law behaviour in panels ( $a$
) and (
$a$
) and ( $b$
), if inlet development regions with more rapidly decreasing
$b$
), if inlet development regions with more rapidly decreasing $c_f$
are ignored. For
$c_f$
are ignored. For $Re_\theta \gtrapprox 5000$
, both existing numerical and experimental data clearly confirm the high-
$Re_\theta \gtrapprox 5000$
, both existing numerical and experimental data clearly confirm the high- $Re$
correlation. As indicated by the present newly computed data, represented by the solid black line, the changeover from the low- to the high-
$Re$
correlation. As indicated by the present newly computed data, represented by the solid black line, the changeover from the low- to the high- $Re$
regime occurs rather abruptly, at least in logarithmic representation. A ‘bend’ is distinctly visible in the
$Re$
regime occurs rather abruptly, at least in logarithmic representation. A ‘bend’ is distinctly visible in the $c_f$
distribution, especially in the zoomed-in representation of panel (
$c_f$
distribution, especially in the zoomed-in representation of panel ( $b$
). To more closely investigate the abrupt bend in
$b$
). To more closely investigate the abrupt bend in $c_f$
, panels (c,d) normalise all data of (
$c_f$
, panels (c,d) normalise all data of ( $a$
) by the fitted low-
$a$
) by the fitted low- $Re$
correlation. The DNS data of Schlatter & Örlü (Reference Schlatter and Örlü2010) terminate precisely at
$Re$
correlation. The DNS data of Schlatter & Örlü (Reference Schlatter and Örlü2010) terminate precisely at $Re_\theta$
where the bend occurs, however, agreement with the newly generated data up to that point supports the plausibility of a sharp bend. Sillero et al. (Reference Sillero, Jiménez and Moser2013) report confidence in their data for
$Re_\theta$
where the bend occurs, however, agreement with the newly generated data up to that point supports the plausibility of a sharp bend. Sillero et al. (Reference Sillero, Jiménez and Moser2013) report confidence in their data for $Re_\theta \gtrapprox 4800$
, precisely the region where their data overlap with the present data. Perhaps the most important evidence for the sharpness of the low-to-moderate
$Re_\theta \gtrapprox 4800$
, precisely the region where their data overlap with the present data. Perhaps the most important evidence for the sharpness of the low-to-moderate $Re$
cross-over comes from LES data of Eitel-Amor et al. (Reference Eitel-Amor, Örlü and Schlatter2014), which are reported to be independent of initial conditions by
$Re$
cross-over comes from LES data of Eitel-Amor et al. (Reference Eitel-Amor, Örlü and Schlatter2014), which are reported to be independent of initial conditions by $Re_\theta \approx 1500$
, but are subject to the uncertainty of a slightly under-resolving numerical grid. Analogous to the present simulation, these data show a notably sharp bend at a comparable
$Re_\theta \approx 1500$
, but are subject to the uncertainty of a slightly under-resolving numerical grid. Analogous to the present simulation, these data show a notably sharp bend at a comparable $Re_{\theta }$
, although showing a consistent
$Re_{\theta }$
, although showing a consistent ${\sim }2\,\%$
offset with respect to the fully resolved incompressible DNS of Schlatter & Örlü (Reference Schlatter and Örlü2010).
${\sim }2\,\%$
offset with respect to the fully resolved incompressible DNS of Schlatter & Örlü (Reference Schlatter and Örlü2010).
3.3. Outer layer
As been shown in a variety of different studies, e.g. Fernholz & Finley (Reference Fernholz and Finley1980) and Nagib & Chauhan (Reference Nagib and Chauhan2008); Smits (Reference Smits2024), the turbulent wake appears to develop to a visually $Re$
-independent state at a possible value of approximately
$Re$
-independent state at a possible value of approximately $4000\lessapprox Re_\theta \lessapprox 5000$
, which coincides remarkably well with the
$4000\lessapprox Re_\theta \lessapprox 5000$
, which coincides remarkably well with the $Re$
of the present data at which
$Re$
of the present data at which $c_f$
shows a distinct bend. It is explicitly noted, however, that these trends are subject to significant scatter, see e.g. Smits (Reference Smits2024), thus, existing boundary-layer data at large
$c_f$
shows a distinct bend. It is explicitly noted, however, that these trends are subject to significant scatter, see e.g. Smits (Reference Smits2024), thus, existing boundary-layer data at large $Re$
indicate this supposed
$Re$
indicate this supposed $Re$
-independence is not firmly established. The present section evaluates the wake development as well as its relation to the Reynolds-number range where
$Re$
-independence is not firmly established. The present section evaluates the wake development as well as its relation to the Reynolds-number range where $c_f$
has been shown to diverge from typical low-
$c_f$
has been shown to diverge from typical low- $Re$
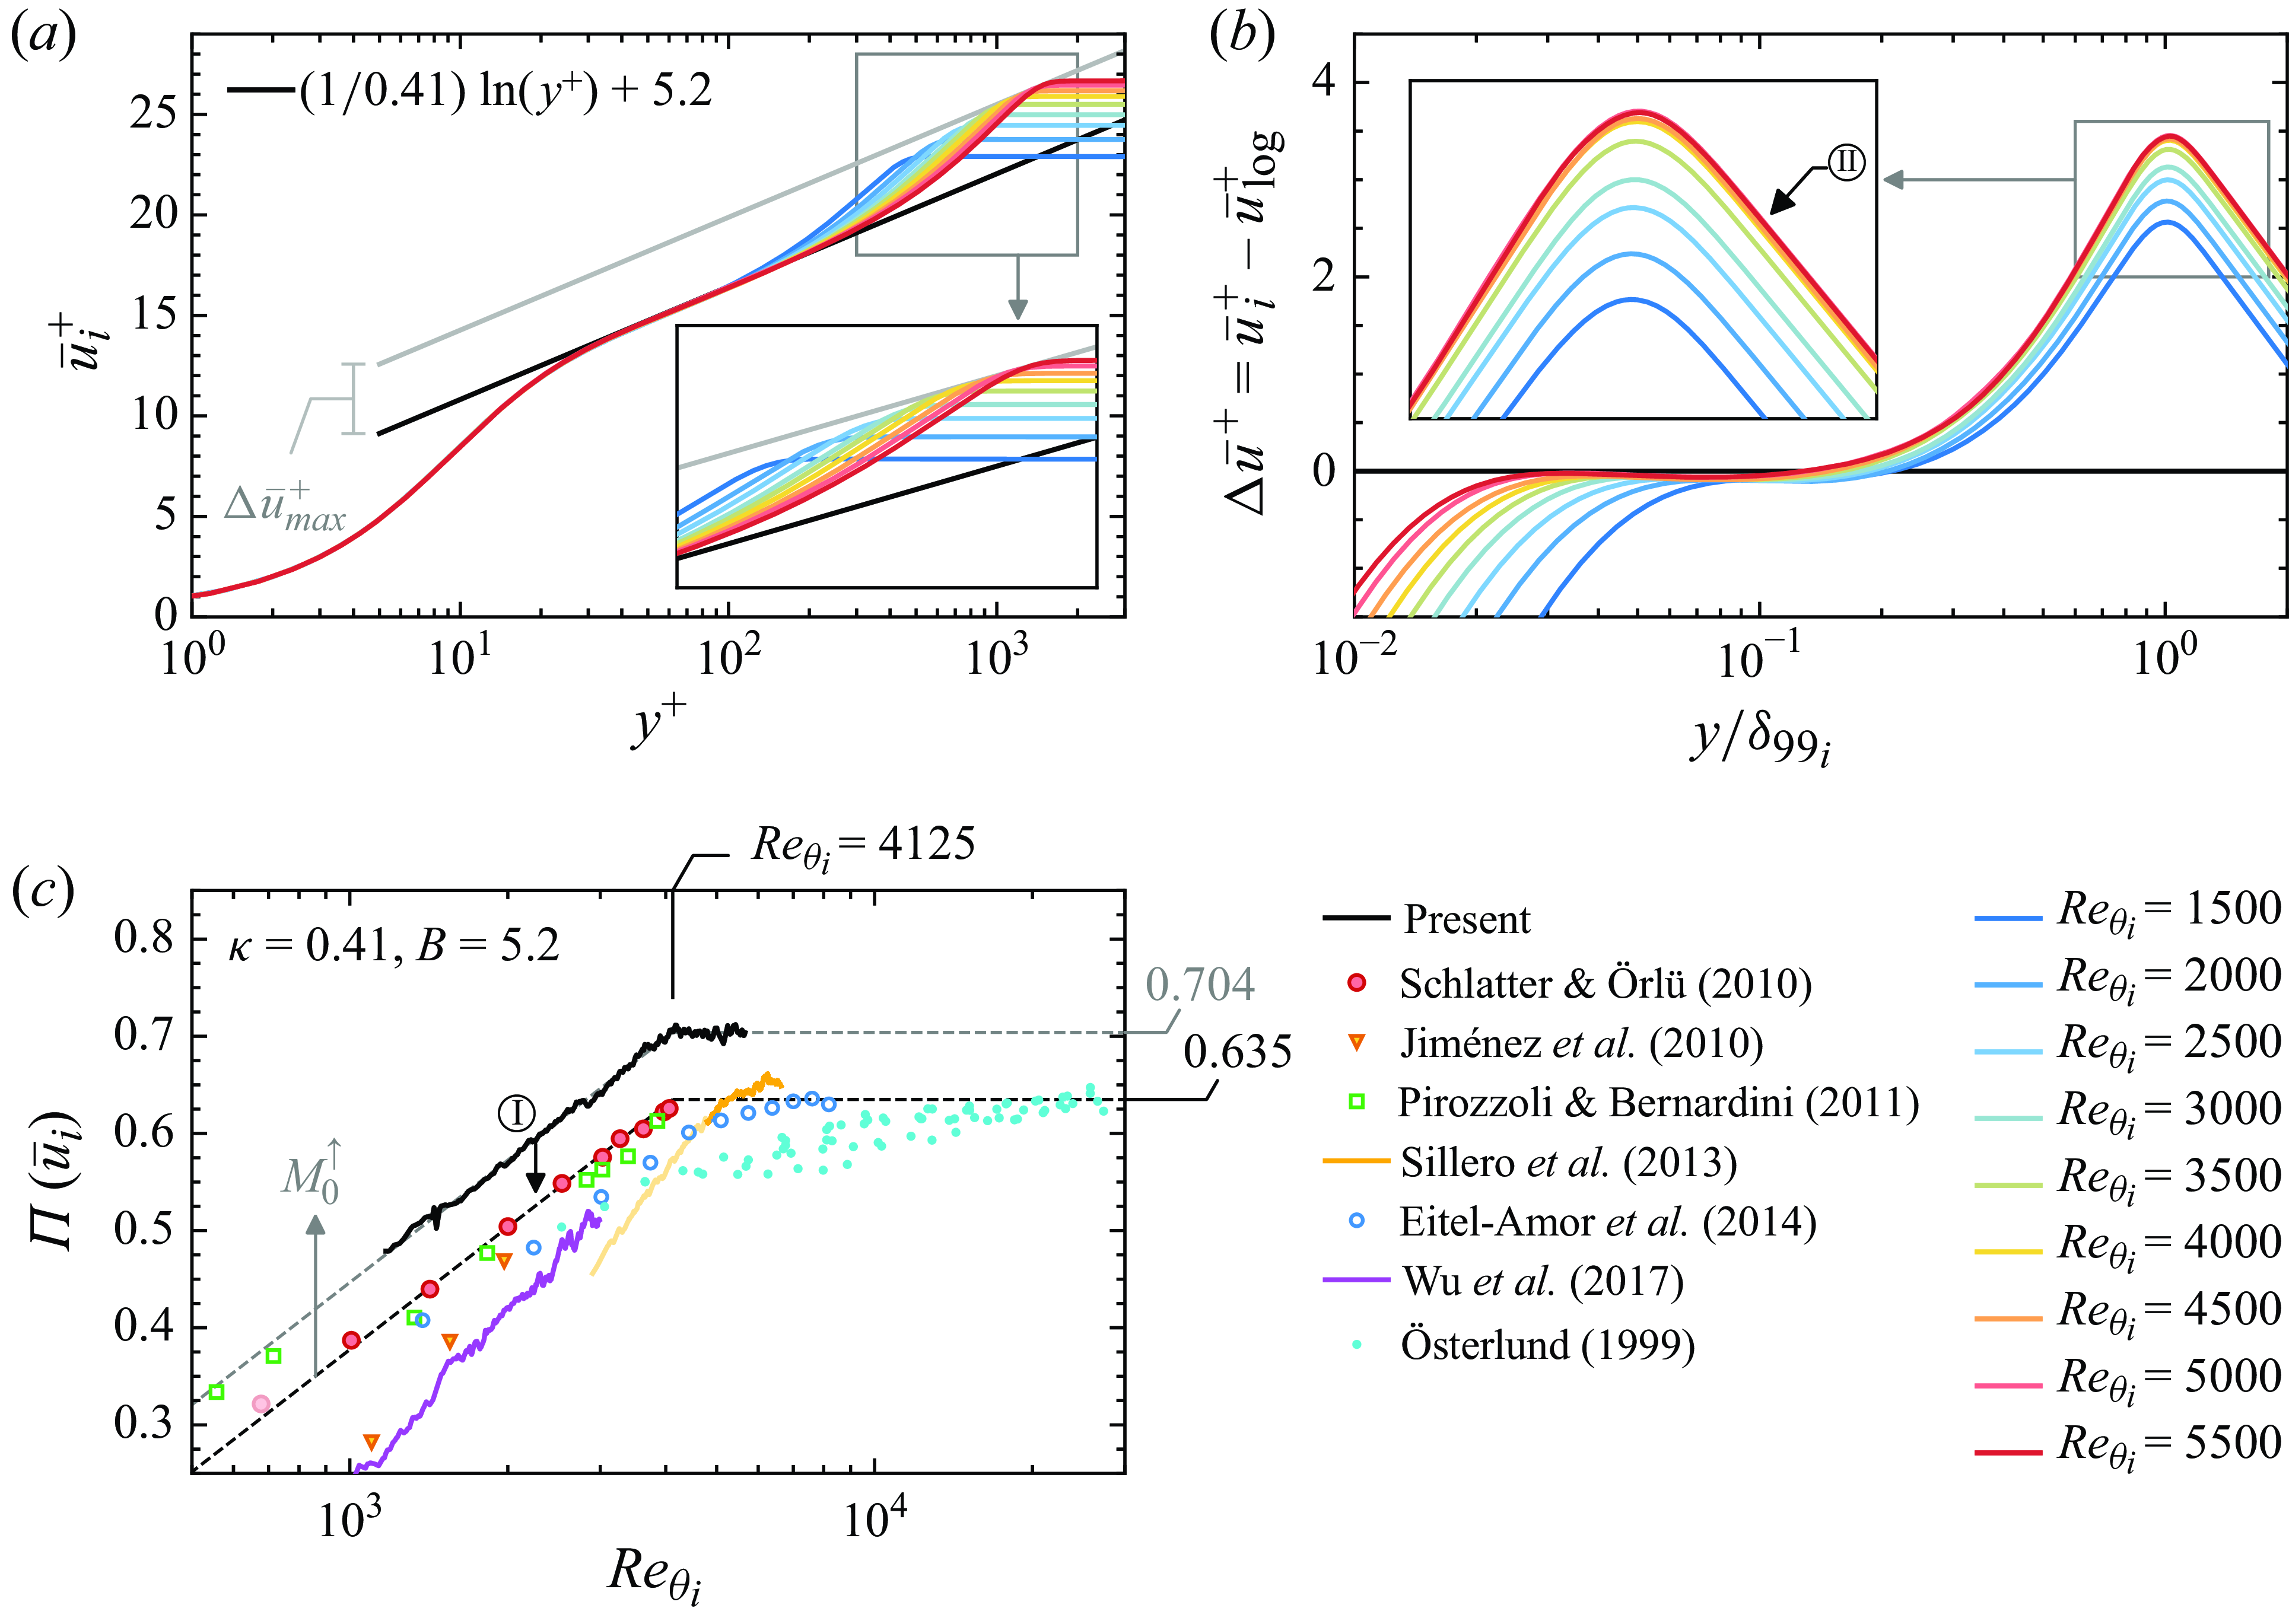
correlations. To this end, figure 3(a,b) shows the streamwise velocity
$Re$
correlations. To this end, figure 3(a,b) shows the streamwise velocity $\bar {u}_i$
profiles at several equally spaced
$\bar {u}_i$
profiles at several equally spaced $Re_{\theta _i}$
stations in inner and outer scaling, where
$Re_{\theta _i}$
stations in inner and outer scaling, where $\bar {u}_i$
is the incompressible-transformed mean streamwise velocity according to van Driest (Reference van Driest1951)
$\bar {u}_i$
is the incompressible-transformed mean streamwise velocity according to van Driest (Reference van Driest1951)
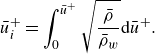 \begin{equation} \bar {u}_i^+ = \int _0^{\bar {u}^+}{ \sqrt {\frac {\bar {\rho }}{\bar {\rho }_w}} } {\rm d} \bar {u}^+ . \end{equation}
The wake strength is defined as the local deviation from an assumed ‘standard’ logarithmic law
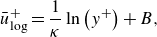 \begin{equation} \bar {u}_{\rm log}^+ = \frac {1}{\kappa } \ln \left ( y^{+} \right ) + B, \end{equation}
with $\kappa = 0.41,B = 5.2$
. As indicated in figure 3(a,b), the wake strength
$\kappa = 0.41,B = 5.2$
. As indicated in figure 3(a,b), the wake strength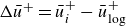 $\Delta \bar {u}^+ = \bar {u}_i^+ - \bar {u}_{\log}^+$
saturates for
$\Delta \bar {u}^+ = \bar {u}_i^+ - \bar {u}_{\log}^+$
saturates for $Re_{\theta } \gtrapprox 4100$
. The collapse, annotated by
$Re_{\theta } \gtrapprox 4100$
. The collapse, annotated by $\bigcirc\kern-8pt\small\textrm{II}$
, is particularly visible in panel (
$\bigcirc\kern-8pt\small\textrm{II}$
, is particularly visible in panel ( $b$
). We note that use of the van Driest transformation increases the velocity profile in the wake region with respect to incompressible data, therefore the wake strength to increases by a Mach-number-dependent, but Reynolds-number-independent offset (Wenzel et al. Reference Wenzel, Selent, Kloker and Rist2018). Thus, conclusions obtained for the present supersonic case reliably transfer to the incompressible regime although the absolute value of the wake strength is increased; implications will be detailed where appropriate. Furthermore, it is emphasised that the tight collapse of the data in the range
$b$
). We note that use of the van Driest transformation increases the velocity profile in the wake region with respect to incompressible data, therefore the wake strength to increases by a Mach-number-dependent, but Reynolds-number-independent offset (Wenzel et al. Reference Wenzel, Selent, Kloker and Rist2018). Thus, conclusions obtained for the present supersonic case reliably transfer to the incompressible regime although the absolute value of the wake strength is increased; implications will be detailed where appropriate. Furthermore, it is emphasised that the tight collapse of the data in the range $4100 \lessapprox Re_{\theta _i} \lessapprox 5660$
spans a respectable
$4100 \lessapprox Re_{\theta _i} \lessapprox 5660$
spans a respectable $Re$
range of
$Re$
range of $\Delta Re_{\theta _i} \gtrapprox 1500$
and thus extends notably into the moderate-
$\Delta Re_{\theta _i} \gtrapprox 1500$
and thus extends notably into the moderate- $Re$
regime. As depicted in figure 3(
$Re$
regime. As depicted in figure 3( $c$
), the
$c$
), the $Re$
dependence of this saturating trend is often quantified by the wake parameter
$Re$
dependence of this saturating trend is often quantified by the wake parameter $\Pi$
, which is defined as (Coles Reference Coles1956)
$\Pi$
, which is defined as (Coles Reference Coles1956)
 \begin{equation} \Pi = \frac {\kappa }{2} \left ( \bar {u}_{99}^+ - \frac {1}{\kappa } \ln {\left (\delta _{99}^+\right )} - B \right ) , \end{equation}
hence proportional to the wake strength at $y=\delta _{99}$
. For all data considered, the same
$y=\delta _{99}$
. For all data considered, the same $\kappa = 0.41, B = 5.2$
are utilised, which generally shifts high-
$\kappa = 0.41, B = 5.2$
are utilised, which generally shifts high- $Re$
data points to an artificially high
$Re$
data points to an artificially high $\Pi$
compared with if
$\Pi$
compared with if $\kappa ,B,\Pi$
were fit simultaneously; the assimilated data from Österlund (Reference Österlund1999) are most significantly affected by this simplification. It is further noted that some of the scatter observed regarding the wake may likely be associated with the fact that all of the constants in the profile equation are slowly settling into asymptotic values. Furthermore, as addressed in the
$\kappa ,B,\Pi$
were fit simultaneously; the assimilated data from Österlund (Reference Österlund1999) are most significantly affected by this simplification. It is further noted that some of the scatter observed regarding the wake may likely be associated with the fact that all of the constants in the profile equation are slowly settling into asymptotic values. Furthermore, as addressed in the $c_f$
discussion, the definition of
$c_f$
discussion, the definition of $Re_{\theta _i}$
renders the occurrence of the
$Re_{\theta _i}$
renders the occurrence of the $c_f$
bend notably independent of the Mach number. Thus, differences in panel (
$c_f$
bend notably independent of the Mach number. Thus, differences in panel ( $c$
) between transformed and incompressible data are only on the ordinate, where transformed compressible data maintain a higher value of
$c$
) between transformed and incompressible data are only on the ordinate, where transformed compressible data maintain a higher value of $\Pi$
as a consequence of the van Driest transformation. For the present transformed data,
$\Pi$
as a consequence of the van Driest transformation. For the present transformed data, $\Pi$
increases
$\Pi$
increases ${\propto }\ln (Re_{\theta _i})$
for
${\propto }\ln (Re_{\theta _i})$
for $Re_{\theta _i} \lessapprox 4100$
after which it abruptly saturates and stays approximately constant. Note, however, that some caution is warranted about the generalisation of this collapse at higher
$Re_{\theta _i} \lessapprox 4100$
after which it abruptly saturates and stays approximately constant. Note, however, that some caution is warranted about the generalisation of this collapse at higher $Re$
, seeing that most boundary-layer properties evolve logarithmically over decades of
$Re$
, seeing that most boundary-layer properties evolve logarithmically over decades of $Re$
. Naturally, this change in slope occurs at the same
$Re$
. Naturally, this change in slope occurs at the same $Re_{\theta _i}$
as the
$Re_{\theta _i}$
as the $c_f$
bend, which supports the notion that wake convergence – or more specifically the completion of the relative lift of the wake out of the inner layer – is likely the driver for the change in the
$c_f$
bend, which supports the notion that wake convergence – or more specifically the completion of the relative lift of the wake out of the inner layer – is likely the driver for the change in the $c_f$
slope. However, the observed abruptly saturating progression of
$c_f$
slope. However, the observed abruptly saturating progression of $\Pi$
seems unfamiliar, as all empirical trend lines known by the authors to date have been formulated by assimilating scattered data to an assumed smooth function (Coles Reference Coles1962, Reference Coles1987; Cebeci & Smith Reference Cebeci and Smith1974; Chauhan et al. Reference Chauhan, Monkewitz and Nagib2009). Interestingly, partial evidence supporting abrupt wake-convergence behaviour can be gathered from existing data. The dataset of Schlatter & Örlü (Reference Schlatter and Örlü2010), for instance, which ends slightly before the expected
$\Pi$
seems unfamiliar, as all empirical trend lines known by the authors to date have been formulated by assimilating scattered data to an assumed smooth function (Coles Reference Coles1962, Reference Coles1987; Cebeci & Smith Reference Cebeci and Smith1974; Chauhan et al. Reference Chauhan, Monkewitz and Nagib2009). Interestingly, partial evidence supporting abrupt wake-convergence behaviour can be gathered from existing data. The dataset of Schlatter & Örlü (Reference Schlatter and Örlü2010), for instance, which ends slightly before the expected $Re$
of the bend feature, follows a semi-logarithmic trend up to
$Re$
of the bend feature, follows a semi-logarithmic trend up to $Re_{\theta } \lessapprox 4100$
, without displaying any tendency towards smoothly rounding. Data from Sillero et al. (Reference Sillero, Jiménez and Moser2013) are estimated to have an inlet-independent wake – thus high confidence in
$Re_{\theta } \lessapprox 4100$
, without displaying any tendency towards smoothly rounding. Data from Sillero et al. (Reference Sillero, Jiménez and Moser2013) are estimated to have an inlet-independent wake – thus high confidence in $\Pi$
– only for
$\Pi$
– only for $Re_\theta \gtrapprox 4800$
, beyond which approximate wake saturation is seen. Thus, if the systematic shift in
$Re_\theta \gtrapprox 4800$
, beyond which approximate wake saturation is seen. Thus, if the systematic shift in $\Pi$
for the present transformed data is manually compensated for (grey offset curve in panel (
$\Pi$
for the present transformed data is manually compensated for (grey offset curve in panel ( $c$
) indicated by
$c$
) indicated by $\bigcirc\kern-7pt\small\textrm{I}$
), it can be interpreted as a plausible bridge between both datasets, approximated by
$\bigcirc\kern-7pt\small\textrm{I}$
), it can be interpreted as a plausible bridge between both datasets, approximated by
 \begin{equation} \Pi (Re_{\theta }) \approx \begin{cases} \begin{array}{cc} -0.8769 + 0.1816\, \ln (Re_\theta ) & \text{for } Re_{\theta } \lessapprox 4125\\[5pt] -0.8769 + 0.1816\, \ln (4125) \approx 0.635 & \text{for } Re_{\theta } \gtrapprox 4125 \end{array}\end{cases}\kern-15pt, \end{equation}
indicated by the black dotted line in figure 3( $c$
). The LES data of Eitel-Amor et al. (Reference Eitel-Amor, Örlü and Schlatter2014) are slightly lower compared with the trend curve (corresponding to the higher
$c$
). The LES data of Eitel-Amor et al. (Reference Eitel-Amor, Örlü and Schlatter2014) are slightly lower compared with the trend curve (corresponding to the higher $c_f$
) but converge towards a consistent
$c_f$
) but converge towards a consistent $\Pi$
value at higher
$\Pi$
value at higher $Re$
where the effective viscous grid resolution successively increases.
$Re$
where the effective viscous grid resolution successively increases.
Mean-velocity profiles and wake parameter. The black dotted line in panel ( $c$
) indicates the fit given in (3.8).
$c$
) indicates the fit given in (3.8).
3.4. Remark
The previous discussion has confirmed the utility of $\Pi$
as an indicator of the outer-layer similarity, which can be visually observed in figure 3(a,b). However, the somewhat ‘artificial’ nature of
$\Pi$
as an indicator of the outer-layer similarity, which can be visually observed in figure 3(a,b). However, the somewhat ‘artificial’ nature of $\Pi$
as pointed out in Chauhan et al. (Reference Chauhan, Monkewitz and Nagib2009), motivates a further remark. One difficulty (among others) relating to the accurate evaluation of
$\Pi$
as pointed out in Chauhan et al. (Reference Chauhan, Monkewitz and Nagib2009), motivates a further remark. One difficulty (among others) relating to the accurate evaluation of $\Pi$
is its dependence on the log-law constant
$\Pi$
is its dependence on the log-law constant $\kappa$
and offset
$\kappa$
and offset $B$
, which cannot be assumed constant in the lower-
$B$
, which cannot be assumed constant in the lower- $Re$
regime, as scale separation is not sufficient to cultivate a true, unambiguous logarithmic region. At low
$Re$
regime, as scale separation is not sufficient to cultivate a true, unambiguous logarithmic region. At low $Re$
,
$Re$
, $\kappa ,B$
must be approximated either by assumption or through fitting the mean profile, neither of which is robust, which itself can lead to scatter among the data. Thus, to support the above discussions, a related metric, as discussed in e.g. Nagib et al. (Reference Nagib, Chauhan and Monkewitz2007) and Sanmiguel Vila et al. (Reference Sanmiguel Vila, Vinuesa, Discetti, Ianiro, Schlatter and Örlü2017), is depicted in figure 6 of Appendix B, showing the streamwise evolution of the Rotta–Clauser length scale
$\kappa ,B$
must be approximated either by assumption or through fitting the mean profile, neither of which is robust, which itself can lead to scatter among the data. Thus, to support the above discussions, a related metric, as discussed in e.g. Nagib et al. (Reference Nagib, Chauhan and Monkewitz2007) and Sanmiguel Vila et al. (Reference Sanmiguel Vila, Vinuesa, Discetti, Ianiro, Schlatter and Örlü2017), is depicted in figure 6 of Appendix B, showing the streamwise evolution of the Rotta–Clauser length scale $\varDelta =\int _0^\infty (\bar {u}_e^+ - \bar {u}^+) \textrm{d}y$
in relation to
$\varDelta =\int _0^\infty (\bar {u}_e^+ - \bar {u}^+) \textrm{d}y$
in relation to $\delta _{99}$
. According to classical theory, this wake metric is assumed to become approximately constant as a well-developed outer layer becomes self-similar (like
$\delta _{99}$
. According to classical theory, this wake metric is assumed to become approximately constant as a well-developed outer layer becomes self-similar (like $\Pi$
), however, with the benefit of being independent of the pre-supposed existence of a logarithmic layer. Evaluation of
$\Pi$
), however, with the benefit of being independent of the pre-supposed existence of a logarithmic layer. Evaluation of $\varDelta /\delta _{99}$
in figure 6 shows the same qualitative trend as
$\varDelta /\delta _{99}$
in figure 6 shows the same qualitative trend as $\Pi$
in figure 3(
$\Pi$
in figure 3( $c$
), including sudden saturation at a plateau value. Thus, the resemblance between both metrics strongly supports the discussion above. Additionally, the streamwise development of the wake has been evaluated in Appendix C within the framework of the physically consistent profile form suggested in Monkewitz, Chauhan & Nagib (Reference Monkewitz, Chauhan and Nagib2007). As with
$c$
), including sudden saturation at a plateau value. Thus, the resemblance between both metrics strongly supports the discussion above. Additionally, the streamwise development of the wake has been evaluated in Appendix C within the framework of the physically consistent profile form suggested in Monkewitz, Chauhan & Nagib (Reference Monkewitz, Chauhan and Nagib2007). As with $\varDelta /\delta _{99}$
, the general observation regarding the onset of outer-layer velocity profile self-similarity is qualitatively consistent.
$\varDelta /\delta _{99}$
, the general observation regarding the onset of outer-layer velocity profile self-similarity is qualitatively consistent.
3.5. Logarithmic overlap region
The previous sections have demonstrated the high sensitivity of the mean-velocity profile to largely unavoidable uncertainties at the inlet boundary, which could potentially obscure fine features of the streamwise evolution of e.g. $c_f$
or the wake strength if sufficient relaxation length is not provided. Following these considerations, attention is turned to the region between the buffer layer and the wake region and how it behaves in conjunction with the wake saturation. For convenience, such will be referred to as the logarithmic overlap layer (‘log layer’), although clearly no significant region of precise logarithmic proportionality yet exists at this
$c_f$
or the wake strength if sufficient relaxation length is not provided. Following these considerations, attention is turned to the region between the buffer layer and the wake region and how it behaves in conjunction with the wake saturation. For convenience, such will be referred to as the logarithmic overlap layer (‘log layer’), although clearly no significant region of precise logarithmic proportionality yet exists at this $Re$
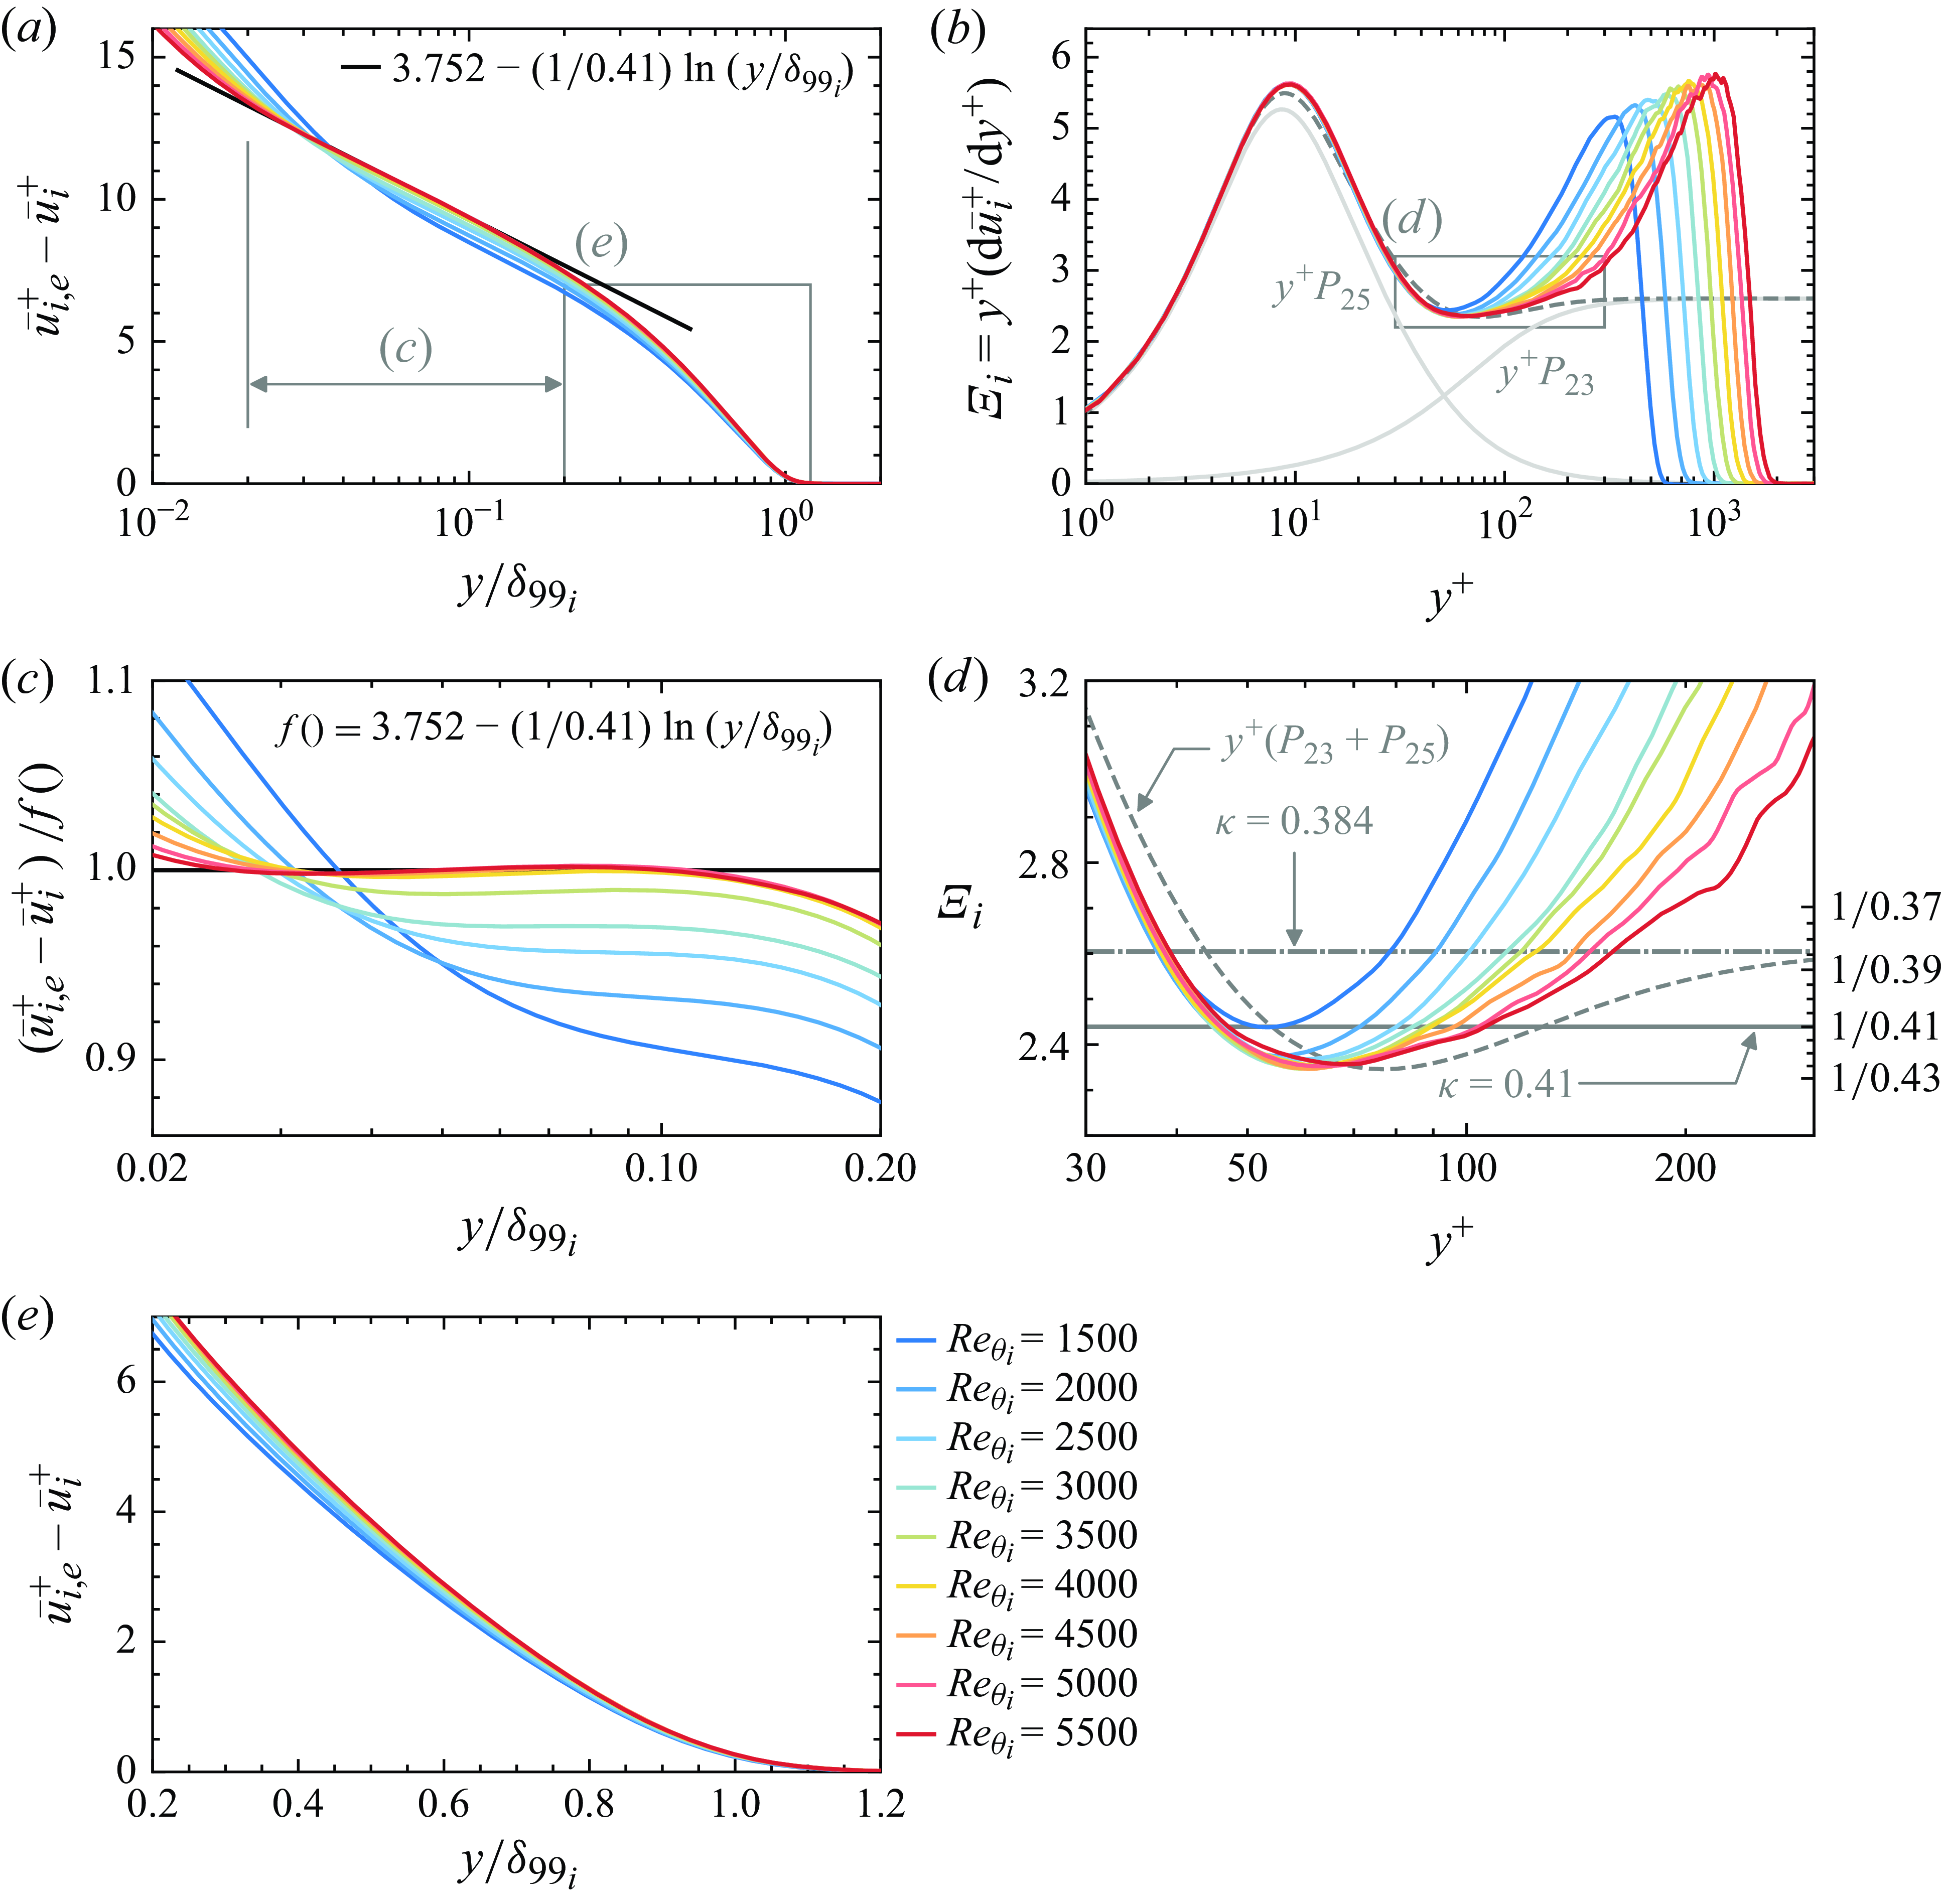
. To this end, the velocity-defect profile
$Re$
. To this end, the velocity-defect profile $\bar {u}_{i,e}^+ - \bar {u}_i^+ \approx f(y/\delta )$
is illustrated in figure 4(a,c,e) for several
$\bar {u}_{i,e}^+ - \bar {u}_i^+ \approx f(y/\delta )$
is illustrated in figure 4(a,c,e) for several $Re_{\theta _i}$
, where panel
$Re_{\theta _i}$
, where panel $(c)$
is simply a normalisation of panel (
$(c)$
is simply a normalisation of panel ( $a$
) by
$a$
) by $f() = 3.752 - 0.41^{-1} \ln (y/\delta )$
for magnification purposes; the constant is fitted after constraining
$f() = 3.752 - 0.41^{-1} \ln (y/\delta )$
for magnification purposes; the constant is fitted after constraining $\kappa = 0.41$
. For reference, panel
$\kappa = 0.41$
. For reference, panel $(e)$
focuses once again on the wake region to link the discussion of log layer with the aforementioned lifting process of the wake, where it is clear that, for
$(e)$
focuses once again on the wake region to link the discussion of log layer with the aforementioned lifting process of the wake, where it is clear that, for $Re_{\theta _i} \gtrapprox 4000$
, the wake defect profile is highly self-similar with respect to
$Re_{\theta _i} \gtrapprox 4000$
, the wake defect profile is highly self-similar with respect to $\delta _{{99}_i}$
. The indicator function
$\delta _{{99}_i}$
. The indicator function $\Xi _i = y^+ (d \bar {u}_i^+ / d y^+)$
is shown in figure 4(b,d) along with incompressible reference functions from Monkewitz et al. (Reference Monkewitz, Chauhan and Nagib2007); panel (
$\Xi _i = y^+ (d \bar {u}_i^+ / d y^+)$
is shown in figure 4(b,d) along with incompressible reference functions from Monkewitz et al. (Reference Monkewitz, Chauhan and Nagib2007); panel ( $d$
) is a zoom of panel (
$d$
) is a zoom of panel ( $b$
).
$b$
).
Mean velocity-defect profiles (a,c,d) and diagnostic function (b,d). For reference, the Padé approximant functions of Monkewitz et al. (Reference Monkewitz, Chauhan and Nagib2007) are plotted with their original parameter values.
Visualisation of the instantaneous flow. Panel ( $a$
) is a side view of the full domain geometry. Panels (b,c) show the magnitude of the density gradient. Panels (d,e) show mean-removed shear stress
$a$
) is a side view of the full domain geometry. Panels (b,c) show the magnitude of the density gradient. Panels (d,e) show mean-removed shear stress $\tau _{uy}^\prime$
at the wall. Panels (f,g) show isosurfaces of
$\tau _{uy}^\prime$
at the wall. Panels (f,g) show isosurfaces of $\lambda _2$
criterion coloured by mean-removed streamwise velocity
$\lambda _2$
criterion coloured by mean-removed streamwise velocity $u^\prime$
. All plots are provided at two different
$u^\prime$
. All plots are provided at two different $Re$
, namely upstream (left) and downstream (right) of the point of wake saturation.
$Re$
, namely upstream (left) and downstream (right) of the point of wake saturation.
Most prominently, both panels ( $a$
) and (
$a$
) and ( $c$
) illustrate the development of the defect profile log layer (blue shades) followed by a rather abrupt arrival upon a visually identical slope/offset for
$c$
) illustrate the development of the defect profile log layer (blue shades) followed by a rather abrupt arrival upon a visually identical slope/offset for $Re_{\theta _i} \gtrapprox 4000$
(white and red shades). Such convergence becomes more visually apparent through examination of
$Re_{\theta _i} \gtrapprox 4000$
(white and red shades). Such convergence becomes more visually apparent through examination of $\Xi _i$
in panels (b,d). Here, a solidification of a local minimum occurs around
$\Xi _i$
in panels (b,d). Here, a solidification of a local minimum occurs around $y^+ \approx 70$
for the same
$y^+ \approx 70$
for the same $Re_{\theta _i}$
at which: (i) the bend in
$Re_{\theta _i}$
at which: (i) the bend in $c_f$
occurs, (ii)
$c_f$
occurs, (ii) $\Pi$
becomes
$\Pi$
becomes $Re$
-independent and (iii) the velocity-defect log-layer slope and offset become
$Re$
-independent and (iii) the velocity-defect log-layer slope and offset become $Re$
-independent. Therefore, present data clearly support that the point of wake convergence at
$Re$
-independent. Therefore, present data clearly support that the point of wake convergence at $Re_{\theta _i} \approx 4100$
also marks a state at which a unique characteristic feature in the development of the precursor to the log layer emerges, namely a local minimum in
$Re_{\theta _i} \approx 4100$
also marks a state at which a unique characteristic feature in the development of the precursor to the log layer emerges, namely a local minimum in $\Xi _i$
at roughly
$\Xi _i$
at roughly $y^+\approx 70$
. Note that this conclusion is in line with the LES study by Eitel-Amor et al. (Reference Eitel-Amor, Örlü and Schlatter2014), where comparable trends have been shown. Further increase in
$y^+\approx 70$
. Note that this conclusion is in line with the LES study by Eitel-Amor et al. (Reference Eitel-Amor, Örlü and Schlatter2014), where comparable trends have been shown. Further increase in $Re$
would see the
$Re$
would see the $\Xi _i$
curve envelope continually approach a characteristic similar to the
$\Xi _i$
curve envelope continually approach a characteristic similar to the $y^+ (P_{23}+P_{25})$
curve, eventually flattening out at
$y^+ (P_{23}+P_{25})$
curve, eventually flattening out at $\kappa \approx 0.384$
for
$\kappa \approx 0.384$
for $y^+ \gtrapprox 300$
in the high-
$y^+ \gtrapprox 300$
in the high- $Re$
regime for incompressible flows. It is worth noting, however, that recent studies such as Hoyas et al. (Reference Hoyas, Vinuesa, Schmid and Nagib2024) and Monkewitz (Reference Monkewitz2024), focusing on channel and pipe flows, have indicated that the indicator function exhibits a slight sensitivity to grid spacing and distribution. This sensitivity, combined with the influence of time averaging, suggests that a more precise discussion of the scaling properties of the overlap layer may not be meaningful at this stage. Nevertheless, the overall trends are largely consistent with the trends suggested by the (incompressible) composite model of Monkewitz et al. (Reference Monkewitz, Chauhan and Nagib2007), with the implications being threefold: first, the transformed compressible and incompressible trends are highly comparable, again adding confidence to previous conclusions. Second, the bend in
$Re$
regime for incompressible flows. It is worth noting, however, that recent studies such as Hoyas et al. (Reference Hoyas, Vinuesa, Schmid and Nagib2024) and Monkewitz (Reference Monkewitz2024), focusing on channel and pipe flows, have indicated that the indicator function exhibits a slight sensitivity to grid spacing and distribution. This sensitivity, combined with the influence of time averaging, suggests that a more precise discussion of the scaling properties of the overlap layer may not be meaningful at this stage. Nevertheless, the overall trends are largely consistent with the trends suggested by the (incompressible) composite model of Monkewitz et al. (Reference Monkewitz, Chauhan and Nagib2007), with the implications being threefold: first, the transformed compressible and incompressible trends are highly comparable, again adding confidence to previous conclusions. Second, the bend in $c_f$
corresponds to a Reynolds number at which no clear log layer has yet formed, thus it cannot be attributed to the high-
$c_f$
corresponds to a Reynolds number at which no clear log layer has yet formed, thus it cannot be attributed to the high- $Re$
regime. Third, lack of a log layer in the moderate-
$Re$
regime. Third, lack of a log layer in the moderate- $Re$
regime is not attributable to insufficient wake development, although the absence of a
$Re$
regime is not attributable to insufficient wake development, although the absence of a $Re$
-independent minimum
$Re$
-independent minimum $\Xi$
might be an indicator.
$\Xi$
might be an indicator.
4. Conclusions
A DNS of a spatially evolving TBL designed to be essentially devoid of spurious inflow effects by the area of interest is discussed, covering the onset of the moderate- $Re$
regime. In the range
$Re$
regime. In the range $4000 \lessapprox Re_\theta \lessapprox 5000$
, a surprisingly sharp ‘bend’ (at least in logarithmic scaling) in
$4000 \lessapprox Re_\theta \lessapprox 5000$
, a surprisingly sharp ‘bend’ (at least in logarithmic scaling) in $c_f$
is observed, essentially resembling the immediate changeover from established low-
$c_f$
is observed, essentially resembling the immediate changeover from established low- $Re$
to high-
$Re$
to high- $Re$
correlations of
$Re$
correlations of $c_f$
. Mainly evaluated by comparison with the wake parameter
$c_f$
. Mainly evaluated by comparison with the wake parameter $\Pi$
– as well as additional wake metrics – this ‘bend’ feature clearly corresponds to the
$\Pi$
– as well as additional wake metrics – this ‘bend’ feature clearly corresponds to the $Re$
position at which the turbulent wake establishes self-similarity with respect to outer characteristic length scales, supporting the understanding that the completed lifting of the wake from the inner layer can be seen as the main driver for the change in the
$Re$
position at which the turbulent wake establishes self-similarity with respect to outer characteristic length scales, supporting the understanding that the completed lifting of the wake from the inner layer can be seen as the main driver for the change in the $c_f$
trend. Reasons for this corresponding behaviour are rooted in the outer–inner relationship
$c_f$
trend. Reasons for this corresponding behaviour are rooted in the outer–inner relationship $\bar {u}_e^+ = \bar {u}_e/u_\tau$
as it evolves with
$\bar {u}_e^+ = \bar {u}_e/u_\tau$
as it evolves with $Re$
, and upon which both
$Re$
, and upon which both $c_f$
and
$c_f$
and $\Pi$
have a common dependency. As for the
$\Pi$
have a common dependency. As for the $c_f$
distribution, the establishment of self-similarity in the outer layer, which marks the onset of moderate-
$c_f$
distribution, the establishment of self-similarity in the outer layer, which marks the onset of moderate- $Re$
behaviour, occurs surprisingly abruptly, a fact that has likely been obscured by data scatter in previous studies. However, the comparison with DNS/LES data in regions where the independence of the inflow is established at least makes plausible the abruptness of both the
$Re$
behaviour, occurs surprisingly abruptly, a fact that has likely been obscured by data scatter in previous studies. However, the comparison with DNS/LES data in regions where the independence of the inflow is established at least makes plausible the abruptness of both the $c_f$
curve and the wake convergence. Discussion of the indicator function
$c_f$
curve and the wake convergence. Discussion of the indicator function $\Xi$
, namely the establishment of a local minimum in
$\Xi$
, namely the establishment of a local minimum in $\Xi$
at roughly
$\Xi$
at roughly $y^+\approx 70$
, implies that the point of wake convergence also marks a unique state in the development of the precursor to the log layer which only becomes significant in thickness at higher
$y^+\approx 70$
, implies that the point of wake convergence also marks a unique state in the development of the precursor to the log layer which only becomes significant in thickness at higher $Re$
. Consequently, the abrupt change in state of the TBL, perhaps the most meaningful consequence of which is the rapid change in the
$Re$
. Consequently, the abrupt change in state of the TBL, perhaps the most meaningful consequence of which is the rapid change in the $c_f(Re)$
progression, appears to be a characteristic trait of the onset of moderate-
$c_f(Re)$
progression, appears to be a characteristic trait of the onset of moderate- $Re$
behaviour. While speculative, possible reasons for this rapid change in
$Re$
behaviour. While speculative, possible reasons for this rapid change in $Re$
-behaviour could be associated with large-wavelength fluctuations, probably originating from the outer layer carrying free-stream momentum, which are transported to and interact with the wall with increasing
$Re$
-behaviour could be associated with large-wavelength fluctuations, probably originating from the outer layer carrying free-stream momentum, which are transported to and interact with the wall with increasing $Re$
. The increasing ‘uprightness’ of the
$Re$
. The increasing ‘uprightness’ of the $\bar {u}^+(y^+)$
wake profile is thus consistent as, on average, such structures more efficiently capture – and/or are more able to ‘hold on to’ – free-stream momentum. Such likely ties into the well-studied story of increasing scale separation and eventual interaction of large-scale ‘superstructures’ of the outer layer with the wall. However, although this discussion clearly will be part of the correct answer, it does not yet fully explain the abruptness of the
$\bar {u}^+(y^+)$
wake profile is thus consistent as, on average, such structures more efficiently capture – and/or are more able to ‘hold on to’ – free-stream momentum. Such likely ties into the well-studied story of increasing scale separation and eventual interaction of large-scale ‘superstructures’ of the outer layer with the wall. However, although this discussion clearly will be part of the correct answer, it does not yet fully explain the abruptness of the $c_f$
bend.
$c_f$
bend.
Funding
This work was supported by the Deutsche Forschungsgemeinschaft (DFG) in the context of grants RI680/49-1 and WE6803/5-3. The provision of computational resources on HPE Apollo ‘Hawk’ and NEC SX-Aurora TSUBASA by the Federal High Performance Computing Center Stuttgart (HLRS) under grant GCS-Lamt, project 28956, is gratefully acknowledged.
Declaration of interests
The authors report no conflict of interest.
Data availability statement
The data that support the findings of this study are openly available at: https://doi.org/10.18419/darus-4165.
Appendix A. Estimation of log-layer development
The representation of the viscous-scaled inner profile from Monkewitz et al. (Reference Monkewitz, Chauhan and Nagib2007) shows that the overlap region does not faithfully adhere to a ‘true’ logarithmic trend (i.e. $\Xi = y^+ ( \textrm{d} \bar {u}^+ / \textrm{d} y^+ ) \approx const.$
) until
$\Xi = y^+ ( \textrm{d} \bar {u}^+ / \textrm{d} y^+ ) \approx const.$
) until $y^+ \gtrapprox 300$
. Note that this bound is a matter of tolerances; estimates include
$y^+ \gtrapprox 300$
. Note that this bound is a matter of tolerances; estimates include $y^+ \gtrapprox 100$
(Hutchins & Marusic Reference Hutchins and Marusic2007),
$y^+ \gtrapprox 100$
(Hutchins & Marusic Reference Hutchins and Marusic2007), $y^+ \gtrapprox 200$
(Nagib et al. Reference Nagib, Chauhan and Monkewitz2007) and
$y^+ \gtrapprox 200$
(Nagib et al. Reference Nagib, Chauhan and Monkewitz2007) and $y^+ \gtrapprox 600$
(Zagarola & Smits Reference Zagarola and Smits1998; McKeon et al. Reference McKeon, Li, Jiang, Morrison and Smits2004) for pipe flows, among others. Marusic et al. (Reference Marusic, Monty, Hultmark and Smits2013) have determined
$y^+ \gtrapprox 600$
(Zagarola & Smits Reference Zagarola and Smits1998; McKeon et al. Reference McKeon, Li, Jiang, Morrison and Smits2004) for pipe flows, among others. Marusic et al. (Reference Marusic, Monty, Hultmark and Smits2013) have determined $y^{+}=3 Re_\tau ^{0.5}$
as a conservative limit using pipe and boundary-layer data. Assuming that the logarithmic region ends at roughly
$y^{+}=3 Re_\tau ^{0.5}$
as a conservative limit using pipe and boundary-layer data. Assuming that the logarithmic region ends at roughly $y/\delta _{99} \gtrapprox 0.15$
(Hutchins & Marusic Reference Hutchins and Marusic2007; Vallikivi, Hultmark & Smits Reference Vallikivi, Hultmark and Smits2015), it follows that this wall-normal position must be greater than or equal to the mentioned start of the log layer. Setting
$y/\delta _{99} \gtrapprox 0.15$
(Hutchins & Marusic Reference Hutchins and Marusic2007; Vallikivi, Hultmark & Smits Reference Vallikivi, Hultmark and Smits2015), it follows that this wall-normal position must be greater than or equal to the mentioned start of the log layer. Setting $0.15 \delta _{99} \approx 300 \delta _\nu$
yields
$0.15 \delta _{99} \approx 300 \delta _\nu$
yields $Re_\tau \approx 2000$
as an effective estimate of the minimum
$Re_\tau \approx 2000$
as an effective estimate of the minimum $Re$
at which the log layer could arguably be present with
$Re$
at which the log layer could arguably be present with $Re_\tau = \delta _{99} / \delta _\nu = \delta _{99} u_\tau / \bar {\nu }_w$
. To convert to
$Re_\tau = \delta _{99} / \delta _\nu = \delta _{99} u_\tau / \bar {\nu }_w$
. To convert to $Re_\theta$
for the incompressible ZPG case a correlation
$Re_\theta$
for the incompressible ZPG case a correlation $Re_\tau (Re_\theta )$
is required. Regression of data from Schlatter & Örlü (Reference Schlatter and Örlü2010) yields
$Re_\tau (Re_\theta )$
is required. Regression of data from Schlatter & Örlü (Reference Schlatter and Örlü2010) yields $Re_\tau \approx 0.6966 Re_\theta ^{0.9036}$
, whereas their own reported estimation (based on other DNS and experiments) is
$Re_\tau \approx 0.6966 Re_\theta ^{0.9036}$
, whereas their own reported estimation (based on other DNS and experiments) is $Re_\tau \approx 1.13 Re_\theta ^{0.843}$
. Regression of high-
$Re_\tau \approx 1.13 Re_\theta ^{0.843}$
. Regression of high- $Re$
data has led Smits (Reference Smits2024) to conclude
$Re$
data has led Smits (Reference Smits2024) to conclude $Re_\theta \approx 3.241 Re_\tau$
. Figure 1 therefore utilises
$Re_\theta \approx 3.241 Re_\tau$
. Figure 1 therefore utilises $Re_\theta \approx 6800 \pm 300$
as a rough estimate for the ‘appearance’ of a log layer. A further milestone of TBL development is the establishment of a log layer spanning one decade of wall-normal distance, which can be estimated as
$Re_\theta \approx 6800 \pm 300$
as a rough estimate for the ‘appearance’ of a log layer. A further milestone of TBL development is the establishment of a log layer spanning one decade of wall-normal distance, which can be estimated as $10 \times$
the
$10 \times$
the $Re_\tau$
of log-layer appearance, presently
$Re_\tau$
of log-layer appearance, presently $Re_\tau \approx 20\,000$
. Assuming
$Re_\tau \approx 20\,000$
. Assuming $Re_\theta \propto Re_\tau ^{1.0}$
(Smits Reference Smits2024), this yields
$Re_\theta \propto Re_\tau ^{1.0}$
(Smits Reference Smits2024), this yields $Re_\theta \approx 68\,000 \pm 3000$
. Both estimates are plotted as grey bars in figure 1. It should be noted that the present estimation is unique to boundary layers; mean-velocity profiles of internal canonical flows have different
$Re_\theta \approx 68\,000 \pm 3000$
. Both estimates are plotted as grey bars in figure 1. It should be noted that the present estimation is unique to boundary layers; mean-velocity profiles of internal canonical flows have different $Re$
-scaling behaviour (Monkewitz & Nagib Reference Monkewitz and Nagib2023).
$Re$
-scaling behaviour (Monkewitz & Nagib Reference Monkewitz and Nagib2023).
Appendix B. Alternative wake metric
Figure 6 evaluates the streamwise evolution of the Rotta–Clauser length scale $\varDelta =\int _0^\infty (\bar {u}_e^+ - \bar {u}^+)\textrm{d}y$
normalised by
$\varDelta =\int _0^\infty (\bar {u}_e^+ - \bar {u}^+)\textrm{d}y$
normalised by $\delta _{99}$
, where
$\delta _{99}$
, where $\bar {u}_i$
(Eq. 3.5) is used for compressible data. Note that, as for
$\bar {u}_i$
(Eq. 3.5) is used for compressible data. Note that, as for $\Pi$
in § 3.3, transformed compressible data are higher compared with incompressible reference data as a consequence of the van Driest transformation, as reflected by the black solid line. Following work by Nagib et al. (Reference Nagib, Chauhan and Monkewitz2007), the ratio
$\Pi$
in § 3.3, transformed compressible data are higher compared with incompressible reference data as a consequence of the van Driest transformation, as reflected by the black solid line. Following work by Nagib et al. (Reference Nagib, Chauhan and Monkewitz2007), the ratio $\varDelta /\delta _{99}$
can be seen as a well-suited metric to assess the evolution of the TBL’s outer region towards a self-similar state. If the van Driest transformed data are manually shifted downward to allow visual comparison with purely incompressible data with the same reasoning as for
$\varDelta /\delta _{99}$
can be seen as a well-suited metric to assess the evolution of the TBL’s outer region towards a self-similar state. If the van Driest transformed data are manually shifted downward to allow visual comparison with purely incompressible data with the same reasoning as for $\Pi$
before (grey dashed line), the results in figure 6 closely resemble the trends already discussed for
$\Pi$
before (grey dashed line), the results in figure 6 closely resemble the trends already discussed for $\Pi$
in figure 3(
$\Pi$
in figure 3( $c$
), namely that
$c$
), namely that $\varDelta /\delta _{99}$
increases
$\varDelta /\delta _{99}$
increases ${\propto }\ln (Re_{\theta _i})$
for
${\propto }\ln (Re_{\theta _i})$
for $Re_{\theta _i} \lessapprox 4100$
, after which it plateaus at
$Re_{\theta _i} \lessapprox 4100$
, after which it plateaus at $4.4 \lessapprox \varDelta /\delta _{99} \lessapprox 4.5$
. Further discussion can be found in Nagib et al. (Reference Nagib, Chauhan and Monkewitz2007) and Sanmiguel Vila et al. (Reference Sanmiguel Vila, Vinuesa, Discetti, Ianiro, Schlatter and Örlü2017). As well as for
$4.4 \lessapprox \varDelta /\delta _{99} \lessapprox 4.5$
. Further discussion can be found in Nagib et al. (Reference Nagib, Chauhan and Monkewitz2007) and Sanmiguel Vila et al. (Reference Sanmiguel Vila, Vinuesa, Discetti, Ianiro, Schlatter and Örlü2017). As well as for $\Pi$
, partial evidence supporting the abrupt onset of wake self-similarity can be gathered from existing data, especially the dataset by Schlatter & Örlü (Reference Schlatter and Örlü2010).
$\Pi$
, partial evidence supporting the abrupt onset of wake self-similarity can be gathered from existing data, especially the dataset by Schlatter & Örlü (Reference Schlatter and Örlü2010).
Streamwise evolution of the Rotta-Clauser length scale $\varDelta$
normalised by
$\varDelta$
normalised by $\delta_{99}$
.
$\delta_{99}$
.
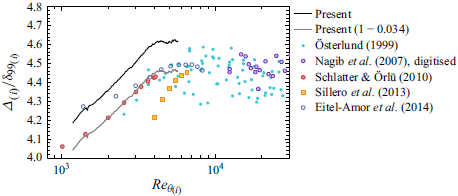
Appendix C. Outer layer evaluated with respect to polynomial inner-layer fit
Figure 3 (b,c) has computed $\Delta \bar {u}^+$
and
$\Delta \bar {u}^+$
and $\Pi$
based on the classical composite formulation of Coles (Reference Coles1956) with fixed
$\Pi$
based on the classical composite formulation of Coles (Reference Coles1956) with fixed $\kappa ,B$
mainly for clarity of comparison, given that
$\kappa ,B$
mainly for clarity of comparison, given that $1)$
the overlap layer in low-
$1)$
the overlap layer in low- $Re$
profiles has no appreciable region of constant
$Re$
profiles has no appreciable region of constant $\Xi$
and
$\Xi$
and $2)$
the progression of
$2)$
the progression of $\Pi$
(3.7) vs
$\Pi$
(3.7) vs $Re$
is of primary relevance to the conclusions of the present work, not necessarily the absolute value. Monkewitz et al. (Reference Monkewitz, Chauhan and Nagib2007) have developed an elegant composite profile formulation having consistent physical properties based on rigorous scaling arguments. For the present evaluation of the viscous-scaled outer-layer profile, we use the inner-layer profile formulation of Monkewitz et al. (Reference Monkewitz, Chauhan and Nagib2007), consisting of two summed Padé polynomial approximants (Monkewitz & Nagib Reference Monkewitz and Nagib2006). Figure 7(
$Re$
is of primary relevance to the conclusions of the present work, not necessarily the absolute value. Monkewitz et al. (Reference Monkewitz, Chauhan and Nagib2007) have developed an elegant composite profile formulation having consistent physical properties based on rigorous scaling arguments. For the present evaluation of the viscous-scaled outer-layer profile, we use the inner-layer profile formulation of Monkewitz et al. (Reference Monkewitz, Chauhan and Nagib2007), consisting of two summed Padé polynomial approximants (Monkewitz & Nagib Reference Monkewitz and Nagib2006). Figure 7( $a$
) corresponds to figure 4(
$a$
) corresponds to figure 4( $b$
); the highest-
$b$
); the highest- $Re$
profile plotted has been used to fit a curve
$Re$
profile plotted has been used to fit a curve $y^+ (P_{23}+P_{25})$
as a reference indicator function
$y^+ (P_{23}+P_{25})$
as a reference indicator function $\Xi$
. The outer region of the (differenced) mean-velocity profile is illustrated in figure 7(
$\Xi$
. The outer region of the (differenced) mean-velocity profile is illustrated in figure 7( $b$
), analogous to figure 3(
$b$
), analogous to figure 3( $b$
), with
$b$
), with $\Delta \bar {u}^+$
presently computed as the difference of
$\Delta \bar {u}^+$
presently computed as the difference of $\bar {u}^+_i$
with respect to
$\bar {u}^+_i$
with respect to $\bar {u}_{\textrm {inner}}^+$
, the wall-normal integral of
$\bar {u}_{\textrm {inner}}^+$
, the wall-normal integral of $(P_{23}+P_{25})$
, rather than
$(P_{23}+P_{25})$
, rather than $\bar {u}^+_{\textrm {log}}$
. Figure 7(
$\bar {u}^+_{\textrm {log}}$
. Figure 7( $c$
) plots the resulting
$c$
) plots the resulting $(\kappa /2) \, \Delta \bar {u}_{99}^+$
vs
$(\kappa /2) \, \Delta \bar {u}_{99}^+$
vs $Re_{\theta _i}$
. Figures 7(b,c) both confirm the effective collapse of the outer-layer profile onto a common form in outer scaling for
$Re_{\theta _i}$
. Figures 7(b,c) both confirm the effective collapse of the outer-layer profile onto a common form in outer scaling for $Re \gtrapprox 4100$
, in line with the general conclusions of the present work and Appendix B.
$Re \gtrapprox 4100$
, in line with the general conclusions of the present work and Appendix B.
Indicator function ( $a$
) and fitted polynomial-based ‘inner’ function of Monkewitz et al. (Reference Monkewitz, Chauhan and Nagib2007). The resulting parameters of the fitted function are provided. Panel (
$a$
) and fitted polynomial-based ‘inner’ function of Monkewitz et al. (Reference Monkewitz, Chauhan and Nagib2007). The resulting parameters of the fitted function are provided. Panel ( $b$
) shows the mean streamwise velocity profile with fitted inner profile subtracted. The development of the resulting wake parameter analogue vs
$b$
) shows the mean streamwise velocity profile with fitted inner profile subtracted. The development of the resulting wake parameter analogue vs $Re$
is shown in panel (
$Re$
is shown in panel ( $c$
).
$c$
).
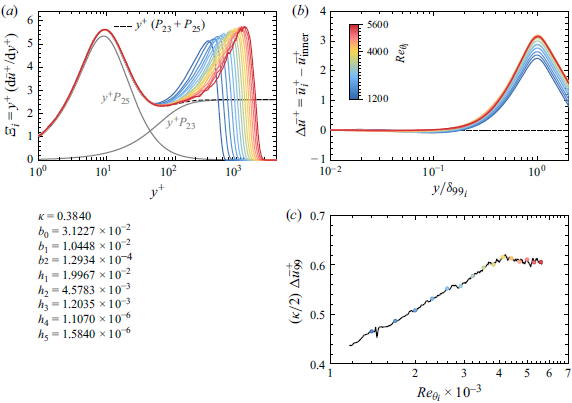


 Open access

