


INTRODUCTION
Between the fifteenth and eighteenth centuries, slave raiders from the Black Sea steppe captured millions of people across Eastern Europe, ravaging the southern borderlands of Poland, Lithuania, and Russia particularly intensely. Most captives were hauled to Crimea and exported to slave markets around the Ottoman Empire—from Constantinople to Cairo to Damascus—via an extensive network of merchants, gatekeepers, and watchmen. The remainder were either ransomed or sold locally, provided that they did not perish during the grueling march to Crimea. The upshot of these activities is a little-known fact: after West Africa, Eastern Europe was the largest source of slaves in the early modern world (Khodarkovsky Reference Khodarkovsky2002, 22).
Despite considerable interest in the socioeconomic legacies of slavery, relatively little is known about the scale, scope, or developmental consequences of the Black Sea slave trade. Eastern Europe’s experience as a victim and perpetrator of slave-raiding remains strikingly absent from global historical narratives of the early modern era (Fisher Reference Fisher1999; Ostrowski Reference Ostrowski and Witzenrath2015). Our understanding of how slavery influences long-run development is based almost exclusively on evidence from the transatlantic slave trade, which was dwarfed by its Black Sea counterpart until as late as the eighteenth century. In West Africa, demand from—and subsequently coercion by—European powers created incentives for rulers to adopt extractive institutions and social practices that maximized their capacity for (internal and external) slave production. An insecure and unpredictable economic environment ensued, with trade and investment stymied by pervasive violence, low levels of interpersonal trust, political instability, and ethnic fragmentation (Fenske and Kala Reference Fenske and Kala2017; Green Reference Green2013; Nunn Reference Nunn2008; Nunn and Wantchenkon Reference Nunn and Wantchekon2011; Obikili Reference Obikili2016; Whatley and Gillezeau Reference Whatley and Gillezeau2011).
In early modern Eastern Europe, demand for slaves from the expanding Ottoman Empire similarly encouraged some polities—principally the Crimean Khanate—to specialize in and organize their economies around slave-raiding. In major powers, such as Russia and Poland–Lithuania, however, a wave of political consolidation in the late medieval period had brought an end to commercial slavery, reorienting economic activity toward the production of labor- and land-intensive commodities for export to Western Europe. As a result, these states neither participated in nor profited from the slave trade. To the contrary, they sought to stem population decline by building permanent fortifications, mobilizing armies, and investing in reconnaissance systems. These measures, in turn, required strengthening fiscal capacity and further centralizing administrative structures. Slave-raiding thus encouraged a process of defensive state-building that, we argue, stimulated sustained flows of labor and capital to exposed areas—flows that more than offset losses caused by slave raids. Our central claim is that, while bearing the brunt of short-term damage from the slave trade, raided locations came to enjoy enduring economic advantages that provided the basis for higher levels of development over the long run.
To test this hypothesis, we construct and analyze the most comprehensive dataset on slave raids in early modern Eastern Europe. Our dataset, which draws on a rich array of historical sources, reveals that the Black Sea slave trade was fueled by more than 2,500 attacks on 882 locations spanning 13 contemporary countries over 321 years (1453–1774). At a minimum, 3.64 million people were seized in these incursions; using imputation methods to account for missing information on captives, we estimate that the true figure lies in the region of 5 million. This represents more than a quarter of Eastern Europe’s estimated population in 1400, shortly before the onset of the slave trade. Moreover, it is comparable to the proportion of Africa’s preexisting population that was exported in one of its four early modern slave trades (just under one-third).
We begin our empirical investigation by examining the impact of slave raids on urban population growth, a common indicator of economic development in the preindustrial era. Pursuing a difference-in-differences strategy, we find that raided urban settlements in Eastern Europe exhibited significantly faster population growth than non-raided settlements between the start of the Black Sea slave trade and the end of the nineteenth century. According to our baseline estimates, exposure to raids is associated with an average increase in settlement population of approximately one-fifth over the sample period. This relationship holds across various specifications, including the use of heterogeneity-robust event study estimators, interactive fixed effects capturing the time-varying effects of soil fertility and other geographical characteristics, continuous measures of raid intensity, grid cells as the unit of observation, and alternative sources of urban population data.
Next, we analyze a broader set of development indicators measured in the mid-nineteenth century—around 75 years after the slave trade ended—for districts of the Russian and Austrian Empires. Lacking over-time variation in these outcomes, we seek to identify the effect of slave raids using an instrumental variables strategy that exploits natural topographical features affecting raiders’ access to different parts of the Black Sea region. We observe a consistently positive relationship between district-level raid intensity and development outcomes, including market and manufacturing activity in Imperial Russia, house and farm density in Imperial Austria, and population in both contexts.
Finally, we turn our attention to mechanisms, providing several pieces of evidence linking exposure to slave raids to economically advantageous investments in defensive state-building. First, raiding activity predicts a rise both in the fiscal revenues of the Polish and Lithuanian treasuries and in the population of military encampments in the highly exposed region of Red Ruthenia. Second, raided areas of Poland–Lithuania constructed significantly more permanent fortifications, such as castles and defensive settlements, than non-raided areas. Third, a higher share of these fortifications were controlled by the crown or its representatives, implying that the state responded to raids by strengthening its monopoly on violence. Finally, raid intensity is positively associated with the number of military servicemen in Russian urban communities in the seventeenth century. Its relationship with the population of traders and artisans in these communities, by contrast, turns from negative in the seventeenth century to positive in the early eighteenth century, with earlier military and administrative presence also a positive predictor in the latter period. This pattern suggests that defensive investments against slave-raiding gradually paved the way for an expansion in local trade and production, further allaying possible concerns about reverse causality.
We contribute to several areas of research, beginning with the influential literature on the developmental impact of slave-raiding, which has focused predominantly on Africa (Fenske and Kala Reference Fenske and Kala2017; Nunn Reference Nunn2008; Nunn and Wantchekon Reference Nunn and Wantchekon2011; Obikili Reference Obikili2016; Whatley and Gillezeau Reference Whatley and Gillezeau2011). Taken together, our findings point to the structure of slave production as a key determinant of how raiding activity influences long-run development. When targeted societies resist integration into transnational systems of slavery, exposure to raids may encourage rather than impede processes of defensive state-building that are critical to sustained economic growth. While the sources of variation in responses to external slave demand merit further investigation, our analysis suggests that integration is less likely when states possess higher preexisting levels of political centralization and lucrative alternative export opportunities.Footnote 1 Our results hence caution against generalizing inferences about slavery’s economic effects drawn from the African context.Footnote 2 Rather, they imply that a comprehensive and balanced understanding of slavery’s developmental consequences requires additional case studies covering a variety of other regions and historical eras. They thus underscore the value of a vibrant emerging research agenda that seeks to study slavery from a global—and explicitly comparative—perspective (Eltis and Engerman Reference Eltis, Engerman, Eltis and Engerman2011; Sharman and Zarakol Reference Sharman and Zarakol2024; Witzenrath Reference Witzenrath2015).
Second, our conclusions speak to scholarship on the origins of state-building, which has until recently ignored slavery as an explanatory factor. Complementing agenda-setting research on the role of slaves in consolidating political authority in “consumer” states (Blaydes and Chaney Reference Blaydes and Chaney2013; Sharman and Zarakol Reference Sharman and Zarakol2024), our analysis shows that slave-raiding can promote administrative and fiscal centralization in “supplier” states. In doing so, it adds nuance to existing accounts of the evolution of state capacity in Eastern Europe, which have generally emphasized delays relative to Western Europe stemming from the absence of high-stakes military competition between major powers (Ertman Reference Ertman1997; Karaman and Pamuk Reference Karaman and Pamuk2013). If our findings are valid, slave raids may have served as a “substitute” for intense interstate warfare in stimulating state-building—albeit one whose consequences were less existential in nature and more concentrated in border regions. A similar point applies to the growth and development of urban centers, which have been attributed to the heavy costs of military conflict for rural populations in early modern Western Europe (Dincecco and Onorato Reference Dincecco and Onorato2017).
Third, we extend the growing body of systematic empirical research on the economic and political legacies of unfree labor in Eastern Europe (Buggle and Nafziger Reference Buggle and Nafziger2021; Dower et al. Reference Dower, Finkel, Gehlbach and Nafziger2018; Lankina and Libman Reference Lankina and Libman2021; Markevich and Zhuravskaya Reference Markevich and Zhuravskaya2018). Most of this work has examined serfdom—a less extreme form of dependence—with studies of slavery typically restricted to individual states and centuries (for exceptions, see Roşu Reference Roşu2022; Witzenrath Reference Witzenrath2015). The few attempts to provide an aggregate estimate of the size of the Black Sea slave trade rely, by necessity, on a mixture of extrapolation and educated conjecture (Inalcik and Quataert Reference Inalcik and Quataert1994; Klein Reference Klein2016; Kołodziejczyk Reference Kołodziejczyk2006).Footnote 3 To our knowledge, our dataset represents the only effort to comprehensively catalog slave raids in Eastern Europe at a precise geographical level. While not guaranteed to encompass every raid that occurred, it lays the foundation for a deeper and more wide-ranging understanding of Eastern European slavery—a historically significant phenomenon that has been largely overlooked by social scientists—than previously possible. Lastly, our conclusions challenge and complicate the assumption made by some historians of the region that the slave trade was overwhelmingly detrimental to its economic fortunes (Khodarkovsky Reference Khodarkovsky2002; Kołodziejczyk Reference Kołodziejczyk2006), highlighting the importance of distinguishing the immediate impact of raids (which was almost certainly negative) from their long-run repercussions (which we find to be more favorable).
THE BLACK SEA SLAVE TRADE: AN OVERVIEW
Origins and Organization
While slave-raiding in Eastern Europe dates back to antiquity, it remained limited and sporadic until the late medieval period. A series of devastating wars, culminating in Mongol invasions and the establishment of the Ulus of Jochi in the thirteenth century, led to a pervasive state of insecurity and deprivation in which the abduction and sale of children became common (Roşu Reference Roşu2022, 9).Footnote 4 The supply of slaves dramatically expanded in the mid-fifteenth century with the disintegration of the Ulus of Jochi and the fall of Constantinople, which reoriented Black Sea commerce toward the “economically thriving”—and thus labor-hungry—Ottoman Empire (Witzenrath Reference Witzenrath2022, 29). The Crimean Khanate, a powerful Tatar successor state to the Ulus of Jochi, was acquainted with agriculture but found slave-raiding more profitable for two reasons. First, only coastal districts of the Crimean peninsula were suitable for intense cultivation, and their yields “were insufficient to support the multitudinous warring layers” (Ivanics Reference Ivanics, Fodor and David2007, 193). Second, Crimean Tatars retained traditional nomadic skills and military know-how that enabled them to conduct rapid and destructive raids across the steppe. Ottoman control of the Black Sea and, from 1475, Crimea itself created a vast international market for Christian slaves—Muslims were prohibited from enslaving coreligionists—who came to play a central role in the empire’s economy, military, and bureaucracy (Inalcik and Quataert Reference Inalcik and Quataert1994). The slave trade became a “cornerstone” of the Crimean economy (Kizilov Reference Kizilov2007, 2), with some contemporaries estimating that slaves outnumbered natives by more than 2:1 (Davies Reference Davies2007, 25).Footnote 5
While seemingly chaotic, slave raids were highly organized. Most raiding expeditions were conducted either in winter—when frozen rivers and grassland could be more easily traversed on horseback—or after the spring thaw and were planned 3–4 weeks in advance (Ivanics Reference Ivanics, Fodor and David2007; Kizilov Reference Kizilov2007).Footnote 6 Raiding parties, ranging in size from several hundred to tens of thousands, typically followed one of four trails stretching from the northern edge of the Crimean peninsula deep into the Black Sea steppe.Footnote 7 By following these routes, raiders “always traveled between two major rivers, staying on the highest ground” (Beauplan Reference Beauplan1660, 47) and thus avoiding natural barriers and detection by enemy settlements on river banks. Raiders would approach their target area furtively, often traveling on moonless nights and switching between trails to confuse enemy watchmen, while undertaking continuous reconnaissance patrols (Gliwa Reference Gliwa and Roşu2021, 206–9). A fortified field camp would then be constructed, from which raiders fanned outward as far as 140 kilometers, setting buildings alight and conducting demonstrative executions to arouse panic and fear (Gliwa Reference Gliwa2016). Renowned for their speed and mobility, Tatar cavalrymen commanded multiple horses each and deployed a combination of bows and arrows, sabers, spears, and rope to seize captives (up to 7 per soldier) (Kizilov Reference Kizilov2020, 253).Footnote 8 Finally, the raiding party would reconvene and return to camp to divide up the spoils.
Captives were marched to Crimea in chains, with the ill and wounded frequently killed to avoid slowing down progress (Fisher Reference Fisher1999, 35). Upon arrival, a small number were retained for ransom—generally nobility and high-ranking military officers—or domestic and agricultural work, while the rest were distributed to one of Crimea’s many slave markets, the largest being the port of Caffa (modern Feodosia).Footnote 9 There, an assortment of handlers, gatekeepers, watchmen, and brokers categorized captives according to sex, age, and skill; assigned them to a storage facility; and, within a few days, sold them to a local merchant (Fisher Reference Fisher1999, 35).
The vast majority of purchased slaves were shipped via the Black Sea either to commercial centers across the Ottoman Empire, such as Bursa, Cairo, Constantinople, Damascus, and Edirne, or to smaller towns with slave markets, such as Haskovo, Nova Zagora, and Kazaluk in Bulgaria (Kołodziejczyk Reference Kołodziejczyk2006). Approximately 70% of slaves sold in Caffa made the 10-day journey to Constantinople, where several thousand people—including a guild of 2,000 merchants based in the Grand Bazaar—made a living off the slave trade (Fisher Reference Fisher1999, 584). Male slaves usually ended up working in agriculture, construction, small craft production, or the military; female slaves were used mainly in domestic service, either as concubines of their owner or as servants of his legal wives (Fisher Reference Fisher1999; Lavrov Reference Lavrov and Witzenrath2015).
Scale and Scope: New Geocoded Data
Slave raids in early modern Eastern Europe are known to have occurred frequently and widely while concentrating on the southern peripheries of Poland–Lithuania and Russia in the sixteenth and seventeenth centuries. The full extent of this complex system, however, remains surprisingly unclear. To gain a better empirical understanding, we collected data on the timing, location, and yield of Ottoman-era raids recorded in hundreds of primary and secondary sources, the most important of which are enumerated in Table A1 in the Supplementary Material.
Our data-gathering process proceeded in four steps. First, we attempted to compile a thorough list of raids mentioned in modern scholarship on the Black Sea slave trade in Polish, Russian, Ukrainian, Turkish, English, and Hungarian.Footnote 10 Second, where possible, we consulted the original historical sources referenced in this research to verify dates and figures, acquire additional information (e.g., more precise locations, raiding party size, collateral damage), and check for unreported raids. While most of these sources take the form of chronicles compiled by monastic or court scribes, they range from property registers and treasury accounts to diplomatic documents and military lists. Third, to err on the side of caution, we excluded raids whose source has been questioned by historians or lacks clarity on whether captives were actually taken. Finally, we geocoded the remaining raids, which in some instances required matching historical and contemporary location names using archival maps.Footnote 11
In total, our dataset comprises 2,511 raids conducted between 1453 and 1774 across 882 geocoded locations—treated as distinct units of observation for raid-counting purposes—spanning 13 contemporary countries: Austria, Belarus, Croatia, the Czech Republic, Hungary, Lithuania, Moldova, Poland, Romania, Russia, Serbia, Slovakia, Slovenia, and Ukraine (data are available at Charnysh and Lall Reference Charnysh and Lall2026). A total of 3.64 million people were captured in these incursions, according to our sources.Footnote 12 It is crucial to note, however, that information on captive numbers is missing for 56% of raids, implying a far higher true aggregate. Replacing missing values with the mean of observed ones (mean imputation) yields a total of 8.3 million captives. A more sophisticated multiple imputation model, which includes raid longitude, latitude, location type, year, and party size as predictors, provides a more conservative mean estimate of 5.23 million (with a range of 4.41–6.27 million).Footnote 13 We find the latter figure, which we discuss in detail in Section B of the Supplementary Material, considerably more plausible, not only because it leverages predictive information in a statistically principled manner but also because raids that lack data on captives are likely to be smaller, on average.
Based on demographic statistics from the History Database of the Global Environment (Klein Goldewijk et al. Reference Klein Goldewijk, Beusen, Doelman and Stehfest2017), our imputed captives total amounts to 27.5% of Eastern Europe’s population in 1400.Footnote 14 It is not possible to calculate this proportion in the case of Africa’s early modern slave trades, for which scholars have only estimated the aggregate number of exported slaves. The latter figure—approximately 18 million (Nunn Reference Nunn2008)—represents 32.8% of Africa’s population in 1400 (as per the History Database). As a high fraction of Eastern European slaves were exported to Ottoman lands (Kołodziejczyk Reference Kołodziejczyk2006, 151), it seems reasonable to view the Black Sea slave trade as roughly comparable to its African counterparts in terms of overall demographic burden.
Two caveats about our dataset should be mentioned. First, it is unlikely to be complete. Some raids may not have been recorded by contemporaries (for instance, due to their small size or remote location), and not all archival material relating to the Black Sea slave trade may have been accessed by historians.Footnote 15 While information about raids surely varies with location size and prominence, localities with fewer than 5,000 inhabitants constitute the bulk of our dataset, suggesting that our sources provide good coverage of minor settlements.Footnote 16 Second, neither raid nor captive numbers should be taken as exact. In addition to the problem of missing data, there is no guarantee that every historical source is accurate (though we have seen no evidence of systematic exaggeration or underreporting). For these reasons, it is prudent to treat our data as indicating approximate orders of magnitude rather than precise quantities.
With these qualifications in mind, the dataset opens a rich window on the scale, scope, and dynamics of slave-raiding in Eastern Europe. Figure 1 plots the annual and cumulative number of raids and (non-imputed) captives between 1400 and 1800. Raids were conducted fairly consistently throughout the period, particularly in the sixteenth and seventeenth centuries. Nevertheless, there are discernible peaks in the first two decades of the 1500s (338 raids), 1610–1630 (414), and 1660–1680 (297). While more sparse due to missing data, captive numbers exhibit similar crests in the first half of the sixteenth century (1.41 million captives) and in the mid-seventeenth century (0.63 million between 1640 and 1660). According to our imputation model, 5 million captives—95% of the total—were taken by 1700. The number of Africans exported in the transatlantic slave trade by this date is estimated at 1.28 million (Slave Voyages 2021).
Frequency of Slave Raids in Eastern Europe, 1453–1774
Note: The left panels display the annual number of raids (top) and captives (bottom, in thousands); the right panels show the cumulative number of raids (top) and captives (bottom, in millions).

Despite the overall magnitude of the Black Sea slave trade, the dataset indicates that raids were typically modest in size. Among raids with information on yield, the average number of captives is 1,450, with 42% producing less than 1,000 captives and only 16% generating more than 5,000 captives.Footnote 17 In general, the largest raids were conducted during military campaigns led by the Crimean khan, the most famous example being Mehmed I Giray’s 1521 invasion of southern Russia, when a sizable army ravaged towns and villages up to the outskirts of Moscow, forcing Grand Prince Vasilii III to flee to Volokolamsk. Contemporaries estimated that hundreds of thousands of Russians were enslaved during the campaign.Footnote 18
Figure 2 displays the geographical distribution of slave raids with state borders from the late fifteenth century.Footnote 19 Raids spanned the full extent of Eastern Europe, ranging longitudinally from the Caucasus Mountains to the Vyatka River basin (roughly 1,300 kilometers) and latitudinally from Lower Austria to the Ural Mountains (roughly 3,000 kilometers). Even so, they were heavily clustered in two areas: the stretch of western Ukraine and southeastern Poland ruled by the Crown of Poland and the Grand Duchy of Lithuania until 1569 and by the Polish-Lithuanian Commonwealth thereafter (65% of all raids); and southern Russia, which was ruled by Muscovy, later known as the Tsardom of Russia (24%).Footnote 20 Not by coincidence, these areas were directly intersected by the four major trails followed by raiding expeditions (indicated by thick lines).Footnote 21 In terms of contemporary borders (see Figure A2 in the Supplementary Material), 51% of raids took place in Ukraine, 26% in Russia, 13% in Poland, 3% in Belarus, 3% in Romania, 1% in Hungary, 1% in Moldova, and less than 0.5% in the remaining six countries listed above.
Geographical Distribution of Slave Raids
Note: This map displays the locations of 2,511 slave raids in Eastern Europe between 1453 and 1774.

FROM SLAVE-RAIDING TO STATE-BUILDING
While few societies throughout history have been spared the ravages of slave-raiding, responses to external demand for enslaved labor have varied widely. In West Africa, slaves were commonly used but rarely exported before the seventeenth century, with demand coming primarily from domestic producers of gold, copper, salt, and other mined resources (Inikori Reference Inikori, Eltis and Engerman2011). European conquest of the New World radically altered this pattern, creating massive demand for cheap manpower to fuel plantation and mining economies across the Americas. The resulting spike in the price of slaves and decline in the value of precious metals significantly raised “the returns to slave raiding for export, relative to other economic activities” (Sharman Reference Sharman2023, 498). Responding to these incentives, many West African states began to specialize in slave-raiding, taking advantage of—and often becoming dependent upon—European weapons and gunpowder technology (Nunn Reference Nunn2008, 142–3).Footnote 22
For several centuries following the fall of Rome, parts of Europe experienced similar pressures, as “a slave trade from the less developed north, west, and east sent a stream of slaves drawn from various European peoples to the more prosperous areas of the south and the Mediterranean” (Eltis and Engerman Reference Eltis, Engerman, Eltis and Engerman2011, 19). In Latin Europe, slave-raiding declined in the tenth and eleventh centuries with the emergence of proto-states capable of controlling their borders and regulating trade (Fynn-Paul Reference Fynn-Paul, Pargas and Roşu2018, 573). In Northern and Eastern Europe, where political centralization proceeded more slowly, slavery flourished until the late medieval period. Poland’s Piast dynasty captured and sold slaves of East Slavic origin up to the fourteenth century (Hellie Reference Hellie1982, 696), when it unified governance and legal structures and began exporting agricultural commodities such as wheat, millet, and rye to Western Europe. Further east, slave-raiding was “drastically curtailed with the consolidation of the Muscovite state at the end of the fifteenth century” (Hellie Reference Hellie1982, 22), which started supplying Western Europe with timber, furs, salt, flax, and hemp. The gradual emergence of no-slaving zones in these states was thus intimately related to the expansion and centralization of political authority (Witzenrath Reference Witzenrath2022, 41–2).
By the time Ottoman demand for slaves expanded, much of Eastern Europe was governed by relatively large and consolidated states whose economic prospects were increasingly tied to trade in labor- and land-intensive commodities with Western Europe. Rather than adapting to and participating in the slave trade, such powers sought to thwart Tatar incursions and stem population losses—a difference with critical implications for how they allocated material, administrative, and military resources.Footnote 23 As Witzenrath (Reference Witzenrath2022, 4) observes, “Periodic destructions and the constant drain of manpower made the capacity to stem the flow [of slaves] the inescapable rationale for any power which sought to establish itself in Eastern Europe.” To ensure their internal security and territorial integrity, raided states embarked upon an ambitious program of defensive state-building involving the construction of permanent fortifications, the mobilization of armed forces, and the consolidation of bureaucratic and fiscal capacity. This strategy, we argue, entailed far-reaching developmental consequences.
Beginning in the early sixteenth century, Muscovite Russia erected a string of garrison towns connected by abatises (zaseka) along its southern perimeter, which supported reconnaissance patrols, signaling, and other defensive maneuvers by the frontier field army. The Bereg Line was built along a vulnerable 250 kilometers stretch of the Oka River between Kolomna and Kaluga, followed soon by the 1,000 kilometers Abatis (Tula) Line, the 800 kilometers Belgorod Line, and the 530 kilometers Izium Line (see Figure A12 in the Supplementary Material). The Military Chancellery enlisted thousands of soldiers and cossack mercenaries to man the new garrisons; bolstered their ranks with “foreign formations” trained with Western European tactics and weaponry; and, in the mid-seventeenth century, introduced a centralized system of Military-Administrative Regions to coordinate these forces (Davies Reference Davies2007, 93).Footnote 24 To feed the burgeoning army and facilitate communication with Moscow, an extensive network of granaries (managed by a national Grain Chancellery), roads, and coach stations was constructed over the subsequent decades (Kollman Reference Kollman2017, Ch. 7; Stevens Reference Stevens1995, 165). Owing to these efforts, Russia’s southern frontier became ever more difficult—and eventually impossible—to permeate, facilitating further settlement and, during the eighteenth century, territorial expansion all the way to the Black Sea (Crimea was annexed in 1783) (Witzenrath Reference Witzenrath2015).Footnote 25
Investments in defensive infrastructure required the development of new fiscal instruments. In the late fifteenth century, Muscovy instituted the pomest’e system, under which the nobility and gentry were granted land—typically in exchange for military service—from which they directly collected rents. An array of raid-related taxes followed in the sixteenth and seventeeth centuries, including construction duties, fortification officials’ fees, and levies specifically for financing dragoons, infantrymen, musketeers, watchmen, and captive ransoms (Khodarkovsky Reference Khodarkovsky2002, 22). These were supplemented by an in-kind grain tax supporting a centrally directed food supply system that sustained border armies during campaigns, delivered emergency supplies to garrison towns, and paid cossack salaries. During the sixteenth century alone, financial obligations to the Russian state increased sixfold, adjusting for inflation (Zlotnik Reference Zlotnik1979, 253–4). In 1679, Russia’s increasingly complex fiscal apparatus was consolidated through the introduction of a simplified direct tax. The next year, a national exchequer (Bolshaia Kazna) was established, laying the foundations for the first state budget (Stevens Reference Stevens1995, 84).
Poland–Lithuania likewise invested heavily in arming and fortifying its southeastern periphery. A mercenary army (obrona potoczna) was deployed to the area as early as 1479. Three decades later, Sigismund I centralized military and administrative authority by issuing an ordinance for the state’s “common defense” by a front guard tasked with monitoring the border and a larger infantry unit charged with halting incursions (Adamczyk Reference Adamczyk2004, 38–9). In 1563, the legislature, or Sejm, mobilized a standing “quarter army” (wojsko kwarciane) with a sizable cavalry component to lead the defensive effort. This force was augmented by peasant infantry, county militias, private armies, the crown’s royal guard, and cossack formations. After the Khmelnytsky Uprising in the mid-seventeenth century, when cossacks revolted against Poland–Lithuania in alliance with the Crimean Khanate, the quarter army was merged with provincial supplementary forces to form a permanent mercenary army (wojsko komputowe).Footnote 26 The Sejm took several steps to consolidate this growing defensive machinery, including requiring private castles (1590) and cities (1620) to maintain garrisons and expanding the authority of state hetmans (military commanders) over the former. As major landowners sometimes resisted these centralizing dictates, efforts to create a system of interlinked state forts across the border zone never came to fruition (Adamczyk Reference Adamczyk2004, 45).Footnote 27 Nonetheless, this region grew so densely fortified that it came to be known as a “bastion” against Islamic invaders.
As in Muscovy, defensive investments went hand-in-hand with an expansion in Poland–Lithuania’s fiscal capacity. The mercenary army was initially funded by loans secured against royal properties, boosting the monarchy’s efforts to regain control of crown land (Frost Reference Frost2015, 364–5). The quarter army derived its name from the kwarta tax—a 25% levy on income from crown lands instituted by the Sejm in 1563—that sustained it. This tax, which remained in place for 225 years, led to the establishment of a public treasury for financing regular army units in Rawa Mazowiecka in 1569.Footnote 28 In addition, the Sejm routinely approved one-off levies for defensive purposes. Poland’s first poll tax, introduced in 1498 and levied on all citizens (including the clergy and nobility), was a direct response to slave raids (Guzowski and Sowina Reference Guzowski, Sowina, Menjot, Caesar, Garnier and Pijuan2023, 362). Sigismund I imposed extraordinary taxes to pay for the mercenary army no less than 30 times during his reign (1505–1548) (Filipczak-Kocur Reference Filipczak-Kocur and Bonney1999, 452). Another notable example came after a vicious wave of raids unleashed by Poland–Lithuania’s defeat by a Tatar-Ottoman army in the 1620 Battle of Cecora, when the Sejm approved a tax hike large enough to raise a 60,000-strong standing army (Adamczyk Reference Adamczyk2004, 24). Together with mandatory labor, tax revenues also supported the construction of urban and rural fortifications. The proceeds of local commercial taxes, for instance, were allocated to the restoration or maintenance of defensive walls in Lviv in 1494, in Kazimierz in 1504, and in Szydłowiec in 1519 (Mikuła Reference Mikuła, Lityński, Matan, Mikołajczyk, Nancka and Nawrot2020).
Pathways to Economic Development
We posit that, while primarily motivated by security considerations, investments in defensive state-building stimulated long-run development in raided areas through three mutually reinforcing processes: (1) the reallocation of human and financial resources from less vulnerable regions; (2) the proliferation and expansion of urban settlements; and (3) the emergence of a more secure and predictable environment for economic activity.
First, the inward flow of labor and capital to construct defense lines, fortresses, and city walls boosted local demand for goods and services. In Poland–Lithuania’s southeastern provinces, an average of 12,000 people per year joined military camps during the first half of the sixteenth century (Łopatecki and Bołdyrew Reference Łopatecki and Bołdyrew2024, 17). This influx prompted an expansion of “urban infrastructure—primarily merchants, transport companies, and artisans’ workshops to provide supplies and luxury goods to the soldiers,” bringing about a “redistribution of wealth from taxes collected throughout the country” (Łopatecki and Bołdyrew Reference Łopatecki and Bołdyrew2024, 31–3). Muscovy’s defensive effort involved even larger population transfers. Some 50,000 infantrymen worked on the Izium Line alone, for instance, and as many as 180,000 combatants and support personnel were mobilized in campaigns against the Crimean Khanate later in the seventeenth century (Davies Reference Davies2007, 171–9). Gentry from western and northern Russia and cossacks from the Pontic-Caspian steppe were lured south with the promise of landed estates and grain, while large numbers of peasants and servitors were forcibly moved (Kollman Reference Kollman2017, ch. 7). Even serfs were encouraged to join garrisons, whose commanders were instructed to retain—not return—enrolling fugitives (Stevens Reference Stevens1995, 26). As a result of these measures, military and economic migration to raided areas more than compensated for losses caused by slave raids.
Second, defensive state-building encouraged the formation and growth of urban communities, expanding markets for agricultural products, facilitating specialization, and creating hubs for trade and investment. In Muscovy, 79 garrison towns were founded in Belgorod and Sevsk—the provinces most exposed to raids—by the late seventeenth century. In Red Ruthenia, a heavily raided region of southeastern Poland, the number of urban settlements doubled between 1500 and 1650 (Bogucka and Samsonowicz Reference Bogucka and Samsonowicz1986, 17). Although established for defensive purposes, many of these settlements soon acquired commercial significance.Footnote 29 For instance, the fortress of Voronezh, constructed in 1585 to monitor the Oka-Don plain for incursions, became the largest city and trading post in southern Russia during the seventeenth century. It was not only new settlements that prospered. Tula, founded in 1381 and subsequently integrated into the Abatis Line, became a renowned center of metalworking and arms production for the Russian army, by the late eighteenth century boasting a population of 25,000 and also producing samovars, hats, gloves, silk, rope, and tiles (Kollman Reference Kollman2017, 383). A striking case is Kyiv, which was sacked by slave raiders so frequently and thoroughly in the fifteenth and sixteenth centuries that it remained “practically empty” for decades (Subtelny Reference Subtelny2009, 83). An intensive fortification effort led by Poland–Lithuania and (from the mid-seventeenth century) MuscovyFootnote 30 dramatically reversed the city’s fortunes over the next 300 years, boosting its population from less than 10,000 to almost a quarter of a million as it morphed into an “administrative, military, commercial, and cultural center” (Subtelny Reference Subtelny2009, 185).Footnote 31
Finally, improvements in defensive capacity strengthened the state’s monopoly on violence, enhancing security—and hence the returns to economic activity—in vulnerable areas. In addition to raids, southern borderlands were plagued by recurrent robberies, extortion, and assaults—frequently by cossacks—hampering commerce, finance, and institution-building (Osipian Reference Osipian, Charters, Houllemare and Wilson2020). The state’s growing presence in these territories, combined with the recruitment of cossacks into military service, gradually curbed lawlessness and marginalized banditry and freebooting (Kumke Reference Kumke1993). In Muscovy, garrisoned troops not only protected settlements from raids but also actively monitored Don Cossacks to suppress illicit activity (Davies Reference Davies2007, 198–9). In Poland–Lithuania, the crown army and Registered Cossacks were tasked with preventing raids by independent cossacks as well as Tatars (Osipian Reference Osipian, Charters, Houllemare and Wilson2020). While cossacks continued to periodically challenge state authority, the reduced incidence and threat of violence in raided territories created a safer and more stable climate for trade and investment.
The preceding discussion suggests that the developmental consequences of slave-raiding in early modern Eastern Europe may be better understood by analogy with interstate warfare in contemporary Western Europe than with reference to the transatlantic slave trade. Wars inflicted immediate economic damage on Western European states, reducing populations, fueling epidemics, and destroying capital stock. Over a longer time span, however, they set in motion a sustained process of state-building—Tilly’s (Reference Tilly1990) famous “war made the state” thesis—that is widely viewed as instrumental in the region’s subsequent economic ascent.Footnote 32 Faced with cutthroat military competition, bellicist theories contend, rulers centralized coercive structures, consolidated fiscal systems, and professionalized bureaucratic institutions. Enhanced state capacity, in turn, accelerated economic growth by expanding the provision of public goods critical to the effective functioning of markets, such as the rule of law, security, and basic infrastructure (Besley and Persson Reference Besley and Persson2010; Johnson and Koyama Reference Johnson and Koyama2017). Before wars built states, moreover, they built cities. Dincecco and Onorato (Reference Dincecco and Onorato2017) highlight how the vulnerability of rural populations to conflict drove migration to increasingly fortified urban settlements from the medieval period onward, which fueled development by strengthening self-governance and property rights protection and encouraging technological innovation, human capital accumulation, and economic agglomeration.
At the same time, it is important to recognize the limits of the “war made the state and city” analogy. First, early modern Eastern Europe was dominated by a small number of sizable polities whose existence was not threatened by slave-raiding. Tatars sought to neither conquer nor occupy territory, lacking the numbers and firepower necessary to succeed in conventional battle (Gliwa Reference Gliwa2016). Bellicist theories suggest that “raiding wars” are unlikely to deliver a strong stimulus to state-building, though evidence for this implication has largely been confined to Sub-Saharan Africa (e.g., Dincecco, Fenske, and Onorato Reference Dincecco, Fenske and Onorato2019). Second, population mobility and urban autonomy were comparatively limited in Eastern Europe. The institutionalization of serfdom—eradicated in Western Europe following the Black Death—bound peasants to hereditary plots of land, and most cities were legally private entities owned by noblemen, the church, or the monarch, to whose needs they were subordinated (Bogucka Reference Bogucka1996, 325; Kollman Reference Kollman2017, 238).Footnote 33 Rather than fostering urban self-governance, slave raids strengthened the state’s incentives to dominate and extract tax revenues from cities, ends to which the deployment of military forces served as a key means. As a result of these differences, the stimulus to state-building, urbanization, and long-run development delivered by slave-raiding in Eastern Europe exhibited a more localized and “top-down” character than that provided by interstate warfare in Western Europe.
SLAVE RAIDS AND URBAN POPULATION GROWTH
We begin our empirical investigation by examining the relationship between exposure to slave raids and urban population growth in Eastern Europe. We focus on this outcome for three reasons. First, as cities have historically depended on high levels of agricultural productivity and economic specialization, their size is widely considered a key indicator of development in the early modern period (De Long and Shleifer Reference De Long and Shleifer1993). Second, it is the only such indicator available for the whole of Eastern Europe before, during, and after the Black Sea slave trade. Third, it provides a direct test of our claim that defensive state-building encouraged the expansion of urban communities in raided areas.
Data and Empirical Strategy
Our analysis combines the compendium of slave raids introduced earlier with the European Urban Population, 700–2,000 database compiled by Buringh (Reference Buringh2021). The latter source, which updates and expands Bairoch, Batou, and Pierre’s (Reference Bairoch, Batou and Chèvre1988) seminal population tables using recent archaeological and demographic research, records the number of inhabitants (in thousands) in 550 urban settlements across 23 Eastern European countries—24% of which were raided at least once—at one-century intervals from 700 to 1500 and at half-century intervals from 1500 to 2000.Footnote 34 Bairoch, Batou, and Pierre include all settlements with 5,000 or more inhabitants at some point between 800 and 1800; Buringh adds those with at least 1,000 inhabitants in 700, at least 100,000 inhabitants in 2000, and capital city status in 2000.Footnote 35 While its relatively infrequent reporting intervals inhibit our ability to detect short-run population losses caused by raids, the database paints a reasonably comprehensive and precise picture of European urban demographic trends over the long run.
Figure 3 plots the average population of raided settlements and non-raided settlements between 1100 and 1900 (leaving at least a century before and after the slave trade). Over the three centuries preceding the slave trade, population evolved similarly in the two types of settlements, whose means are indistinguishable in a two-sample t-test. Once the slave trade begins, however, raided settlements exhibit consistently faster population growth than non-raided settlements, with the difference in means becoming statistically significant from 1550 onward. By 1900, the mean population of raided settlements (51,238) was more than 50% higher than that of non-raided settlements (33,411). Descriptive trends thus furnish initial plausibility for our expectations.
Mean Population of Raided and Non-Raided Settlements in Eastern Europe, 1100–1900
Note: Mean population (in thousands) of raided and non-raided urban settlements in Eastern Europe between 1100 and 1900; p-values are from a two-sample t-test of the difference in means between the two sets of settlements. The lower panel displays the total number of raids per year.

To analyze the impact of exposure to raids on settlement population, we adopt a difference-in-differences strategy that compares the average change in the population of raided and non-raided settlements after the onset of raids. Our baseline specification can be expressed as
 $$ \log \left({P}_{st}\right)=\alpha +\beta {R}_{st}+{\gamma}_s+{\delta}_t+{\varepsilon}_{st}, $$
where $ {P}_{st} $
, the outcome variable, is the population of settlement
$ {P}_{st} $
, the outcome variable, is the population of settlement $ s $
(in thousands) in period
$ s $
(in thousands) in period $ t $
;Footnote 36
$ t $
;Footnote 36 $ {R}_{st} $
, the treatment variable, is an indicator for whether
$ {R}_{st} $
, the treatment variable, is an indicator for whether $ s $
has been raided as of
$ s $
has been raided as of $ t $
; and
$ t $
; and $ {\gamma}_s $
and
$ {\gamma}_s $
and $ {\delta}_t $
denote settlement and period fixed effects, respectively.Footnote 37 We cluster heteroskedasticity-robust standard errors at the settlement level. To examine how the treatment effect evolves over time, we additionally estimate a “dynamic” version of Equation 1 that interacts
$ {\delta}_t $
denote settlement and period fixed effects, respectively.Footnote 37 We cluster heteroskedasticity-robust standard errors at the settlement level. To examine how the treatment effect evolves over time, we additionally estimate a “dynamic” version of Equation 1 that interacts $ {R}_{st} $
with
$ {R}_{st} $
with $ {\delta}_t $
, including leads of
$ {\delta}_t $
, including leads of $ {R}_{st} $
during the pretreatment phase (one lead for every period before 1500) as a placebo test (Sun and Abraham Reference Sun and Abraham2021).Footnote 38
$ {R}_{st} $
during the pretreatment phase (one lead for every period before 1500) as a placebo test (Sun and Abraham Reference Sun and Abraham2021).Footnote 38
Provided that the population of raided and non-raided settlements would have followed the same trajectory in the absence of the slave trade, $ \beta $
in Equation 1 identifies the average effect of raid exposure on settlement population during the sample period. While Figure 3 is consistent with this pattern, a visual comparison of outcome means for treated and untreated units does not shed direct light on the parallel trends assumption because it fails to account for potentially confounding variables.Footnote 39 Building on a growing methodological literature (Roth et al. Reference Roth, Pedro, Bilinski and Poe2023), we instead assess the plausibility of this assumption through an event study specification that analyzes the treatment effect’s evolution before and after initial exposure to raids:
$ \beta $
in Equation 1 identifies the average effect of raid exposure on settlement population during the sample period. While Figure 3 is consistent with this pattern, a visual comparison of outcome means for treated and untreated units does not shed direct light on the parallel trends assumption because it fails to account for potentially confounding variables.Footnote 39 Building on a growing methodological literature (Roth et al. Reference Roth, Pedro, Bilinski and Poe2023), we instead assess the plausibility of this assumption through an event study specification that analyzes the treatment effect’s evolution before and after initial exposure to raids:
 $$ \log \left({P}_{st}\right)=\alpha +\sum \limits_{j=-8}^8{\beta}_j{D}_{s,t-j}+{\gamma}_s+{\delta}_t+{\varepsilon}_{st}, $$
where $ {D}_{s,t-j} $
is an indicator for period
$ {D}_{s,t-j} $
is an indicator for period $ j $
relative to the first raid on settlement
$ j $
relative to the first raid on settlement $ s $
as of period
$ s $
as of period $ t $
(meaning that this raid occurred
$ t $
(meaning that this raid occurred $ j $
periods before
$ j $
periods before $ t $
).Footnote 40 Following common practice, we specify the period before the first raid as the reference for estimating treatment effects (by setting
$ t $
).Footnote 40 Following common practice, we specify the period before the first raid as the reference for estimating treatment effects (by setting $ {\beta}_{-1} $
to 0). To avoid inferential problems arising from treatment effect heterogeneity, we supplement this specification with three alternative event study estimators that exclude potentially problematic comparisons between already-treated units: Sun and Abraham’s (Reference Sun and Abraham2021) interaction-weighted estimator, which compares treated units with never-treated or last-to-be-treated units; Liu, Wang, and Xu’s (Reference Liu, Wang and Xu2024) imputation-based estimator, which imputes counterfactual outcomes for treated units; and Callaway and Sant’Anna’s (Reference Callaway and Sant’Anna2021) doubly-robust estimator, which specifies never-treated or not-yet-treated units as the comparison group. In all models, robust standard errors remain clustered by settlement.
$ {\beta}_{-1} $
to 0). To avoid inferential problems arising from treatment effect heterogeneity, we supplement this specification with three alternative event study estimators that exclude potentially problematic comparisons between already-treated units: Sun and Abraham’s (Reference Sun and Abraham2021) interaction-weighted estimator, which compares treated units with never-treated or last-to-be-treated units; Liu, Wang, and Xu’s (Reference Liu, Wang and Xu2024) imputation-based estimator, which imputes counterfactual outcomes for treated units; and Callaway and Sant’Anna’s (Reference Callaway and Sant’Anna2021) doubly-robust estimator, which specifies never-treated or not-yet-treated units as the comparison group. In all models, robust standard errors remain clustered by settlement.
RESULTS
Column 1 of Table 1 reports the estimated treatment effect from the baseline difference-in-differences specification ( $ \beta $
in Equation 1). Consistent with a raid-induced boost in urban population, the coefficient on the treatment indicator is positive and statistically significant at the 1% level. Exponentiating this coefficient indicates that, on average, exposure to raids is associated with a 26% increase in population between 1500 and 1900.
$ \beta $
in Equation 1). Consistent with a raid-induced boost in urban population, the coefficient on the treatment indicator is positive and statistically significant at the 1% level. Exponentiating this coefficient indicates that, on average, exposure to raids is associated with a 26% increase in population between 1500 and 1900.
Slave Raids and Urban Population Growth: Difference-in-Differences Estimates

Note: Difference-in-differences estimates of the impact of exposure to slave raids on the logged population (in thousands) of 550 Eastern European urban settlements over 13 periods between 1100 and 1900. Robust standard errors, clustered by settlement, in parentheses; Conley standard errors (cutoff = 500 kilometers) in brackets. * $ p<0.1 $
; **
$ p<0.1 $
; ** $ p<0.05 $
; ***
$ p<0.05 $
; *** $ p<0.01 $
.
$ p<0.01 $
.
Estimates from the dynamic difference-in-differences specification are displayed in the left panel of Figure 4 (with 95% confidence intervals). After remaining small and nonsignificant throughout the pretreatment phase, the coefficient on treatment indicator rises sharply during the first 150 years of the slave trade, attaining significance at the 5% level from 1550 onward. It then remains relatively stable for the rest of the slave trade, before surging once more in the nineteenth century. Exposure to raids is associated with growth in urban population of 5% ( $ p $
= 0.47) by 1500, 29% by 1700 (
$ p $
= 0.47) by 1500, 29% by 1700 ( $ p $
= 0.00), and 46% (
$ p $
= 0.00), and 46% ( $ p $
= 0.00) by 1900.
$ p $
= 0.00) by 1900.
Urban Population Analysis: Evolution of Treatment Effect Over Time
Note: Dynamic difference-in-differences (left panel) and event study (right panel) estimates of the impact of exposure to slave raids on the logged population (in thousands) of 550 Eastern European urban settlements over 13 periods between 1100 and 1900. All models include settlement and period fixed effects. Bars represent 95% confidence intervals based on robust standard errors clustered by settlement.

The right panel of Figure 4 presents the event study estimates, as computed by the two-way fixed effects (Equation 2), Sun and Abraham (Reference Sun and Abraham2021), Liu, Wang, and Xu (Reference Liu, Wang and Xu2024), and Callaway and Sant’Anna (Reference Callaway and Sant’Anna2021) estimators. With every approach, there is support for the parallel trends assumption: the coefficient on the treatment time indicator ( $ {D}_{s,t-j} $
) is statistically indistinguishable from 0 in every period before the onset of raids. During the treatment phase, it evolves in a similar manner to the left panel’s difference-in-differences term, growing briskly in the first three periods, leveling off over the next three periods, and then increasing again. According to the two-way fixed effects estimates, settlement population rises by 4% in the (50- or 100-year) period in which raids first occur, 21% in the third period, 30% in the fifth period, and 37% in the eighth period.Footnote 41
$ {D}_{s,t-j} $
) is statistically indistinguishable from 0 in every period before the onset of raids. During the treatment phase, it evolves in a similar manner to the left panel’s difference-in-differences term, growing briskly in the first three periods, leveling off over the next three periods, and then increasing again. According to the two-way fixed effects estimates, settlement population rises by 4% in the (50- or 100-year) period in which raids first occur, 21% in the third period, 30% in the fifth period, and 37% in the eighth period.Footnote 41
Robustness
The baseline results are robust to several alternative specifications, estimates from which are reported in either Table 1 or Section C of the Supplementary Material. First, we experiment with different timeframes for the analysis. The coefficient on raid exposure remains positive and highly significant when we restrict the treatment phase to the slave trade (column 2, Table 1). The same is true when we vary the sample’s start date between 900 and 1300 (at 100-year intervals) and its end date between 1650 and 1950 (at 50-year intervals) (Table A3 in the Supplementary Material).
Second, one might worry that there are time-varying, location-specific factors that affect both raid exposure and urban population growth. One plausible candidate is regular military conflict, which occurred throughout the slave trade (though rarely coincided with raids). Table A4 in the Supplementary Material shows that controlling for the cumulative number of conflicts during the slave trade within various radii of a settlement—measured by the Historical Conflict Event Dataset (Miller and Bakar Reference Miller and Bakar2023)—makes little difference to the results. Another possibility is that, due to their geographical position and high level of soil fertility, settlements nearer the Black Sea were more likely to benefit from trade and productive agriculture once Russia annexed them and heavy plows were adopted in the eighteenth century (Moon Reference Moon2013).Footnote 42 As documented in columns 3–6 of Table 1, however, the findings remain intact when we interact the period fixed effects with a settlement’s (1) longitude, (2) latitude, (3) soil fertility,Footnote 43 and (4) state in 1400.Footnote 44 They also survive restricting the sample to settlements within the 1400 borders of Russia, Poland, and Lithuania, which exclude most of the highly fertile Black Earth region (Table A5 in the Supplementary Material).
Third, to address the possibility that unobserved heterogeneity is correlated across proximate settlements, we reestimate the models in Table 1 with Conley standard errors, setting a distance cutoff of 500 kilometers (see bracketed estimates). Fourth, we cluster standard errors by state in 1490 instead of by settlement (Table A5 in the Supplementary Material). Fifth, rather than the conquest of Constantinople, we treat the dissolution of the Ulus of Jochi in 1502 as the starting point of the early modern Black Sea slave trade (Table A5 in the Supplementary Material).
Finally, the results could reflect raid-induced migration from small towns and villages that are not covered by the European Urban Population database to the more populous settlements that do feature. While this possibility cannot be ruled out, one would not expect people fleeing raids to move disproportionately to other raided settlements—unless such settlements were in the process of fortifying themselves, in which case this pattern could be considered evidence for our hypothesized defensive state-building mechanism. Moreover, within the European Urban Population sample, there is no evidence that larger raided settlements enjoyed faster population growth than smaller ones during the slave trade. As shown in Table A6 in the Supplementary Material, when we interact the treatment indicator with the logarithm of a settlement’s population in 1400, the coefficient on the resulting term is small, negative, and nonsignificant. Nor, Table A7 in the Supplementary Material indicates, were larger settlements more likely to be raided in the first place: controlling for period fixed effects, population in 1400 is a weak predictor of exposure to raids.
Extensions
Analyzing Raid Intensity
As well as discrete exposure to slave raids, we might wonder how differences in raid intensity impact urban population. To explore this question, we convert Equation 1 to a continuous difference-in-differences specification by replacing $ {R}_{st} $
with the logarithm of cumulative (1) raids on and (2) captives taken from settlement
$ {R}_{st} $
with the logarithm of cumulative (1) raids on and (2) captives taken from settlement $ s $
in period
$ s $
in period $ t $
.Footnote 45 The results, presented in columns 1 and 2 of Table 2, indicate that settlement population rises with both continuous treatments. For every 1% increment in cumulative raids and captives, population grows by 0.14% and 0.03%, respectively.
$ t $
.Footnote 45 The results, presented in columns 1 and 2 of Table 2, indicate that settlement population rises with both continuous treatments. For every 1% increment in cumulative raids and captives, population grows by 0.14% and 0.03%, respectively.
Urban Population Analysis: Variation in Raid Intensity

Note: Difference-in-differences estimates of the impact of logged cumulative slave raids (column 1), logged cumulative captives (column 2), and exposure to varying numbers of raids (column 3) on the logged population (in thousands) of 550 Eastern European urban settlements observed over 13 periods between 1100 and 1900. Robust standard errors, clustered by settlement, in parentheses; Conley standard errors (cutoff = 500 kilometers) in brackets. * $ p<0.1 $
; **
$ p<0.1 $
; ** $ p<0.05 $
; ***
$ p<0.05 $
; *** $ p<0.01 $
.
$ p<0.01 $
.
A related question is whether the treatment effect varies with the number of raids on a settlement. In column 3 of Table 2, we convert $ {R}_{st} $
into a series of indicators for whether settlement
$ {R}_{st} $
into a series of indicators for whether settlement $ s $
has been raided once, 2–5 times, 6–10 times, and more than 10 times as of period
$ s $
has been raided once, 2–5 times, 6–10 times, and more than 10 times as of period $ t $
. The treatment effect steadily grows with raid intensity, only falling short of significance for settlements raided once: the coefficients on the indicators for 2–5 raids, 6–10 raids, and more than 10 raids imply an average population boost of 30%, 35%, and 45%, respectively.
$ t $
. The treatment effect steadily grows with raid intensity, only falling short of significance for settlements raided once: the coefficients on the indicators for 2–5 raids, 6–10 raids, and more than 10 raids imply an average population boost of 30%, 35%, and 45%, respectively.
Grid Cell Analysis
An alternative strategy for addressing concerns about using urban settlements as the unit of observation is to reformat the European Urban Population data within a two-dimensional grid of square polygon cells, which are fixed in time and space and hence exogenous to features of interest. We overlay Eastern Europe with the PRIO-GRID (Tollefsen, Strand, and Buhaug Reference Tollefsen, Strand and Buhaug2012), a vector grid network with a resolution of 0.5° $ \times $
0.5° (roughly 50 km
$ \times $
0.5° (roughly 50 km $ \times $
50 km at the equator), creating a grid-cell-period-level dataset containing 3,905 cells and 74,195 observations. We then adapt Equation 1 to the grid cell level, regressing the logarithm of grid cell
$ \times $
50 km at the equator), creating a grid-cell-period-level dataset containing 3,905 cells and 74,195 observations. We then adapt Equation 1 to the grid cell level, regressing the logarithm of grid cell $ g $
‘s total urban population in period
$ g $
‘s total urban population in period $ t $
(
$ t $
( $ {P}_{gt} $
) on an indicator for whether
$ {P}_{gt} $
) on an indicator for whether $ g $
has been raided as of
$ g $
has been raided as of $ t $
(
$ t $
( $ {R}_{gt} $
) plus grid cell (
$ {R}_{gt} $
) plus grid cell ( $ {\omega}_g $
) and period (
$ {\omega}_g $
) and period ( $ {\delta}_t $
) fixed effects.Footnote 46 The results, shown in Table A8 in the Supplementary Material, are consistent with the settlement-level findings, indicating that raid exposure was accompanied by a 47.4% rise in a grid cell’s urban population.
$ {\delta}_t $
) fixed effects.Footnote 46 The results, shown in Table A8 in the Supplementary Material, are consistent with the settlement-level findings, indicating that raid exposure was accompanied by a 47.4% rise in a grid cell’s urban population.
The gridded data format allows us to explore two additional issues of interest. The first is whether, as our argument suggests, slave-raiding led to the establishment of new towns and cities. To address this question, we replace $ {P}_{gt} $
with the number of urban settlements in
$ {P}_{gt} $
with the number of urban settlements in $ g $
as of period
$ g $
as of period $ t $
with (1) any inhabitants, (2) at least 5,000 inhabitants, and (3) at least 10,000 inhabitants. The treatment effect is positive and significant for all three outcomes (Table A8 in the Supplementary Material). Second, did the demographic impact of raids “spill over” to nearby settlements, whether due to migration, trade, or economic agglomeration? When we add the lagged mean of
$ t $
with (1) any inhabitants, (2) at least 5,000 inhabitants, and (3) at least 10,000 inhabitants. The treatment effect is positive and significant for all three outcomes (Table A8 in the Supplementary Material). Second, did the demographic impact of raids “spill over” to nearby settlements, whether due to migration, trade, or economic agglomeration? When we add the lagged mean of $ {R}_{gt} $
across all grid cells within 0.5°, 1°, and 2° of
$ {R}_{gt} $
across all grid cells within 0.5°, 1°, and 2° of $ g $
’s latitude and longitude as regressors, the coefficients on these terms are large, positive, and significant at the 1% level, providing strong evidence of spillover effects (Table A9 in the Supplementary Material).
$ g $
’s latitude and longitude as regressors, the coefficients on these terms are large, positive, and significant at the 1% level, providing strong evidence of spillover effects (Table A9 in the Supplementary Material).
Alternative Data Sources
Finally, the findings are robust to the use of two alternative sources of time-series data on urban population, one covering the whole of Europe (Table A10 in the Supplementary Material) and the other focusing on East-Central Europe (Table A11 in the Supplementary Material). The first is the Database of City Populations from around the World over Time (Biguzzi Reference Biguzzi2020), which has a comparable geographical and temporal scope to the European Urban Population database but includes 119 fewer settlements in Eastern Europe and lacks detailed documentation on sourcing and methodology (or an associated peer-reviewed article). The second is Miller’s (Reference Miller2008) dataset on the population of 95 cities in the Lands of the Bohemian Crown, the Poland–Lithuanian Commonwealth, and the Kingdom of Hungary, which is measured at four points between 1500 and 1650.Footnote 47
LONG-RUN DEVELOPMENT IN IMPERIAL RUSSIA AND AUSTRIA
The second stage of our empirical investigation considers a wider set of development outcomes available for districts of the Russian and Austrian Empires—which encompass the majority of raided locations—in the mid-nineteenth century. While interpretation of this examination is complicated by the temporal gap between the onset of slave raids and the measurement of these indicators—during which major political and economic changes occurred—it allows for a more comprehensive evaluation of the Black Sea slave trade’s developmental legacies.
Identification Strategy
In the absence of time-series data on our district-level development outcomes, a major inferential challenge is the possibility that the location of slave raids is endogenous to omitted determinants of development—or to development itself. It should be noted, however, that neither our urban population analysis nor historical accounts suggest that prosperous locations were a more attractive target; on the contrary, raiders were known to favor rural areas with weak defenses (Gliwa Reference Gliwa and Roşu2021, 197).
To address potential endogeneity in the geographical distribution of raids, we pursue an instrumental variables strategy that leverages natural topographical features affecting districts’ accessibility to raiders. Our approach is motivated by the observation that the trails used to conduct raids closely follow the boundaries between watershed zones—areas of highest elevation around lakes and river segments—enabling raiders to avoid deep ravines, marshland, steep slopes, and river crossings as well as discovery by enemy watchmen. A district’s proximity to watershed boundary lines should thus predict its accessibility to raiders with comparable precision to its distance from raiding trails. Since watershed zones solely reflect characteristics of the steppe terrain, however, they are more plausibly exogenous to long-run development and its correlates. We thus instrument a district’s exposure to raids with its minimum distance to Perekop or Akkerman—the typical starting points for raiding expeditions from the northern Black Sea coast—along a watershed boundary.Footnote 48
A key threat to the exclusion restriction is the potential for our instrument to impact development directly, for instance, because watershed boundaries overlap with historical trade routes connecting to the Black Sea coast or because proximity to Crimea correlates with soil fertility and favorable climatic conditions (Moon Reference Moon2013). There is no historical evidence to suggest that watershed boundaries served as conduits for trade; nor does this possibility seem likely, given that goods were usually transported via rivers, proximity to which we control for in our instrumental variables specification.Footnote 49 We also account for terrain ruggedness, soil fertility, temperature, and other climatic and topographical characteristics influencing agricultural potential. Our identifying assumption is that, conditional on these natural features, a district’s proximity to Perekop and Akkerman via the watershed boundary network only affects its long-run development through its exposure to raids.
As an alternative approach, we follow Blaydes and Paik (Reference Blaydes and Paik2021) and Matranga and Natkhov (Reference Matranga and Natkhov2022) by instrumenting raid exposure with distance to the geographically most efficient routes—or “least-cost paths”—between the starting points (Akkerman and Perekop) and destinations (Lviv and Moscow) of raiding trails. As detailed in Section E of the Supplementary Material, we construct nine such paths using an algorithm that minimizes cumulative resistance to the flow of water from one endpoint to the other, which generally increases with terrain gradient and decreases with elevation.Footnote 50 The advantage of this strategy is that least-cost paths provide a slightly closer approximation to raiding trails—which are less convoluted than watershed boundaries—increasing the instrument’s predictive power.
We implement these approaches using a two-stage least squares (2SLS) estimator. The first stage models a district’s aggregate exposure to raids as a function of the instrument plus a battery of controls:
 $$ \log \left({R}_d\right)={\varphi}_0+{\varphi}_1{L}_d+{\varphi}_{\mathbf{X}}{\mathbf{X}}_d^{\prime }+{\varepsilon}_d, $$
where $ {R}_d $
is the cumulative number of raids on district
$ {R}_d $
is the cumulative number of raids on district $ d $
over the course of the slave trade;
$ d $
over the course of the slave trade; $ {L}_d $
is
$ {L}_d $
is $ d $
’s minimum kilometer distance either to Crimea via watershed boundaries (main instrument) or to one of our nine least-cost paths (alternative instrument); and
$ d $
’s minimum kilometer distance either to Crimea via watershed boundaries (main instrument) or to one of our nine least-cost paths (alternative instrument); and $ {\mathbf{X}}_d^{\prime } $
is a vector of district-level controls described below. In the second stage, we regress a given development outcome on predicted values of
$ {\mathbf{X}}_d^{\prime } $
is a vector of district-level controls described below. In the second stage, we regress a given development outcome on predicted values of $ {R}_d $
and the same set of controls:
$ {R}_d $
and the same set of controls:
 $$ {Y}_d=\alpha +\hat{\beta \log \left({R}_d\right)}+{\psi}_{\mathbf{X}}{\mathbf{X}}_d^{\prime }+{\varepsilon}_d. $$
If the exclusion restriction holds, $ \beta $
captures the average change in
$ \beta $
captures the average change in $ {Y}_d $
resulting from a 1% increase in cumulative raids on a district due to the topographical characteristics captured by the instrument.
$ {Y}_d $
resulting from a 1% increase in cumulative raids on a district due to the topographical characteristics captured by the instrument.
Analysis of Imperial Russian Districts
We first apply our instrumental variables strategy to districts (uezdy) of Imperial Russia, which are mapped in Figure 5.Footnote 51 Drawing on data collected from imperial statistical volumes and administrative records by Dower et al. (Reference Dower, Finkel, Gehlbach and Nafziger2018), we construct three sets of outcome variables: (1) population (1863), logged urban and per square kilometers; (2) the number of markets (1867), logged and per square kilometers; and (3) the number of factories (1867), logged and per square kilometers. In both estimation stages, we control for several variables critical to the exclusion restriction’s plausibility: mean terrain ruggedness, computed with raster data from Shaver, Carter, and Shawa (Reference Shaver, Carter and Shawa2019); average annual precipitation and temperature seasonality, from the WorldClim 2 dataset (Fick and Hijmans Reference Fick and Hijmans2017); straight-line distance to the nearest river and coastline; soil fertility, as operationalized in the urban population analysis; the logarithm of urban population in 1400 (a proxy for pre-slave trade development), calculated using the European Urban Population data; the number of military conflicts during the slave trade, measured with the Historical Conflict Event Dataset; the logarithm of land area (in square kilometers); distance to Moscow; and an indicator for whether the district lay within Muscovy’s 1490 borders.Footnote 52
Distribution of Slave Raids in Imperial Russia and Austrian Galicia and Silesia
Note: Cumulative slave raids on locations within mid-nineteenth-century districts of (1) the Russian Empire, excluding Tatar khanates and territories under Ottoman control during the Black Sea slave trade, and (2) Austrian Galicia and Silesia.

Panel A in Table 3 reports second-stage 2SLS estimates and first-stage F-statistics (bottom row). As indicated by the latter, a district’s minimum distance to Perekop and Akkerman along a watershed boundary is a strong predictor of its exposure to raids. In the second stage, the coefficient on cumulative raids is positive for all six development outcomes, statistically significant for four, and close to significant for the remaining two. A 1% rise in aggregate raids is associated with 0.49% more urban inhabitants, 0.8% more markets, and 0.32% more factories. Per 100 square kilometes, this translates into an additional 7 inhabitants, 0.003 markets, and 0.007 factories.
Slave Raids and Development Outcomes in Imperial Russia and Austria: Instrumental Variables Estimates

Note: 2SLS estimates of the impact of slave raids, instrumented by minimum distance to Perekop or Akkerman along a watershed boundary line, on district-level development outcomes in mid-nineteenth century Russia (panel A) and Austrian Galicia and Silesia (panel B). All models control for urban population in 1400, land area, distance to the nearest river and coastline, soil fertility, terrain ruggedness, and cumulative military conflicts during the raiding period. In panel A, temperature seasonality, precipitation, and distance to Moscow are also included. Robust standard errors in parentheses; Conley standard errors (cutoff = 500 kilometers in panel A, 250 kilometers in panel B) in brackets. For full first- and second-stage results, see Tables A15–A17, Section E of the Supplementary Material. * $ p<0.1 $
; **
$ p<0.1 $
; ** $ p<0.05 $
; ***
$ p<0.05 $
; *** $ p<0.01 $
.
$ p<0.01 $
.
In Section E of the Supplementary Material, we confirm that estimating Equation 4 using observed rather than predicted values of cumulative raids—that is, substituting OLS for 2SLS—does not materially alter the results (panel A, Table A16 in the Supplementary Material). In addition, we demonstrate robustness to our alternative instrument, distance to nine least-cost paths from Akkerman and Perekop to Moscow and Lviv (panel A, Table A19 in the Supplementary Material).
Analysis of Austrian Galicia and Silesia
Another part of Eastern Europe for which rich local development data from the mid-nineteenth century have recently become available is the southern strip of the Polish-Lithuanian Commonwealth annexed by the Austrian Empire in the eighteenth century. This relatively small and homogeneous area comprised the Polish regions of Galicia and Silesia, whose 99 districts (Kreise) varied markedly in their exposure to slave raids (see Figure 5).
Using geocoded data gathered from censuses, historical maps, and satellite images by Kaim et al. (Reference Kaim, Szwagrzyk, Dobosz, Troll and Ostafin2021), we construct six outcome variables measuring the number and density of a district’s inhabitants (1857–69), houses (1840–63), and farm structures (1840–63). Following our earlier identification strategy, we regress these measures on the logarithm of cumulative slave raids on a district instrumented by its minimum distance to Akkerman or Perekop via a watershed boundary line. In both stages of the 2SLS specification, we include a similar set of controls to the Imperial Russia analysis.Footnote 53
The results are presented in Panel B of Table 3. The first-stage F-statistics (bottom row) again confirm that the instrument strongly predicts raid exposure. The second-stage estimates reveal a consistently positive treatment effect that reaches statistical significance for five of the six development outcomes. A 1% increment in cumulative raids raises a district’s population by 0.36%, its housing stock by 0.25%, and its number of farm structures by 0.04%, which amounts to 672 more inhabitants, 20 more houses, and 15 more farm structures per 100 square kilometers.
Once more, the results are robust both to using observed rather than predicted values of the treatment variable (panel B, Table A16 in the Supplementary Material) and to instrumenting cumulative raids with minimum distance to a least-cost path (panel B, Table A19 in the Supplementary Material).
The Defensive State-Building Mechanism
What explains the positive association between exposure to slave raids and long-run development in Eastern Europe? This section presents a selection of additional, more systematic evidence for our argument that raids stimulated economic growth by incentivizing states to strengthen defensive capacity in targeted areas—both by deploying military forces and by constructing permanent fortifications—and, to this end, consolidating fiscal and administrative capacity. Statistical results not reported in this section can be found in Section F of the Supplementary Material.
Poland–Lithuania
We begin by examining how military deployments and fiscal revenues responded to raiding activity in Poland–Lithuania. Drawing on data from the first half of the sixteenth century assembled by Łopatecki and Bołdyrew (Reference Łopatecki and Bołdyrew2024), Table A20 in the Supplementary Material shows that the number of military servicemen stationed in Red Ruthenia rose by 53%, on average, in years after the region was subjected to raids. A similar pattern characterizes the value of tax collections by the Polish and Lithuanian treasuries between 1588 and 1647—as recorded by Filipczak-Kocur (Reference Filipczak-Kocur2006)—following raids on the state.Footnote 54
Second, digitizing and geocoding data gathered by Adamczyk (Reference Adamczyk2004), we analyze the impact of raid exposure on the construction of five types of permanent fortifications—major castles, minor castles, fortified towns, fortified villages, and fortified churches—in southern provinces of Poland–Lithuania (mapped in Figure A11 in the Supplementary Material). As available construction dates are imprecise, we compute the density of each type of fortification per grid cell $ g $
at 50-year intervals between 1100 and 1800, focusing on the approximately rectangular (2,000 km
$ g $
at 50-year intervals between 1100 and 1800, focusing on the approximately rectangular (2,000 km $ \times $
1,500 km) area studied by Adamczyk.Footnote 55 We regress these measures on
$ \times $
1,500 km) area studied by Adamczyk.Footnote 55 We regress these measures on $ {R}_{gt} $
plus the logarithm of cumulative battles in
$ {R}_{gt} $
plus the logarithm of cumulative battles in $ g $
in
$ g $
in $ t $
, grid cell fixed effects (
$ t $
, grid cell fixed effects ( $ {\omega}_g $
), and period fixed effects (
$ {\omega}_g $
), and period fixed effects ( $ {\delta}_t $
). As reported in panel A of Table 4, raid exposure is positively and significantly related to the density of all five fortification types. On average, raided grid cells saw the construction of 1.25 more major castles, 0.44 more small castles, 0.79 more fortified towns, 0.04 more fortified villages, and 0.31 more fortified churches over the sample period.Footnote 56
$ {\delta}_t $
). As reported in panel A of Table 4, raid exposure is positively and significantly related to the density of all five fortification types. On average, raided grid cells saw the construction of 1.25 more major castles, 0.44 more small castles, 0.79 more fortified towns, 0.04 more fortified villages, and 0.31 more fortified churches over the sample period.Footnote 56
Slave Raids, Fortification Construction, and Castle Ownership in Poland–Lithuania: Difference-in-Differences Estimates

Note: Difference-in-differences estimates of the impact of exposure to slave raids on the construction of fortifications (panel A) and various measures of castle ownership (panel B) in Poland–Lithuania at the grid cell (0.5° x 0.5°) level. The sample comprises southern provinces from 1100 to 1800 in panel A and central and western provinces from 1300 to 1800 in panel B. Robust standard errors, clustered by grid cell, in parentheses; Conley standard errors (distance cutoff = 500 kilometers) in brackets. * $ p<0.1 $
; **
$ p<0.1 $
; ** $ p<0.05 $
; ***
$ p<0.05 $
; *** $ p<0.01 $
.
$ p<0.01 $
.
Third, we adopt a similar strategy to investigate whether states were more successful in establishing a monopoly on violence in raided areas, drawing on records of castle ownership in central and western Poland–Lithuania from the CASTLES dataset (Cappelen and Hariri Reference Cappelen and Hariri2022; Reference Cappelen and Hariri2024). For each grid cell in each half-century between 1300 and 1800, we measure the density and share of castles controlled by the crown and its representatives, which we regress on the same right-hand-side variables as in the previous analysis.Footnote 57 Panel B of Table 4 indicates that these outcomes exhibit a statistically significant rise in grid cells exposed to raids. Consistent with this finding, raid exposure has a positive but nonsignificant association with the density of castles controlled by non-crown actors, such as the nobility, the church, and external monarchs (column 8).Footnote 58
Russia
Next, we shift our focus to the Tsardom of Russia to study how slave-raiding impacted military and commercial activity in urban communities with the right to conduct commerce or industry (posady) (see Figure A13 in the Supplementary Material for a map). Digitizing and geocoding census statistics recorded at four intervals between 1646 and 1722 by Vodarskii (Reference Vodarskii and Shunkov1966), we measure five outcomes: the logarithm of military servicemen (sluzhilye) at (1) the household (dvor) level in 1650 and (2) the individual level in 1670–1680;Footnote 59 and the logarithm of tax-paying traders and artisans (posadskie) at the household level in (3) 1646 and (4) 1670–1680 and (5) 1722.Footnote 60 Extending the instrumental variables strategy employed in the previous section, we find that the cumulative number of raids on an urban community is positively associated with its population of military servicemen but negatively associated with its population of traders and artisans (see Table 5). Interestingly, however, the latter relationship is reversed by the early eighteenth century, with the coefficient on the instrumented raids treatment becoming positive but not significant.Footnote 61
Slave Raids, Defensive State Capacity, and Commercial Activity in Russian Urban Communities: Instrumental Variables Estimates

Note: 2SLS estimates of the impact of slave raids, instrumented by minimum distance to Perekop and Akkerman along a watershed boundary line, on the population of military servicemen and traders and artisans in Russian urban communities (posady) between 1646 and 1722. All models control for minimum distance to a river and to a coastline, date of founding or first mention, soil fertility, distance to Moscow, and inclusion in Muscovy’s 1490 borders. Robust standard errors in parentheses; Conley standard errors (distance cutoff = 500 kilometers) in brackets. For full results, see Table A24, Section F of the Supplementary Material. * $ p<0.1 $
; **
$ p<0.1 $
; ** $ p<0.05 $
; ***
$ p<0.05 $
; *** $ p<0.01 $
.
$ p<0.01 $
.
The urban communities data also allow us to probe our argument’s implication that strengthening defensive capacity promoted development by fostering a more secure environment for economic activity. Table A26 in the Supplementary Material reveals that, holding constant the number of traders and artisans in 1646 as well as the controls from Table 5, communities with larger contingents of military servicemen in the seventeenth century boasted significantly larger commercial populations in 1722. In other words, exposure to raids appears to have bolstered military presence before fueling an expansion in commercial activity at the local level.
Additional Evidence on Earnings
Finally, our argument suggests that investments in defensive capacity contributed to development by boosting demand for goods and services in raided localities. Partial evidence for this channel is provided by annual data on earnings by building craftsmen and laborers—an important part of the early modern workforce—in nine Central and Eastern European cities between 1393 and 1913 compiled by Allen (Reference Allen2001). According to difference-in-differences estimates presented in Table A27 in the Supplementary Material, exposure to raids is positively and significantly related to the mean daily real wage received by these workers as well as to their distance from the poverty line (based on the cost of a representative basket of goods).Footnote 62
CONCLUSION
Despite its massive human toll and profound impact on the political and economic organization of a major geographical region over more than three centuries, the early modern Black Sea slave trade has received scant attention from social scientists. This is particularly surprising in light of its structural differences from the transatlantic slave trade, the main source of existing knowledge of how slave-raiding influences long-run development: raided states in Eastern Europe sought to neither integrate into nor gain advantage from the slave trade, suppressing slavery within their borders while pursuing alternative export opportunities that made intensive use of labor. We have argued that these differences fundamentally altered how Eastern European rulers and elites responded to raids, incentivizing them to curtail population losses and secure their borders through a strategy of defensive state-building that, over the long run, created favorable conditions for trade, investment, and settlement in affected areas.
We have sought to evaluate this hypothesis by assembling and examining the most comprehensive dataset on early modern slave raids in Eastern Europe. As well as painting a more precise geographical, temporal, and demographic picture of Eastern European slavery, our data revealed a strong positive association between exposure to raids and a host of long-run development outcomes. Using a difference-in-differences design, we began by showing that raided urban settlements were characterized by faster population growth than non-raided settlements during and after the slave trade. Leveraging a spatial instrumental variables strategy, we then found that more intensely raided districts of the Russian and Austrian Empires performed better on several additional development indicators from the mid-nineteenth century, including market, building, and population density. Finally, we probed the plausibility of our posited defensive state-building mechanism. In Poland–Lithuania, we provided evidence that raid exposure boosted military deployments, fiscal revenues, fortification construction, and the state’s monopoly on violence, as proxied by its ownership of castles. In Russia, meanwhile, we observed a stronger military presence in raided urban communities in the seventeenth century, which, in turn, predicted higher levels of commercial activity in the early eighteenth century.
The implications of our findings extend beyond Eastern Europe—and indeed West Africa. Transnational systems of commercial slavery have, at some point in history, operated in almost every corner of the globe (Sharman and Zarakol Reference Sharman and Zarakol2024). The Eastern European case suggests that the developmental consequences of such systems are contingent upon the structure of slave markets, in particular the extent to which raiding supply chains are supported by and embedded in local economic and social institutions. Even setting aside the transatlantic and Black Sea slave trades, structures of slave production have varied widely across regions and over time. In the early modern era, for example, slaves were procured from the Mediterranean basin, North Africa, and Central Asia, which often resisted and pursued defensive strategies against raiding activity, as well as from East Africa and Southeast Asia, where many local economies were built upon and sustained by slavery (Eltis and Engerman Reference Eltis, Engerman, Eltis and Engerman2011). We believe that a systematic investigation of slave production systems in these and other raided societies could yield important insights into the determinants of long-run differences in development, state capacity, and other significant political and economic outcomes.
SUPPLEMENTARY MATERIAL
To view supplementary material for this article, please visit http://doi.org/10.1017/S0003055426101439.
DATA AVAILABILITY STATEMENT
Research documentation and data that support the findings of this study are openly available at the American Political Science Review Dataverse: https://doi.org/10.7910/DVN/XF0NPN.
ACKNOWLEDGEMENTS
We are grateful to Wenyan Deng, Esteban Dominguez-Lash, BreAnne Fleer, Jared Kalow, A. Benjamín Muñoz Rojas, and Tyler Sagerstrom for research assistance; to Aleksander Bołdyrew, Christoffer Cappelen, Jacob Hariri, Karol Łopatecki, and Natalya Naumenko for sharing data; and to Sascha Becker, Lisa Blaydes, Ana Bracic, Eric Chaney, Jonathan Doucette, Jeffry Frieden, Scott Gehlbach, Andrzej Gliwa, Anna Grzymala-Busse, Jacob Hariri, In Song Kim, Nancy Kollman, Krzysztof Krakowski, Tomila Lankina, Sara Lowes, Noah Nathan, Agustina Paglayan, Şevket Pamuk, Steven Pfaff, Thomas Robinson, Emily Sellars, Jan Vogler, Yuhua Wang, Asger Mose Wingender, Noam Yuchtman, and audiences at the University of California, San Diego, the University of Copenhagen, the University of Essex, the University of Hamburg, the University of Konstanz, London School of Economics, the University of Michigan, New York University, the University of Oxford, Stanford University, Yale University, the University of Warwick, the Summer Workshop in the Economic History and Historical Political Economy of Eurasia, the Practices of Comparative-Historical Analysis Conference, the Annual Meeting of the American Political Science Association, and the Annual Conference of the European Political Science Association for valuable comments on previous drafts.
CONFLICT OF INTEREST
The authors declare no ethical issues or conflicts of interest in this research.
ETHICAL STANDARDS
The authors affirm this research did not involve human participants.


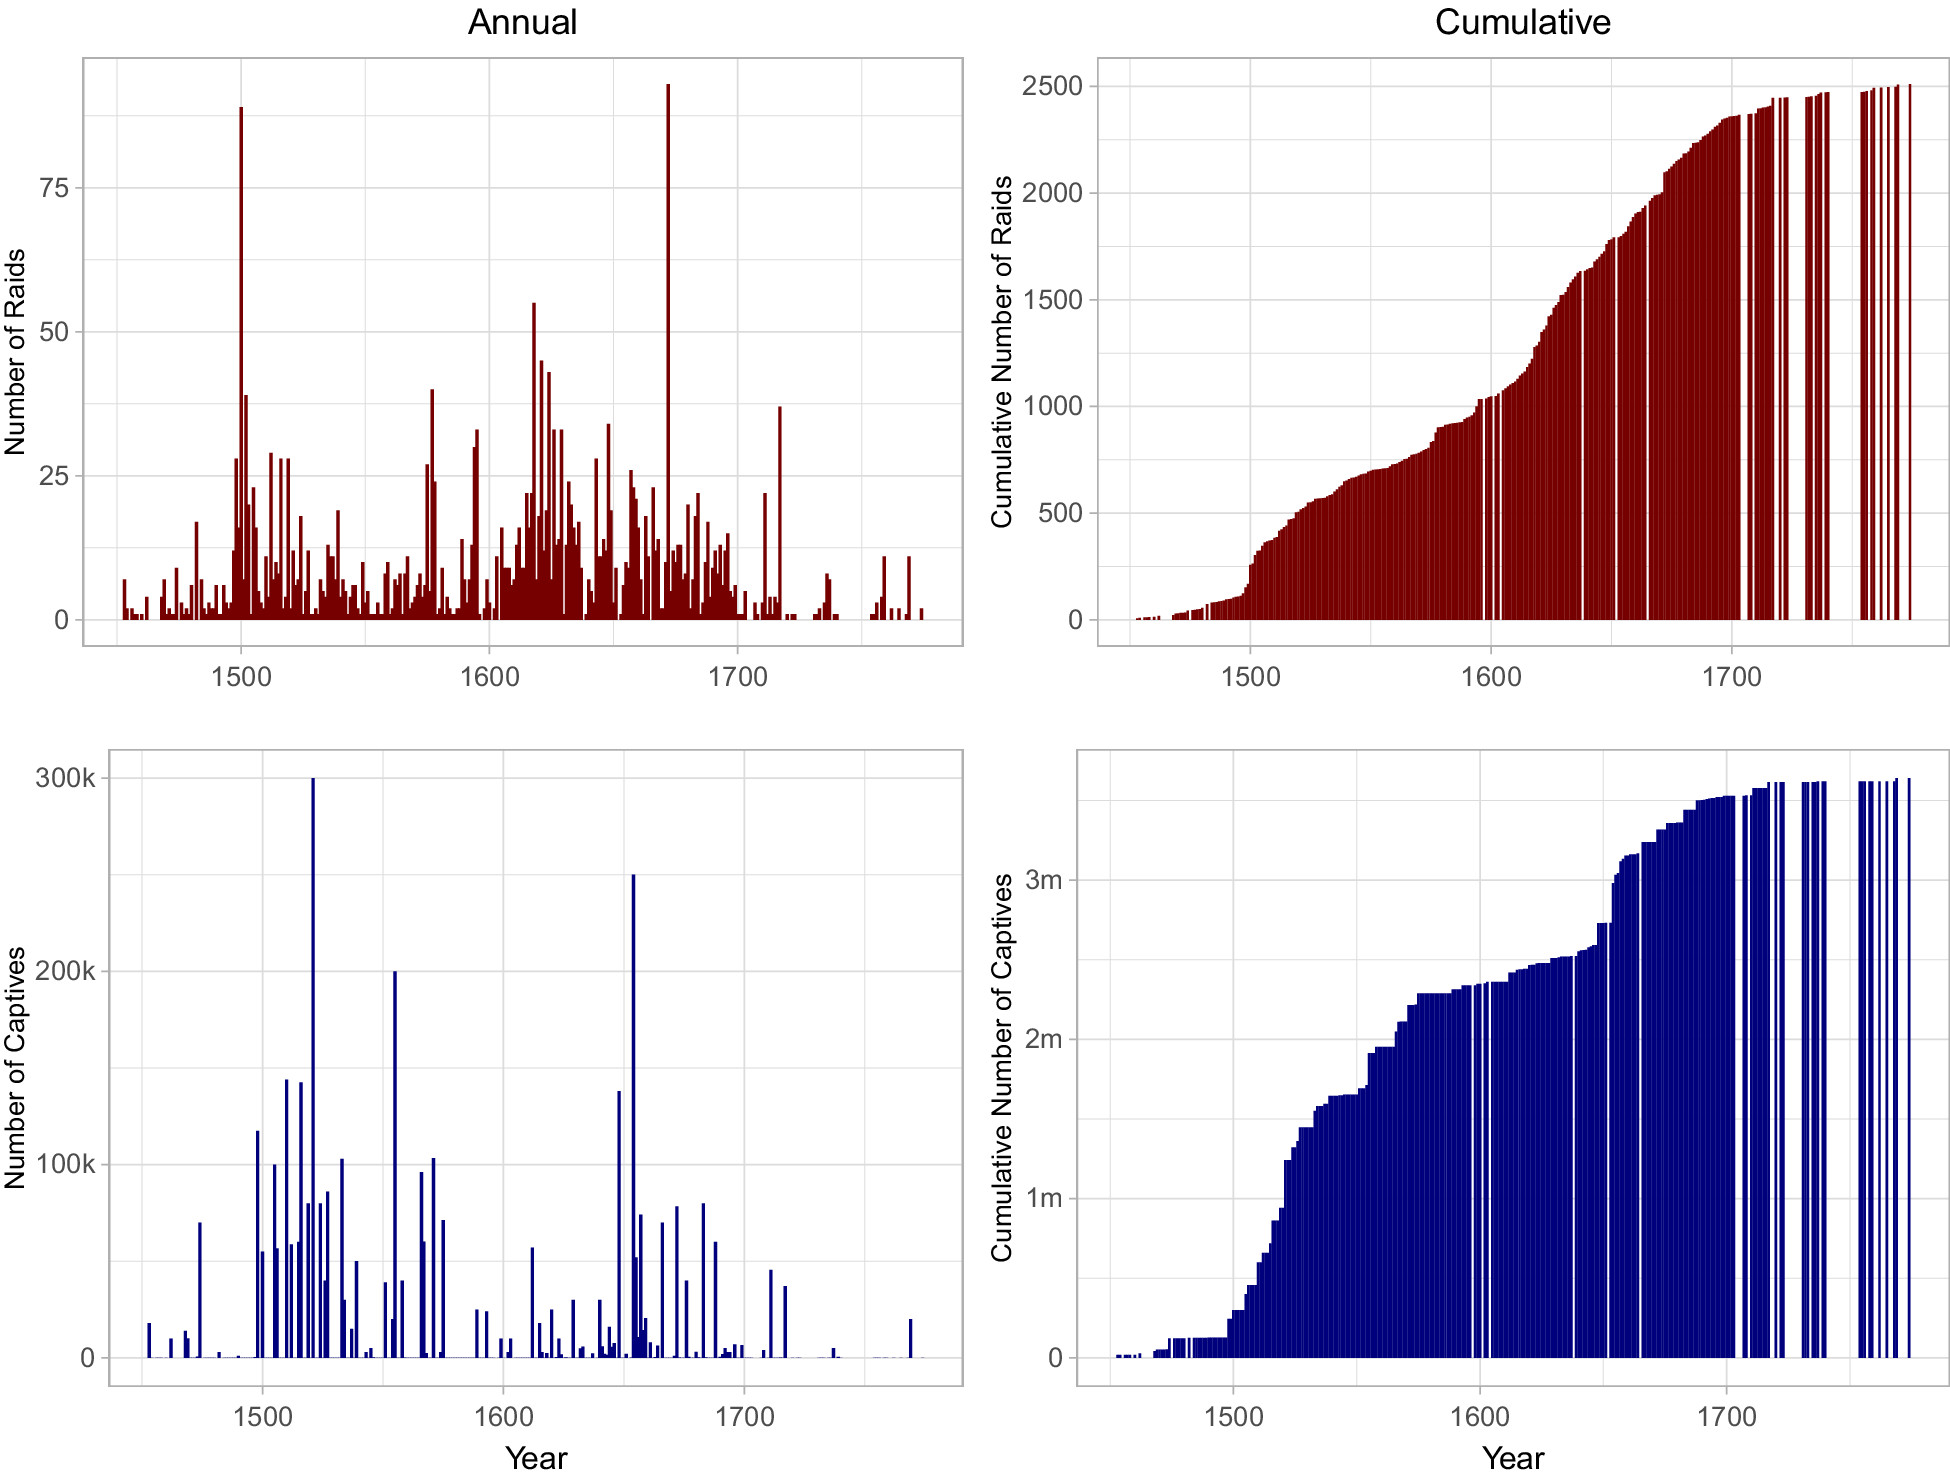

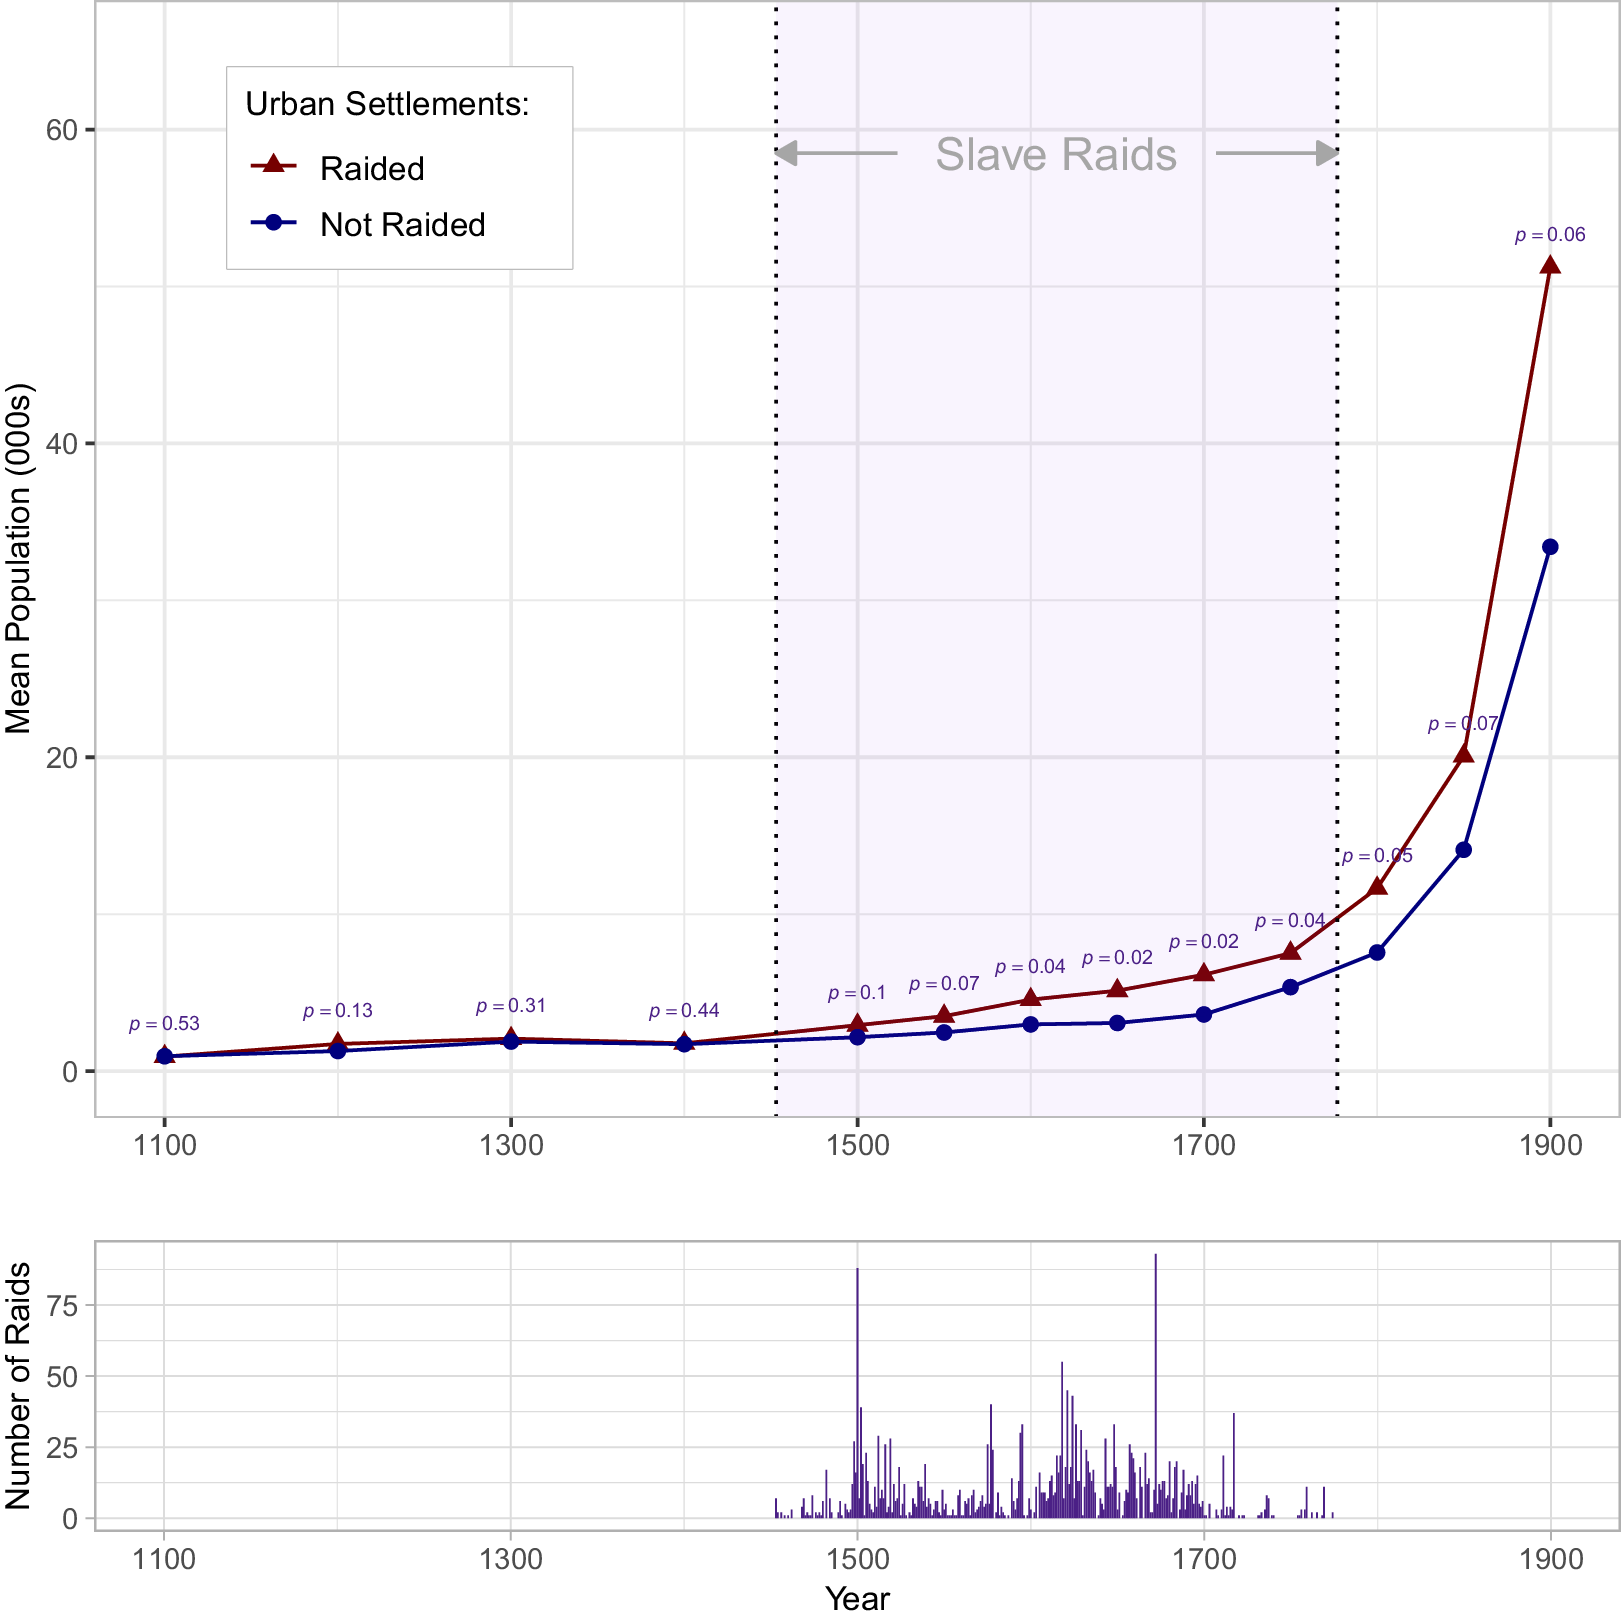
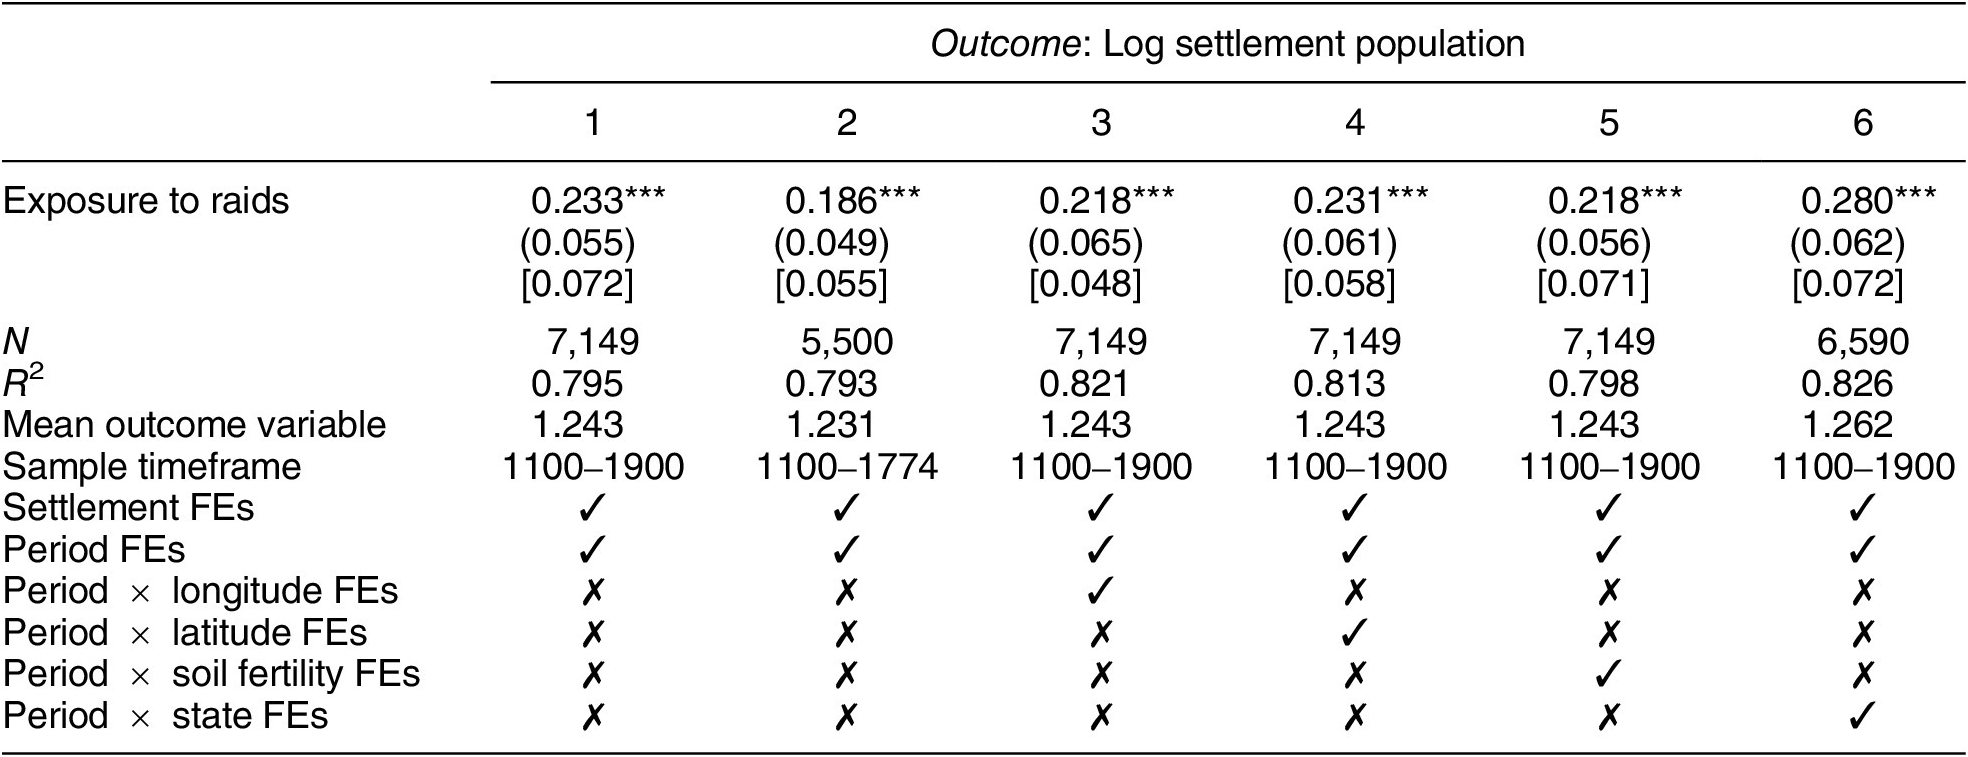

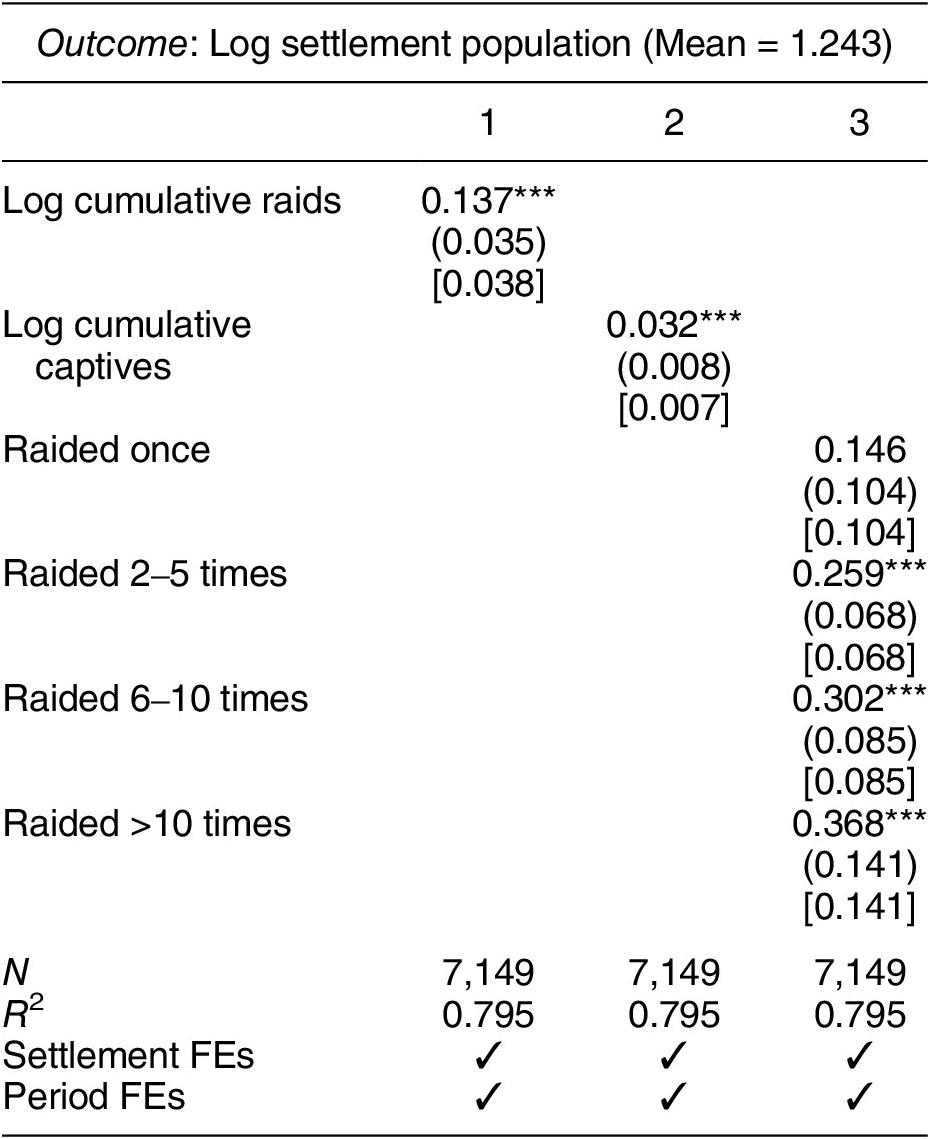

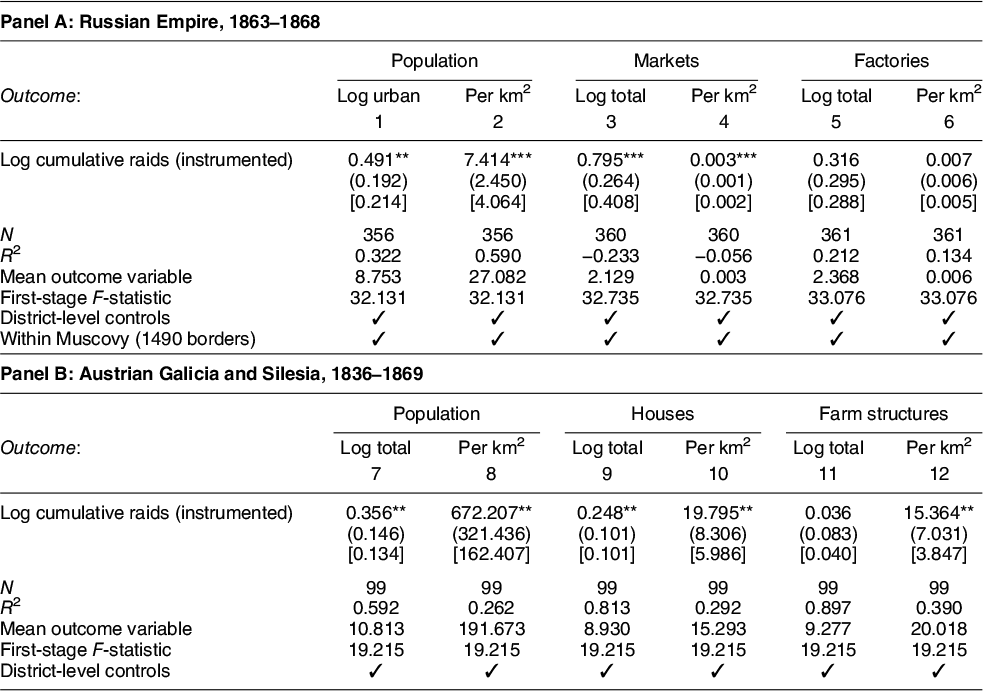
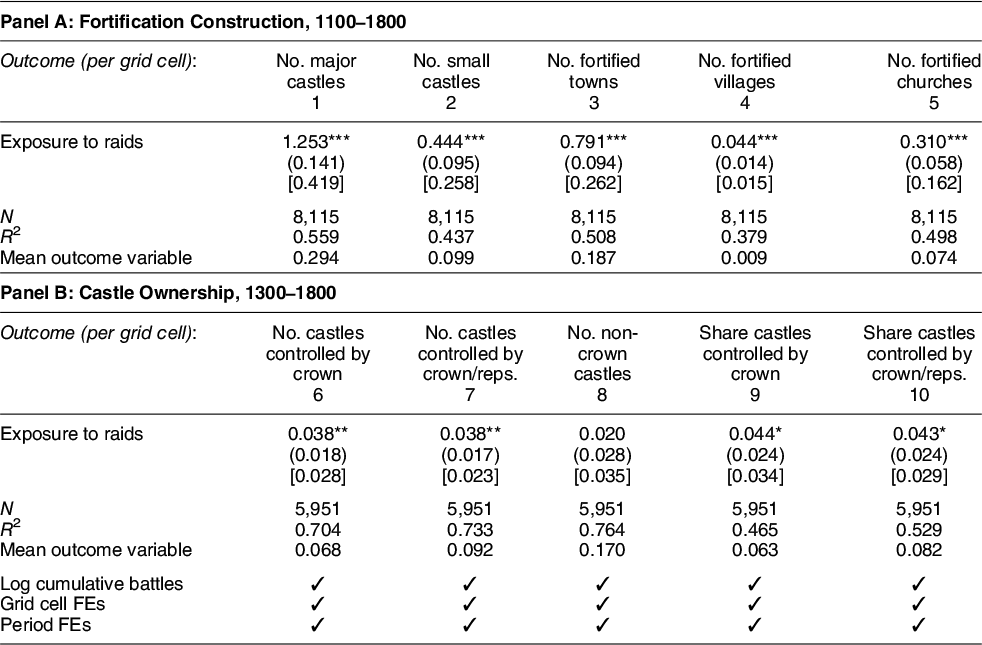
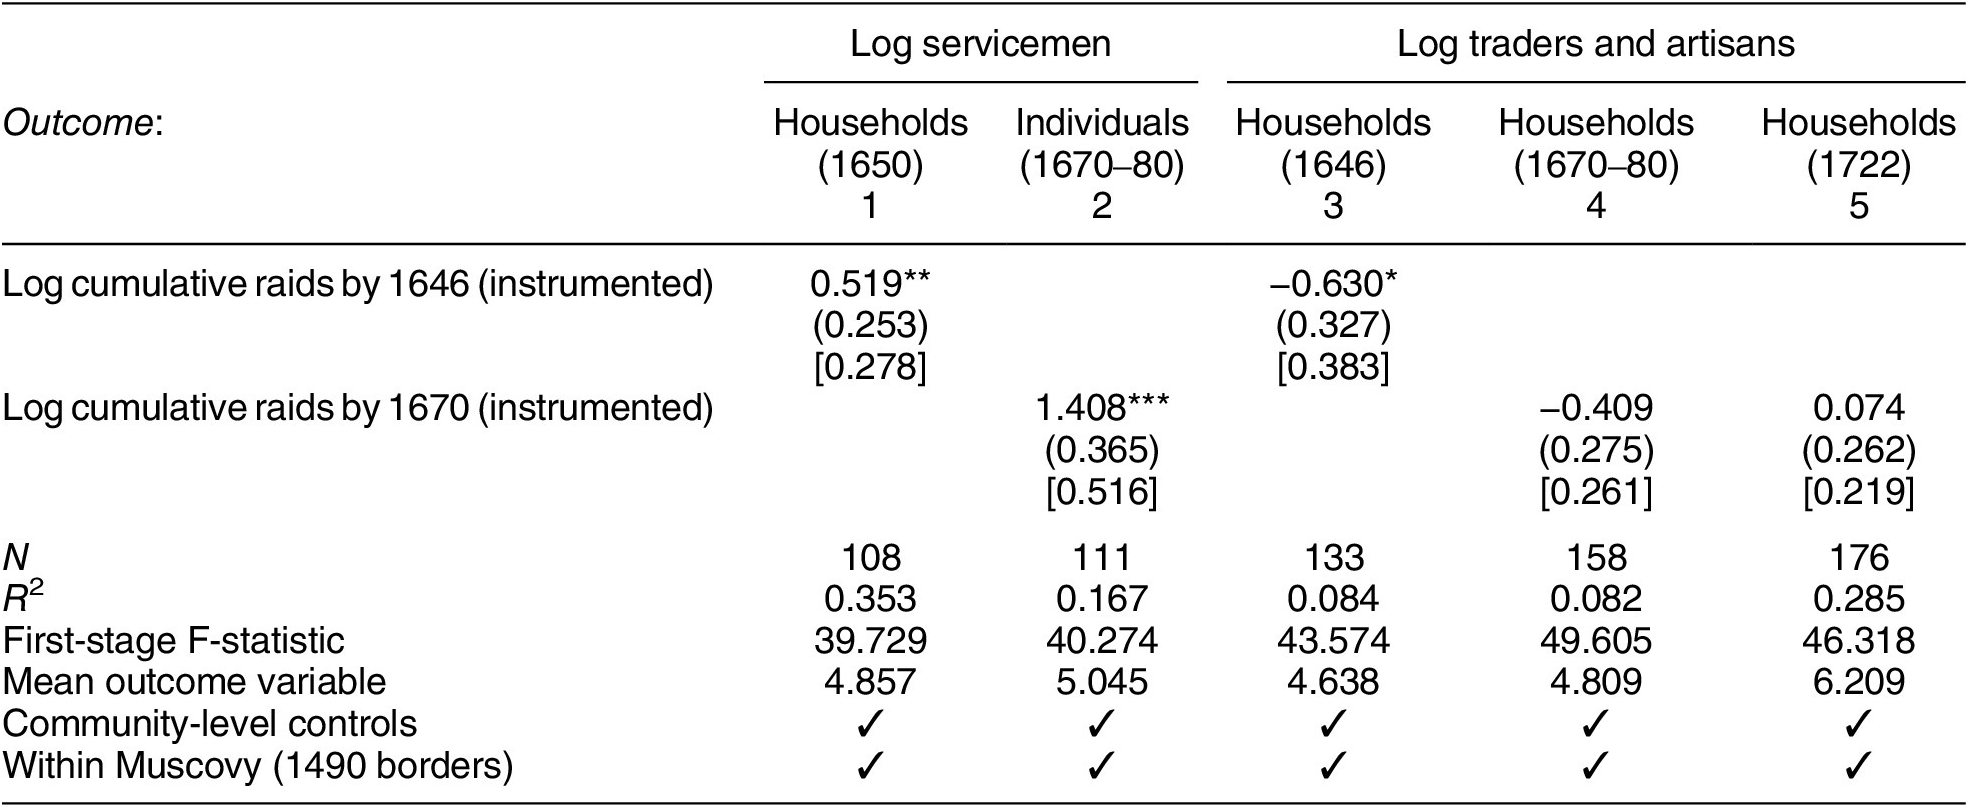


 Open access
Comments
No Comments have been published for this article.