


Caloric restriction is essential for weight loss in humans, but many barriers prevent individuals from adhering to a low-energy diet (e.g. cost, frustration and lack of support(Reference Vijan, Stuart and Fitzgerald1)). Interventions focussed on intentional caloric restriction only produce desired weight loss in 30 %–50 % of participants(Reference Franz, VanWormer and Crain2,Reference LeBlanc, Patnode and Webber3) . Thus, there is growing interest in alternative behavioural approaches that can potentially yield better results. Time-restricted eating (TRE) is a promising example that focuses on the restriction of meal timing rather than calories. Prior studies have shown that TRE (ad libitum intake during an 8–10 h window each day, followed by 14–16 h of fasting) aids weight loss by reducing eating occasions by 22 %(Reference Chow, Manoogian and Alvear4) and daily energy intake (EI) by ∼8 %–20 %(Reference Gabel, Hoddy and Haggerty5,Reference Wilkinson, Manoogian and Zadourian6) .
As with other areas of nutrition research, the assessment of EI is a key component of TRE research. Prior studies have used a range of techniques, from 7-d food diaries(Reference Gabel, Hoddy and Haggerty5) to retrospective estimations based on photo and text diaries(Reference Wilkinson, Manoogian and Zadourian6). These methods can be highly subjective, which is a common limitation when measuring EI(Reference Winkler7–Reference Dhurandhar, Schoeller and Brown9), sometimes entailing >30 % error(Reference Freedman, Commins and Moler10–Reference McClung, Ptomey and Shook12). Therefore, there is a need to investigate more accurate methods for assessing EI in TRE research.
One such promising method is the ‘intake-balance’ or ‘expenditure/balance’ method(Reference Schoeller13–Reference Ravelli and Schoeller16). This method infers EI from highly accurate measurements of net energy storage (ES) and energy expenditure (EE). Specifically, since the net ES (i.e. change in body composition over time) is defined as EI minus EE, it is possible to rearrange the equation and infer EI by summing the measured values of EE and net ES(Reference Ravelli and Schoeller16). Typically, EE is assessed via doubly labelled water, and net ES is assessed via dual X-ray absorptiometry (DXA). However, the use of doubly labelled water limits this approach due its cost-prohibitive, labor-intensive and highly technical nature. Thus, the standard intake-balance method has limited scalability for widespread use.
To improve the scalability of the intake-balance method, doubly labelled water could potentially be replaced with a surrogate EE measure, particularly an accelerometry-based method(Reference Shook, Hand and O’Connor17,Reference Shook, Yeh and Welk18) . Although some measurement errors would result from this change, the degree of error would potentially be lower than the errors observed with self-reported EI(Reference Murakami, Kawakami and Nakae19–Reference White, Westgate and Hollidge21). Thus, it is important to investigate the utility of accelerometer-based intake-balance methods, which has not been done in the setting of a TRE intervention, nor with open-source and research-grade accelerometry solutions that may also benefit other areas of nutrition research. Therefore, the purpose of this paper is to provide proof-of-concept for an accelerometer-based intake-balance method.
Experimental methods
Participants and ethical approval
This is a secondary analysis of data from a prior study, for which full methods have been presented elsewhere(Reference Chow, Manoogian and Alvear4). Participants were adults (aged 18–65 years) who were overweight or obese at baseline. This study was conducted according to the guidelines laid down in the Declaration of Helsinki, and all procedures involving human subjects/patients were approved by the Institutional Review Board of the University of Minnesota on March 21, 2017 (Project identification code number: 1701M06001). Use of the myCircadianClock app (Salk Institute) was approved by the Institutional Review Board at the Salk Institute for Biological Studies (Project identification code number: 15-0003). Written informed consent was obtained from all subjects/patients. The study is registered on ClinicalTrials.gov (#NCT03129581).
Study design/intervention
The intervention duration was 12 weeks with 2-week assessments beforehand (Pre) and during the final two intervention weeks (Post). All potential participants first underwent a screening procedure in which they were asked to document their food intake (i.e. meal timing and food type) for ≥ 1 week using a smartphone application (myCircadianClock). Those who had a daily eating window ≥ 14 h were enrolled and randomised into one of two intervention arms, namely unrestricted eating (control) or TRE. The participants in the control group were instructed to continue their usual eating habits while tracking all meal timing and food types via the myCircadianClock application. The participants in the TRE group self-selected a daily 8-h eating window, which they were asked to keep consistent throughout the 12-week intervention. During the window, ad libitum food intake was permitted. Outside the window, participants were instructed to limit their oral intake to medications and water.
Procedures/measures
For the Pre- and Post-assessments, each participant had their anthropometric variables and study endpoints measured, along with wearing an accelerometer (ActiGraph GT9X Link, ActiGraph LLC) for 2 weeks.
Anthropometric variables and study endpoints
Body composition was assessed using a GE Lunar iDXA system (GE Healthcare) and analysed by the enCoreTM software (Version 16.2). The resulting variables were gross ES, fat mass, fat-free mass and total mass (i.e. the sum of fat mass and fat-free mass). Automated quality assurance checks were performed at the start of each day the system was operated. Full body scans were performed for all participants, and symmetrical estimations were applied if a portion of the participant’s body fell outside the 198 × 66 cm scanning area. The radiation dose was 3–6 μGy/scan. Participants fasted for at least 8 h before each DXA scan.
Accelerometer
Wrist accelerometry was used to quantify EE at the Pre- and Post-assessments. Each participant wore the GT9X on the non-dominant wrist. The devices were initialised to sample at 30 Hz with the Bluetooth and inertial measurement unit features disabled and with idle sleep mode enabled. This configuration allowed a single battery charge to last the full 14 d. For the pre-assessment, GT9X data were collected for 2 weeks ending just before randomisation (i.e. the start of Week 1). For the Post-assessment, GT9X data were collected from the start of Week 11 to the end of Week 12 (end of study). On both occasions, participants were asked to wear the monitors continuously to the greatest extent possible.
Data processing
Accelerometer data were read into R using the AGread package(Reference Hibbing and van Hees22). Two broad tasks were performed that each used a different data format: First, EE was calculated from raw acceleration data (in gravitational units, 30 Hz resolution); and second, non-wear and sleep periods were determined from filtered and aggregated data (activity counts, minute-by-minute resolution). Activity counts are a proprietary unit of cumulative acceleration calculated at regular intervals(Reference Chen and Bassett23), in this case every minute (i.e. counts/min).
Calculating energy expenditure
For each sample, the Euclidian norm minus one (ENMO) was calculated from the individual axes ( ${\rm{ENMO}} = {\rm{\;}}\sqrt {{{\rm{x}}^2} + {{\rm{y}}^2} + {{\rm{z}}^2}{\rm{\;}}} {\rm{\;}} - {\rm{\;}}1$
), with negative values rounded to 0. The output was then averaged each second, converted to milli-gravitational units (i.e. multiplied by 1000), and used to calculate oxygen consumption (VO2). The Hildebrand non-linear method was used (Eq. 1), as described by Ellingson et al.(Reference Ellingson, Hibbing and Kim24). The method includes a floor value of 3·0 ml/kg per min to account for the lack of intercept in the model. It was selected instead of its linear counterpart(Reference Hildebrand, Van Hees and Hansen25) because it outperformed the latter method in the validation study by Ellingson et al.(Reference Ellingson, Hibbing and Kim24), yielding mean estimates within 0·05–0·23 metabolic equivalents (0·2–0·8 ml/kg/min) of indirect calorimetry for sedentary and light intensity behaviours, and within 0·8–2·4 metabolic equivalents (2·8–8·4 ml/kg per min) for moderate and vigorous intensity behaviours. For the present analysis, VO2 values were converted to kJ/kg per min assuming a respiratory quotient of 0·85 (20.3426 kJ/L O2)(Reference Lusk26). Finally, the data were reduced to minute-by-minute resolution by averaging the values each minute.
${\rm{ENMO}} = {\rm{\;}}\sqrt {{{\rm{x}}^2} + {{\rm{y}}^2} + {{\rm{z}}^2}{\rm{\;}}} {\rm{\;}} - {\rm{\;}}1$
), with negative values rounded to 0. The output was then averaged each second, converted to milli-gravitational units (i.e. multiplied by 1000), and used to calculate oxygen consumption (VO2). The Hildebrand non-linear method was used (Eq. 1), as described by Ellingson et al.(Reference Ellingson, Hibbing and Kim24). The method includes a floor value of 3·0 ml/kg per min to account for the lack of intercept in the model. It was selected instead of its linear counterpart(Reference Hildebrand, Van Hees and Hansen25) because it outperformed the latter method in the validation study by Ellingson et al.(Reference Ellingson, Hibbing and Kim24), yielding mean estimates within 0·05–0·23 metabolic equivalents (0·2–0·8 ml/kg/min) of indirect calorimetry for sedentary and light intensity behaviours, and within 0·8–2·4 metabolic equivalents (2·8–8·4 ml/kg per min) for moderate and vigorous intensity behaviours. For the present analysis, VO2 values were converted to kJ/kg per min assuming a respiratory quotient of 0·85 (20.3426 kJ/L O2)(Reference Lusk26). Finally, the data were reduced to minute-by-minute resolution by averaging the values each minute.
 $${\rm{V}}{{\rm{O}}_2}\;\left( {{\rm{ml/kg/min}}} \right) = 0.901 \cdot {\rm{ENM}}{{\rm{O}}^{0.534}}$$
Non-wear and sleep classification
The minute-by-minute activity count data were first analysed using the non-wear detection algorithm of Choi et al.(Reference Choi, Liu and Matthews27,Reference Choi, Beck and Liu28) to verify compliance with the wear protocol, as discussed later. After applying the non-wear algorithm, the wear time periods were analysed to identify sleep using the algorithm of Tracy et al.(Reference Tracy, Acra and Chen29,Reference Tracy, Xu and Acra30) . The prior steps resulted in each minute being labelled as either awake, asleep or non-wear. These labels (derived from activity counts) were then merged with the EE estimates (derived from raw acceleration data) to obtain a complete set of minute-by-minute accelerometer data. For non-wear and sleep periods, a basal EE value was imputed based on the Schofield equations(Reference Schofield31).
Cleaning and aggregation of energy expenditure data
Cleaning procedures involved discarding data from days with < 22 h of wear time, then excluding participants if they had < 4 d remaining at either time point. These steps ensured the aggregation procedures would draw from sufficiently compliant data. For each participant, aggregation involved calculating mean daily EE (kJ/d) from each valid day during the 2 weeks before randomisation (EEpre) and during Weeks 11 and 12 (EEpost).
Calculating energy storage, energy balance and energy intake
Based on the DXA measurements of fat mass and fat-free mass (both in kg), gross ES was calculated using Eq. 2 for baseline (ESpre) and Weeks 11 and 12 (ESpost)(Reference Shook, Hand and O’Connor17,Reference Shook, Yeh and Welk18) . Daily net ES was calculated using Eq. 3 before determining EI. For the baseline assessment, individuals were assumed weight stable, and thus accelerometer data were used to determine EI (i.e. EIpre = EEpre). For the follow-up assessment, EI was calculated as the sum of EE and net ES (i.e. EIpost = EEpost + net ES).
 $${\rm{Gross\;ES}}\;\left( {{\rm{kcal}}} \right) = \;1020 \cdot {\rm{FFM}} + 9500 \cdot {\rm{FM}}$$
 $${\rm{Net}}\,{\rm{ES}}\;\left( {{\rm{kcal/day}}} \right) = \;{{{\rm{E}}{{\rm{S}}_{{\rm{post}}}} - \;{\rm{E}}{{\rm{S}}_{{\rm{pre}}}}} \over {{\rm{days}}\,{\rm{between\;}}\,{\rm{cans}}}}$$
Comparison measure of energy intake
Alternative EI predictions were obtained using the National Institute of Diabetes and Digestive and Kidney Diseases (NIDDK) Body Weight Planner(Reference Hall, Sacks and Chandramohan32). This was done through the online interface (https://www.niddk.nih.gov/bwp) in expert mode with advanced controls activated. Specifically, the following variables were inputted for each participant: sex, age, height, baseline body mass, baseline resting EE (from Schofield’s equations; see(Reference Schofield31)), baseline physical activity level (total EE divided by resting EE), baseline body fat percentage (assessed by DXA), ‘goal weight’ (i.e. body mass at the end of the intervention), number of days between assessments and percentage change in physical activity level from baseline to the end of the intervention (based on accelerometer data). The system produced a baseline caloric intake (i.e. EIpre) commensurate with maintaining the original weight, as well as a daily caloric intake (i.e. EIpost) commensurate with losing the observed amount of weight in the observed amount of time. The purpose of including the NIDDK estimates was to allow comparison of the accelerometer-based method against an established method that uses similar information. The key difference between the two methods is that the NIDDK method is primarily for individualised and prospective use, while the accelerometer-based intake-balance method will allow scalable batch processing in retrospective analyses.
Analysis
Statistical tests
Paired t-tests were used to compare Pre- and Post-energy balance values (ES, EE and EI) within each group. To assess agreement between the accelerometer-based intake-balance method and the NIDDK method, we used tests of statistical equivalence (± 418.4100 kJ/d tolerance) for each group and timepoint(Reference Dixon, Saint-Maurice and Kim33). Additional analyses were conducted to test agreement for the Post-assessment, where individuals were not assumed to be weight stable. These included regression-based and Bland–Altman analyses to examine individual-level error and systematic bias(Reference Bland and Altman34,Reference Bland and Altman35) . For the regression model, the key performance metrics were intercept and slope with 95 % CI, as well as se of the estimate. Perfect agreement would be represented by an intercept of 0 and a slope of 1 (i.e. following the line of identity). Regression coefficients were tested statistically using the equivalence methods suggested by Dixon et al.(Reference Dixon, Saint-Maurice and Kim33), namely by centering both variables on the mean of the accelerometer-based intake-balance method, and by using specific equivalence zones for the intercept (±10 % of the intake-balance mean) and slope (0·9–1·1). To account for the number of statistical tests, all P-values were adjusted using the false discovery rate correction(Reference Benjamini and Hochberg36).
Data loss and statistical power
Twenty of twenty-two participants were retained through the full intervention(Reference Chow, Manoogian and Alvear4). One participant did not meet the valid data requirements for this analysis (i.e. lacked ≥ 4 d with ≥ 22 h of wear time at both the Pre- and Post-assessments), and thus the analytic sample included nineteen participants (n 8 control; n 11 TRE). The sample size in each group allowed the detection of an effect size (d) of 1·4, with α = 0·05 and β = 0·80(Reference Faul, Erdfelder and Lang37).
Results
Participant characteristics are shown in Table 1. Hereafter, summary statistics are given as mean ± sd. The time between the Pre- and Post-visits was 94 ± 7 d (control group) and 96 ± 6 d (TRE group).
Participant characteristics and sample descriptives. Accelerometer-derived variables are grand averages across participants
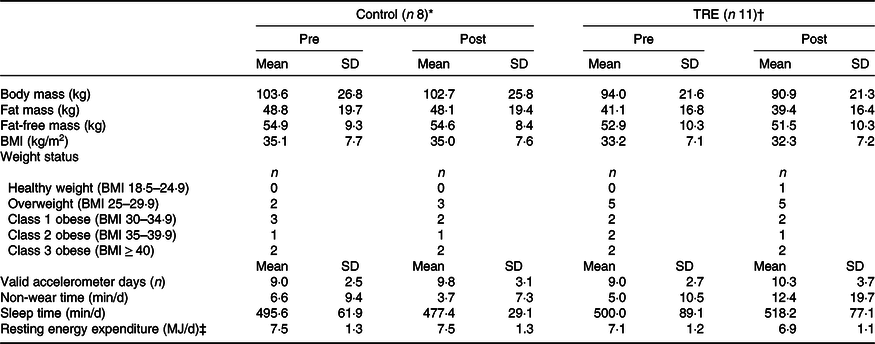
TRE, time-restricted eating.
* 44·0 ± 13·0 years old (87·5 % females).
† 46·8 ± 12·4 years old (81·8 % females).
‡ Estimated from Schofield method (age-stratified equations with height and body mass as predictors).
Changes in energy balance
Table 2 shows summary statistics for energy balance variables, and individual values are plotted in Fig. 1. Mean ES decreased from Pre to Post in both groups, by a small amount in the control group (28.5 MJ; P = 0·39) and a more substantial amount in the TRE group (70.3 MJ; P = 0·01). Mean relative EE changed by only ± 0.84 kJ/kg per d in either group (P = 0·85–0·93), but individual trends were variable (Fig. 1(b)). Thus, the small mean changes were attributable to cancellation, with some participants increasing their relative EE and others decreasing it. For the accelerometer-based intake balance method, mean EI decreased slightly in the control group (138 kJ/d; P = 0·85), while it decreased more considerably for the TRE group (1255 kJ/d; P = 0·01). Similarly, the NIDDK method showed a decrease of 435 kJ/d for the control group (P = 0·38), v. 1469 kJ/d for the TRE group (P < 0·001).
Energy balance values presented as mean (sd)
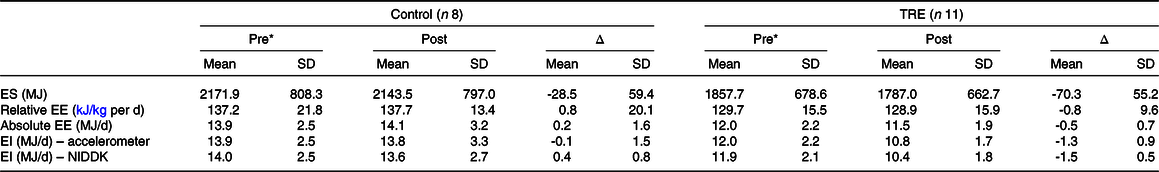
TRE, time-restricted eating; ES, energy storage; EE, energy expenditure; EI, energy intake; NIDDK, National Institute of Diabetes and Digestive and Kidney Diseases (body weight planner).
* Individuals assumed weight stable (i.e. accelerometer EI = EE).
Spaghetti plot of changes in energy storage (ES; a), relative energy expenditure (EE; b), absolute EE (c) and energy intake (EI; d). Grey lines are individual participants, and heavy black lines are group means.

Agreement of accelerometer and National Institute of Diabetes and Digestive and Kidney Diseases methods
The accelerometer and NIDDK methods showed strong agreement for EIpre in both the control group (mean separation of 92 ± 201 kJ/d; equivalence P = 0·01) and the TRE group (mean separation of 151 ± 226 kJ/d; equivalence P = 0·01). At the post-assessment, the accelerometer and NIDDK methods remained similar, but there was greater variability (separations of 205 ± 1393 kJ/d in the control group and 360 ± 858 kJ/d in the TRE group; equivalence P = 0·56 and 0·57, respectively). The same was true for Pre-to-Post changes in EI (separations of 297 ± 1230 kJ/d in the control group and 213 ± 741 kJ/d in the TRE group; equivalence P = 0·57 and 0·38, respectively).
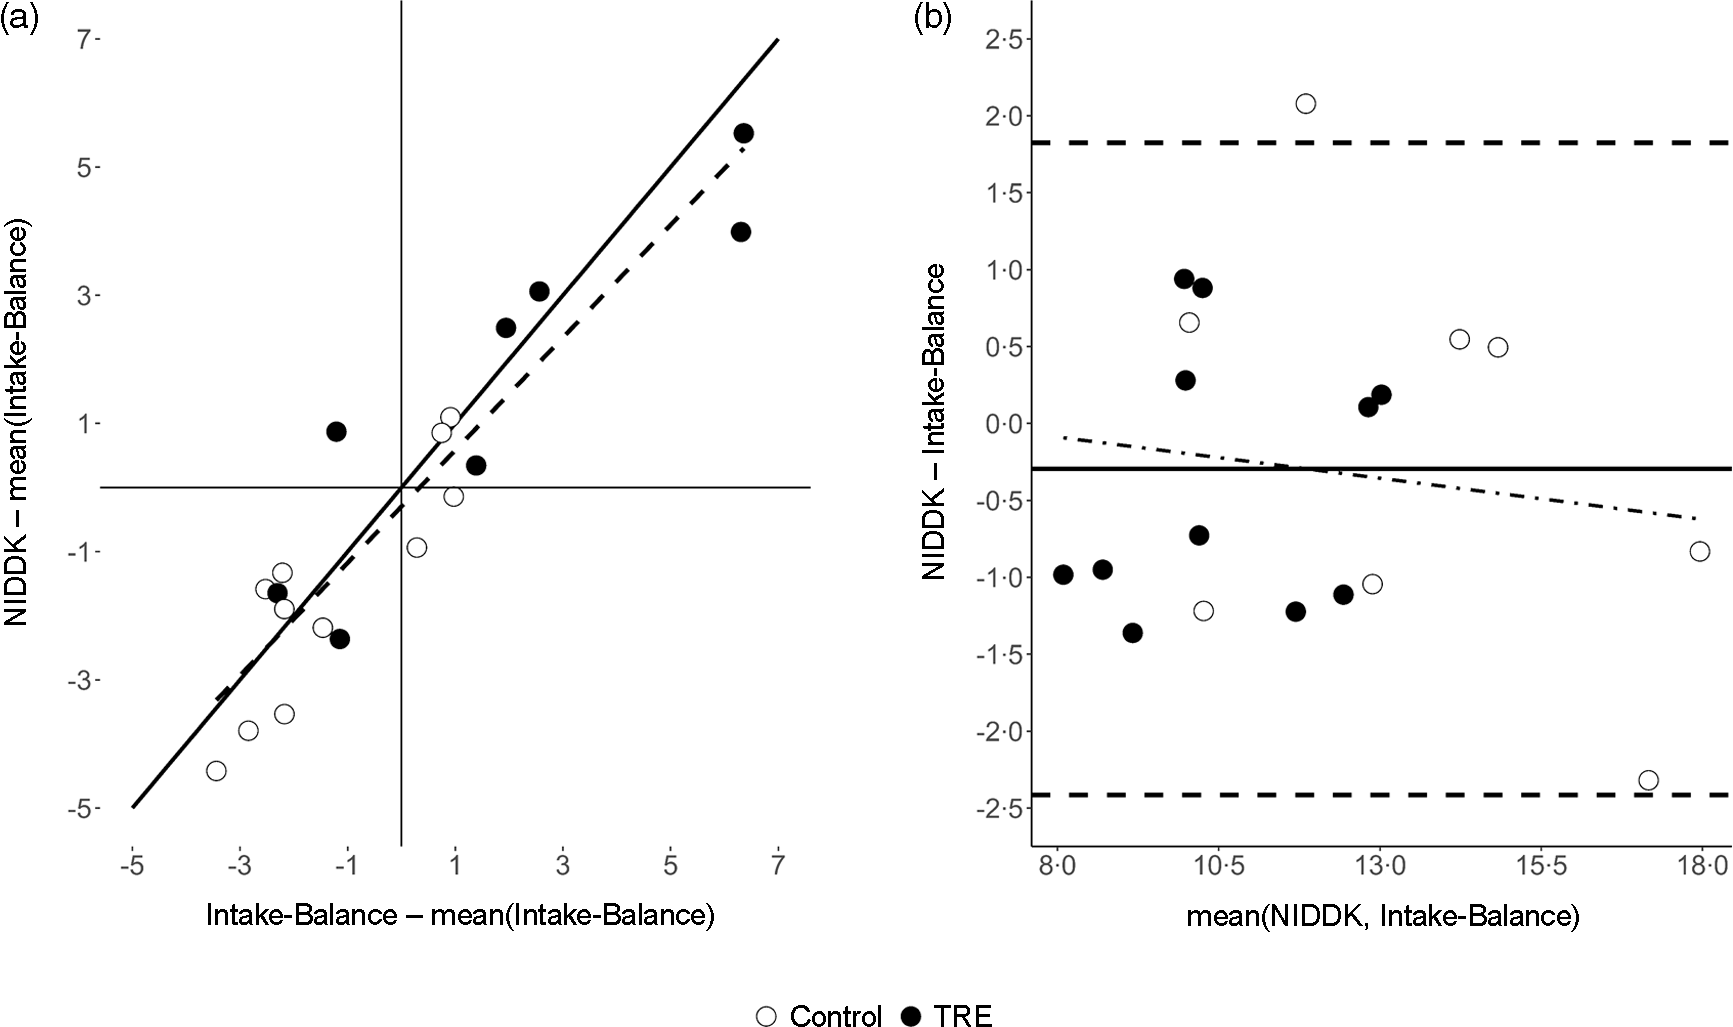
Fig. 2 shows individual-level data for EI predictions at the Post-assessment. There, the accelerometer and NIDDK methods were related with a regression intercept of −297 kJ/d (95 % CI (-193, 51); equivalence P = 0·01) and slope of close to one (B = 0·88; 95 % CI (0·69, 1·06); equivalence P = 0·76). The model had standard error of the estimate of 1054 kJ/d. Bland–Altman analysis showed a small mean bias (-297 kJ/dkcal/d, consistent with the regression model intercept) but wide limits of agreement spanning a range of 4238 kJ/d (i.e. (-2414 to +1824)). There was negligible evidence of systematic error, with the trendline having a slope of −0·05 and explaining < 2 % of the variance.
Comparison of estimated energy intake (MJ/d) between the accelerometer-based intake-balance method and the NIDDK bodyweight planner. Values are from the Post-assessment where, unlike the Pre-assessment, individuals were not assumed to be weight stable. (a) Scatterplot showing line of identity (solid) and line of best fit (dashed, from least-squares regression), where both variables are centered on the mean of the accelerometer-based intake-balance method to ensure a non-extrapolated intercept with a null-hypothesised value of 0; (b) Bland–Altman plot showing limits of agreement (horizontal dashed lines), mean bias (solid horizontal line) and systematic bias (dot-dashed trendline from least squares regression). NIDDK, National Institute of Diabetes and Digestive and Kidney Diseases; TRE, time-restricted eating.
Discussion
In this study, we provided proof-of-concept for an accelerometer-based intake-balance method. This was done in the setting of a TRE intervention, but the method may have utility in other settings as well. Although we did not have criterion values against which we could compare our estimates, the findings nevertheless suggest the accelerometer-based technique can detect enough meaningful EI signal to warrant further study and application. In particular, we observed comparable EI reductions for the TRE group when using the accelerometer-based method (9·9 % ± 6·4 %) and the NIDDK method (12·3 % ± 2·9 %). Furthermore, the accelerometer-based estimates were comparable with prior studies showing TRE produces EI reductions of 8 %–20 %(Reference Gabel, Hoddy and Haggerty5,Reference Wilkinson, Manoogian and Zadourian6) .
The accelerometer-based intake-balance method is a promising alternative to self-reported EI, which many have recommended abandoning for estimation of true EI(Reference Dhurandhar, Schoeller and Brown9,Reference Schoeller, Thomas and Archer38,Reference Subar, Freedman and Tooze39) . A further advantage is that it can be refined over time as innovation continues in the fields of body composition assessment and accelerometry(Reference LaMunion, Fitzhugh and Crouter40). Many current innovations in accelerometry use open-source tools to streamline usage and increase accessibility for end-users(Reference Migueles, Rowlands and Huber41). In keeping with the latter trend, we have provided sample code and commentary to facilitate using our method (see paulhibbing.com/TREaccel).
To our knowledge, this is the first study to present an open-source, accelerometer-based intake-balance method in the setting of a TRE intervention. Shook et al.(Reference Shook, Hand and O’Connor17) were among the first to use a general device-based approach, including a comparison of their predictions against values derived from doubly labelled water. They showed outstanding utility of the SenseWear Armband, but the latter device was closed-source and has now been discontinued for several years(Reference Welk, Kim and Shook42). Today, ActiGraph devices are among the most commonly used in research(Reference Wijndaele, Westgate and Stephens43), with an abundance of ongoing work being devoted to improving their utility for EE assessment(Reference Farrahi, Niemelä and Kangas44). Thus, our use of an ActiGraph device represents a logical starting place for developing an open-source accelerometer-based method. Consumer devices may also have utility in this space(Reference Evenson, Goto and Furberg45–Reference O’Driscoll, Turicchi and Beaulieu47), although concerns still exist, many relating to the proprietary nature of the underlying algorithms(Reference O’Driscoll, Turicchi and Hopkins48). Overall, our method provides a starting point from which future studies can begin refining the use of accelerometers for determining EI.
Strengths and weaknesses compared to the National Institute of Diabetes and Digestive and Kidney Diseases body weight planner
In addition to providing proof-of-concept for the accelerometer-based method, our analysis compared the accelerometer-based intake-balance method to the existing NIDDK Body Weight Planner method. While the planner is primarily intended for prospective use, data can also be entered retrospectively to infer caloric intake over a particular period (e.g. the duration of an intervention). As discussed below, the NIDDK method may be advantageous to use in some settings while the accelerometer-based method is advantageous to use in others.
Accessibility is a major strength of the NIDDK method. This is true in both a literal sense (the method is freely available without needing to purchase an accelerometer or related software) and an abstract sense (the online interface is easy to navigate). Furthermore, the NIDDK method is based on a model that accounts for adaptations to weight loss over time, making it a highly useful tool for both weight loss and weight maintenance. These advantages make the NIDDK method especially useful in clinical and consumer settings. A limitation of the method is that the web interface currently requires manual data entry. This creates a logistical barrier for research at scale and also increases the risk of data entry error. Furthermore, the method requires that users provide information about their physical activity level, which must either be measured independently or self-reported through a two-item submodule. These characteristics may make the NIDDK method less advantageous for use in research than for clinical and commercial use.
The accelerometer-based method’s strengths and weaknesses broadly complement the NIDDK method. As noted previously, a major strength of the accelerometer-based method is its open-source setup and potential for ongoing refinement. Furthermore, the ability to automate the accelerometer-based method for batch processing enhances its scalability and consequent utility for research. That is, the accelerometer-based method can reduce the burden on participants and researchers alike by eliminating the need to complete and score self-report instruments or similar tools such as the NIDDK method. Automation would also enhance quality control by reducing the risk of data entry errors. While these are certainly strengths of the accelerometer-based method in research settings, they may not be as applicable in commercial and clinical settings. This is due to both the cost barrier of obtaining an ActiGraph device and the procedural barrier of processing the data in R (even with the sample code mentioned earlier). Furthermore, the accelerometer-based method is designed primarily for retrospective use and does not account for adaptations to weight loss like the NIDDK method. Thus, the accelerometer-based method should be considered primarily as a tool for research, with a need for ongoing investigation in terms of its long-term utility for studies on weight maintenance and adaptations to weight loss.
Assumptions and implications
While the intake-balance method finds its theoretical basis in the First Law of Thermodynamics(Reference de Jonge, DeLany and Nguyen49), some additional assumptions were necessary to implement the method in the form described above. The key assumptions were that (1) participants were weight stable at baseline; and (2) there was linear change in ES from Pre to Post (see Eq. 3). These assumptions made it possible to infer daily net ES for each 2-week measurement period, despite having only one DXA scan at each time point. For the Post-assessment, a third, minor assumption accompanied the previous two, namely that the daily net ES values (derived from change throughout the intervention) and the mean daily EE values (derived from valid days in the final 2 weeks) were comparable enough to support calculating EI.
The prior assumptions have implications for interpreting the present results and designing future studies. For the present results, the assumed linear change in ES implies that a constant energy balance was maintained throughout the intervention (i.e. that EI and EE maintained a consistent subtractive relationship). While this does not require that EI and EE were constant from day to day, it does require that they were offset by a consistent amount to keep net ES stable. In practice, the latter assumption was able to withstand minor day-to-day deviations, provided they cancelled out over the course of the intervention. Nevertheless, it is important to consider this characteristic of the method when interpreting the results.
In terms of study design, it should be noted that future study protocols could incorporate mid-trial assessments of ES and EE to facilitate different (e.g. non-linear) approaches to predicting EI. This would be an especially promising use for accelerometry, since a similar approach with doubly labelled water would face many feasibility barriers. Future studies could also perform two DXA scans at each time point, which would ensure the exact concurrence of EE and net ES measurements. This would sidestep the assumption of linear change in ES, but it could also be too short of a measurement window for DXA to detect meaningful changes(Reference Rothney, Martin and Xia50,Reference Dordevic, Bonham and Ghasem-Zadeh51) .
Further implications for interpretation and design may arise when considering the duration of the intervention. A longer intervention would result in greater separation between the Pre- and Post-assessments, potentially amplifying the impact of an assumed linear change in ES. A longer intervention could also elicit metabolic adaptations that are modelled in the NIDDK method, but not the current version of the accelerometer-based method. Refined versions of the accelerometer-based method could be developed to address this, but more research and development are needed to attain this. In the meantime, results must be interpreted with careful attention to the unique design features of each study.
Strengths and limitations of this study
The present study had strengths and limitations. Its main strength was the presentation of an innovative accelerometer-based intake-balance method applicable to a widely used wrist-worn activity monitor (GT9X). Participants were also exceptionally compliant with wearing the device, which was another strength. The main limitations were the small sample size and lack of data from criterion measures or self-report methods. Additionally, estimates of agreement may have been inflated when comparing the accelerometer-based and NIDDK methods, as there was a partial overlap of the information used in each approach. This issue is discussed in more detail in the supplementary material. Overall, there is a clear need for more research to test the criterion validity of this accelerometer-based intake-balance approach. However, our study provides proof-of-concept and preliminary evidence to suggest the method is a feasible and scalable option with great potential to enhance ongoing work. Future studies should directly compare the method against values obtained from self-reported EI as well as objective measures such as doubly labelled water.
Conclusions
The accelerometer-based intake-balance method showed promising utility when applied to data from a TRE intervention. This strong proof-of-concept calls for ongoing refinement and validation of the method. Such efforts have the potential to increase the quality and consistency of EI measurements, while also reducing their burden on participants and researchers.
Acknowledgements
This work was supported by the Healthy Foods Healthy Lives program (L.C., 17SFR-2YR50LC), Robert Wood Johnson Foundation (S.P., Pioneer award 76 014), Wu Tsai Human Performance Alliance and the Joe and Clara Tsai Foundation (gift to SP) and the National Institutes of Health (NIH National Center for Advancing Translational Sciences, UL1TR002494). The funders had no role in the design, analysis or writing of this article.
Formulated Research Question: P. R. H., R. S., L. C., Designed research: L. S. C., S. P., D. G. M., Conducted research: L. S. C., S. P., D. G. M., E. N. C. M., Provided essential materials: S. P., E. N. C. M., Analysed data or performed statistical analysis: P. R. H., R. P. S., Wrote paper: P. R. H., R. P. S., L. S. C. Approved manuscript: P. R. H., R. P. S., S. P., E. N. C. M., D. G. M., L. S. C.
S.P. has authored a book ‘The Circadian Code’. All others report no conflicts of interest.
Supplementary material
For supplementary material/s referred to in this article, please visit https://doi.org/10.1017/S0007114522003312


