


Introduction
The areal extent of snow cover has been monitored continuously from satellite observations by the U.S. National Oceanic and Atmospheric Administration (NOAA) since 1966 (Reference Matson, Ropelewski and VarnadoreMatson and others, 1986). Although several weaknesses have been identified (Reference RobinsonRobinson 1993) in the long-term operational snow product, it is nevertheless the longest climatological time series of snow cover available. Passive-microwave maps of snow cover have been produced since 1978, providing information on snow extent as well as some information on snow-water equivalent. In order to improve the snow-cover record to optimize future longterm climate studies, and as input to general circulation models, it is important to develop an objective way of mapping snow globally, if trends in snow cover, such as those discussed in Reference BrownBrown (1997), are to be validated. In addition, the accuracy of the snow-cover input data needs to be verified in order to establish the accuracy of the model output (Reference Derksen and LeDrewDerksen and LeDrew, 2000).
In December 1999, the Moderate Resolution Imaging Spectroradiometer (MODIS) sensor was launched by the National Aeronautics and Space Administration (NASA), and some daily, global maps of snow cover at a spatial resolution of 500m began to be available in February 2000. Snow maps have been orderable through the U.S. National Snow and Ice Data Center, Boulder, CO, since 13 September 2000. In this paper, we compare 8 day composite MODIS snow maps, NOAA/National Operational Hydrologic Remote Sensing Center (NOHRSC) operational maps, and passive-microwave-derived maps from the Defense Meteorological Satellite Program (DMSP) Special Sensor Microwave/ Imager (SSM/I). Each map is known to have a unique set of problems or limitations. The 30 m resolution Landsat Enhanced Thematic Mapper Plus (ETM+) and the NOAA operational product, the Interactive Multisensor Snow and Ice Mapping System (IMS), are used as ancillary data and are considered ground truth for this work.
Background
MODIS-derived snow maps
The MODIS snow-mapping algorithm is fully automated, which makes the results consistent from scene to scene. The algorithm uses reflectances in MODIS bands 4 (0.545–0.565 μm) and 6 (1.628–1.652 μm), uncorrected for atmospheric effects, to calculate the normalized-difference snow index (NDSI) (Reference Hall, Riggs, Salomonson, DiGirolamo and BayrHall and others, in press). Snow cover is mapped using a grouped-criteria technique algorithm. A pixel will be mapped as snow if the NDSI is ≥0.4 and reflectance in MODIS band 2 (0.841–0.876 μm) is ≥11%. However, if the MODIS band 4 reflectance is 510%, then the pixel will not be mapped as snow even if the other criteria are met. This prevents pixels containing very dark targets from being mapped erroneously as snow. MODIS bands 1 (0.620–0.670 μm) and 2 (0.841–0.876mm) are used to calculate the normalized-difference vegetation index (NDVI). An additional test using the NDSI and NDVI is used to improve the detection of snow in dense forests (Reference Klein, Hall and RiggsKlein and others, 1998). A cloud mask (Reference Ackerman, Strabala, Menzel, Frey, Moeller and GumleyAckerman and others, 1998) and a land/water mask are inputs to the MODIS snow-cover maps.
Special 8 day composite MODIS maximum snow-cover maps at 1/4°£1/4° spatial resolution were developed from the 500m resolution MODIS binary snow maps that are available on a daily or near-daily basis. The 500 m binary snow pixels are binned into a 1/4°£1/4° latitude/longitude grid to facilitate comparison with other hemisphere-scale maps. Using this binning technique, a cell is snow-covered if as few as *1% of the observations in the 1/4°£1/4° gridcell are snow-covered. While this technique tends to overestimate snow cover, it has the advantage that it shows all of the snow that was present during the 8 day composite period. Maximum snow cover means that if snow cover is present on any of the 8 days of the composite, that entire cell will be considered to be snow-covered.
NOHRSC snow maps
The National Weather Service (NWS) produces a 1km resolution snow-cover product on at least a weekly basis over the United States and parts of southern Canada (Reference Holroyd, Verdin and CarrollHolroyd and others, 1989; Reference CarrollCarroll, 1995) during the snow season. The snow product is used operationally by the NWS.
To develop the NOHRSC product, remotely sensed and interpolated, gridded, snow water equivalent data products are generated by hydrologists using the NOAA Geostationary Observational Environmental Satellite (GOES) and Advanced Very High Resolution Radiometer (AVHRR) as well as ground data. AVHRR data are ingested and radiometrically calibrated, and used to generate a snow/no-snow/cloud-cover byte plane image. Data are available on the NOHRSC Web site: http://www.nohrsc.nws.gov/.
SSM/I-derived snow maps
The SSM/I sensor was launched in 1987. This instrument has many of the same channels as the prior instrument, the Scanning Multichannel Microwave Radiometer (SMMR), launched in 1978. Different algorithms have been used to map snow using SSM/I data (e.g. Reference Chang, Foster and HallChang and others, 1987; Reference GrodyGrody, 1991; Reference Grody and BasistGrody and Basist, 1996). In this paper, we employ the Reference Chang, Foster and HallChang and others (1992) algorithm to map snow cover because it provided a closer match with the MODIS and NOHRSC snow maps than did the Reference Grody and BasistGrody and Basist (1996) algorithm for North America.
Other NOAA snow maps
The weekly National Environmental Satellite Data and Information System (NESDIS) operational product was determined from visible satellite imagery from polar-orbiting and geostationary satellites and surface observations. The analysis was performed once a week, using the most recent clear view of the surface. Because the analysis for this product was done only once a week, much snow cover, especially from fleeting/transient storms, was missed. Where cloud cover precluded the analyst’s view of the surface for an entire week, the analysis from the previous week was carried forward (Reference RamsayRamsay, 1998). The maps were hand-drawn, and then digitized using an 89£89 line grid overlaid on a stereographic map of the Northern Hemisphere. The older, weekly maps were replaced in 1997 by the IMS product. The IMS product provides a daily snow map that is constructed using a combination of techniques including visible, near-infrared and passive-microwave imagery and meteorological-station data at a spatial resolution of about 25 km (Reference RamsayRamsay, 1998) (http://www.ssd.noaa.gov/PS/SNOW/index.html).
Additionally, NOAA provides an experimental automated snow-mapping product which is based on a synergy of GOES-Imager, NOAA AVHRR and DMSP SSM/I data for the North American continent (Reference Romanov, Gutman and CsiszarRomanov and others, 2000). The original map is prepared in a Platte Carte (latitude–longitude) projection with a 1/25° gridsize. This product is considered to be less accurate than the IMS product (personal communication from B. Ramsay, 2001), but agrees in 85% of the cases studied with the IMS product (Reference Romanov, Gutman and CsiszarRomanov and others, 2000).
Previous work has shown that, when the visible data from the earlier NESDIS weekly product are compared with passive-microwave data on snow extent, the passive-microwave snow maps consistently underestimate the amount of snow relative to the maps derived from visible and near-infrared data (Reference Basist, Garrett, Ferraro, Grody and MitchellBasist and others, 1996; Reference Armstrong and BrodzikArmstrong and Brodzik, 1999). For the time period 1978–99, Reference Armstrong and BrodzikArmstrong and Brodzik (1999) show a mean difference of 3.5£106 km2, with the SSM/I maps showing consistently less snow cover than the maps derived from visible data. The difference in snow-covered area measured by Reference Armstrong and BrodzikArmstrong and Brodzik (1999) is greatest in the fall months, and smallest in the summer months. This is because, at the lower elevations across North America, Europe and western Asia, the snow is more likely to be shallow (5*3.0 cm) and may often be wet and is difficult to detect using passive-microwave snow-mapping algorithms (Reference Chang, Foster and HallChang and others, 1987). Additionally, thin, dry snow cover may be transparent and therefore not be mapped using passive-microwave data.
Methodology
Daily satellite-derived snow maps, while useful for local and regional purposes, are usually so cloud-contaminated that it is impractical to use them on hemispheric or global scales. Therefore we use 8 day composite maps in this work; only clouds that persisted for all 8 days of the period remain on the MODIS or NOHRSC maps, thus facilitating comparisonwith the NOHRSC and SSM/Imaps. Because the entire 2000/01 winter of MODIS data was not available at the time this work was done, we used the following 8 day periods in 2000 to develop the MODIS and other composite maps: 23–30October, 1–7, 8–15 and 16–23November, 24 November– 1 December, 2–9, 10–17 and 18–25 December. Depending on the availability of satellite data, not all days could be used to calculate the composite snow maps during each 8 day period. (There was no MODIS snow map for 31 October 2000.) And, there were never eight consecutive NOHRSC snow maps available since the NOHRSC snow map is not a daily product.
On the MODIS snow maps, spurious snow cover is found in many areas south of the snowline. Most of these areas are unexplained and are found as scattered pixels. The estimated error of commission in snow mapping is –3%, based on the total number of pixels mapped as snow in North America on one 8 day composite (10–18 December 2000). A thermal mask which eliminates most of the spurious snow mapped in warm areas, was incorporated into the algorithm in November 2001.
Image-processing software was used to register the NOHRSC image onto the MODIS map at 1/4°£1/4° resolution (approximately 28 km2). About 50 ground-control points (GCPs) were determined from both images and saved as a gcp file. Then a registration routine was used to place the NOHRSC snow map (uncorrected) onto the MODIS map (georeferenced) using the gcp file and a curve-fitting technique. With second-order polynomial transformation, the rms error of the registration process is 0.53. Because the NOHRSC and SSM/I maps are not georeferenced, it was not possible to make a transformation from one projection to the other, so registration with GCPs was the best way to work.
If persistent cloud cover appears on either the MODIS or the NOHRSC 8 day composite maps, it is excluded from the comparison. Similarly, in the MODIS/SSM/I comparisons, if there is cloud cover on the MODIS map, then these areas are excluded from the comparison.
Only early-morning data (0600 h local time) from the SSM/I were used to derive the passive-microwave snow maps used in this paper since the colder night-time (and early-morning) temperatures minimize snowpack wetness. A wet or melting snowpack will cause the microwave brightness temperature to increase (Reference Hallikainen and JolmaHallikainen and Jolma, 1992) and may cause confusion with adjacent wet, snow-free ground. Whenever possible, dry snow cover is preferred for comparison with the visible-derived snow maps.
A modified version of the Reference Chang, Foster and HallChang and others (1987) algorithm was used. The algorithm was modified to act as a snow-mapping algorithm instead of a snow-depth algorithm and is as follows:

where SD is snow depth, 19H and 37H refer to the brightness temperature, TB, at 19 and 37 GHz vertical polarization, respectively, and 1.59 is a constant.
If the 37V TB<250K and the 37 H<240K, and the estimated SD 48 cm, then the algorithm will map snow in a pixel.
Results
MODIS/NOHRSC comparisons
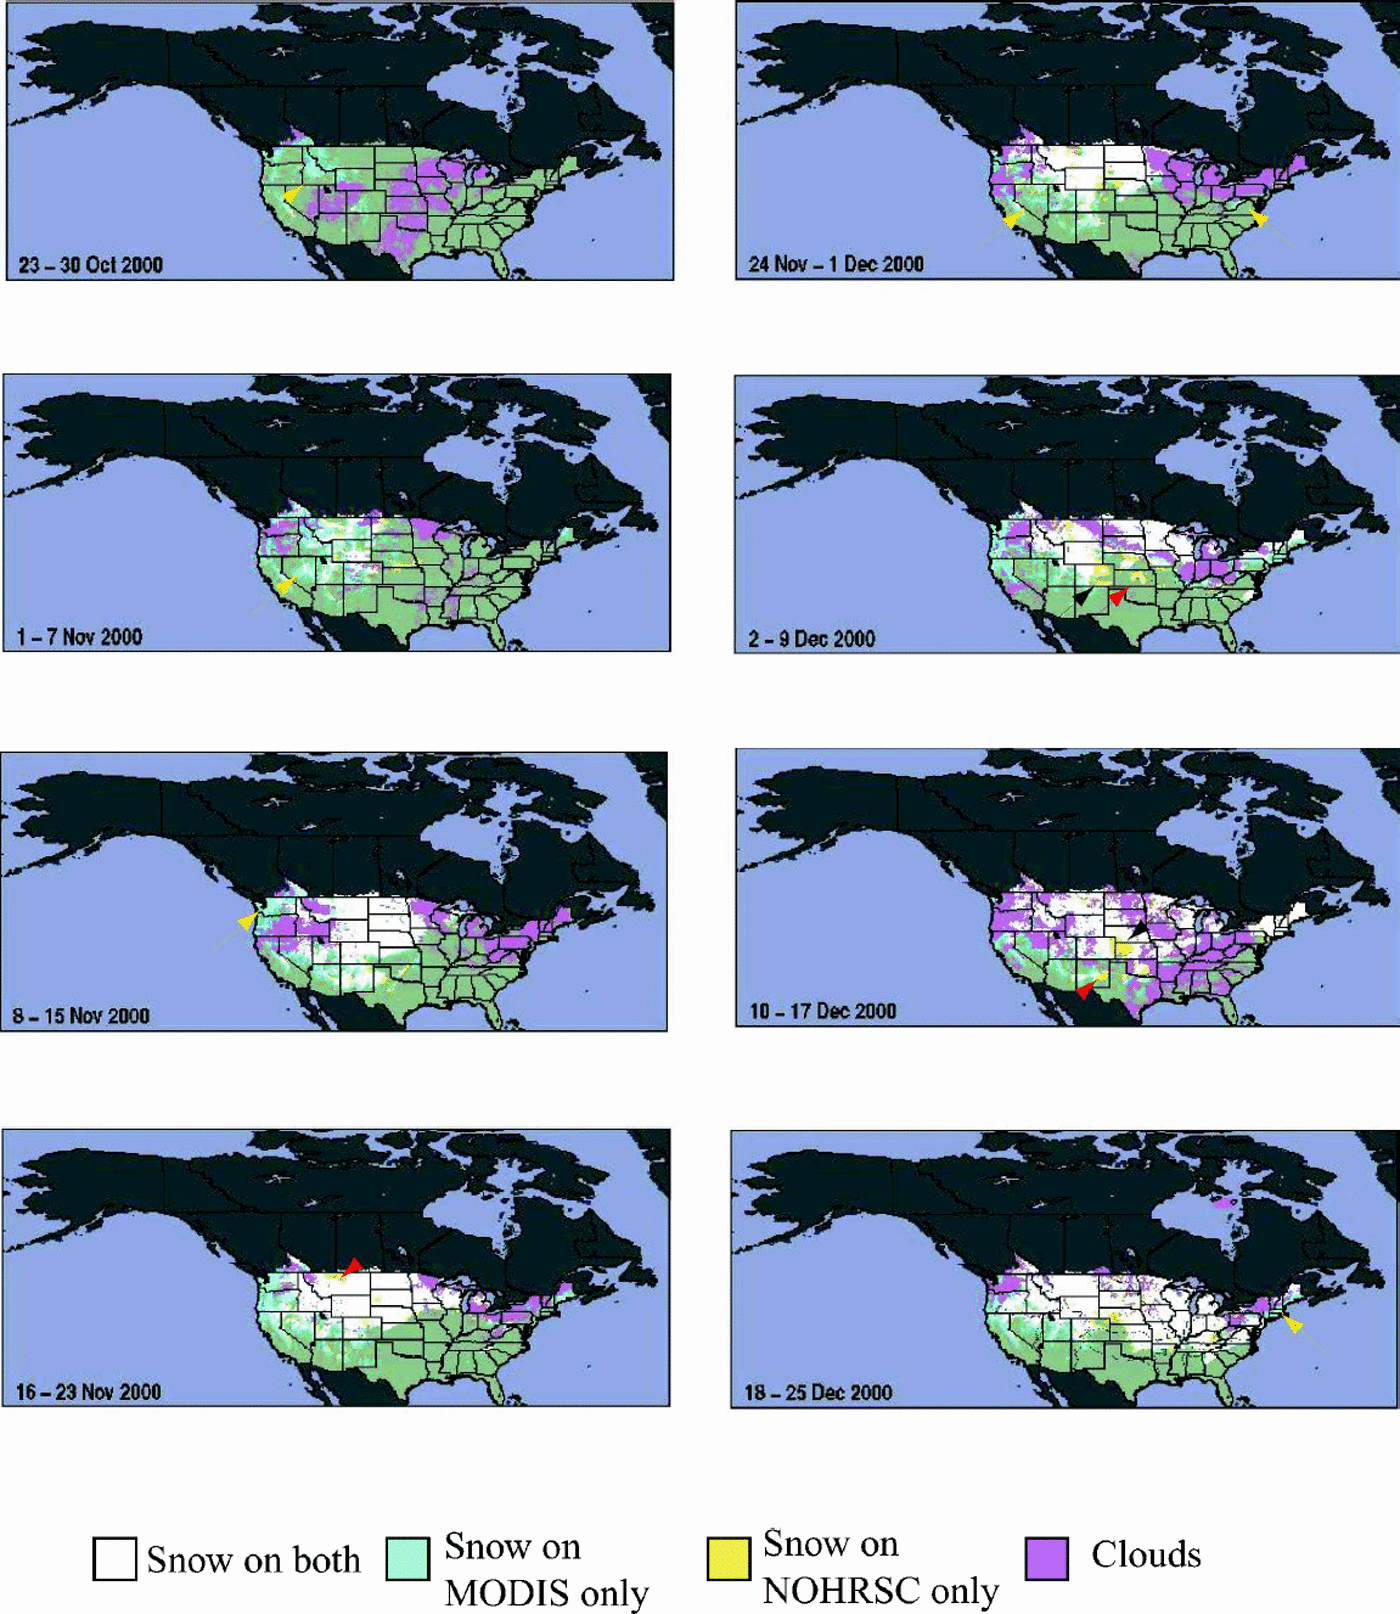
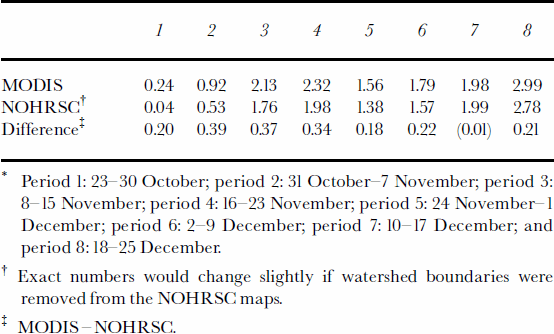
In general, more snow cover is mapped on the MODIS maps than on the NOHRSC maps (Fig. 1; Table 1). ETM+ browse images, used as ground truth for the MODIS and NOHRSC maps; these may be viewed on the United States Geological Survey EROS Data Center Web page (http://edcsns17.cr.usgs.gov/EarthExplorer/). The problem is that the ETM+ images are only acquired every 16 days, and if it is cloudy on the overpass day, then usable images are not obtained.
MODIS – NOHRSC difference maps show snow mapped on both snow maps and one or the other, exclusive of cloud cover (from both maps). Placement of the arrows is explained in the text.
Snow-covered area in 106km2 for each 8 day composite snow-cover product, exclusive of cloud cover from MODIS and NOHRSC maps. Numbers refer to 8 day periods in 2000*
During the first 8 day period, 23–30 October 2000, very little snow cover is shown on the NOHRSC map, while a considerable amount is present on the MODIS map (Fig. 1). Note the location in central Idaho (see arrow in Fig. 1) where MODIS shows a large amount of snow cover. An ETM+ browse image from 24 October (path/row 41/29) shows snow in that location, and the IMS product shows snow cover on 1day (23 October) during the 8 day period. In this case, the MODIS map correctly shows snow cover there, but appears to map more snow cover than actually existed.
During the period 1–7 November 2000, the MODIS map again shows more snow cover than does the NOHRSC map. Only five NOHRSC maps were available during this period. Compared with the IMS product, the MODIS map does a better job of mapping snow cover in Nevada (see arrow in Fig. 1), Idaho and the Sierra Nevada Mountains in California, than does the NOHRSC map.
During the period 8–15 November 2000, there is an extensive area in the central part of the United States where the MODIS and NOHRSC maps agree. However, they do not agree in the western half of Washington state. The NOHRSC map does not map snow just to the east of Puget Sound (arrow in Fig. 1 points to Puget Sound), while the MODIS maps correctly show snow in that location as confirmed by inspection of the 12 November 2000 ETM+ scene (path/row 46/27) and the IMS maps. West of Puget Sound, there is snow on the MODIS map but not on the NOHRSC map. Inspection of the IMS product reveals that the area was nearly snow-free for much of the 8 day period. ETM+ scenes (path/rows 48/26 and 48/27 acquired on 11 November 2000) show that there was a small amount of snow west of Puget Sound. The MODIS map appears to overestimate snow in that location, as it also did during the 1–7 November period.
By the 16–23 November time period, the MODIS map shows snow in Washington, Oregon and northern California (and in the Sierra Nevada), agreeing quite well with the IMS product that shows snow cover there, but again the MODIS map appears to overestimate snow in these locations.
Also during the 16–23 November time period, the MODIS map shows a small hole in the snow cover in northern Montana (see arrow in Fig. 1).While the MODIS map shows a few cells with snow, the NOHRSC map shows that the area is nearly completely snow-covered. An ETM+ scene from 20 November (path/row 38/26) shows that there is no snow in that location. All of the daily IMS products during that time period show a hole in the snow cover there. This area is on the lee side of the Rocky Mountains and often does not have complete snow cover even in winter. The MODIS map correctly shows that much of this area is snow-free for the entire 8 day period.
On the 24 November–1 December composite, the MODIS map showsmore snow in the state of Nevada (arrow points to Nevada) and in much of Utah (the state located just to the east of Nevada), while NOHRSC shows less snow cover in these states, which is in better agreement with the IMS map. The IMS product also shows snow in Nevada and western Utah on most of the days comprising the 8 day composite. In the eastern part of the country, the small area of snow in eastern West Virginia is correctly mapped on the MODIS map (see arrow in the eastern United States).
On the 2–9 December composite, the NOHRSC map shows much more snow cover in east-central Colorado than does the MODIS map (see black arrow in Fig. 1). The NOHRSC map also shows snow in central Kansas, where the MODIS map shows very little snow (see red arrow in Fig. 1). Inspection of the IMS products for that time period reveals that there was no snow mapped during this period in eastern Colorado and only a small amount in central Kansas (on 6 December). Thus the MODIS map appears to be more accurate in eastern Colorado, and shows a small amount of snow in central Kansas, which is consistent with the IMS map results. Perhaps NOHRSC mapped snow from a fleeting snowstorm that the other maps missed.
On the 10–17 December 2000 composite, the NOHRSC map shows considerably more snow cover in the western half of Kansas than does the MODIS map (see black arrow in Fig. 1). Inspection of the IMS products reveals that in fact there is complete snow cover on only 2 days, 11 and 12 December, in western Kansas. MODIS must have missed mapping this area due to complete cloud cover on 11 December caused by the major Midwestern snowstorm that was in progress. The IMS product is not an automated product, so snow-cover information for those dates may have been acquired by non-satellite means. The area may also have been cloud-covered on 12 December when MODIS data were acquired (complete cloud cover is observable on ETM+ images in eastern Colorado). Because MODIS maps tend to map more snow cover and not less, it seems likely that MODIS data for those 2 days were not acquired in that area due to clouds. This is an example of a limitation in the MODIS-derived snow maps.
Also on the 10–17 December composite, the NOHRSC map shows snow in eastern New Mexico (see red arrow in Fig. 1). There is no evidence from the IMS maps that this is correct.
On the 18–25 December 2000 composite, the correspondence in the central part of the country between the MODIS and NOHRSC maps is good. In the northeastern United States, however, NOHRSC misses the snow cover known to be present in the New England states and Maine (see arrow in Fig. 1). MODIS and IMS maps agree very well in Nevada and Utah. Again on the west coast, the MODIS map shows more snow cover in California and Oregon than do the NOHRSC and IMS maps.
MODIS/SSM/I comparisons
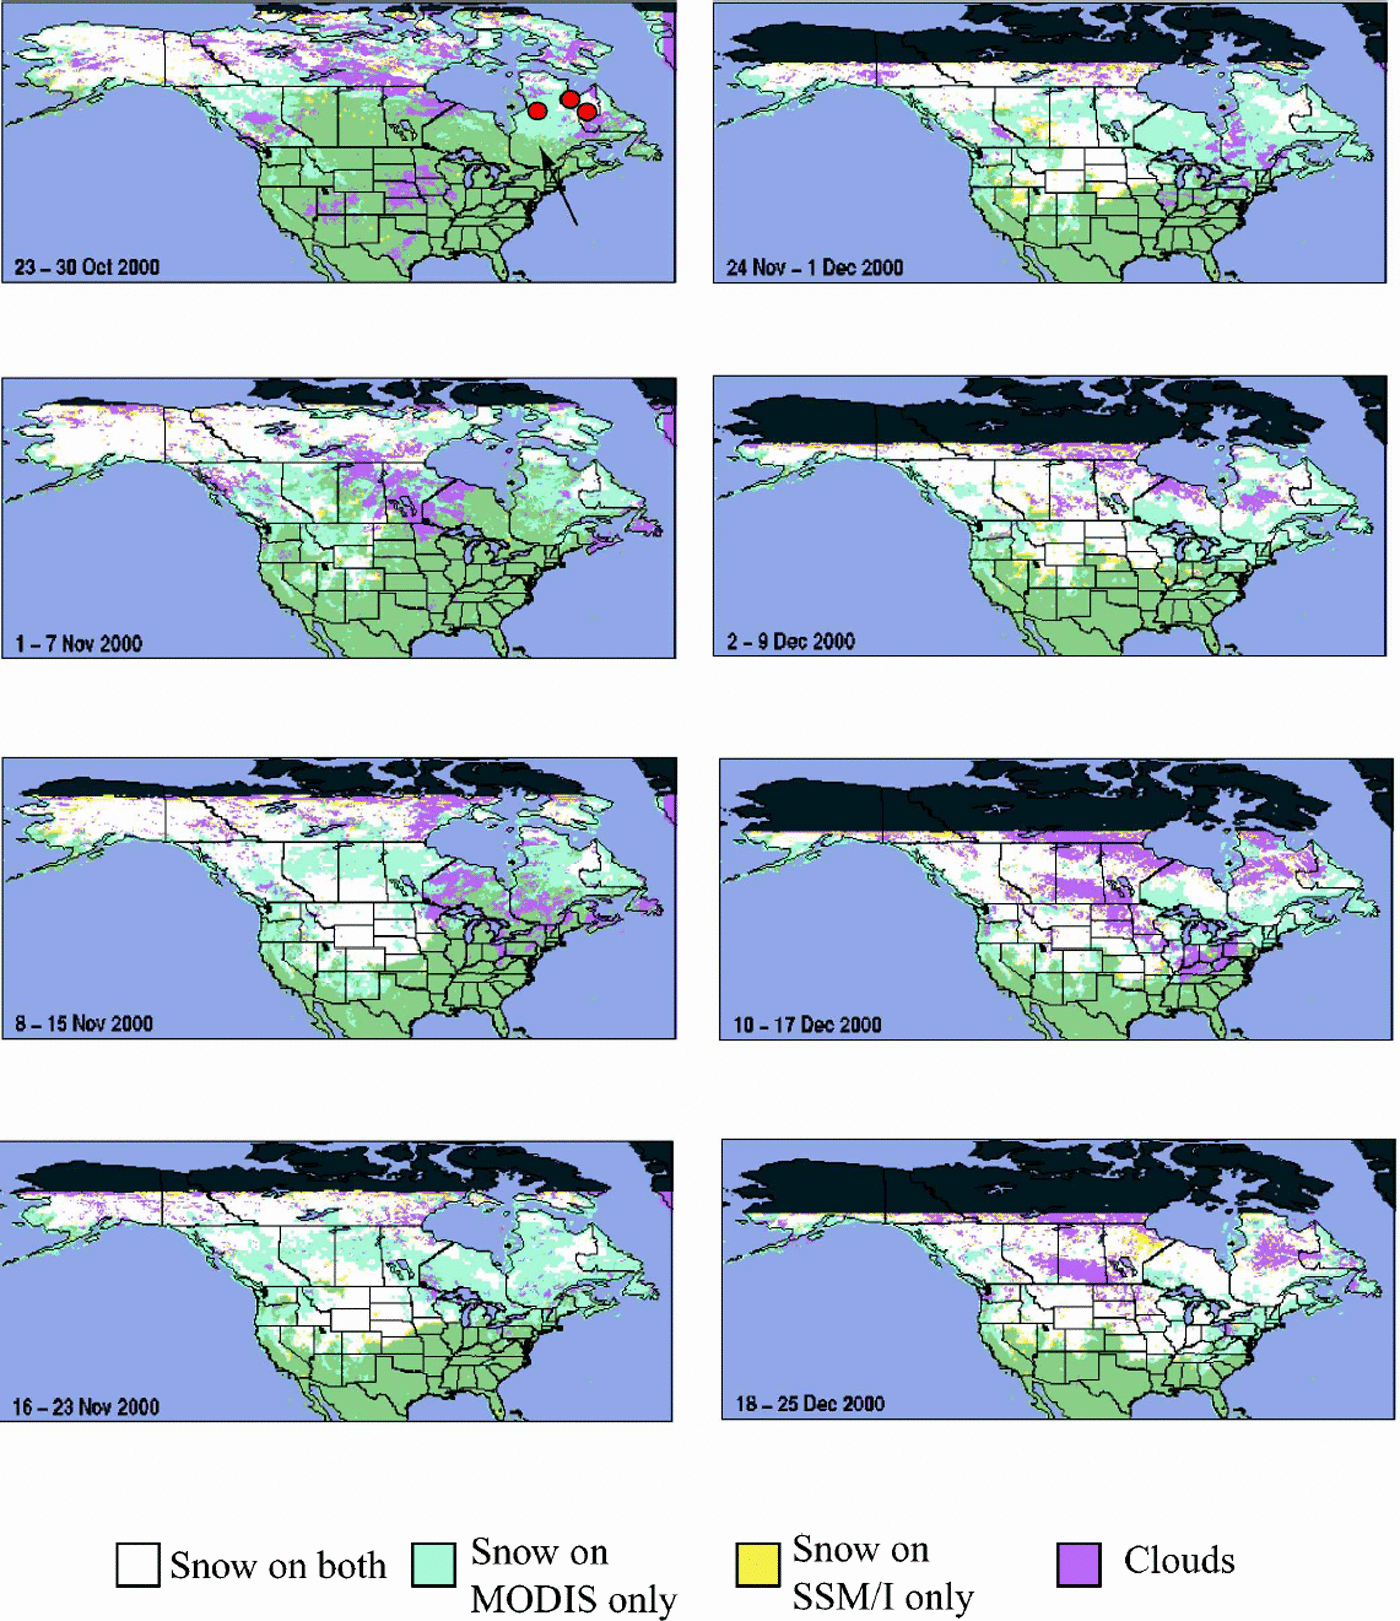
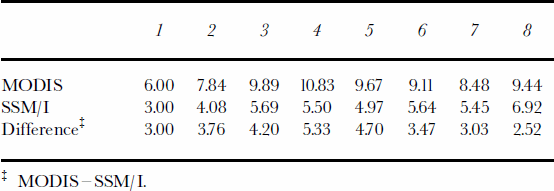
The MODIS maps also show more snow cover than do the SSM/I maps (Fig. 2; Table 2). For example, over most of the province of Quebec, the MODIS and IMS maps show snow cover during all of the 8 day periods (Fig.2), while the SSM/I map shows much less snow there, especially early in the snow season. However, by 10 December through the end of the study period, 25 December, there is much better agreement between the MODIS and SSM/Imaps (see next section).
Meteorological data from three stations in Quebec––La Grande, Schefferville and Kuujjuaq––shown in Figure 3 reveal average temperatures during the period from 23 October to early December 2000, at or above 0°C. With above-freezing temperatures, there will be enough moisture in the snowpack to cause the microwave emission to increase, and the snow-mapping algorithms cannot distinguish wet snow from wet ground. Also, shallow (55 cm) snowpacks, characteristic of early-season conditions, are transparent to microwave radiation.
MODIS–SSM/I difference maps show snow mapped on both snow maps and one or the other, exclusive of cloud cover (from the MODIS map). On the first image, the arrow shows the province of Quebec in Canada, and the red circles show the approximate positions of the meteorological stations. From west to east, the stations are La Grande, Kuujjuaq and Schefferville.
Meteorological-station air-temperature data for three stations in the province of Quebec. Numbers refer to the following time periods, 23 October–25 December 2000 (see Table1).

Snow-covered area in 106km2 for each 8 day composite snow-cover product, exclusive of MODIS cloud cover, for MODIS and SSM/I snow maps. Numbers refer to 8 day periods, 23 October–25 December 2000 (see Table 1)
Discussion And Conclusion
Analysis of the eight time periods, beginning on 23 October and ending on 25 December 2000, reveals that the MODIS maps nearly always show more snow cover than do the NOHRSC maps. MODIS, because of its frequent coverage, permits the mapping of some fleeting snowstorms that may be missed (either accidentally or intentionally) in both the NOAA operational products (NOHRSC and IMS). Since the NOHRSC and IMS products are subjective, the analysts who construct the maps may use ground data, in addition to satellite data, to refine the snow maps. Some minor snow events, located at the edges of areas mapped as snow by both maps, may not be deemed significant enough to label as snow if the snow cover is not continuous or persistent, a common occurrence especially at the beginning of the snow season. Or, the mapping techniques will miss the effects of these storms if the maps are not produced on a frequent basis. In general, there were not eight NOHRSC maps for each 8 day period, while the MODIS maps were produced from 8 days of data (except the 1–7 November period). NOAA’s IMS product is produced daily. The greater temporal resolution of the MODIS maps is advantageous for mapping maximum snow cover, because several swaths of data may be obtained on the same day.
However, the MODIS maps exaggerate the amount of snow in some locations, as determined from comparisons with NOHRSC, IMS and ETM+ images. This is obvious in the Pacific Northwest (western Washington, Oregon and northern California). While there is snow in these locations ––often only scattered snow cover––the MODIS maps show nearly continuous snow cover in some cases. Thebinning technique to map the 500m resolution MODIS maps into 1/4°6 1/4° resolution maps may permit overestimation of snow cover in some cases. Where only a small amount of the cell is snow-covered, in these early MODIS products, the entire 1/4°61/4° pixel will be mapped as snow. An improved binning technique is under development. Maps will be produced at 1/20°61/20°, or 5.6 kmresolution, beginning in the fall of 2001, and fractional snow cover will be provided as well. This should enhance the utility of the maps considerably.
A modification of the Reference Chang, Foster and HallChang and others (1987) algorithm, and the Reference Grody and BasistGrody and Basist (1996) SSM/I algorithm were studied, and the Reference Grody and BasistGrody and Basist (1996) algorithm was found to map even less snow cover in the early part of the snowseason than did the Reference Chang, Foster and HallChang and others (1987) modified algorithm. It was therefore decided that the Reference Chang, Foster and HallChang and others (1987) modified algorithm was superior for the purposes of this work.
As the winter progresses, agreement between the MODIS and SSM/I maps improves. This was also noted by Reference Armstrong and BrodzikArmstrong and Brodzik (1999) in their comparison study using the SSM/I maps and the NESDIS weekly maps. As the snow deepens during winter, and the temperatures are consistently colder, the SSM/I mapping improves, and the agreement between the visible and passive-microwavemaps improves. Areas of discrepancy are still present, however, especially in coastal areas where mixed pixels of SSM/I data erroneously map the coastal areas as snow-free when in fact there is snow. An example of this may be seen in northern Quebec on the 18–25 December 2000 MODIS/SSM/I difference map (Fig. 2).
The results herein are specific to the North American continent. There are likely to be circumstances on other continents that affect the results of snow mapping with the MODIS algorithms, and these can only be discovered by performing such studies on other continents.
With the launch of NASA’s Aqua satellite in 2001, snow-mapping algorithms will be developed using the Advanced Microwave Scanning Radiometer–EOS (AMSR-E) sensor (Reference Chang, Koike, Pampaloni and PalosciaChang and Koike, 2000) that should utilize the superior mapping capabilities of the visible sensors, and the all-weather capabilities of the passive-microwave sensors (Reference Tait, Hall, Foster and ArmstrongTait and others, 2000). The improved spatial resolution of the AMSR-E data (up to 12.5 km), relative to the coarser resolution of the SSM/I, will facilitate comparison with visible and near-infrared snow maps.
Near-term improvements in the MODIS snow-mapping algorithm include providing the 8 day composite snow-cover maps at 5.6 km resolution, and improving the usage of the cloud mask (Reference Ackerman, Strabala, Menzel, Frey, Moeller and GumleyAckerman and others, 1998), so that fewer clouds are mapped erroneously as snow.
While the intent of this work was not to establish which product is the most accurate, it is obvious that the passive-microwave data are less accurate in terms of mapping total snow-covered area. This is due to the relatively low (*30 km) spatial resolution of the data, and the fact that the wet snow and shallow snow may not be mapped by the existing automated passive-microwave algorithms, especially in the early part of the snow season.
Relative errors in snow-cover mapping, using both visible/near-infrared and passive-microwave maps, are easier to ascertain than absolute errors. This is because it is very often impossible, in retrospect, to determine which map is the most accurate, or precisely where the snow was located. A technique that combines ground measurements with determination of snow-mapping accuracy in different land-cover types (e.g. Reference Hall, Foster, Salomonson, Klein and ChienHall and others, 2001) is an attempt to begin to temperature data for three stations snow-cover maps.
MODIS and NOHRSC maps often agree very well, except that the MODIS nearly always maps more snow cover than does the NOHRSC (Table 1). MODIS maps show more snow than the NOHRSC maps, especially at the beginning of the snow season when the more frequent temporal coverage of MODIS permits mapping of shallow snow deposits from fleeting storms. However, we do not know which map is the more accurate since none of the hemispheric-scale snow maps has been fully validated. We can only study the relative accuracy of the maps at this time, augmented by accuracy assessments in selected locations where we have access to either ground measurements or Landsat ETM+ data.
Acknowledgements
The authors would like to thank J. Chien of General Sciences Corporation, Laurel, MD, and N. DiGirolamo of Science Systems and Applications, Inc., Lanham, MD, for programming and image processing of the satellite images.



