




Introduction
Statistical regularities—the distributional patterns of linguistic units, which can be measured in various ways, including frequency, association strength, and dispersion—shape language processing (Ellis & Wulff, Reference Ellis and Wulff2014; Goldberg, Reference Goldberg1995; Gries & Ellis, Reference Gries and Ellis2015). Statistical learning theory (Christiansen, Reference Christiansen2019) suggests that language speakers are highly attuned to statistical distributional patterns in language. Usage-based approaches propose that these patterns extend from single words to multiword expressions (MWEs). Statistical learning is primarily implicit (Christiansen, Reference Christiansen2019), as speakers unconsciously extract statistical regularities from input. Yet, growing evidence suggests an interface between implicit learning and explicit processing (Ellis, Reference Ellis2009). This raises a question: Do language speakers possess statistical metacognition (i.e., explicitly retrievable statistical intuition) that reflects conscious access to implicitly acquired statistical knowledge? We explore L1, advanced and intermediate L2 speakers’ statistical metacognition of MWEs.
Previous studies have demonstrated that speakers possess statistical metacognition. In the mid-20th century, Tryk (Reference Tryk1968) found L1 speakers’ judgments largely aligned with the statistical properties of language. For MWEs, Siyanova-Chanturia and Schmitt (Reference Siyanova-Chanturia and Schmitt2008) reported that L1 speakers’ frequency metacognition closely matched corpus data, while Yi et al. (Reference Yi, Man and Maie2023) found L1 and L2 speakers’ metacognition of frequency and association strength diverged from corpus statistics. Statistical learning also varies individually. From L1 to advanced and intermediate L2 learners, implicit experience tends to decline while reliance on explicit rules and cognitive effort increases (Ellis & Wulff, Reference Ellis and Wulff2014)—likely leading to group differences in metacognition. However, few studies have examined the multifaceted nature of metacognition beyond frequency across L1, advanced L2, and intermediate L2 speakers of MWEs.
To bridge the gap, the present study investigates L1, advanced and intermediate L2 speakers’ ratings of frequency, dispersion, forward association, and backward association for binomials (e.g., salt and pepper)—a key type of MWEs—and compares them to statistical regularities in Corpus of Contemporary American English (COCA; Davies, Reference Davies2009). Statistical metacognition has been examined from three perspectives: (1) speaker-to-corpus consistency—the consistency between speakers’ statistical metacognition and the distributional statistics of language, quantified by the degree of divergence between users’ statistical judgments and the statistical regularities of language as measured in a representative corpus; (2) sensitivity—the degree to which language speakers’ statistical judgments vary in response to differences in the statistical properties of language, reflecting the responsiveness of their mental representation to distributional patterns; and (3) other contributing factors—how phrasal-level statistical regularities beyond the target type being rated, word-level statistics, and word-form features contribute to language speakers’ statistical metacognition.
Literature review
MWE and their statistical regularities
Language speakers accumulate linguistic constructions of varying granularity that pair form with meaning and function, such as words, MWEs, and sentences (Goldberg, Reference Goldberg1995). MWEs are recurrent combinations of words that co-occur more often than would be expected by chance (Siyanova-Chanturia & Martinez, Reference Siyanova-Chanturia and Martinez2015; Yi & Zhong, Reference Yi and Zhong2024).Footnote 1 They account for nearly half of the occurrences in L1 use (Siyanova-Chanturia, Reference Siyanova-Chanturia2015) and show a processing advantage compared to novel word combinations (Siyanova-Chanturia et al., Reference Siyanova-Chanturia, Conklin and Van Heuven2011).
MWE processing is closely tied to chunking processes driven by statistical learning mechanisms (Christiansen, Reference Christiansen2019). MWEs are defined by statistical properties rather than specific syntactic or semantic features, making them a broad category that includes collocations (Wolter & Yamashita, Reference Wolter and Yamashita2018), idioms (Carrol & Conklin, Reference Carrol and Conklin2014), binomials (Morgan & Levy, Reference Morgan and Levy2016; Siyanova-Chanturia et al., Reference Siyanova-Chanturia, Conklin and Van Heuven2011), and lexical bundles (Tremblay et al., Reference Tremblay, Derwing, Libben and Westbury2011). Among these, binomials have received less attention. Binomials are defined as recurrent combinations of words that occur more often than chance, joined by “and” or “or,” and exhibit a preferred word order (Siyanova-Chanturia et al., Reference Siyanova-Chanturia, Conklin and Van Heuven2011). Their uniform structure and semantic simplicity (with opaque binomials excluded from this study) make them comparable across items, serving in this study as both the focus and a window into statistical metacognition across the broad class of MWEs.
MWEs, including binomials, exhibit statistical regularities that reflect the distributional patterns of linguistic units across usage contexts, such as frequency, association strength, and dispersion. Frequency reflects the likelihood of encountering linguistic units. It drives automatized processing (Gries & Ellis, Reference Gries and Ellis2015) and is central to language acquisition (Goldberg, Reference Goldberg1995). Frequency effects are among the most robust findings in psycholinguistics (e.g., Öksüz et al., Reference Öksüz, Brezina and Rebuschat2021; Siyanova-Chanturia et al., Reference Siyanova-Chanturia, Conklin and Van Heuven2011). Nevertheless, frequency alone cannot capture the complexity of MWE statistical distribution. Dispersion instead captures how widely a linguistic unit is distributed across macro-level usage contexts (e.g., genres, registers, textual sections) in a language (Gries, Reference Gries2024; Gries & Ellis, Reference Gries and Ellis2015). Contextual learning theory (Martin, Reference Martin2014) suggests that language acquisition is shaped not only by repeated exposure to linguistic units but also involves acquiring varied macro-level communicative contexts. MWEs with identical frequency may differ in dispersion, with some context-specific and others broadly distributed. Key dispersion metrics include Juilland’s D, Carroll’s D2, and Kullback–Leibler Divergence (KLD, Gries, Reference Gries2024). Beyond frequency and dispersion, association strength quantifies the statistical relationship between MWE components (Yi et al., Reference Yi, Man and Maie2023). Language speakers are able to track such patterns, as described by associative learning theory (Gries & Ellis, Reference Gries and Ellis2015). Pointwise mutual information (PMI), log Dice, and t-score capture bidirectional associations but lack directionality (Öksüz et al., Reference Öksüz, Brezina and Rebuschat2021; Yi, 2018). Unidirectional measures—such as forward/backward transition probabilities, delta Ps, and KLD—capture directional dependencies (Gries & Ellis, Reference Gries and Ellis2015).
Statistical learning mechanism and statistical metacognition
Language speakers possess robust, largely implicit statistical learning mechanisms without the involvement of explicit awareness for encoding distributional patterns (Christiansen, Reference Christiansen2019). Language speakers have shown implicit sensitivity to word frequency (Öksüz et al., Reference Öksüz, Brezina and Rebuschat2021), whereas evidence for dispersion effects is mixed: Gries (Reference Gries2024) found dispersion more predictive of reaction times than frequency, whereas Baayen et al. (Reference Baayen, Milin and Ramscar2016) reported the opposite. Frequency effects also extend to MWEs, as evidenced in the processing of binomials (Conklin & Carrol, Reference Conklin and Carrol2021; Siyanova-Chanturia et al., Reference Siyanova-Chanturia, Conklin and Van Heuven2011; Sonbul et al., Reference Sonbul, El-Dakhs, Conklin and Carrol2023), collocations (Öksüz et al., Reference Öksüz, Brezina and Rebuschat2021), and lexical bundles (Tremblay et al., Reference Tremblay, Derwing, Libben and Westbury2011). For instance, Siyanova-Chanturia et al. (Reference Siyanova-Chanturia, Conklin and Van Heuven2011) and Morgan and Levy (Reference Morgan and Levy2016) showed that both L1 and L2 speakers read frequent conventional binomials more fluently than reversed ones. Conklin and Carroll (Reference Conklin and Carrol2021) found novel binomials gain processing advantages after limited exposure in L1 speakers, and Suhad et al. (2023) showed similar effects for L2 learners. Recent studies also indicated that association strength, using metrics like PMI (Yi et al., Reference Yi, Lu and Ma2017) and log Dice (Öksüz et al., Reference Öksüz, Brezina and Rebuschat2021), moderated MWE processing.
Although statistical learning is primarily implicit, language speakers also develop a form of statistical metacognition—the explicit, conscious, and reflective evaluation of statistical regularities likely acquired intuitively (Siyanova-Chanturia & Spina, Reference Siyanova-Chanturia and Spina2015; Tryk, Reference Tryk1968; Yi et al., Reference Yi, Man and Maie2023). As suggested by implicit and explicit learning theory (Ellis, Reference Ellis2009), language learning involves both implicit automatized processes that operate without conscious awareness and explicit effortful processes that support metalinguistic reflection (Ellis, Reference Ellis2009). In this study, participants were engaged in explicit rating tasks that required them to consciously evaluate the statistical properties of binomials, in contrast to real-time language processing that typically draws on implicit routines (see Yi et al., Reference Yi, Man and Maie2023, for a review). Such offline, reflective rating tasks are cognitively demanding and may elicit conscious reasoning over intuitively acquired impressions (Ellis, Reference Ellis2009). This contrasts with the real-time, automatic processing of statistical regularities without the involvement of metalinguistic knowledge (Siyanova-Chanturia & Schmitt, Reference Siyanova-Chanturia and Schmitt2008; Siyanova-Chanturia & Spina, Reference Siyanova-Chanturia and Spina2015).
Three aspects of statistical metacognition
Statistical metacognition can be evaluated in terms of speaker-to-corpus consistency, sensitivity, and other contributing factors. Speaker-to-corpus consistency is measured by the absolute standardized difference between language speakers’ judgments and the statistical properties of language. Smaller differences indicate greater speaker-to-corpus consistency and a more precise metalinguistic representation of statistical knowledge aligned with language. Sensitivity captures how strongly language speakers’ statistical judgments systematically respond to variations in the distributional patterns of linguistic units, reflecting the strength of the statistical learning mechanism. Other contributing factors include phrasal-level statistical regularities beyond the target type being rated (e.g., association strength when rating frequency), as well as word-level statistics (e.g., word frequency and dispersion) and word-form features (e.g., word length, orthographic and phonological neighborhood).
L1 speakers’ statistical metacognition of individual words has been examined, partially reflecting the three aspects of metacognition outlined above. Tryk (Reference Tryk1968) reported high correlations (>0.7) between L1 word frequency ratings and corpus counts. Schmitt and Dunham (Reference Schmitt and Dunham1999) used a relative estimation task where L1 speakers rated word frequency against a reference anchor, reporting generally good absolute frequency judgments of participants and moderate correlations with corpus data (~0.5). In contrast, MWE-level research remains limited. Siyanova-Chanturia and Schmitt (Reference Siyanova-Chanturia and Schmitt2008) found that L1 speakers could distinguish between high- and medium-frequency English collocations on a six-point scale. Later, Siyanova-Chanturia and Spina (Reference Siyanova-Chanturia and Spina2015) found similar results with Italian collocations rated on a four-point scale, with the clearest separation between highest- and very-low-frequency items. Beyond frequency, Yi et al. (Reference Yi, Man and Maie2023) found that L1 speakers correctly distinguished collocations across frequency and association strength bins about 40% of the time on a three-point scale, with better differentiation for higher-statistics items. Additionally, low-to-moderate correlations have been reported between L1 speakers’ frequency estimates and corpus data for Swedish three-word combinations (Backman, Reference Backman1978), Italian (Siyanova-Chanturia & Spina, Reference Siyanova-Chanturia and Spina2015), and English (Siyanova-Chanturia & Schmitt, Reference Siyanova-Chanturia and Schmitt2008; Yi et al., Reference Yi, Man and Maie2023) collocations.
Furthermore, metacognitive judgments about one type of statistical regularities (e.g., frequency) were found to be shaped by others (e.g., association strength), and vice versa (Yi et al., Reference Yi, Man and Maie2023). In addition, word-level statistics (e.g., word frequency) and word-form features (e.g., word length) may also shape phrasal statistical metacognition (Siyanova-Chanturia & Spina, Reference Siyanova-Chanturia and Spina2015), as proposed in the dual-route model (Carrol & Conklin, Reference Carrol and Conklin2014). For instance, word frequency and dispersion shape expectations about the distributional patterns (Gries & Ellis, Reference Gries and Ellis2015) and may serve as cues to phrasal probability. Word length and orthographical/phonological neighborhood—the number of orthographically/phonologically similar words differing by one letter/phoneme (Marian et al., Reference Marian, Bartolotti, Chabal and Shook2012)—reflect surface-level complexity and lexical competition. Larger neighborhoods potentially increase cognitive load in visual and auditory word recognition (Yates et al., Reference Yates2005). These word-level factors, while often overlooked in MWE studies, may influence statistical metacognition.
Differences in statistical metacognition among L1, advanced, and intermediate L2 speakers
L1 speakers and L2 learners—including advanced learners immersed in target-language environments and intermediate learners in foreign-language contexts—may differ in their statistical learning mechanisms, as reflected in empirical findings. Some studies reported stronger MWE frequency effects for L1 speakers (Siyanova-Chanturia et al., Reference Siyanova-Chanturia, Conklin and Van Heuven2011), others for L2 speakers (Yi et al., Reference Yi2018), and some reported no difference (Öksüz et al., Reference Öksüz, Brezina and Rebuschat2021) in online processing of MWEs. For metacognition, Schmitt and Dunham (Reference Schmitt and Dunham1999) found L2 speakers’ frequency ratings correlated more strongly with corpus data than L1 speakers, while others reported stronger rating-corpus correlations for medium-, high-, and very low-frequency collocations (Siyanova-Chanturia & Schmitt, Reference Siyanova-Chanturia and Schmitt2008; Siyanova-Chanturia & Spina, Reference Siyanova-Chanturia and Spina2015) and association strength (Yi et al., Reference Yi, Man and Maie2023) in L1 speakers.
Differences in statistical metacognition across L1 speakers, advanced L2 learners, and intermediate L2 learners can be explained by differences in acquisition modes (implicit vs. explicit), learning contexts, cognitive resources, developmental trajectories, and processing strategies. First, usage-based (Ellis & Wulff, Reference Ellis and Wulff2014) and explicit-implicit learning theories (Ellis, Reference Ellis2005, Reference Ellis2009) suggest L1 speakers acquire language implicitly through rich exposure, while intermediate L2 learners rely largely on explicit, rule-based classroom learning. Advanced L2 learners may benefit from a more effective combination of richer statistical knowledge acquired through natural exposure and enhanced metalinguistic reflection fostered by explicit instruction, probably leading to stronger statistical metacognition in rating tasks. Second, contextual learning theory (Martin, Reference Martin2014) emphasizes the importance of communicative contexts in language development. L1 speakers gain context-rich MWE input through early, varied natural exposure (Adolphs & Durow, Reference Adolphs and Durow2004). Advanced L2 learners in English-speaking environments, though less immersed than L1 speakers, receive more authentic input than intermediate learners, whose exposure is largely limited to constrained discourse (Batstone, Reference Batstone2002). Third, cognitive cost shapes processing strategies. Under the shallow-structure hypothesis (Clahsen & Felser, Reference Clahsen and Felser2006), intermediate L2 learners rely on surface-level cues (e.g., word length) due to higher demands, whereas advanced L2 learners and L1 speakers engage in deeper, usage-based processing with less effort. Fourth, developmental timing matters. According to the power law of practice (DeKeyser, Reference DeKeyser2020), early-stage learning yields greater marginal gains, as each input instance makes up a larger share of total language experience. As a result, L1 speakers—whose extensive language experience overshadows statistical variation—may show weaker metacognitive sensitivity to statistical regularities than advanced and intermediate L2 learners. Finally, the dual-route model (Carrol & Conklin, Reference Carrol and Conklin2014) suggests that L1 speakers can process MWEs more holistically, enhancing fluency and reducing cognitive load. Advanced L2 learners may also rely less on word-level processing, especially with extensive natural exposure to MWEs. In contrast, intermediate learners tend to use analytical strategies and focus on constituent words.
Together, these theoretical frameworks suggest that statistical metacognition differs across L1 speakers, advanced L2 learners, and intermediate L2 learners.
The current study
To summarize, research has largely focused on implicit statistical knowledge, with limited attention to statistical metacognition. In addition, most studies examined individual words, leaving it unclear whether the statistical metacognition extends to binomials—an important MWE type. Third, previous research has not systematically analyzed statistical metacognition in terms of speaker-to-corpus consistency, sensitivity, and contributing factors. Fourth, prior work focused on frequency (Siyanova-Chanturia & Spina, Reference Siyanova-Chanturia and Spina2015) and undirected association strength (e.g., PMI, Yi et al., Reference Yi, Man and Maie2023), neglecting directional association strength and dispersion. Furthermore, prior studies have relied on relatively coarse rating scales, such as three-point (Yi et al., Reference Yi, Man and Maie2023), four-point (Siyanova-Chanturia & Spina, Reference Siyanova-Chanturia and Spina2015), and six-point (Siyanova-Chanturia & Schmitt, Reference Siyanova-Chanturia and Schmitt2008), limiting the capture of finer-grained, continuous variation in statistical metacognition. Finally, limited studies compare statistical metacognition across proficiency levels, leaving the roles of language experience in statistical metacognition unclear.
To bridge the gaps, we proposed three research questions (RQs):
RQ1: Speaker-to-corpus consistency of statistical metacognition: (a) To what extent are language speakers’ judgments close to the corpus-based statistical regularities of binomials? (b) How do language speaker group (L1 speakers, advanced L2 learners, and intermediate L2 learners), type of statistical regularities (frequency, forward association, backward association, dispersion), and their interactions affect the speaker-to-corpus consistency of statistical metacognition?
RQ2: Sensitivity of statistical metacognition: (a) To what extent do language speakers’ judgments respond to variations in the corpus-based statistical regularities of binomials? (b) Does the sensitivity vary by language speaker group and type of statistical regularities?
RQ3: Other contributing factors: (a) To what extent do phrasal-level statistical regularities beyond the target type, as well as word-level statistics (e.g., word frequency and dispersion) and word-form features (e.g., word length, orthographic and phonological neighborhood) influence language speakers’ statistical metacognition? (b) Do these factors vary in their influence by language speaker group and type of statistical regularities?
Methodology
Participants
We recruited 94 participants via Prolific: 34 L1 English speakers (19 males), 30 advanced L2 learners (14 males), and 30 intermediate L2 learners (19 males), all aged 18–35 with a bachelor’s degree. Participants were paid $16/hour.
L1 speakers acquired English from birth. L2 speakers had a non-English L1, began learning English after age three, and received formal instruction. All L1 speakers and advanced L2 learners were residing in the U.S. during participation. To distinguish L2 proficiency levels, extended immersion in an English-speaking environment served as the primary criterion. Advanced L2 learners met the following criteria: (1) length of residence in English-speaking countries ≥8 years (required), plus at least two of: (2) ≥50 hours/week English use, (3) age of acquisition ≤10, and (4) self-rated proficiency ≥8 on a 9-point Likert scale across all language skills. Intermediate L2 learners had ≤ 2 years of residence (required) and met no more than two of the other criteria.
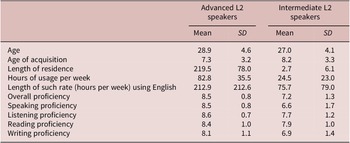
Mean ages were 28.5 (SD = 6.0) for L1 speakers, 28.9 (SD = 4.6) for advanced L2 learners, and 27.0 (SD = 4.1) for intermediate L2 learners. Advanced L2 learners began acquiring English at 7.3 years old (SD = 3.2), lived in the U.S. for 219.5 months (SD = 78.0), and used English 82.8 hours/week (SD = 35.5) over 212.9 months (SD = 212.6), through both formal instruction and daily use. Intermediate L2 learners began acquiring English at 8.2 years old (SD = 3.3), had little to no residence in English-speaking environments (M = 2.7 months, SD = 6.1), and used English 24.5 hours/week (SD = 23.0) over 75.7 months (SD = 79.0), primarily in classroom settings. On a 9-point self-assessment scale, advanced L2 learners rated higher in overall proficiency (8.5 vs. 7.2), reading (8.4 vs. 7.9), listening (8.6 vs. 7.7), speaking (8.5 vs. 6.6), and writing (8.1 vs. 6.9; see Table 1).
Demographic characteristics of L2 learners

Table 1. Long description
The table is organized into five columns. The first column lists the demographic or proficiency category. The next two columns provide the Mean and S D for Advanced L2 speakers. The final two columns provide the Mean and S D for Intermediate L2 speakers.
* Age: Advanced Mean 28.9, S D 4.6; Intermediate Mean 27.0, S D 4.1.
* Age of acquisition: Advanced Mean 7.3, S D 3.2; Intermediate Mean 8.2, S D 3.3.
* Length of residence: Advanced Mean 219.5, S D 78.0; Intermediate Mean 2.7, S D 6.1.
* Hours of usage per week: Advanced Mean 82.8, S D 35.5; Intermediate Mean 24.5, S D 23.0.
* Length of such rate (hours per week) using English: Advanced Mean 212.9, S D 212.6; Intermediate Mean 75.7, S D 79.0.
* Overall proficiency: Advanced Mean 8.5, S D 0.8; Intermediate Mean 7.2, S D 1.3.
* Speaking proficiency: Advanced Mean 8.5, S D 0.8; Intermediate Mean 6.6, S D 1.7.
* Listening proficiency: Advanced Mean 8.6, S D 0.7; Intermediate Mean 7.7, S D 1.2.
* Reading proficiency: Advanced Mean 8.4, S D 1.0; Intermediate Mean 7.9, S D 1.0.
* Writing proficiency: Advanced Mean 8.1, S D 1.1; Intermediate Mean 6.9, S D 1.4.
Note: We did not report English test scores, as only 14 L2 learners had taken an English test, with varied types (e.g., IELTS, TOEFL, SAT).
Stimuli
As previously noted, binomials are defined as “and”- or “or”-linked recurrent combinations of words that co-occur more often than chance and show a preferred order. We focused on transparent, noun-noun binomials joined by “and” for their structural regularity and semantic simplicity, which allow better control and measurement of statistical properties compared to structurally variable (e.g., lexical bundles) or opaque (e.g., idioms) MWEs. Using regular expressions, we extracted 28,967 “Noun + and + Noun” pairs from COCA (1990–2019; ~950M words, https://www.corpusdata.org), a widely used, thematically diverse corpus balanced across eight registers (e.g., spoken, fiction). COCA is considered a reliable proxy for large-scale, broad, balanced English usage patterns, and its pre-labeled text units enable precise dispersion computation. We retained binomials with above-chance co-occurrence (t-score > 2)Footnote 2 and more than 10 occurrences, yielding 4,813 items. We then removed abbreviations (e.g., CEO), redundancies (e.g., hour and hour), proper nouns (e.g., Israeli and Arab), and semantically opaque items (e.g., spick and span). For binomials with both higher-frequency conventional (e.g., sun and moon) and lower-frequency reversed (e.g., moon and sun) forms, only conventional forms were kept. To ensure consistency, we retained only those with dominant singular forms, resulting in 2,054 binomials.
To enhance representativeness, we grouped all pre-labeled text units in COCA into 2,700 balanced sections. We then applied bootstrap resampling to extract 2,700 sections 1,000 times, generating 1,000 corpora matching the original COCA’s size. For each corpus, we calculated binomial frequency (per million words, log-transformed), forward and backward association strength, and dispersion, then averaged these values across all 1,000 corpora. KLD was used for association strength as it captures directionality and is less correlated with frequency than some of traditional association metrics (e.g., pFisher-Yates, z; Gries, Reference Gries2024). Table 2 shows the contingency table (Gries, Reference Gries2013). Equations (1) and (2) compute forward and backward association. Higher values indicate stronger associations. For the bigram “word1 word2,” forward association quantifies how word2’s distribution following word1 diverges from its overall distribution. Backward association does the same for word1 given word2.
Contingency table

Table 2. Long description
The table consists of four columns and four rows.
Header Row: The first column is blank. The second column is Co-occurring element X. The third column is Other elements (not X). The fourth column is Row totals.
Row 1: The first cell is Element E. The intersection with Element X is ‘a’. The intersection with Other elements is ‘b’. The row total is ‘a plus b’.
Row 2: The first cell is Other elements (not E). The intersection with Element X is ‘c’. The intersection with Other elements is ‘d’. The row total is ‘c plus d’.
Row 3: The first cell is Column totals. The total for Element X is ‘a plus c’. The total for Other elements is ‘b plus d’. The grand total in the final cell is ‘a plus b plus c plus d equals n’.
A note below the table defines the variables: cell ‘a’ represents E occurring with X; ‘b’ represents E occurring without X; ‘c’ represents X occurring without E; and ‘d’ represents neither E nor X occurring.
Note: Cell a = E occurs with X; b = E occurs without X; c = X occurs without E; d = neither E nor X occurs.


Dispersion was calculated using KLD across COCA’s 2,700 predefined sections, each representing a document varying in genre, topic, or register. This segmentation helps explore contextual learning theory (Martin, Reference Martin2014), which emphasizes the role of micro-level contextual exposure in language acquisition. KLD was chosen to ensure comparability with the KLD-based association strength. Equation (3) shows the dispersion of unit a, where i is the number of corpus parts, v is its frequency in each part, f is the total frequency, and s is the percentage of each part size.

To balance binomials across low and high bands of frequency, association strength, and dispersion, we split them into two bins per dimension, forming 16 groups (see Appendix 1 for the detailed binomial profiles within each statistical group). From each, 15–20 binomials were selected. Familiarity of each binomial was rated through an online questionnaire by two L1 speakers and five intermediate L2 learners (not in the main study) on a 5-point Likert scale (1 = completely unfamiliar, 5 = very familiar). Binomials were retained only if they received an average rating above 4 from L1 speakers and above 3 from L2 speakers. We also ensured no repeated words across binomials. In total, 300 binomials were selected as stimuli.
Procedure
We created questionnaires (see Appendix 2) on Qualtrics and distributed them via Prolific to collect ratings of statistical regularities. Each included demographic questions and four statistical rating blocks, with block order balanced via a Latin square design and binomial order randomized within each block. Detailed instructions and examples were provided for each block. For frequency, participants rated how often a binomial occurred in their language use (1 = a few times, 9 = many times). For dispersion, they rated the number of different usage contexts in which they encountered a binomial (1 = few contexts, 9 = many contexts). For forward association, they assessed how easy it was to predict the second word from the first (1 = very difficult, 9 = very easy). For backward association, they rated how easy it was to predict the first word from the second (1 = very difficult, 9 = very easy). Participants rated all 300 binomials on a 9-point slider (1-decimal precision) across four blocks of statistical regularities. The questionnaire had no time limit and took approximately 100 minutes to complete. We also collected word-level information of binomials. Word frequency (log-transformed per million) and dispersion were extracted from COCA. Word-form features (word length, orthographic and phonological neighborhood) came from CLEARPOND (Marian et al., Reference Marian, Bartolotti, Chabal and Shook2012, see Appendix 1 for rating data, binomial list, and all word-level information).
Data analyses
We collected data from 34 L1, 30 advanced L2, and 30 intermediate L2 speakers, yielding 28,200 data points. One L1 speaker was excluded for giving identical ratings to over 80% of items. For each binomial under each statistical measure, we excluded ratings beyond 2.5 standard deviations within each language speaker group (458 outliers from L1 speakers, 414 from advanced L2 learners, and 531 from intermediate L2 learners). We then standardized ratings within each participant and corpus data across binomials for each statistical measure. Other phrase- and word-level continuous predictors were also standardized.
To address RQ1 (speaker-to-corpus consistency), we constructed a linear mixed-effects model with type of statistical regularities (frequency, dispersion, forward and backward association) and speaker group (L1, advanced L2, intermediate L2) as fixed effects. Both variables were treated as categorical and treatment-coded, with their interaction also included as predictors. The dependent variable was the absolute difference between standardized corpus values and standardized ratings (see Appendix 3 for model RQ1-RQ3 formulas).
To address RQ2 (sensitivity) and RQ3 (other contributing factors), four linear mixed-effects models were built, each with one type of statistical rating (frequency, dispersion, forward and backward association) as the dependent variable. For RQ2, one type of statistical regularity from COCA, corresponding to the type of statistical rating used as the dependent variable, was employed as the independent variable. The COCA-based statistical regularities were divided into tertiles (low, medium, and high statistical bins) based on ranked values, with equal item counts per bin, to capture non-linear statistical effects (e.g., thresholds, plateaus) on metacognition observed in prior studies (Yi et al., Reference Yi, Man and Maie2023; Yi & Zhong, Reference Yi and Zhong2024). For RQ3, additional standardized continuous variables, including other types of phrase-level statistical regularities that are distinct from the dependent variable, word-level statistics (e.g., word frequency and dispersion), and word-form features (e.g., word length, orthographic/phonological neighborhood), were included as independent variables.
Correlation coefficients for all variables were calculated. Four pairs showed high correlation: word1 (i.e., left conjoint) frequency and dispersion (r = 0.87), word2 (i.e., right conjoint) frequency and dispersion (r = 0.84), word1 orthographic and phonological neighborhoods (r = 0.93), and word2 orthographic and phonological neighborhoods (r = 0.93). Variance inflation factors for the four variable sets ranged from 4 to 7. To mitigate multicollinearity and model complexity, we applied group-wise Principal Component Analysis (PCA, Tomaschek et al., Reference Tomaschek, Hendrix and Baayen2018) to each variable set. PCA combined word1/word2 orthographic and phonological neighborhood into word1/word2 neighborhood (PCA1 = 0.94 for word1, 0.92 for word2), reflecting lexical neighborhood diversity. Word1/word2 frequency and dispersion were merged into word1/word2 statistics (PCA1 = 0.97 for both word1 and word2), capturing the likelihood of encountering a linguistic unit while correcting for frequency- or dispersion-only bias.
To compare statistical metacognition across speaker groups, language proficiency was treatment-coded into three levels (L1, advanced L2, and intermediate L2), and its interactions with other predictors were included in the models in RQ2 and RQ3. Participants were included as a random effect to account for individual differences.
Model diagnostics showed no significant concerns with convergence, residuals, homoscedasticity, multicollinearity, or outliers (see Appendix 4). All models were built in R (version 4.5.0; R Core Team, 2025) with lme4 (version 1.1-34; Bates et al., Reference Bates, Maechler, Bolker, Walker, Christensen, Singmann and Bolker2015).
Results
Descriptive data analysis
Figure 1 compares standardized ratings from L1, advanced L2, and intermediate L2 speakers with COCA data across four types of statistical regularities. All groups used the full Likert scale, and both ratings and corpus data showed moderate values occurring more frequently than extremes. COCA distributions were highly peaked (Kurtosis > 14) and right-skewed (Skewness > 0), whereas speakers’ ratings were more balanced (2 < Kurtosis < 4) and nearly symmetrical (−0.5 < Skewness < 0.1, see Appendix 5 for detailed values), indicating fewer low-value binomials in frequency, dispersion, forward and backward association ratings.
Distributions of standardized COCA data and standardized ratings. The y-axis shows kernel density estimates—smoothed, standardized curves with an area of 1 under each.

Figure 1. Long description
A multi-panel figure with a legend at the top and eight density plots below. The legend identifies four data types: Corpus Data (solid grey line), Advanced L 2 speaker (dashed orange line), L 1 Speaker (solid teal line), and Intermediate L 2 speaker (dotted purple line).
The y-axis for all plots is Density, ranging from 0.0 to 0.8. The x-axis represents standardized values from negative 2.0 to 2.0. The plots are organized into four rows representing different metrics: Frequency, Dispersion, Forward Association, and Backward Association.
* Left Column: Contains four plots showing only the Corpus Data.
- Frequency and Dispersion plots show a sharp central peak near 0.0.
- Forward and Backward Association plots show broader, multi-modal distributions with peaks shifted slightly to the left and right of 0.0 respectively.
* Right Column: Contains four plots overlaying L 1 Speaker, Advanced L 2 speaker, and Intermediate L 2 speaker data.
- In all four metrics, the three speaker groups show highly similar, overlapping distributions.
- These distributions are generally flatter and wider than the Corpus Data, often featuring two or three distinct local peaks between negative 1.0 and 1.0.
- For Forward and Backward Association, the speaker ratings show a more uniform spread across the positive range compared to the sharper peaks seen in the Corpus Data.
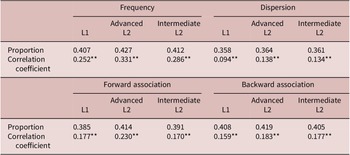
We conducted a preliminary analysis comparing participant ratings with COCA data. Binomials were separately ranked by ratings and COCA values and divided into tertiles (low, medium, and high statistical bins) to assess the proportion falling into the same tertile across both groupings. Results showed low-to-moderate match proportions (<50%) between human ratings and COCA data. Ratings were also standardized to compute correlations with standardized COCA data, revealing small-to-moderate significant correlations (<0.5, see Table 3; also see Appendix 5 for binomial distributions across COCA data and ratings). The low-to-moderate match proportions and correlations provide preliminary evidence for differences between language speakers’ statistical metacognition and corpus-based patterns.
The proportion of binomials in the same tertile across ratings and COCA data, and their correlation coefficients
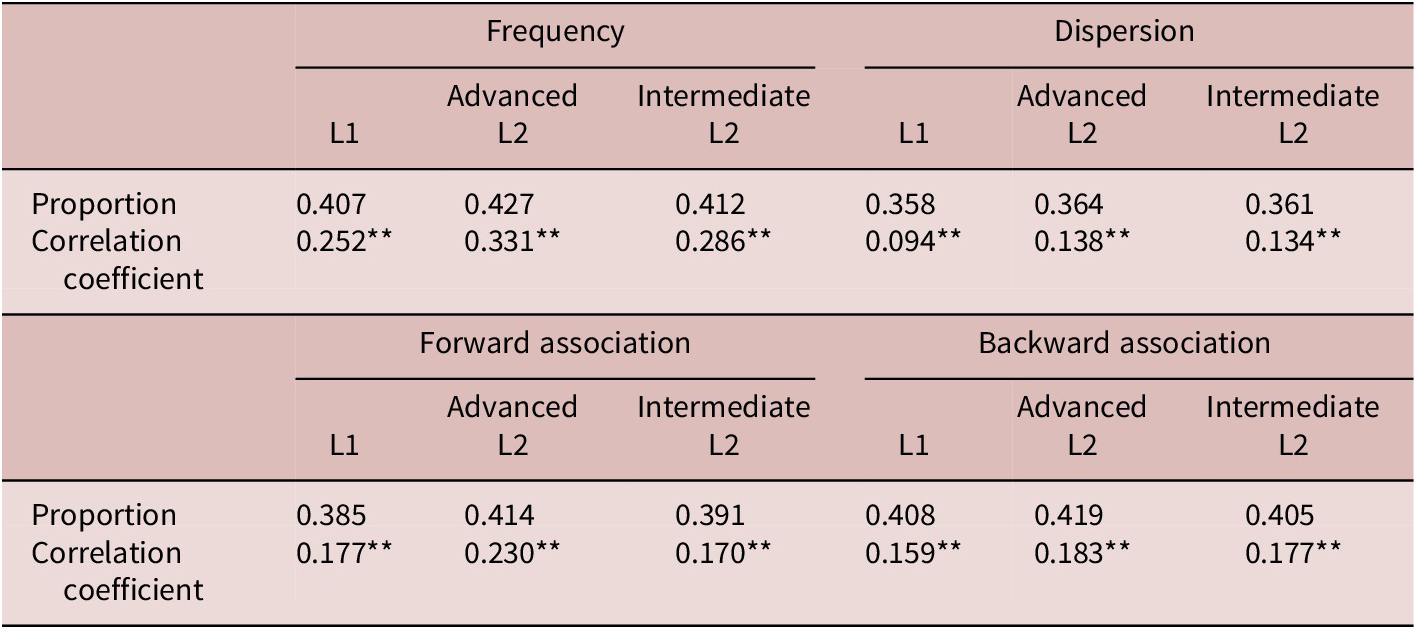
Table 3. Long description
The data is presented in two horizontal sub-tables.
First sub-table (Frequency and Dispersion):
* Frequency Proportion: L 1 is 0.407, Advanced L 2 is 0.427, Intermediate L 2 is 0.412.
* Frequency Correlation coefficient: L 1 is 0.252, Advanced L 2 is 0.331, Intermediate L 2 is 0.286.
* Dispersion Proportion: L 1 is 0.358, Advanced L 2 is 0.364, Intermediate L 2 is 0.361.
* Dispersion Correlation coefficient: L 1 is 0.094, Advanced L 2 is 0.138, Intermediate L 2 is 0.134.
Second sub-table (Forward and Backward Association):
* Forward association Proportion: L 1 is 0.385, Advanced L 2 is 0.414, Intermediate L 2 is 0.391.
* Forward association Correlation coefficient: L 1 is 0.177, Advanced L 2 is 0.230, Intermediate L 2 is 0.170.
* Backward association Proportion: L 1 is 0.408, Advanced L 2 is 0.419, Intermediate L 2 is 0.405.
* Backward association Correlation coefficient: L 1 is 0.159, Advanced L 2 is 0.183, Intermediate L 2 is 0.177.
All correlation coefficients are marked with double asterisks indicating p is less than 0.01.
Note: ** p < 0.01.
Speaker-to-corpus consistency
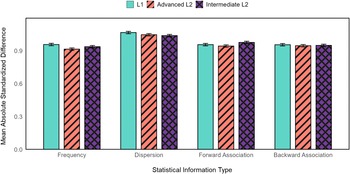
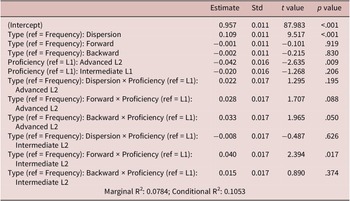
To examine speaker-to-corpus consistency across four types of statistical regularities, we used the absolute difference between standardized COCA data and standardized participant ratings as the dependent variables, with type of statistical regularities, speaker group, and their interactions as predictors (see Figure 2 and Table 4). Dispersion ratings diverged more from corpus values than other statistical regularities, and advanced L2 learners showed smaller discrepancies than other speaker groups. Re-leveled results for all reference groups are in Appendix 6.
The mean absolute differences between standardized ratings and standardized COCA data across four types of statistical regularities and speaker groups, with error bars representing standard error.

Figure 2. Long description
The y-axis is labeled Mean Absolute Standardized Difference with a scale from 0.0 to 0.9. The x-axis is labeled Statistical Information Type. A legend at the top identifies three groups: L 1 (solid light teal), Advanced L 2 (orange with diagonal stripes), and Intermediate L 2 (purple with cross-hatching).
* Frequency: The L 1 bar is highest at approximately 0.95, followed by Intermediate L 2 at 0.93, and Advanced L 2 at 0.91.
* Dispersion: This group shows the highest overall values. L 1 is highest at approximately 1.05, followed by Advanced L 2 and Intermediate L 2, both near 1.03.
* Forward Association: L 1 and Advanced L 2 are similar at approximately 0.95, while Intermediate L 2 is slightly higher at approximately 0.98.
* Backward Association: All three groups are nearly equal, clustered around a value of 0.95.
All bars include small black error bars at the top representing standard error.
Results of mixed effects models for the speaker-to-corpus consistency of statistical metacognition

Table 4. Long description
The table consists of five columns: Variable, Estimate, Std, t value, and p value.
* (Intercept): Estimate 0.957, Std 0.011, t value 87.983, p value less than .001.
* Type (ref = Frequency): Dispersion: Estimate 0.109, Std 0.011, t value 9.517, p value less than .001.
* Type (ref = Frequency): Forward: Estimate minus 0.001, Std 0.011, t value minus 0.101, p value .919.
* Type (ref = Frequency): Backward: Estimate minus 0.002, Std 0.011, t value minus 0.215, p value .830.
* Proficiency (ref = L 1): Advanced L 2: Estimate minus 0.042, Std 0.016, t value minus 2.635, p value .009.
* Proficiency (ref = L 1): Intermediate L 1: Estimate minus 0.020, Std 0.016, t value minus 1.268, p value .206.
* Type (ref = Frequency): Dispersion times Proficiency (ref = L 1): Advanced L 2: Estimate 0.022, Std 0.017, t value 1.295, p value .195.
* Type (ref = Frequency): Forward times Proficiency (ref = L 1): Advanced L 2: Estimate 0.028, Std 0.017, t value 1.707, p value .088.
* Type (ref = Frequency): Backward times Proficiency (ref = L 1): Advanced L 2: Estimate 0.033, Std 0.017, t value 1.965, p value .050.
* Type (ref = Frequency): Dispersion times Proficiency (ref = L 1): Intermediate L 2: Estimate minus 0.008, Std 0.017, t value minus 0.487, p value .626.
* Type (ref = Frequency): Forward times Proficiency (ref = L 1): Intermediate L 2: Estimate 0.040, Std 0.017, t value 2.394, p value .017.
* Type (ref = Frequency): Backward times Proficiency (ref = L 1): Intermediate L 2: Estimate 0.015, Std 0.017, t value 0.890, p value .374.
At the bottom, the Marginal R super 2 is 0.0784 and the Conditional R super 2 is 0.1053.
Model intercepts exceeded 0.7 standard deviations across all types of statistical regularities and language speaker groups, indicating large rating-corpus differences and generally low-to-moderate speaker-to-corpus consistency. Advanced L2 learners showed higher speaker-to-corpus consistency than L1 speakers for frequency (b = −0.042, p = .009) and than intermediate L2 learners for forward association (b = −0.033, p = .042) ratings. Across statistical measures, dispersion ratings were the least consistent with corpus data for all groups (all ps < .001), while frequency ratings showed the highest speaker-to-corpus consistency in advanced L2 learners (all ps < .050). For intermediate L2 learners, forward association ratings also showed lower speaker-to-corpus consistency than backward association and frequency (all ps < .050). Interaction analyses showed that intermediate and advanced L2 learners had greater gains in speaker-to-corpus consistency for frequency ratings relative to forward (p = .017) and backward association (p = .050), respectively, compared to L1 speakers. Additionally, intermediate L2 learners had smaller gains in speaker-to-corpus consistency for forward association ratings relative to dispersion than both L1 speakers (p = .004) and advanced L2 learners (p = .016).
Fixed effects explained 7.8% of the variance, increasing to 10.5% with random intercepts, suggesting contributions from both fixed effects and individual variation.
Sensitivity
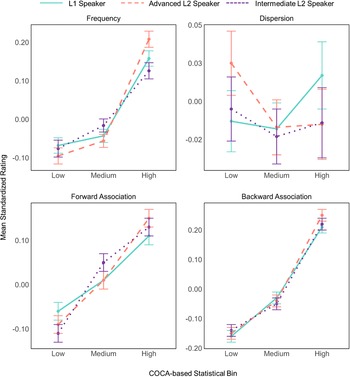
Figure 3 shows that all speaker groups exhibited positive sensitivity to the statistical regularities of binomials, except for dispersion, which displayed weaker and less consistent patterns with larger error bars.
Mean standardized ratings across COCA-based bins (low, medium, high) for four types of statistical regularities and language speaker groups. Error bars represent standard error.

Figure 3. Long description
A multi-panel figure with four line graphs arranged in a two-by-two grid. The shared y-axis is Mean Standardized Rating and the shared x-axis is C O C A-based Statistical Bin with categories Low, Medium, and High. A legend at the top identifies three groups: L 1 Speaker (solid teal line), Advanced L 2 Speaker (dashed orange line), and Intermediate L 2 Speaker (dotted purple line).
* Top-left panel, Frequency: All groups show a sharp increase from Medium to High bins. Advanced L 2 speakers reach the highest rating at approximately 0.20 in the High bin.
* Top-right panel, Dispersion: Trends are less uniform. Advanced L 2 speakers start high at 0.03 in the Low bin and drop to -0.01 in the Medium bin. L 1 speakers show an upward trend from Medium to High, reaching approximately 0.02.
* Bottom-left panel, Forward Association: All groups show a steady linear increase from Low to High. Intermediate L 2 speakers have slightly higher ratings in the Medium bin compared to the other groups.
* Bottom-right panel, Backward Association: All groups show a very similar, steep linear increase from approximately -0.15 in the Low bin to 0.25 in the High bin, with all lines nearly overlapping.
Vertical error bars representing standard error are present for every data point across all panels.
As shown in Table 5, all speaker groups rated high-frequency binomials higher than low- and mid-frequency ones (all ps < .001), and intermediate L2 speakers also rated mid-frequency binomials higher than low-frequency ones (b = −0.060, p = .025). Interaction analyses showed that advanced L2 learners had larger rating increases for high-frequency binomials over mid- (p = .001) and low-frequency ones (p = .003) than intermediate L2 learners. All language speakers showed positive sensitivity in their ratings to forward and backward association across all association strength levels (all ps < .050). Interaction analyses indicated that intermediate L2 learners showed greater rating increases for medium-over low-forward association binomials compared to L1 speakers (p = .019).
Mixed-effects model results for metacognition (i.e., ratings) of frequency, dispersion, forward, and backward association.

Table 5. Long description
The table presents mixed-effects model results with rows for various predictors and columns for four dependent variables. Each dependent variable is analyzed using b (coefficient), Std (standard error), t (t-statistic), and p (p-value).
* Frequency: Significant predictors include statistical bin high (b = 0.23, p < .01), dispersion_coca (b = 0.05, p < .01), forward_coca (b = 0.06, p < .01), word1 length (b = -0.14, p < .01), and word1 neighborhood (b = -0.08, p < .01). Marginal R super 2 is 0.1176.
* Dispersion: Significant predictors include frequency_coca (b = 0.08, p < .01), word1 length (b = -0.05, p < .01), word1 neighborhood (b = -0.05, p < .01), and word2 neighborhood (b = -0.04, p < .01). Marginal R super 2 is 0.0950.
* Forward association: Significant predictors include statistical bin medium (b = 0.07, p = .01), statistical bin high (b = 0.17, p < .01), frequency_coca (b = 0.18, p < .01), backward_coca (b = 0.09, p < .01), and word1 length (b = -0.13, p < .01). Marginal R super 2 is 0.1482.
* Backward association: Significant predictors include statistical bin medium (b = 0.14, p < .01), statistical bin high (b = 0.37, p < .01), frequency_coca (b = 0.17, p < .01), dispersion_coca (b = -0.05, p < .01), and forward_coca (b = 0.06, p < .01). Marginal R super 2 is 0.1797.
Interaction terms between proficiency (L 1, Advanced L 2, Intermediate L 2) and statistical bins or corpus measures are also listed, showing varying levels of significance across the four models.
Note: The statistical bins in Table 5 reflect frequency, dispersion, forward association, and backward association, corresponding to their respective metacognitive dependent variables.
Influence of other contributing factors
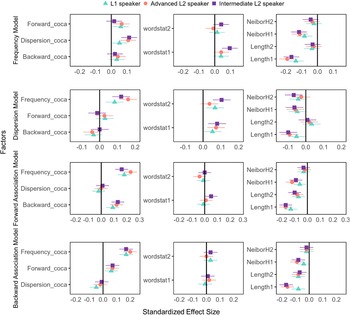
Figure 4 shows that phrase-level statistical regularities facilitated ratings, word-level statistics aided frequency and dispersion ratings, and word-form features generally had inhibitory effects.
Forest plot of regression estimates for phrasal- and word-level factors. The x-axis shows standardized effect sizes from Table 5, where positive and negative values indicate facilitative and inhibitory effects on statistical metacognition, respectively.

Figure 4. Long description
The figure consists of 12 forest plots arranged in four rows. A legend at the top identifies three groups: L 1 speaker (teal triangle), Advanced L 2 speaker (orange circle), and Intermediate L 2 speaker (purple square). Each plot features a vertical zero-line indicating no effect.
* Row 1: Frequency Model. The left panel shows positive effects for Forward_coca, Dispersion_coca, and Backward_coca. The middle panel shows wordstat 2 near zero and wordstat 1 with a positive effect. The right panel shows negative effects for Neibor H 2, Neibor H 1, Length 2, and Length 1.
* Row 2: Dispersion Model. The left panel shows positive effects for Frequency_coca and Forward_coca, with Backward_coca near zero. The middle panel shows positive effects for wordstat 2 and wordstat 1. The right panel shows negative effects for Neibor H 2, Neibor H 1, and Length 1, with Length 2 near zero.
* Row 3: Forward Association Model. The left panel shows positive effects for Frequency_coca and Backward_coca, with Dispersion_coca near zero. The middle panel shows wordstat 2 near zero and wordstat 1 with a slight positive effect. The right panel shows negative effects for Neibor H 2, Neibor H 1, Length 2, and Length 1.
* Row 4: Backward Association Model. The left panel shows positive effects for Frequency_coca and Forward_coca, with Dispersion_coca near zero. The middle panel shows wordstat 2 and wordstat 1 near zero. The right panel shows negative effects for Neibor H 2, Neibor H 1, Length 2, and Length 1.
Across most plots, the three speaker groups show similar trends, though the Intermediate L 2 group (purple squares) often displays slightly higher or lower effect sizes compared to the L 1 group.
We first examined phrasal-level statistical factors (see Table 5). Across speaker groups, one type of statistical regularity (e.g., frequency) generally served as a heuristic cue facilitating judgments of others (e.g., association strength, all ps < .001), except dispersion, which negatively affected L1 speakers’ backward association ratings (b = −0.053, p = .001). Interaction analysis revealed that advanced L2 learners’ ratings of one type of statistical regularity were more positively influenced by other statistical regularities than were those of intermediate L2 learners and L1 speakers. Specifically, dispersion had a greater positive effect on frequency ratings in both L2 groups than in L1 speakers (all ps < .050), and forward association influenced frequency ratings more in advanced than intermediate L2 learners (b = 0.048, p = .039). Advanced L2 learners’ ratings also showed stronger frequency effects on dispersion ratings than L1 speakers (p = .002) and on forward association ratings than intermediate L2 learners (p = .016).
Word-level statistics generally facilitated statistical ratings in both L1 and L2 speakers (all ps < .050), except that word2 statistics inhibited forward association ratings of advanced L2 learners (b = −0.042, p < .001). Interaction analyses showed that intermediate L2 learners’ statistical ratings were more positively influenced by word1/word2 statistics than those of L1 speakers and advanced L2 learners (all ps < .050), except that no group differences were found in the moderating effects of word1/word2 statistics on backward association ratings and word1 statistics on dispersion ratings.
Word-form features, namely word1/word2 length and neighborhood, generally inhibited statistical ratings across all speaker groups (all ps < .050), except that word2 length positively affected L1 speakers’ dispersion ratings (b = 0.033, p = .028). Interaction analyses showed stronger inhibitory effects in lower-proficiency learners: Word1 length and word1 neighborhood more strongly affected frequency ratings in advanced (p = .020) and intermediate L2 learners (p = .025), respectively, than in L1 speakers. Word2 neighborhood had a stronger negative effect on dispersion ratings in intermediate than in advanced L2 learners (p = .005). Additionally, both L2 groups showed stronger inhibitory effects of word1 neighborhood on forward/backward association ratings and of word1 length on backward association ratings compared to L1 speakers (all ps < .050).
Fixed effects explained 9.5–17.9% of variance across measures, with minimal random variance, indicating consistent participant sensitivity to each type of statistical regularity.
Discussion
We examined three aspects of statistical metacognition among L1, advanced L2, and intermediate L2 speakers. Using an offline rating task with a more precise 9-point slider than prior studies (Siyanova-Chanturia & Schmitt, Reference Siyanova-Chanturia and Schmitt2008; Yi et al., Reference Yi, Man and Maie2023), we explored statistical metacognition with greater granularity—how language speakers draw on metalinguistic awareness to consciously access and explicitly judge statistical knowledge that is largely acquired implicitly (Christiansen, Reference Christiansen2019). Our findings bridge implicit learning and metalinguistic knowledge, suggesting that language competence involves both automatic processing and reflective judgment. Binomials—a syntactically and semantically regular MWE subtype—were used to examine phrase-level statistical metacognition and extend prior work on collocations (Yi et al., Reference Yi, Man and Maie2023) and three-word combinations (Backman, Reference Backman1978).
All speaker groups showed low-to-moderate speaker-to-corpus consistency, reflecting shared challenges in developing metacognition aligned with language use. While high speaker-to-corpus consistency may not be critical for implicit competence, it may support conscious processes such as pattern detection and error correction (Ellis, Reference Ellis2009). Nonetheless, all groups exhibited significant metacognitive sensitivity, suggesting shared statistical learning mechanisms for detecting phrase-level patterns in both L1 and L2 speakers, consistent with usage-based theories (Ellis, Reference Ellis2009; Goldberg, Reference Goldberg1995;Gries & Ellis, Reference Gries and Ellis2015). This sensitivity supports the interface between implicitly acquired knowledge and its accessibility via explicit, task-driven processing (Ellis, Reference Ellis2005). Statistical metacognition was also shaped by word-level information across all groups, reflecting the co-acquisition of multiple information sources as proposed by the dual-route model (Carrol & Conklin, Reference Carrol and Conklin2014). However, metacognition of statistical regularities varied by type: speaker-to-corpus consistency was highest for frequency, moderate for association strength, and absent for dispersion—highlighting frequency’s central role in statistical learning and the difficulty of explicitly accessing abstract, context-dependent cues like dispersion. These findings reflect the complexity of multi-layered statistical learning, engaging distinct cognitive pathways for processing occurrence-based, associative, and contextual cues (Yi et al., Reference Yi, Man and Maie2023). Statistical metacognition also varied across groups with varying language backgrounds—L1 speakers, advanced L2 learners with English immersion, and intermediate L2 learners with limited natural input. A gradient shift emerged across these groups: from implicit to explicit learning (Ellis, Reference Ellis2009), rich to limited MWE exposure (Adolphs & Durow, Reference Adolphs and Durow2004), lower to higher cognitive demands (Clahsen & Felser, Reference Clahsen and Felser2006), less to more efficient practice (DeKeyser, Reference DeKeyser2020), and holistic to analytical MWE processing (Carrol & Conklin, Reference Carrol and Conklin2014). In general, L2 speakers’ statistical metacognition did not necessarily lag behind that of L1 speakers. Advanced L2 learners, in particular, demonstrated greater speaker-to-corpus consistency and sensitivity than both L1 speakers and intermediate L2 learners, and more effectively used one type of statistical regularity to inform metacognition of another. This suggests that statistical metacognition benefits from integrating rich natural exposure with explicit learning (e.g., rule-based instruction) to support conscious access to implicitly acquired knowledge. In contrast, lower-proficiency learners likely rely more on analytical, word-level cues when forming binomial metacognition, consistent with the dual-route model (Carroll & Conklin, Reference Carrol and Conklin2014) and the shallow structure hypothesis (Clahsen & Felser, Reference Clahsen and Felser2006).
A detailed discussion of speaker-to-corpus consistency, sensitivity, and other contributing factors across speaker groups and statistical regularity types is provided below.
Speaker-to-corpus consistency of statistical metacognition
Statistical metacognition showed low-to-moderate speaker-to-corpus consistency, varying by speaker group and regularity type. Advanced L2 speakers generally demonstrated the highest consistency. Notably, their frequency metacognition aligned more closely with actual language distributions than that of L1 speakers—that is, their explicit, conscious frequency judgments better reflected underlying statistical patterns. L1 speakers may overestimate low-frequency binomials if they nevertheless have high familiarity due to their contextual salience (e.g., “trials and tribulations”; Siyanova-Chanturia & Pellicer-Sánchez, Reference Tomaschek, Hendrix and Baayen2018). In contrast, L2 learners may outperform in explicit, reflective rating tasks due to greater engagement with explicit learning processes and strategies (Ellis, Reference Ellis2009). This suggests that speaker-to-corpus consistency in statistical knowledge is closely tied to explicit learning, though also influenced by real-world usage (Siyanova-Chanturia et al., Reference Siyanova-Chanturia, Conklin and Van Heuven2011). Second, advanced L2 learners also showed greater consistency with corpus statistics than intermediate learners in forward association metacognition, consistent with Yi et al. (Reference Yi, Man and Maie2023). Associative learning applies more to later stages of L2 acquisition (Ellis & Wulff, Reference Ellis and Wulff2014). Advanced learners’ stronger performance may reflect a more effective integration of usage-based associative learning and explicit instruction, facilitating both acquisition and conscious access to MWE-related association knowledge.
Speaker-to-corpus consistency also varied by statistical regularity: frequency showed the highest consistency across groups, followed by association strength, with dispersion lowest. Prior studies have shown that speakers can distinguish MWEs by frequency (Backman, Reference Backman1978; Siyanova-Chanturia & Schmitt, Reference Siyanova-Chanturia and Schmitt2008; Siyanova-Chanturia & Spina, Reference Siyanova-Chanturia and Spina2015). Usage-based theories consider frequency the most easily acquired feature supporting broader statistical knowledge, making its high consistency unsurprising. Only one study has examined metacognitive alignment with association strength, reporting low-to-moderate match rates between rating- and corpus-based tertiles for both L1 and L2 speakers (Yi et al., Reference Yi, Man and Maie2023). Associative learning theory (Gries & Ellis, Reference Gries and Ellis2015) posits that speakers track co-occurrence beyond frequency. Our findings reveal finer patterns: while association strength can be explicitly accessed, strong consistency, especially for directional associations, is harder to achieve than for frequency. In contrast, dispersion remains underexplored. As a measure of how linguistic units are distributed across discourse contexts, dispersion captures broader contextual patterns typically acquired implicitly (Batstone, Reference Batstone2002), making explicit encoding and metacognitive access more demanding. These findings suggest that statistical metacognition develops unevenly: speaker-to-corpus consistency is highest for frequency (occurrence-based learning), moderate for association strength (associative learning), and lowest for dispersion (contextual learning).
Interaction analysis showed that lower-proficiency speakers had a smaller advantage (or greater disadvantage) in speaker-to-corpus consistency for association strength than for other statistical regularities. Association strength reflects the configurational patterns of MWEs (Siyanova-Chanturia et al., Reference Siyanova-Chanturia, Conklin and Van Heuven2011). This may be because acquiring such information relies more heavily on implicit learning (Ellis, Reference Ellis2009), rich MWE exposure (Adolphs & Durow, Reference Adolphs and Durow2004), and holistic processing (Carrol & Conklin, Reference Carrol and Conklin2014). These demands may place lower-proficiency learners, who are limited in these areas, at a greater disadvantage in speaker-to-corpus consistency for association strength than for other statistical measures.
Sensitivity of statistical metacognition
Our results confirm speakers’ sensitivity in statistical metacognition, although the effect was not strong. First, all groups showed positive sensitivity to frequency, consistent with robust frequency effects in MWE processing (e.g., Öksüz et al., Reference Öksüz, Brezina and Rebuschat2021; Wolter & Yamashita, Reference Wolter and Yamashita2018), particularly for binomials (Conklin & Carrol, Reference Conklin and Carrol2021; Siyanova-Chanturia et al., Reference Siyanova-Chanturia, Conklin and Van Heuven2011; Suhad et al., 2023). Extending prior work, our findings suggest that greater usage-based exposure supports the development of statistical metacognition. Similar to Siyanova-Chanturia and Spina (Reference Siyanova-Chanturia and Spina2015), the sensitivity of frequency metacognition mainly reflected in rating differences between high- and medium/low-frequency items, rather than across the full continuum. Further interaction analyses showed stronger frequency sensitivity in advanced than intermediate L2 speakers, suggesting that speakers’ explicit access to frequency variation may be strengthened by a more integrated mix of relatively rich implicit exposure and explicit learning experiences (Ellis & Wulff, Reference Ellis and Wulff2014).
All speaker groups showed a continuum of positive sensitivity to both forward and backward association. Previous research on MWE processing (e.g., Öksüz et al., Reference Öksüz, Brezina and Rebuschat2021; Yi et al., 2018) and rating tasks (Yi et al., Reference Yi, Man and Maie2023) demonstrated L1 and L2 sensitivity to undirected association (e.g., MI, log Dice). Our findings extend this by confirming sensitivity to directional indices, indicating that metacognitive judgments of phrasal formulaicity—rooted in associative learning—are responsive to statistical patterns in language. Interaction analyses further revealed that intermediate L2 learners exhibited stronger forward association sensitivity than L1 speakers, possibly because extensive implicit experience in L1 users compresses statistical distinctions in the mental lexicon, as predicted by the power law of practice (DeKeyser, Reference DeKeyser2020).
Regarding dispersion, neither L1 nor L2 speakers appeared to explicitly access contextual distributional information of binomials. While context provides semantic cues in processing (Camblin et al., Reference Camblin, Gordon and Swaab2007), learners may struggle to consciously apply the concept of “contextual distributional evenness” in explicit rating tasks. This difficulty likely stems from its implicit nature, as proposed by contextual learning theory (Martin, Reference Martin2014), or from the greater complexity of tracking macro-level distributions compared to frequency or association strength. Rather than ignoring contextual distributional features, language users may rely on them implicitly for informing language acquisition.
Together, our findings show that speakers across proficiency levels can track statistical variation with metalinguistic awareness, supported by underlying statistical learning mechanisms. Richer usage-based input and explicit instruction further enhance this metacognitive sensitivity. However, sensitivity varies by type: frequency requires threshold exposure, association strength spans a broader continuum, and contextual distribution remains largely inaccessible to explicit encoding—highlighting a distinction between using context for learning and explicitly representing contextual distributional patterns.
The influence of other contributing factors
First, one type of statistical regularity positively influenced the metacognition of another in both L1 and L2 speakers. Consistent with Yi et al. (Reference Yi, Man and Maie2023), this suggests that mental representations of frequency (occurrence), association strength (formulaicity), and dispersion (distributional evenness) are interconnected despite being conceptually distinct. An exception was that dispersion negatively predicted backward association metacognition in L1 speakers, possibly because limited contextual variability strengthens word-to-word predictability, whereas broader contextual distribution introduces competing cues that weaken backward links. Interaction analyses further showed that cross-regularity effects were strongest in advanced L2 learners, moderate in intermediate L2 learners, and weakest in L1 speakers. This suggests that the combination of relatively rich explicit learning and sufficient implicit exposure may enhance the integration of different types of statistical knowledge in the mental lexicon.
Word-level statistics—capturing linguistic exposure and mental entrenchment via frequency and dispersion—can be activated to facilitate phrase-level metacognition in both L1 and L2 speakers, consistent with the dual-route model (Carrol & Conklin, Reference Carrol and Conklin2014). However, prior findings are mixed: Siyanova-Chanturia and Spina (Reference Siyanova-Chanturia and Spina2015) found that word frequency facilitated phrasal metacognition, whereas Yi et al. (Reference Yi, Man and Maie2023) reported a similar effect but noted that word frequency inhibited association strength estimation in a mixed L1-L2 group. This discrepancy may reflect measurement differences: earlier studies considered only frequency, which does not fully capture linguistic exposure and mental entrenchment, whereas our metric integrates frequency and contextual distribution for a more comprehensive assessment. Interaction effects showed that lexical statistical regularities most strongly influenced intermediate L2 speakers, followed by advanced L2 and L1 speakers in phrasal statistical metacognition. This supports the shallow structure hypothesis (Clahsen & Felser, Reference Clahsen and Felser2006), which posits that lower-proficiency learners rely more on analytical, surface-level cues in processing.
Last, word length and neighborhood negatively affected L1 and L2 speakers’ metacognition of phrase-level statistical regularities. Complex phonological or orthographic features reduced binomial metacognition, consistent with prior findings on word length effects in collocation processing (Siyanova-Chanturia & Spina, Reference Siyanova-Chanturia and Spina2015; Yi et al., Reference Yi, Man and Maie2023). This may be because processing words with greater length or neighborhood density imposes greater cognitive demands, reducing attention to phrasal patterns. Alternatively, larger neighborhoods may enhance word recognition (Yates et al., Reference Yates2005), increasing constituent salience and diverting attention from phrase-level structure. The finding supports the dual-route model, suggesting word-level cues can influence phrase-level statistical metacognition (Carrol & Conklin, Reference Carrol and Conklin2014). Interaction analyses showed the strongest word-level influence in intermediate L2 speakers, followed by advanced L2 and then L1 speakers. This aligns with the shallow structure hypothesis (Clahsen & Felser, Reference Clahsen and Felser2006), which suggests lower-proficiency learners rely on surface-level features, such as word length and neighborhood, in processing MWEs.
Combined, our findings suggest that consciously accessible types of statistical knowledge are interconnected within a shared cognitive framework in both L1 and L2 speakers. The multi-level activation of statistical and word-form features in metacognitive judgments supports the dual-route model of MWE processing (Carrol & Conklin, Reference Carrol and Conklin2014). However, L1-L2 differences emerge. Advanced and intermediate L2 learners—likely due to richer explicit learning (Ellis, Reference Ellis2009)—more readily draw on diverse statistical regularities when making explicit judgments about one type. In contrast, lower-proficiency L2 learners rely more on word-level cues, possibly due to limited usage-based implicit experience (Ellis, Reference Ellis2009), higher cognitive load, shallow processing (Clahsen & Felser, Reference Clahsen and Felser2006), and a more analytical approach to MWEs (Carrol & Conklin, Reference Carrol and Conklin2014).
Limitations and future directions
Several limitations should be noted. First, background factors like social status were not controlled, as the study focused on general language use rather than sociolinguistic variation. Specific records of learning trajectories and detailed exposure modes (e.g., written vs. spoken) over the past decades were limited due to the complexity of data collection. Additionally, the L2 group was highly diverse (25+ L1s, few speakers per language), preventing analysis of cross-linguistic influence. Future research could explore how these individual differences shape metacognition of statistical regularities. Second, objective proficiency tests were not used to classify L2 participants. Standardized scores (e.g., IELTS, TOEFL) were available for only 14 participants in our study. Future studies could enhance consistency by administering standardized tests post-recruitment. Third, although COCA is widely used, it cannot fully reflect individual language experience. Future research could adopt individualized input tracking (e.g., diaries) to build longitudinal, speaker-specific corpora for more accurate input characterization. Finally, our findings on binomials offer a starting point rather than a comprehensive account of statistical metacognition across all MWE types. Future research should extend this approach to more structurally variable (e.g., lexical bundles) and semantically opaque MWEs (e.g., idioms) to uncover broader cognitive mechanisms.
Conclusion
This study investigates the speaker-to-corpus consistency, sensitivity, and other contributing factors of statistical metacognition for frequency, association strength, and dispersion in binomials—a key type of MWEs—among L1, advanced L2, and intermediate L2 learners. Our findings have several theoretical implications. Both L1 and L2 speakers can develop statistical metacognition for binomials, suggesting shared statistical learning mechanisms beyond the word level. This extends statistical learning theories (Christiansen, Reference Christiansen2019) and usage-based approaches (Goldberg, Reference Goldberg1995) by showing that statistical regularities can be explicitly and consciously accessed and reflected upon as metacognition. Moreover, word-level statistics and word-form features influence statistical metacognition, supporting both the dual-route model (Carrol & Conklin, Reference Carrol and Conklin2014) and the interplay between statistical learning mechanisms and linguistic knowledge. We also found heterogeneity across statistical learning mechanisms: occurrence- and associative-based knowledge was more accessible in reflective judgments, while context-based knowledge remained less explicitly accessible. Advanced L2 learners outperformed other groups in speaker-to-corpus consistency and sensitivity of statistical metacognition. As the rating task involves explicit metacognitive judgment of implicitly acquired statistical patterns, this may suggest that the combination of relatively extensive explicit learning experiences and usage-based implicit exposure in advanced L2 speakers facilitates the development of statistical metacognition. Finally, lower-proficiency speakers were more influenced by word-level statistical and linguistic information in phrase-level metacognition, likely due to more limited exposure, reduced cognitive resources, and more analytical processing strategies.
Supplementary material
The supplementary material for this article can be found at http://doi.org/10.1017/S0272263125101411.
Acknowledgments
We are deeply grateful for the invaluable and constructive feedback provided by the editors and anonymous reviewers during the review process.
Data availability statement
The data in this study are available at: https://osf.io/bjrx9/.
Competing interests
None.






 Open access

