


I. Introduction
China was one of the world's most important sources of growth in wine demand in the 2010s. By 2017, it accounted for 7% of the world's wine consumption and 8% of the value of global wine imports, up from less than 2% and 0.3%, respectively, prior to 2005. But China's per capita wine consumption peaked in the mid-2010s, and its share of world wine imports has more than halved since then (Figure 1).
China's wine consumption per capita and its share in the value of global wine imports, 1996 to 2024 (liters and %).

Certainly, the COVID-19 disruption and associated slowdown in China's income growth account for some of that reversal. However, the fall in China's alcohol consumption began 3 years before COVID hit, and between 2019 and 2022, the fall in beverage consumption was considerably larger for wine (47%) than for spirits (17%) and beer (9%) so that wine's share of alcohol consumption in China fell by two-fifths over those 3 years.
The hikes in China's tariffs on U.S. and Australian wine imports also played a role. China's wine imports from the United States were hit with an extra 15% tariff from April 2018, in response to a hike in U.S. tariffs on its imports of Chinese steel and aluminum. Then in late 2020, China imposed punitive tariffs (up to 218%) on wines imported from Australia, triggered by Australia suggesting the establishment of an international inquiry into the source of COVID—notwithstanding the China–Australia Free Trade Agreement of 2015. The latter punitive tariffs remained in place until late March 2024. That was immediately followed by a brief one-off flood of high-priced wines from Australia to restock iconic brands before the next Chinese New Year.
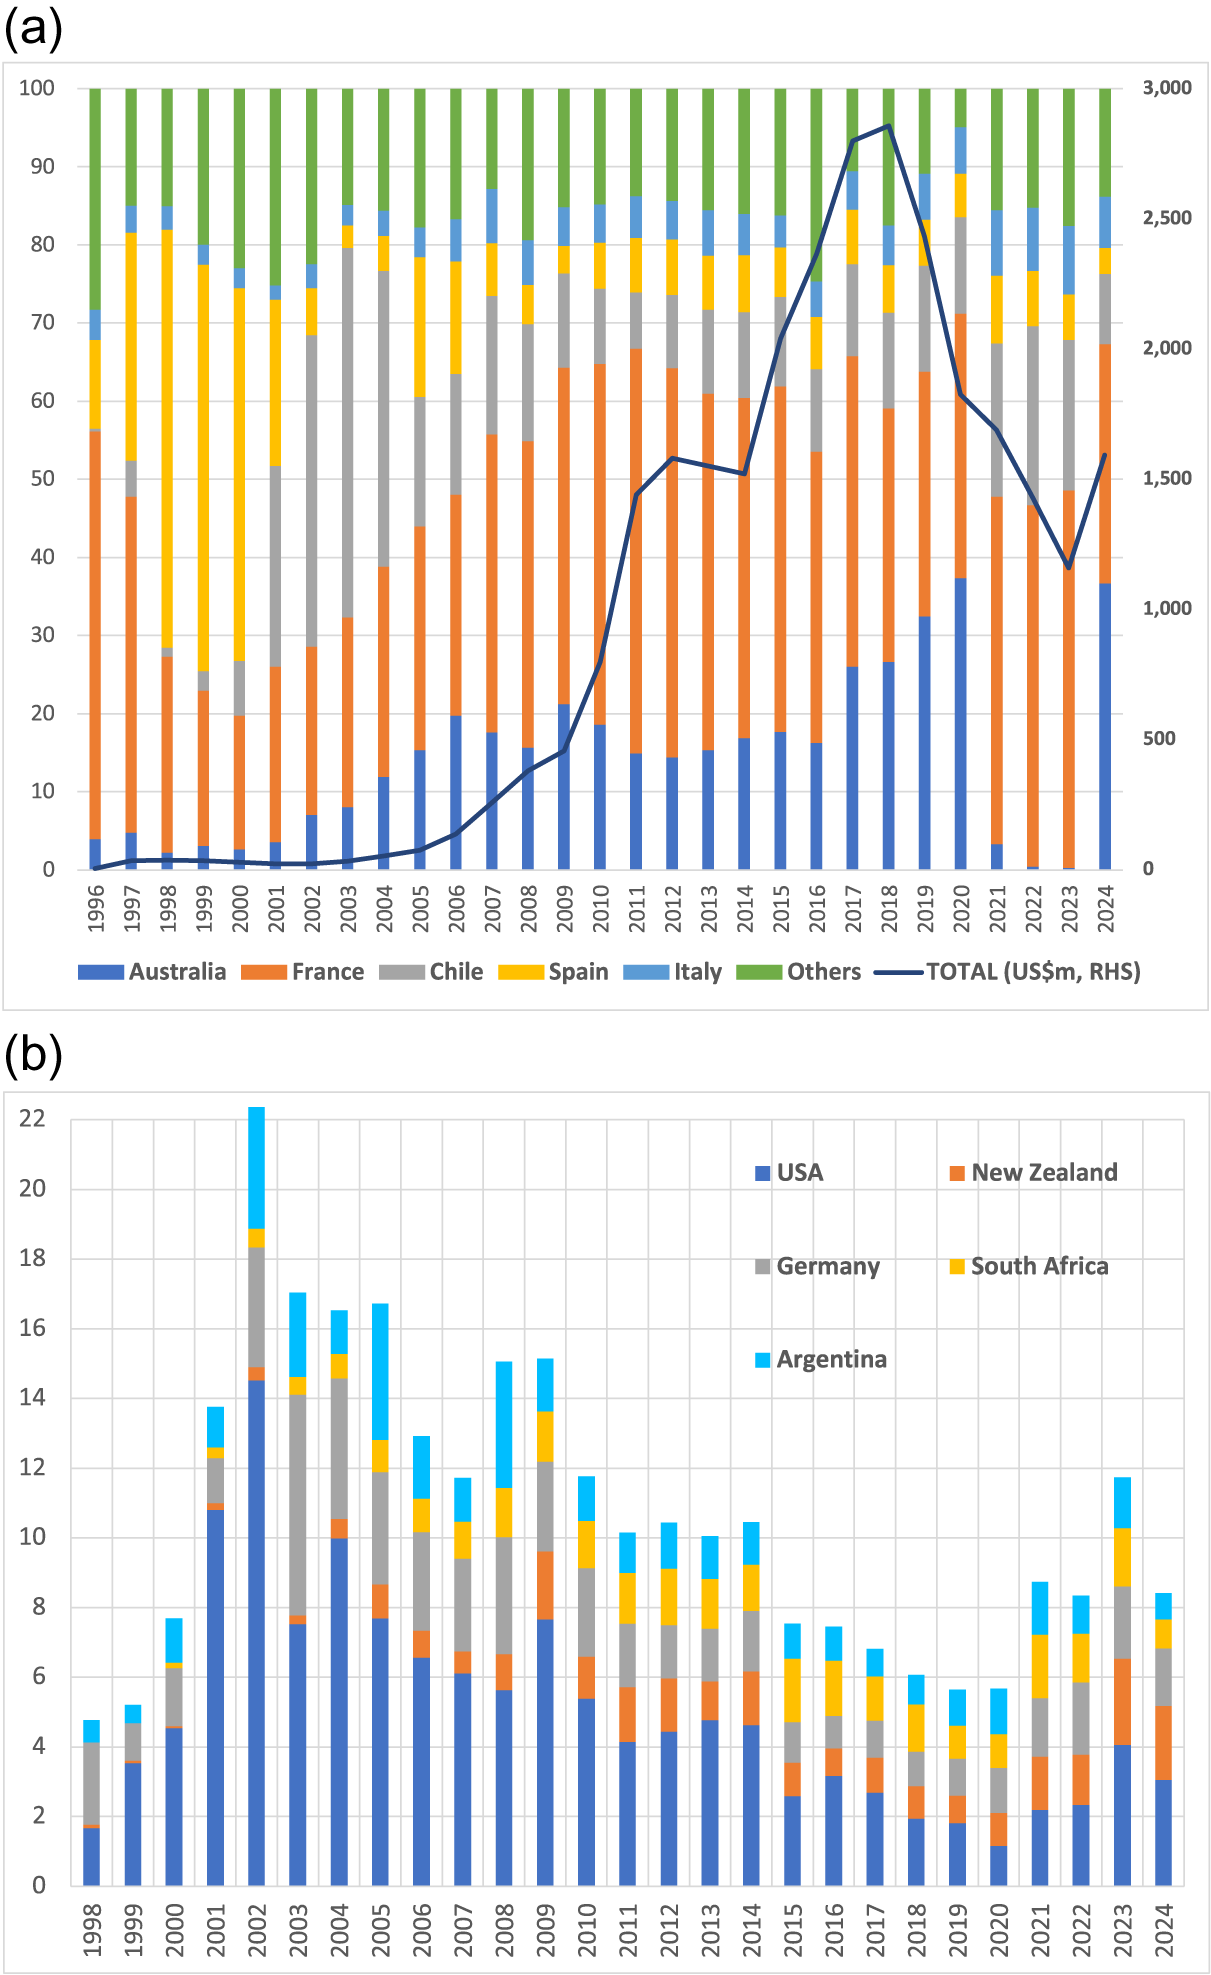
Those unilateral tariff decisions have contributed to the considerable fluctuations in the sources of China's imported wine. The ranking lead has changed more than once between France and Australia, and those two have been followed variously by Chile, Spain, and Italy. Together those five have accounted for all but one-sixth of the value of China's wine imports over the past three decades. Another five countries, led by the United States, account for most of the rest, but among them too the source countries’ shares have fluctuated very considerably.
This century has also seen an inverted V path traced out in the volume of China's domestic wine production. That, plus the large changes in both total and bilateral wine import flows, makes it difficult for current and would-be exporters to assess prospects in this important but relatively risky market. Getting a sense of what those prospects depend on can be helped by examining why China's market grew and then shrank over the past two decades in total and why the erratic national shares of China's imports evolved as they did.
The purpose of this article, which updates and extends an earlier paper (Anderson, Reference Anderson2023), is to better understand the reasons behind the dramatic rise and then downturn in this globally important market, and the wild fluctuations in bilateral shares of the top 10 exporters to this market. The first section below examines those inverted V-shaped developments. Section 3 explores short- to medium-term prospects, before Section 4 compares China's alcohol consumption trends with those of other countries over the past six decades to help assess longer-term prospects. The latter provides reasons to expect China's wine consumption at least in the longer run to return to growth, and thereby for China to again become a substantial player in global wine markets—even if more slowly than in the first two decades of this century. The article concludes by recalling the numerous ways in which Chinese policies can affect not only the extent of future wine imports but also from which countries those imports come. They suggest future wine market developments in China may be just as erratic as those in the first quarter of this century.
II. China's wine production, consumption and imports: a tale of inverted V's
Wine production from Vitis vinifera grapes began in China more than two millennia ago, having been introduced from Central Asia before 200BC. However, that wine would have been destined only for the ruling elite (Kupfer, Reference Kupfer2018, Reference Kupfer2019; McGovern, Reference McGovern2003, Reference McGovern2009; S. Wang, Reference Wang2010).
a. China's wine market take-off
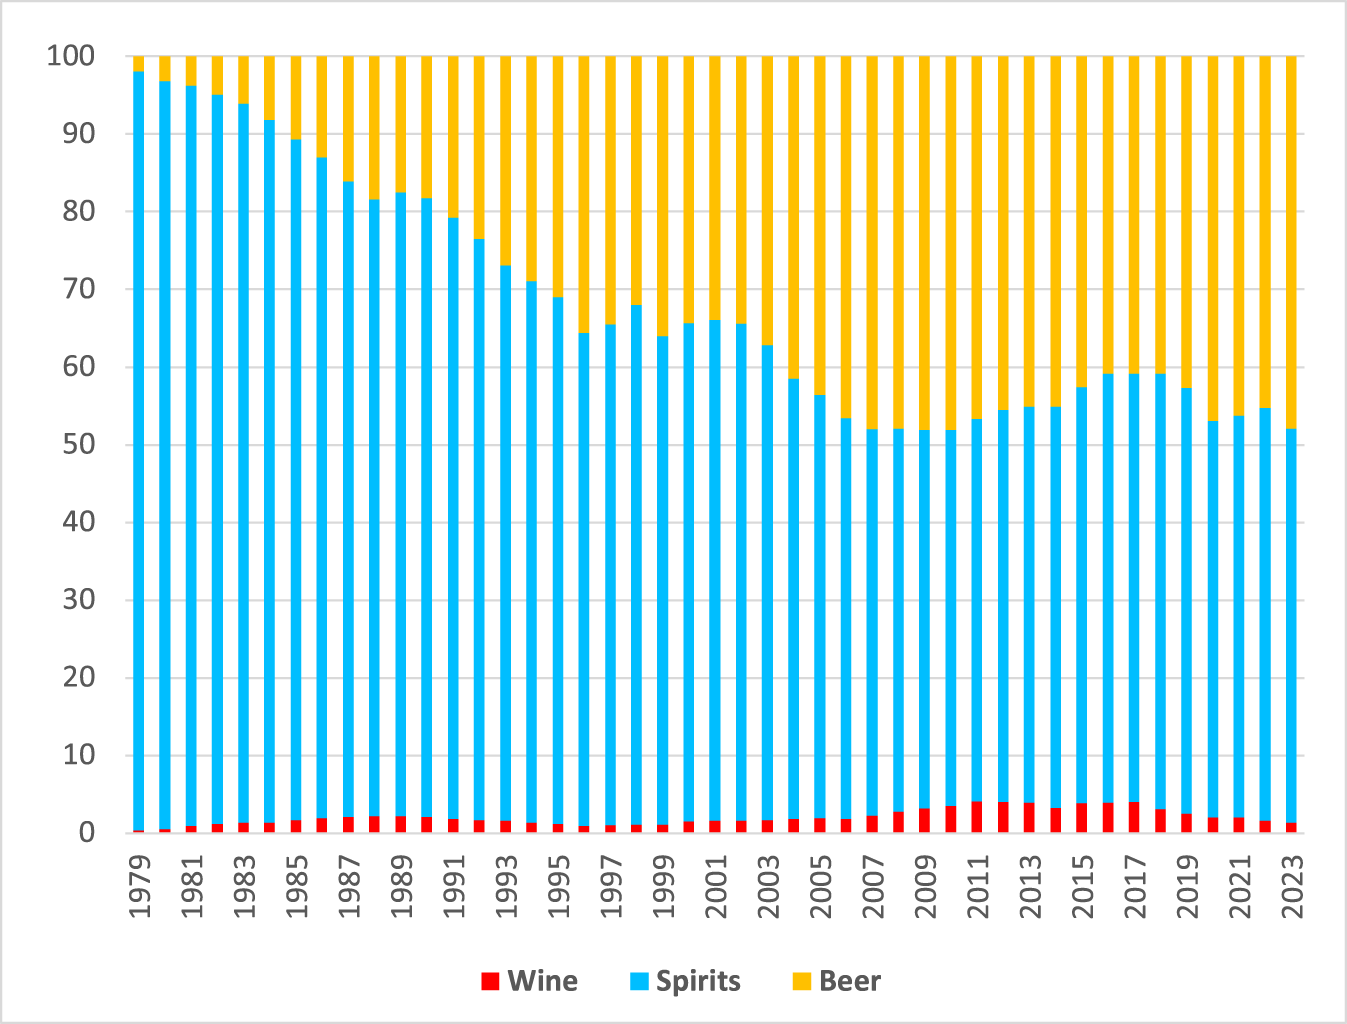
The opening up of the Chinese economy in December 1978 triggered massive income growth and rapid urbanization, leading to growth in the domestic demand for many manufactured products including alcoholic beverages. Annual per capita recorded consumption of alcohol more than trebled during the first four decades of opening up, doubling for spirits (to 2.0 L) and rising from near-zero to 1.4 L for beer. Alcohol from wine consumption also rose, but from a miniscule base in 1978 to a peak of just 0.1 L of alcohol per year in the 2010s (Figure 2).
Shares of spirits, beer, and wine in China's total recorded alcohol consumption, 1979 to 2023 (%) (For wine, consumption is estimated as production plus net imports and thus does not account for annual changes in domestic stocks of wine held by producers, importers, distributors, and retailers).

The domestic demand for wine began to grow following a speech by Premier Li Peng in 1996, in which he pronounced that red wine was good for health. The demand that comment stimulated was initially satisfied almost exclusively by growth in local production. But in December 2001, when China joined the World Trade Organization, it reduced its tariffs on wine imports from 65% to just 14% for bottles and 20% for bulk wine. Then in November 2005, China signed a free trade agreement with Chile, providing it with duty-free access to China's wine market. Those policy changes lowered the domestic price of wine and raised its average quality substantially. That further stimulated consumption, which had been growing rapidly along with per capita incomes and urbanization.
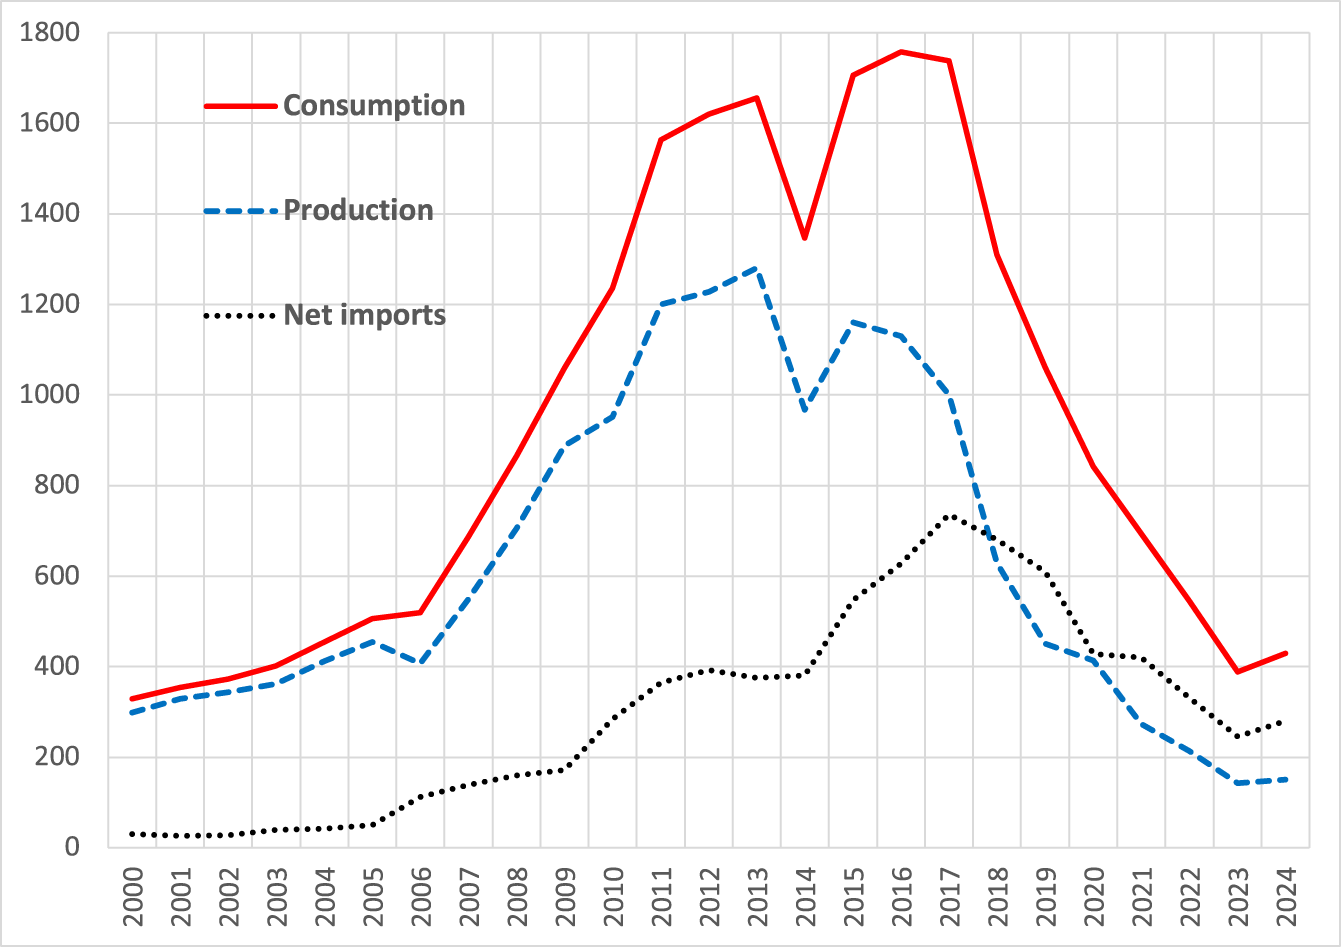
Meanwhile, domestic production of wine began to rise rapidly early this century, having been actively encouraged by national and regional governments from 1996. Part of that (perhaps as much as one-tenth during the 15 years to 2012) was due to the blending of imported bulk wine with lower-quality wine produced from local grapes (Anderson and Harada, Reference Anderson and Harada2018). Such blending, which was allowed since bottles branded ‘Wine of China’ at that time needed to have no more than 10% local fruit, became much more profitable once the tariff on bulk wine fell from 65% to 20% at end-2001. This expansion of domestic production was in response to the growth in demand, despite increased competition from bottled imports following the tariff cut. Greater production, together with the growth in imports, allowed apparent wine consumption to treble in the decade to the mid-2010s (Figure 3).Footnote 1
Volume of China's production, net imports, and apparent consumption of wine, 2000 to 2024 (ML) (Consumption is estimated as production plus net imports and thus does not account for annual changes in domestic stocks of wine held by producers, importers, distributors, and retailers. The production data from 2019 are from the China Alcoholic Drinks Association)

b. China's wine market reversal
Since the mid-2010s, however, China's apparent wine consumption has slumped, and just as quickly as it had grown up to that time. Both trend rates of change are unprecedented. Wine's share of alcohol consumption had risen from 1% to 4% in the first 15 years of this century, but it was back to 1.3% by 2023 (Figure 2).
Domestic wine production, meanwhile, peaked even earlier than consumption. Presumably, new investors discovered that grape growing and winemaking were not as profitable as other areas of investment. That was felt particularly as competition from imports heated up during the 2010s—especially from Australia from late 2015 when the China–Australia Free Trade Agreement came into force. As a consequence, the share of imports (net of a tiny amount of exports) in China's wine consumption rose during the 2010s from around one-fifth to almost three-fifths.
China represented less than 0.3% of the value of global wine imports prior to 2005. That share rose to 8% by 2017, but had fallen to less than 3% in 2023 (Figure 1).
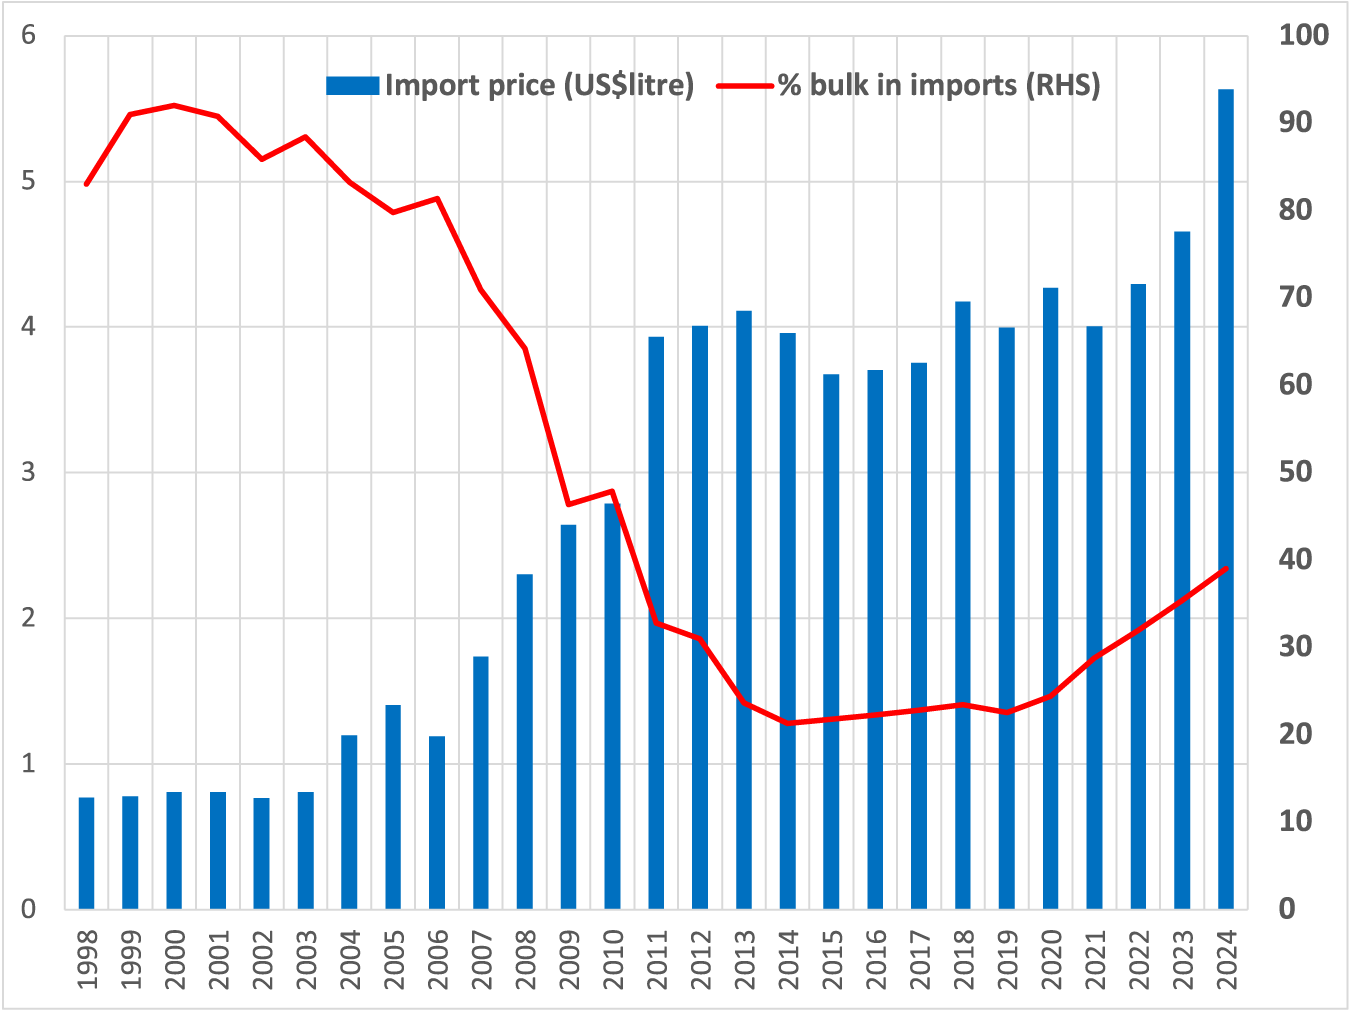
Associated with those changes in imports was a huge decline in the share of imports coming in bulk containers, which increased the average price of imports five-fold over the decade to 2012 (Figure 4). With that came considerable changes in the shares of imports from key wine-exporting countries. In value terms, the shares of Spain and then Chile shrank, while Australia's share rose by 2020 to one-quarter in volume terms and more than one-third in value terms, making it the largest supplier to China as COVID-19 hit (Figure 5).
Average price of China's wine imports and volume share in bulk, 2000 to 2024 (US$/liter and %).

Value of China's wine imports, total and shares by key source countries, 1996 to 2024 (% and US$ million). (a) Shares of top five exporters and others to China (%). (b) Shares of second-five exporters to China (%).

Wine consumption began to decline when Xi Jinping became President at the end of 2012 and cracked down on corruption and spending on luxuries, including official banquets. This was felt most by importers of fine wines, particularly from France and especially in 2014. Then income growth slowed to less than 6% per year from 2016, having been close to 10% from the 1980s. Meanwhile, younger consumers in China were increasing their interest in value-driven wines, a key beneficiary being Australia. Casella's low-priced [yellow tail] brand has been second only to Treasury Wine Estates’ Penfolds brand in selling Australian wine to China.
When COVID-19 hit in 2020, consumers were unable to eat out. That caused their purchases of wine to shrink precipitously (Figure 3) because in China wines to date have been much more commonly consumed away from home than are beer and spirits. True, other alcohol consumption also fell due to both COVID lockdowns and the slowdown in consumer spending generally as the housing crisis dampened confidence, but the fall in Chinese consumption between 2019 and 2022 was far larger for wine (47%) than for spirits (17%) and beer (9%) (Anderson and Pinilla, Reference Anderson and Pinilla2025).
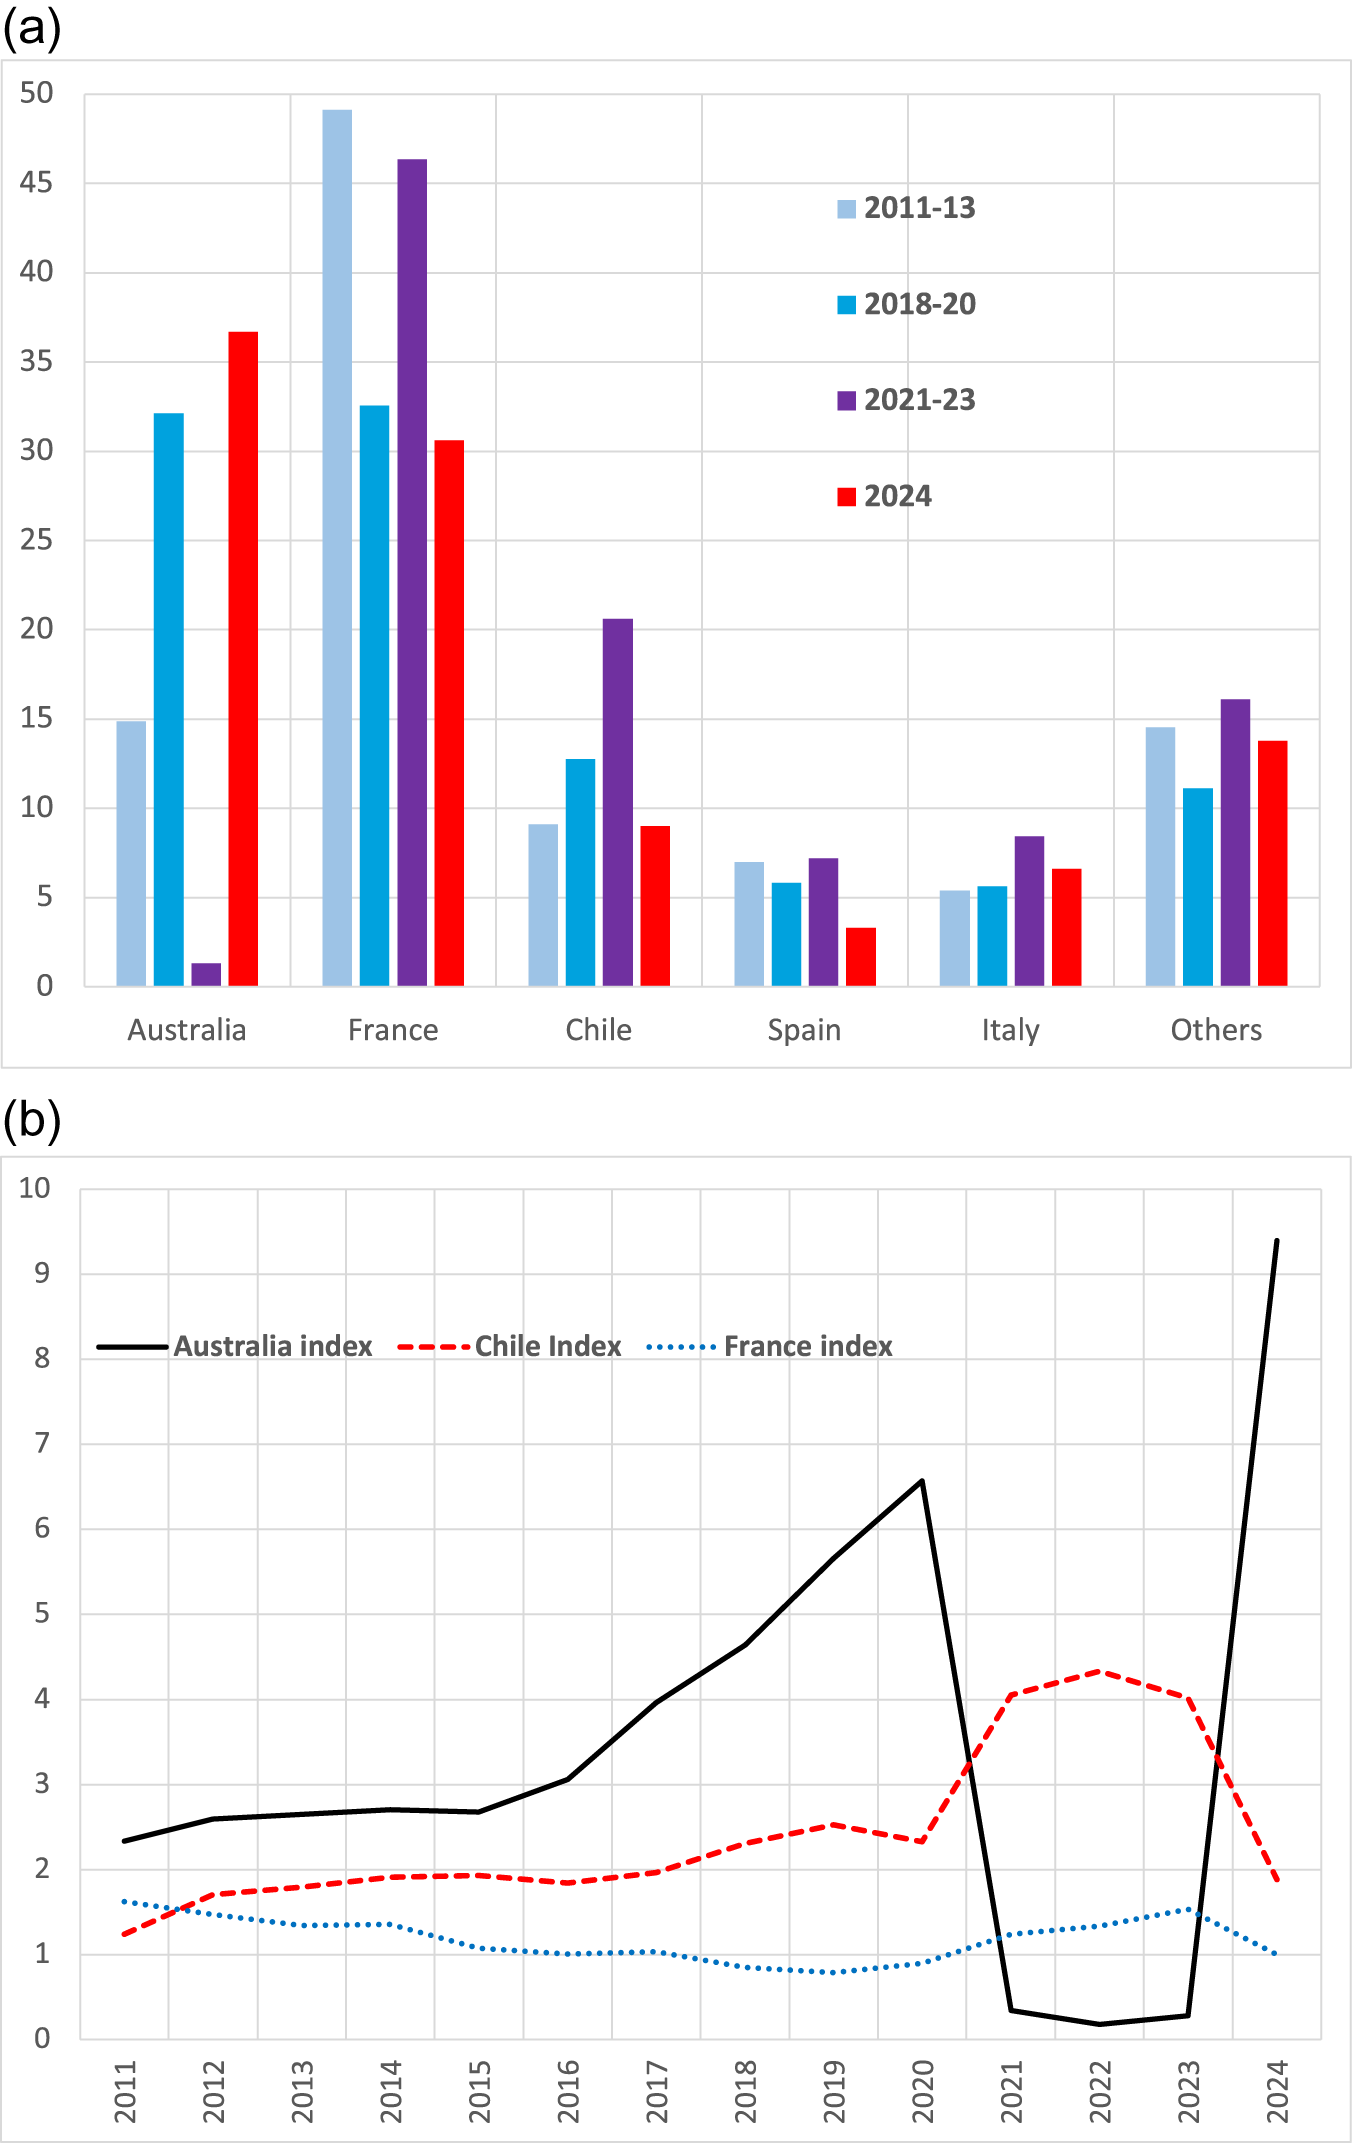
Exporters of Australian wine were effectively denied access to the Chinese market by punitive tariffs of up to 218% on their bottles (foreshadowed in late 2000 and formalized in March 2021, following intense lobbying by the China Alcoholic Drinks Association). That did little on its own to reduce China's imports. According to modeling by Wittwer and Anderson (Reference Wittwer and Anderson2021), it would have dampened total imports by only about 1%, other things equal. But what it did do was give other exporters a chance to boost their shares of that declining market (Figure 6(a)). In 2018–20, Australian wine accounted for one-third of the value of China's wine imports, or about six times China's share of global wine imports (double the intensity as of 2015 when the China–Australia FTA came into force). During the following 3 years, Chile and France each nearly doubled the intensity of their wine trade with China (Figure 6(b)). When the tariffs on Australian wine were removed at the end of March 2024, Australia began to claw back to its previous dominant place.
Shares and indexes of intensity (share of the value of country i's wine exports going to country j divided by country j's share in the value of global wine imports) of wine exports to China from key countries, by value, 2011 to 2024. (a) Shares in value of China’s imports (%). (b) Indexes of export intensity.

III. Short- to medium-term outlook
The overall size of China's wine market has been rising less rapidly post-COVID than was initially expected. At least three factors are at play in holding back China's wine demand growth.
One is the large stocks of unsold wine sitting in warehouses waiting for a post-COVID recovery. That includes domestic wines as well as imported ones.
Another is the surplus housing crisis, which is continuing to sap the confidence of consumers and investors—one consequence of which is a slowdown in economic growth to less than half the pace of the first 30 years of opening up.
And thirdly, China's trade tensions with the United States and EU are rising and bringing with them greater uncertainty. Donald Trump's election to the United States presidency and his grand announcement on 2 April 2025 of tariffs on all U.S. imports has added greatly to that tension and uncertainty. That was exacerbated a week later when Trump raised the tariff on most Chinese goods to 145% and China retaliated with 125% tariffs on most U.S. goods.
This short-term outlook is not very relevant to those wine exporters who understand that building partnerships with Chinese importers, distributors, and retailers is a long-term, time-intensive process that involves decades rather than months or a few years. Of much more relevance to those able and willing to make those investments over coming years is the longer-term growth outlook.
IV. Longer-term outlook: China's alcohol consumption in international perspective
Perhaps the two biggest determinants of future growth in China's wine demand are growth in the country's income per capita (since its population growth is now close to zero), and changes in preferences for and among alcoholic beverages.
One global comparative analysis found that the volume of alcohol consumption per capita tends to rise until a country reaches about twice the global average income. It also found that national expenditure per capita on alcohol typically rises until a country reaches around four times the global average income (Holmes and Anderson, Reference Holmes and Anderson2017). Since China's gross national income per capita currently is only slightly above the average for the world, at around $22,000 (PPP constant 2021 international dollars, see World Bank, 2025), that suggests the country's alcohol consumption volume and especially expenditure will continue to rise for decades to come.
That same comparative analysis by Holmes and Anderson (Reference Holmes and Anderson2017) divided countries into three groups, based on their consumers’ beverage preference in the early 1960s, namely spirits-focused, beer-focused, and wine-focused. China was an extreme case in the first category. Like other spirits-focused countries, and consistent with the expectation that consumer exposure via globalization leads to convergence in preferences (Stigler and Becker, Reference Stigler and Becker1977),Footnote 2 China's consumers have been converging toward the global average beverage mix. But that has been happening much faster in terms of beer than wine (Figure 7). Given also that China's wine consumption per capita is only one-ninth the global average (Anderson and Pinilla, Reference Anderson and Pinilla2025), that suggests huge scope remains for wine market growth in China.
Intensities of wine, spirits, and beer in total alcohol consumption, China and all spirits-focused countries, 1961 to 2023 (world = 1.0 for each beverage) (The intensity index is defined as the fraction of spirits, beer, or wine consumption in total national alcohol consumption volume in country i divided by the fraction for that same beverage in world total alcohol consumption). (a) China. (b) All traditionally spirits-focused countries (Spirits-focused countries as of 1961–64 include Brazil, China, Finland, Hong Kong, India, Japan, Korea, Norway, Philippines, Russia, South Africa, Sweden, Taiwan, Thailand, Ukraine, Western Europe other than its wine- and beer-focused countries, and Asia other than its wine- and beer-focused countries).

Further support for the argument that there is huge scope for China's wine consumption to expand is provided in Figure 8. It reveals that the quantity of apparent wine consumption in Hong Kong and its average price are more than five times those indicators for mainland China. The differences are not surprising given that the average income in Hong Kong is more than three times that of the mainland (and of the world), and it receives proportionately more high-spending tourists. Hong Hong's wine consumption in 2023 was close to the global average of 2.7 L per capita and 10 times that of the mainland. The main point, though, is the potential it exposes for very substantial wine sales growth in China (as also in Southeast Asia—see Anderson, Reference Anderson2020) as per capita income rises in coming decades.
Average wine import price and per capita consumption volume, (Consumption is estimated as production plus net imports and thus does not account for annual changes in domestic stocks of wine held by producers, importers, distributors, and retailers in either Hong Kong or mainland China.) China and Hong Kong, 2005 to 2024 (US$/liter and liters).

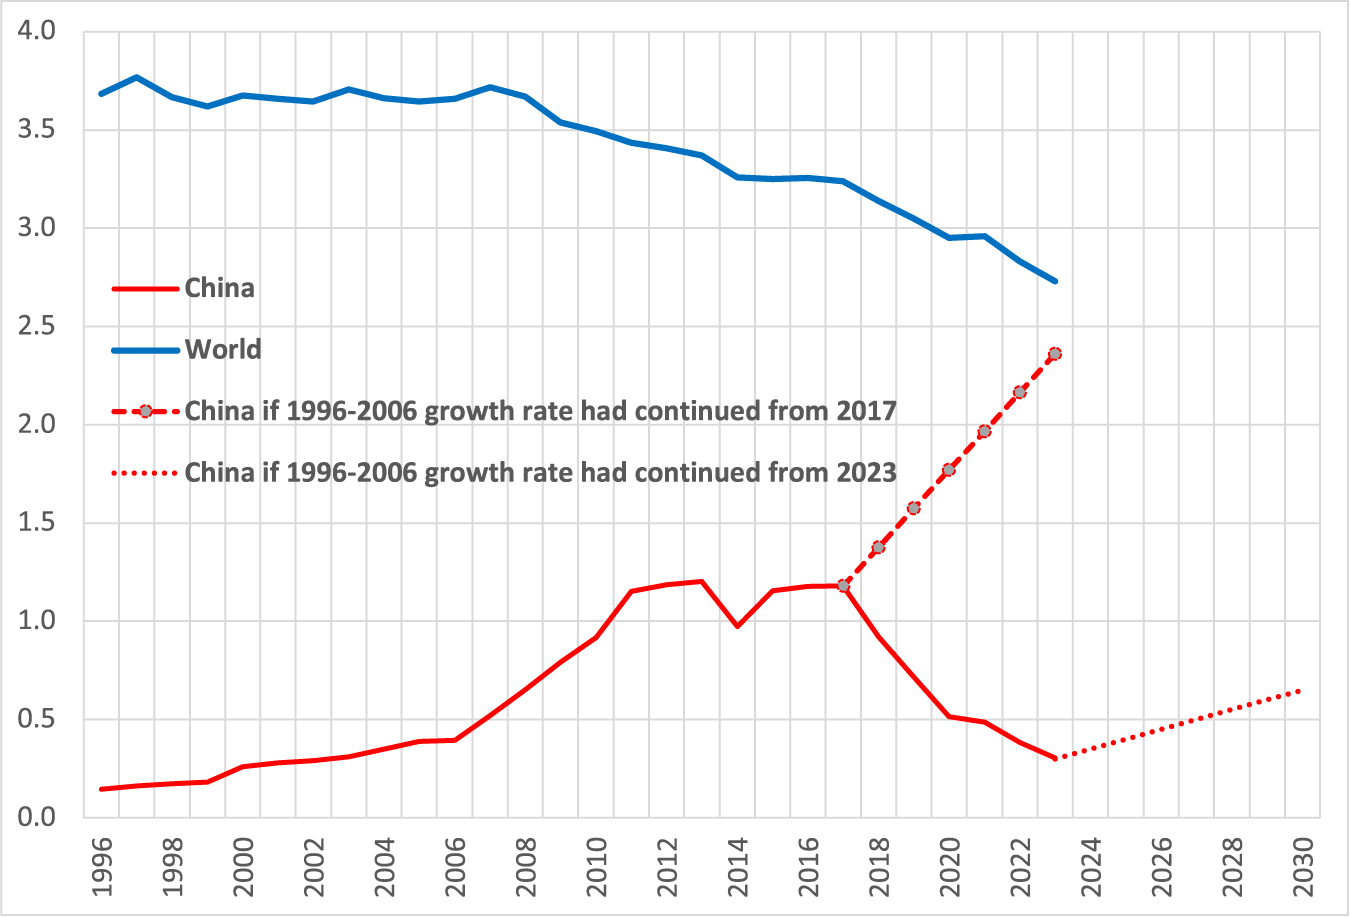
How much might China's wine consumption rise over the rest of this decade? Were it to return to the same annual growth rate as in the decade to 2006, then by 2030, it would have returned to that just before COVID. But had that rate of growth been the case from the much higher level in 2017, China's wine consumption by now would have converged on the global average rate (Figure 9). So while China can again become a substantial player in global wine markets, it may do so more slowly in coming years than in the first two decades of this century.
China's wine consumption per capita had it continued at its 1996–2006 growth rate from 2017 or 2023.

V. The potential for policies to further disrupt China's wine trade
Government policy changes and pronouncements can of course disrupt the prospective trends outlined earlier. As in the past, some could boost wine import demand (as with Li Peng's praising of red wine in 1996 and the signing of the China–Australia FTA in 2015), while others could dampen that trade (as with Xi Jinping's frowning on conspicuous consumption from 2013 and China's punitive tariff on imports of Australian wine during 2021–24). Serious long-term investors in this trade will build their capacity to roll with such disruptions in the knowledge that the main driver of long-run growth in wine demand will be real growth in China's per capita income.
This is not to deny that national shares of wine-exporting countries in the Chinese market may continue to gyrate. One reason is because President Xi plans to lead China for a long time and his policies affecting wine may continue to be erratic and unevenly affect imports from China's various trading partners.
Another reason is because of the tariff wars that are likely to continue following President Trump's shock announcement on 2 April 2025 of the United States raising tariffs on all imported goods by between 10% and 50%, depending on the country. For U.S. imports from China, a tariff hike of 34% was added to the 20% hike the United States imposed on Chinese goods a month earlier. China responded the next day with a 34% hike in its tariffs on imports of all U.S. goods—to which Trump raised the U.S. tariff hike to 145% and China again retaliated by raising its tariffs on U.S. goods to 125%.
A study by Anderson and Wittwer (Reference Anderson and Wittwer2025), drawing on their global model of national beverage markets (Wittwer and Anderson, Reference Wittwer and Anderson2020), provides estimates of the impact of these recent shocks to the global trading system on China's beverage imports. Here we summarize its results as they affect wine trade under three cumulative simulations: Simulation 1, U.S. tariff hikes of 2 April trigger no policy response from the rest of the world; Simulation 2, Canada, China, and other Asian countries impose tariff hikes on their beverage imports from the United States at the same rate the United States imposed on its imports of their goods on 2 April; and Simulation 3, those actions and reactions (plus potential EU retaliation) lead to greater uncertainty for households as well as industries and cause aggregate household expenditure to shrink over the medium term in each country by 2%.
The impacts of those three modeled scenarios on China's wine imports, in millions of 2025 U.S. dollars, are summarized in Table 1. In the first two scenarios, the value of China's wine imports are estimated to change little in total, but to increase from some exporting countries and decrease from others thanks to trade diversion in addition to the trade destruction caused by the U.S. unilateral tariff hikes. In the more-realistic third scenario, those Chinese imports decrease far more substantially and from all countries, not least because of the assumed 2% slump in China's household expenditure. However, the import decreases are uneven across countries: they fall most from the United States, but the harm to Australia's wine sales is not much less because of its renewed concentration on the China market. The impact on the shares of each country in China's wine imports is shown in column 5 of Table 1, with the shares of both the United States and Italy falling 3% and those of Australia and France rising by about half those amounts. China's share of global wine imports is estimated to be lowered by 0.4% thanks to this latest tariff war (final column of Table 1).
Estimated effects of the U.S.-led tariff war on the value of China's imports of wine, by source country (2025 US$ million and percentage points)

Source: Anderson and Wittwer (Reference Anderson and Wittwer2025).
These results suggest that even if China's role in the world's wine markets does return to one of growth in the years ahead, turbulence around that trend may well continue given the new instability in the global trading system and continuing frictions between China, the United States, and their major trading partners.
Acknowledgments
The author is grateful for helpful comments from an anonymous referee and the Editor, Karl Storchmann. The paper draws on, updates, and extends a presentation given at the International Wine Law Association (Australasian Section) Conference, Adelaide, November 1–3, 2024, which itself drew on and updated material in Anderson (Reference Anderson2023).
Funding statement
This work was supported financially by Wine Australia and the University of Adelaide's School of Agriculture, Food and Wine, its Faculty of Arts, Business, Law and Economics, and its Office of the Deputy Vice-Chancellor (Research).


 Open access