

Introduction
Ice sheets play a major role in studies of global climate change and sea-level rise. The Antarctic ice sheet stores the majority of the Earth’s fresh water, and the mass balance of the Antarctic ice sheet is an important climatic variable since any significant deviation from a balanced state will have an effect on global sea level (Reference Meier and PeltierMeier, 1993; Reference Alley, Clark, Huybrechts and JoughinAlley and others, 2005). Mass-balance and other glaciological studies require knowledge of ice velocity, surface elevation, ice thickness and snow accumulation either from direct field measurements or via remote-sensing methods (Reference PatersonPaterson, 1994). There are very few geodetic measurements of the above parameters in the interior of the East Antarctic ice sheet. Considering the difficulties of accessibility, the hostile environment and the logistic problems in Antarctica, the global positioning system (GPS) has become a standard tool for field measurement of ice kinematics and surface topography in Antarctica (Reference Tabacco, Passerini, Corbelli and GormanTabacco and others, 1998; Reference Capra, Cefalo, Gandolfi, Manzoni, Tabacco and VittuariCapra and others, 2000; Reference King, Nguyen, Coleman and MorganKing and others, 2000, Reference King, Coleman, Morgan and Hurd2007; Reference GudmundssonGudmundsson, 2006).
Dome A, the highest ice feature in Antarctica, is just over 4000 ma.s.l., located near the center of East Antarctica and approximately midway between the head of Lambert Glacier and the South Pole. In the framework of the International Trans-Antarctic Scientific Expedition (ITASE), the Chinese National Antarctic Research Expedition’s (CHINARE) glaciological research program has concentrated on the traverse route between Zhongshan station and Dome A during the austral summers from 1996/97 to 2004/05 (Reference QinQin and others, 2000, Reference Qin2004; Reference Xiao, Ren, Qin, Li, Sun and AllisonXiao and others, 2001, Reference Xiao, Allison, Ren, Qin, Zhang and Li2004; Reference ZhangZhang and others, 2002; Reference Ren, Sun and QinRen and others, 2004). The program has included studies of mass balance and ice temperature, meteorological measurements including automatic weather station installations, glacio-chemical studies of surface snow and shallow ice cores, and stratigraphy in snow pits and snow/firn cores.
Along the traverse route, GPS sites were established at approximately 50 km intervals. This paper describes the results of GPS surveys, which provide information on ice velocities along the transect from the coast to Dome A.
Field Expeditions And Data Processing
The first expedition south from Zhongshan station extended to site DT001 (Fig. 1), 296 km inland, during the 1996/97 austral summer. Two GPS sites were set up at DT001. The traverse was extended further southwards to site DT085, 464 km from Zhongshan station, during the 1997/98 field season. Seven GPS sites were set up along this section of the traverse. At each site, stainless-steel poles 3 cm in diameter and 3 m long were penetrated (vertically) into the snow to at least 1 m depth. The position was measured overnight using a dual-frequency GPS receiver. The satellite cut-off angle was set to 15˚ and the sample interval was 15 s. During the 1998/99 field season the traverse was extended further south to site DT416, 1128 km from Zhongshan station. The seven GPS sites set up in 1997/98 were reoccupied and 16 new GPS sites were established. During the 1999/2000 and 2002/03 field seasons, CHINARE carried out two expeditions to the Grove Mountains (Fig. 1); the traverse route was from Zhongshan station to DT085 and then turned west to the Grove Mountains (Reference Dongchen, Zhou and LiaoDongchen and others, 2004, Reference Dongchen, Zhang, Yan and Li2005). Along the traverse route, six GPS sites were reoccupied for several hours.
Sketch map showing the route of the Chinese Antarctic inland traverse.

During the 2004/05 austral summer, the traverse was extended to the summit of Dome A, 1228 km from Zhongshan station. Snow accumulation rate and ice temperature were measured, and snow/firn ice cores were collected. Radio-echo sounding measurements and meteorological studies were conducted along the traverse route and at the summit of Dome A (Reference Hou, Li, Xiao and RenHou and others, 2007; Reference Xu, Hou, Ren and PetitXu and others, 2007). The surface topography around the summit of Dome A, over an area of 60 km2, was measured using real-time kinematic GPS techniques (Reference Zhang, Dongchen, Wang, Zhou and ShenZhang and others, 2007). Individual measurements of surface mass balance were made on bamboo poles spaced at 2 km intervals along the whole traverse route. The coordinates of the poles were recorded by a hand-held GPS navigator. The surface elevation profile of the traverse route was constructed from the GPS navigation data (Fig. 2). The topographic profile of the traverse indicates three sectors: an area extending about 200 km from Zhongshan station (slope area) with a steep slope and height up to 2000 m; a second area (plateau area) extending up to about 950 km with a gentle slope and height ranging from 2000 to 3100 m; and the dome area in the last 300 km with height up to 4093 m. The accuracy of elevation data during the 2004/05 traverse is higher than that of 1998/ 99, because the GPS navigation accuracy improved significantly once ‘selective availability’ was terminated on 1 May 2000 (Reference LeickLeick, 2004). This topographic profile is similar to the topographic profile from Terra Nova Bay to Dome C (slope area up to 250 km, plateau area up to 900 km, and dome area up to 1150 km) (Reference Frezzotti, Gandolfi, La Marca and UrbiniFrezzotti and others, 2002, Reference Frezzotti2005).
Surface elevation profile of the traverse route from the coast to Dome A.
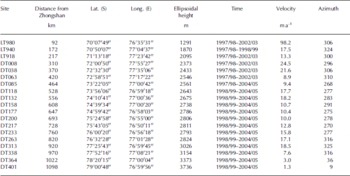
Along the 2004/05 traverse route, 28 GPS sites were measured including 13 repeated sites and 15 new sites. Along the first part of the traverse route from Zhongshan station to DT085, because the poles at the old GPS sites (at which ice velocities had previously been measured) were all buried, eight new sites were established. Along the second part of the traverse route from DT085 to Dome A, most of the old sites were remeasured; some of them were occupied overnight, and others occupied for 1–2 hours during short stops. There are 19 sites along the route that have been occupied on at least two occasions. GPS observation information from 1996/97 to 2004/05 is shown in Table 1.
GPS observation information from 1996/97 to 2004/05 along the traverse route

The GPS data were processed using GAMIT/GLOBK software (Reference KingKing, 2002). During the data processing, (1) International GNSS Service (IGS) precise ephemerides were used; (2) several IGS stations around Antarctica (e.g. CAS1, DAV1, MAW1, MCM4, PALM, SYOG and VESL) were tightly constrained (within 1 cm) at their ITRF2000 values, while the site along the traverse was loosely constrained (within 100 m); (3) an elevation cut-off angle of 158 was set; (4) antenna-phase centre variation corrections were applied; (5) the ionospheric-free linear combination of the L1 and L2 frequencies was used; (6) corrections were applied for both the solid-Earth and frequency-dependent tides; (7) the dry component of the zenith tropospheric delay was estimated by the Saastamoinen model; and (8) the wet component was estimated during the inversion, with zenith-delay adjustments every 2 hours. The GAMIT solutions were then combined using GLOBK software.
Results And Discussion
Horizontal velocities at each of the 19 sites were extracted from the GAMIT/GLOBK solution. Horizontal uncertainties at the 19 sites were within 10 cm. Elevation change in the region was also determined but will be reported elsewhere. Table 2 summarizes the velocity results of the 19 sites on the traverse. The surface ice-velocity vectors map is shown in Figure 3.
Vector map of surface ice flow along the traverse from Zhongshan station to Dome A. (Elevation contours derived from the RAMP DEM.)
Horizontal velocities at GPS sites along the traverse route from Zhongshan station to Dome A
The horizontal surface velocity values are close to zero at the summit of Dome A and increase with distance from the summit. At Dome C, the ice surface at the poles closest to the summit moves horizontally by up to a few mma–1, while velocities 25km from the summit are up to 0.211 ma–1 (Reference VittuariVittuari and others, 2004). At Dome F the surface ice-flow rate is <10ma–1 in the inland region above 3000 m (Reference Takahashi, Naruse, Nishio and WatanabeTakahashi and others, 2003).
*Site LT940 and site LGB69 are the same site.
The velocity increases from 1.3ma–1 at site DT401 (150km from the summit of Dome A) to 3.0ma–1 at site DT364 (~230km from the summit of Dome A). The velocity at site DT338 (3154ma.s.l.; 280 km from the summit) is 7.6ma–1, while it reaches 18.5ma–1 at DT313 (3026ma.s.l.; 330 km from the summit). So the velocity in the dome region, which is above 3100 m and within about 300 km of the summit, is <10ma–1. The flow directions at these sites are consistent with downslope (perpendicular to the elevation contours) motion of the ice sheet. In forthcoming field seasons, we plan to establish a strain network in the Dome A region for the study of ice dynamics, which will provide fiducial control for synthetic aperture radar (SAR) interferometry and balance-velocity computation, and will be an important pre-site survey for deep ice drilling.
In the plateau area of the traverse route, the velocities range from 8 to 24 ma–1, and ice flows towards the Lambert Glacier basin (LGB). The first part of the route from Zhongshan station to DT085 is partly coincident with the Australian National Antarctic Research Expeditions (ANARE) traverse route surrounding the LGB during the early 1990s (Fig. 1). The ice-flow velocities along the ANARE traverse line varied between 10 and 25 ma–1 (Reference Manson, Coleman, Morgan and KingManson and others, 2000; Reference KiernanKiernan, 2001), agreeing with our results (Table 3). The velocity differences during the three periods (1997/98– 1998/99, 1998/99–1999/2000 and 1999/2000–2002/03) at the six sites (LT980, LT918, DT008, DT038, DT063 and DT085) are very small (within 0.3ma–1) and the flow directions are the same. The velocity difference between 1993/94–1994/95 and 1997/98–1998/99 at LT940 and LGB69 is 0.2 ma–1. Considering the calculation uncertainty, the eastern edge of the LGB is considered to have been in balance since the 1990s. Similar ice-flow measurements have been performed over other glacier basins in Antarctica. For instance, the surface flow velocity is ~20ma–1 in the middle part of the Shirase Glacier drainage basin at about 2500ma.s.l. in the Dronning Maud Land ice sheet (Reference Takahashi, Naruse, Nishio and WatanabeTakahashi and others, 2003).
Horizontal velocities at GPS sites along the CHINARE and ANARE routes
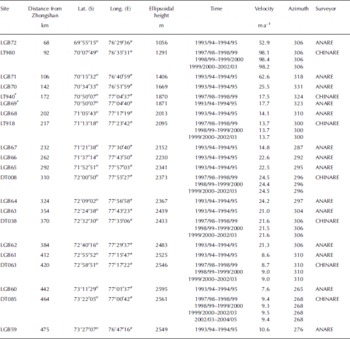
The maximum ice velocity was found in the coastal ice-sheet regions where the velocity reaches 98.2 ma–1 at site LT980 (92km from Zhongshan station). The velocities at sites LGB72 and LGB71 on the steep coastal slopes of the eastern side of the LGB are respectively 52.9 and 62.6 ma–1.
Conclusion
We have detailed the measurement of ice-surface movement along the traverse route from Zhongshan station to Dome A, the highest point on the Antarctic ice sheet. The horizontal ice-surface velocities increase from near zero at the summit to several tens of ma–1 near the coast. The flow directions are roughly perpendicular to the surface elevation contours, most of the vectors indicating flow towards the LGB. Our measurements are in good agreement with the ANARE measurements in the lower section of the CHINARE traverse, where the two sets overlap (see Fig. 4). In addition, the measurements show similar characteristics to those in other Antarctic glacier drainage basins.
Surface ice velocity along both CHINARE and ANARE traverses.
The ice surface velocity measurements in this region will provide fiducial control for remote-sensing analysis. Future repeat GPS measurements will be used to validate the present ice-flow conditions. Radio-echo sounding was also carried out along the traverse route; results will be published elsewhere. Ice thickness and bedrock topography will provide further explanation for the ice-velocity variation along the transect. Combining the data of ice velocity, ice thickness and snow accumulation will be helpful in the study of ice dynamics, and so will be useful in mass-balance assessment of the ice sheet.
Acknowledgements
We thank the members of the inland ice-sheet teams of CHINARE from 1996/97 to 2004/05. The Massachusetts Institute of Technology and the US National Snow and Ice Data Center provided the GAMIT/GLOBK software package and the RADARSAT-1 Antarctic Mapping Mission digital elevation model (RAMP DEM) respectively. We appreciate the helpful comments of Xiao Cunde and two anonymous reviewers. This work was supported by State Bureau of Surveying and Mapping (No. 1469990711109-1), Chinese Arctic and Antarctic Administration (No. 20070206) and the National Science Foundation of China (No. 40606002).


