

Hepatocellular carcinoma (HCC) is the most frequently observed liver cancer and the fourth leading cause of cancer-associated death worldwide(Reference Forner, Reig and Bruix1). Treatment options for HCC include surgical resection, liver transplantation, tumour ablation, transarterial chemoembolisation (TACE) and systemic therapies (sorafenib and lenvatinib)(Reference Villanueva2,Reference Nault3) . Treatment strategies are suggested according to the specific stage of HCC(Reference Arslanoglu, Seyal and Sodagari4). Intermediate-stage HCC is defined as multinodular, unresectable, with preserved liver function and without vascular invasion or extrahepatic metastasis. For patients with intermediate-stage HCC, the Barcelona Clinic Liver Cancer algorithm and European Association for the Study of the Liver guidelines recommend TACE as the only first-line treatment(Reference Villanueva2,5) . TACE is minimally invasive and has fewer complications for patients with HCC.
Important prognostic factors for HCC include Child-Pugh score, α-fetoprotein (AFP), tumour size, tumour number and tumour location(Reference Hiraoka, Kumada and Kudo6–Reference Kohla, Abu Zeid and Al-Warraky8). These factors mainly focus on the status of the tumours and liver function. In addition, the Controlling Nutritional Status (CONUT) score is a validated prognostic predictor in patients with HCC after surgical resection(Reference Tsunematsu, Haruki and Fujiwara9–Reference Takagi, Yagi and Umeda12). The CONUT score is a screening tool to assess the nutritional status of patients, based on serum albumin (ALB), total cholesterol and lymphocyte counts. Our previous studies also found that the CONUT score is an important indicator for the prognosis of patients with early-stage HCC who had undergone radiofrequency ablation(Reference Chen, Zhao and Yang13,Reference Yang, Ye and Xin14) . However, it has not been determined whether the CONUT score may indicate the prognosis of patients with intermediate-stage HCC treated with TACE.
We hypothesised that the CONUT score has predictive value in patients with intermediate-stage HCC who received TACE. To develop convenient and effective prognostic prediction models for patients with intermediate-stage HCC who received TACE, the present retrospective study evaluated the predictive value of the CONUT score, and nomograms were developed to predict PFS and OS.
Methods
The Ethics Board of the National Cancer Center/National Clinical Research Center for Cancer/Cancer Hospital College, Chinese Academy of Medical Sciences College and Peking Union Medical College (approval number: NCC2019KZ-010) approved this retrospective study. As the study was retrospective and with anonymous characteristics, the need for informed consent from each patient was waived. The relevant medical data were reviewed from records at the National Cancer Center/National Clinical Research Center for Cancer/Cancer Hospital, Chinese Academy of Medical Sciences and Peking Union Medical College.
Patients
Patients with confirmed HCC from January 2015 to January 2020 were screened. The diagnosis of HCC was based on non-invasive criteria or image-guided cut biopsy. The non-invasive diagnostic criteria for HCC, based on the European Association for the Study of the Liver guidelines, were as follows: patients had a background of cirrhosis; tumour diameter ≥ 1 cm and arterial hypervascularisation with venous or delayed phase washout observed via four-phase multi-detector CT or dynamic MRI(Reference Khalili, Kim and Jang15–Reference Erkan, Meier and Clark17). The criteria for inclusion were a diagnosis of intermediate-stage HCC (> 3 tumours, or ≥ 2 tumours if any > 3 cm, without vascular invasion and extrahepatic metastasis); TACE as the first-line treatment; Eastern Cooperative Oncology Group Performance Status score of 0 to 1(Reference Neeman, Gresham and Ovasapians18,19) and class A Child-Pugh score(Reference Tsoris and Marlar20).
Patients with any of the following were excluded: received other treatments before TACE (including hepatectomy, liver transplantation, tumour ablation or systemic therapy), with acute infection or a follow-up time < 12 months.
Transarterial chemoembolisation procedure
TACE procedures were conducted under local anaesthesia with the guidance of digital subtraction angiography, by clinicians with ten years’ experience. After punctuation of the femoral artery, the hepatic artery was cannulated selectively with a 5F catheter (RH catheter; Cook, Bloomington). To find all the arteries supplying the tumours, angiography of the superior mesenteric artery, phrenic artery and internal thoracic artery was performed as necessary. After identifying all the supplying arteries, the catheter was super-selected to the supplying artery of the tumours. Selective catheterisation was performed using 3F microcatheters (Progreat; Terumo). Iodised oil (Lipiodol) mixed with epirubicin (50 mg/m2) was used to embolise tumour-feeding arteries. Gelatin sponge particles were used to re-embolise, depending on the tumour situation. The endpoint of embolisation was the disappearance of the target vessels observed by digital subtraction angiography. The TACE procedure was repeated one month later.
Follow-up protocol
The follow-up examination was performed every month after TACE treatment until May 2021. The examinations during each follow-up visit included laboratory tests, multidetector CT abdomen or dynamic MRI and chest CT. The laboratory tests comprised the following: total serum bilirubin, ALB, aspartate aminotransferase, alanine aminotransferase, prothrombin time and serum AFP levels.
Primary outcomes
The primary outcomes included PFS and OS. PFS was defined as the time from first TACE procedure to tumour progression or death. Tumour progression was an increase in tumour diameter of 25 % from baseline, deterioration of liver function to Child-Pugh C, macrovascular invasion or extrahepatic metastasis(Reference Kudo, Ueshima and Ikeda21). OS was considered the time from the first TACE procedure to death or the last follow-up.
Sample size assessment
To assess a sample size with adequate statistical power, it was assumed that there might be up to eight covariates in the final logistic regression model and that a minimum of 160 patients (8 covariates × 20) with the outcome of death during the following-up period were needed(Reference Ogundimu, Altman and Collins22). For this study, patients were collected with available long-term follow-up results for the past 8 years in our centre. According to the 7-year mortality reported in a previous study, 190 patients or more might be needed (160/0·84 = 190)(Reference Takayasu, Arii and Ikai23). To increase the study power, all eligible patients in our records were included in the analysis finally.
Data collection
The collected data included the demographic and clinical characteristics of the study population: age; gender; maximum tumour diameter and number; degree of encephalopathy; ascites status; hepatitis B virus infection ratio; prothrombin time, AFP, aminotransferase, aminotransferase, ALB and total serum bilirubin levelsand tumour progression data. The time to progression and time to death or the last follow-up were recorded.
Calculation of scores
The CONUT score was the summation of scores for serum ALB concentration, peripheral lymphocyte count and total cholesterol concentration of fast blood samples collected within one week before TACE, which were determined as follows: ALB concentrations ≥ 3·5, 3·0–3·49, 2·5–2·99 and ≤ 2·5 g/dl were scored 0, 2, 4, 6, respectively; cholesterol concentrations ≥ 180, 140–179, 100–139 and ≤ 100 mg/dl were scored 0, 1, 2, 3 and total lymphocyte counts ≥ 1600, 1200–1599, 800–1199 and ≤ 800/mm3 received scores of 0, 1, 2, 3. Five variables (including BIL, ALB, prothrombin time, ascites status and degree of encephalopathy) were used to calculate the Child-Pugh score(Reference Pugh, Murray-Lyon and Dawson24). The albumin-bilirubin score was calculated as –0·085 × (ALB g/l) + 0·66 × ln (total serum bilirubin µmol/l)(Reference Johnson, Berhane and Kagebayashi25).
Statistical analysis
Cut-off points of the CONUT score were calculated based on the maximum Youden index (sensitivity + specificity – 1) point on the time-dependent receiver operating characteristic curve for the prediction of OS and PFS(Reference Unal26). Univariate and multivariate analyses were performed using a Cox regression for OS and PFS. OS and PFS were estimated by the Kaplan–Meier curve and were compared with the log-rank test. The nomograms were established to predict OS and PFS according to the results of Cox regression analysis. The accuracy and discrimination of the nomograms were evaluated by calibration and concordance index (C-index). The time-dependent area under the receiver operating characteristic curve (t-area under curve (AUC)) was calculated to evaluate the efficiency of the nomograms. All tests of significance were 2-sided, and a P-value < 0·05 was considered statistically significant. All statistical analyses were performed using EmpowerStats (www.empowerstats.com) and R software, version 3.6.2 (http://www.r-project.org/).
Results
Patients
Overall, 228 patients with HCC treated with TACE were enrolled in the study (aged 64·3 ± 9·6 years, 83·3 % (190/228) men; Table 1). The maximum Youden index point on the t- receiver operating characteristic was 4, which was thus considered the optimal cut-off value for the CONUT score. The patients’ data were categorised into two groups according to low (< 4) or high (≥ 4) CONUT score. The baseline characteristics of the low-CONUT and high-CONUT score groups were compared. The hepatitis B virus infection ratio of the high-CONUT score group was significantly higher than that of the low-CONUT score group (P = 0·003). There were no statistically significant differences in other indicators between the two groups.
Baseline characteristics of the 228 patients with hepatocellular carcinoma (HCC)*
(Numbers and percentages)
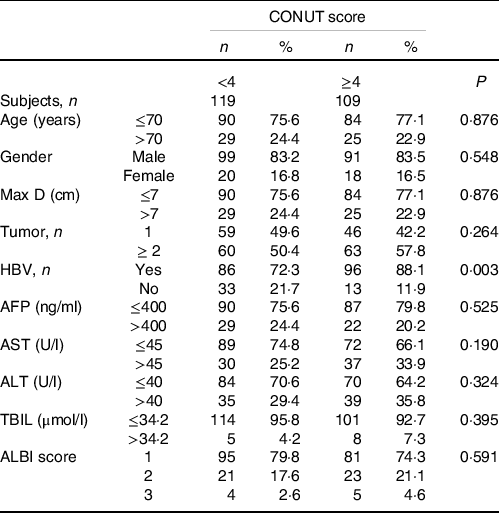
ALBI, albumin-bilirubin; AFP, alpha-fetoprotein; ALT, alanine aminotransferase; AST, aspartate aminotransferase; HBV, hepatitis B virus; Max D, maximum tumor diameter; TBIL, total serum bilirubin.
* Reported as n (%), unless indicated otherwise.
Overall survival
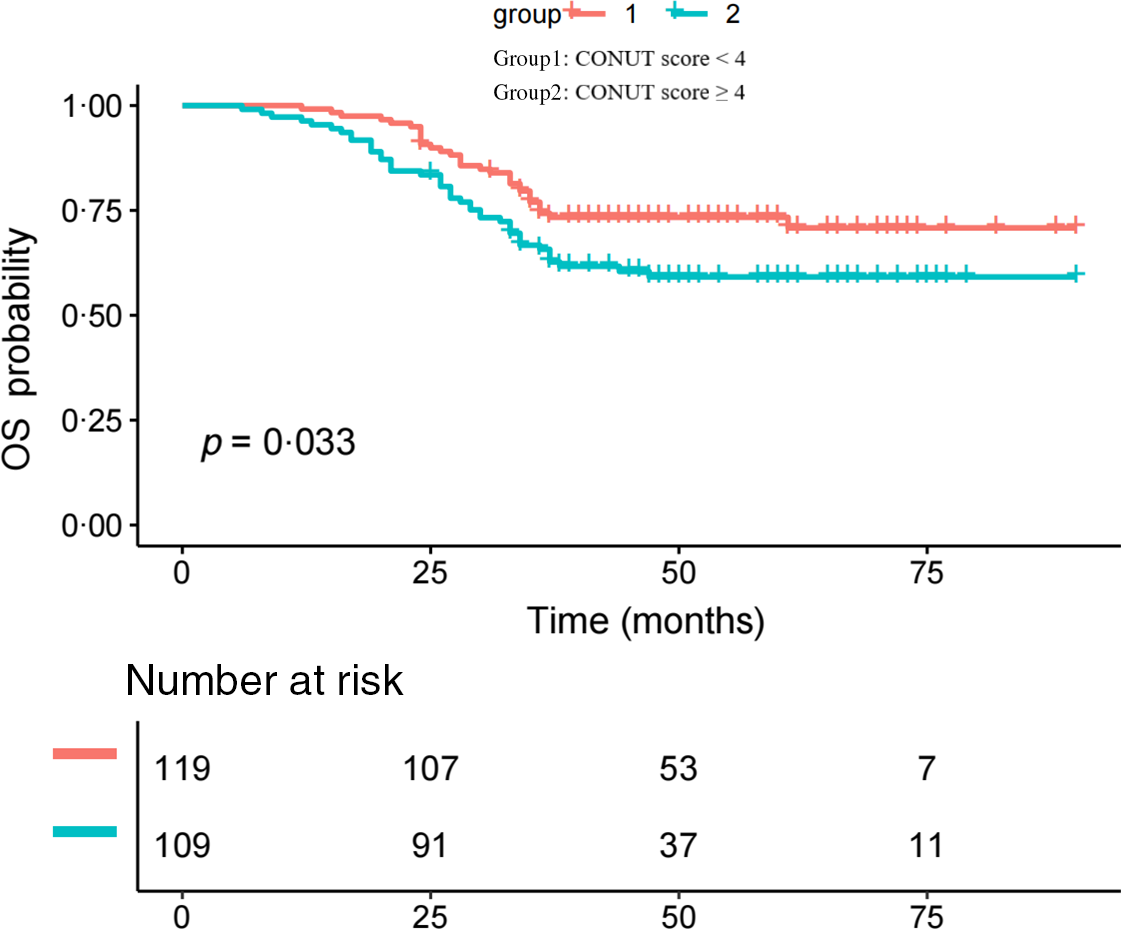
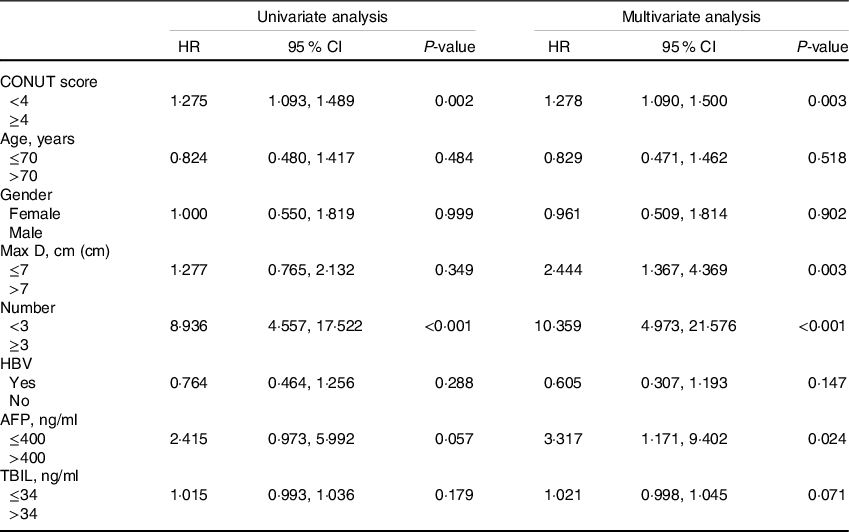
The median follow-up time was 41·7 (95 % CI (39·2, 44·4)) months. For the low- and high-score CONUT groups, the median OS times were, respectively, 44·6 (95 % CI: 41·5, 48·0) months and 38·7 (95 % CI: 35·0, 42·8) months. The Kaplan–Meier curve showed that the OS rate of the low-CONUT score group was significantly better than that of the high-CONUT score group (P = 0·033; Fig. 1). According to the multivariate Cox analyses, the prognostic factors of OS included age, tumour number, AFP level and CONUT score (Table 2).
Kaplan–Meier curve showing the OS rates of the two groups.
Univariate and multivariate analyses of prognostic factors for OS
(Hazard ratio and 95 % confidence intervals)

CONUT, controlling nutritional status; Max D, maximum tumour diameter; HBV, hepatitis B virus; AFP, α-fetoprotein; TBIL, total serum bilirubin.
Progression-free survival
For the low- and high-score CONUT groups, the median PFS times were, respectively, 14·2 (95 % CI: 12·3, 16·4) months and 12·6 (95 % CI: 10·7, 14·8) months. The Kaplan–Meier analysis showed that the PFS rate of the low-CONUT score group was significantly better than that of the high-CONUT score group (P = 0·047; Fig. 2). The prognostic factors of PFS according to the multivariate Cox regression analyses were the following: tumour number, maximum tumour diameter and CONUT score (Table 3).
Kaplan–Meier curve showing the progression free survival (PFS) rates of the two groups.

Univariate and multivariate analyses of prognostic factors for progression-free survival (PFS)
(Hazard ratio and 95 % confidence intervals)
CONUT, controlling nutritional status; HBV, hepatitis B virus; AFP, α-fetoprotein; TBIL, total serum bilirubin.
Construction of the nomogram for overall survival and progression-free survival
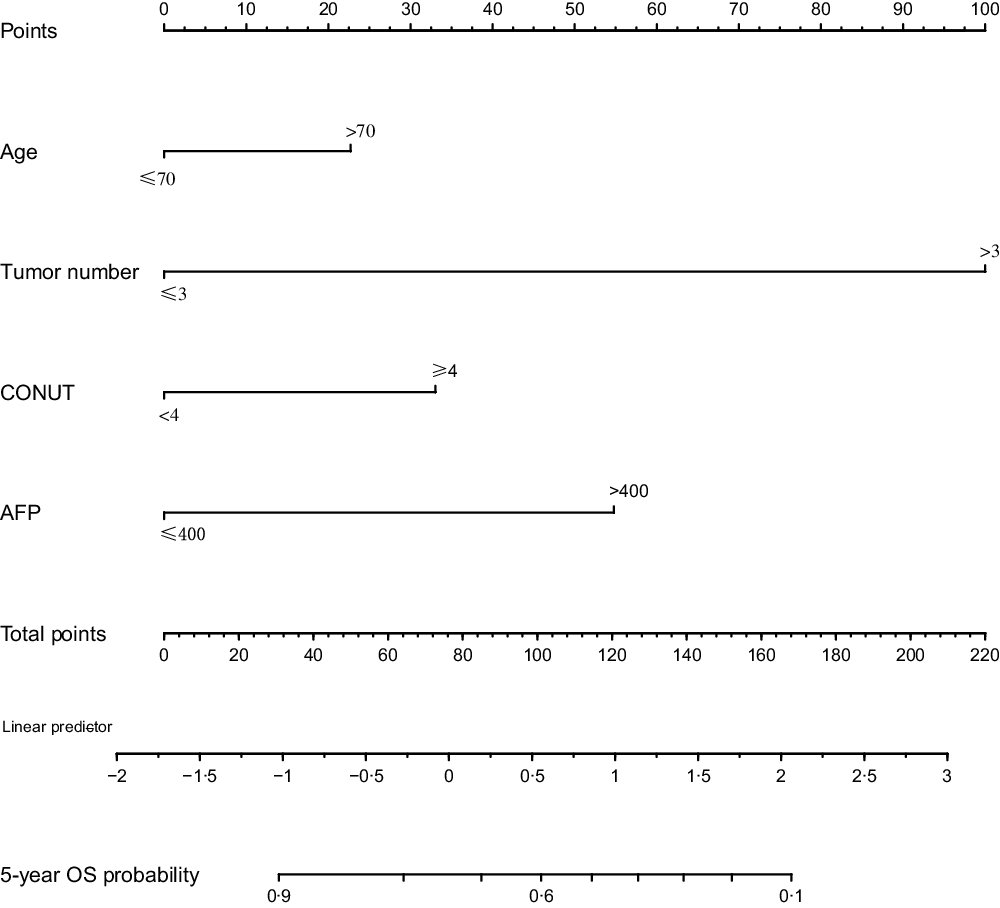
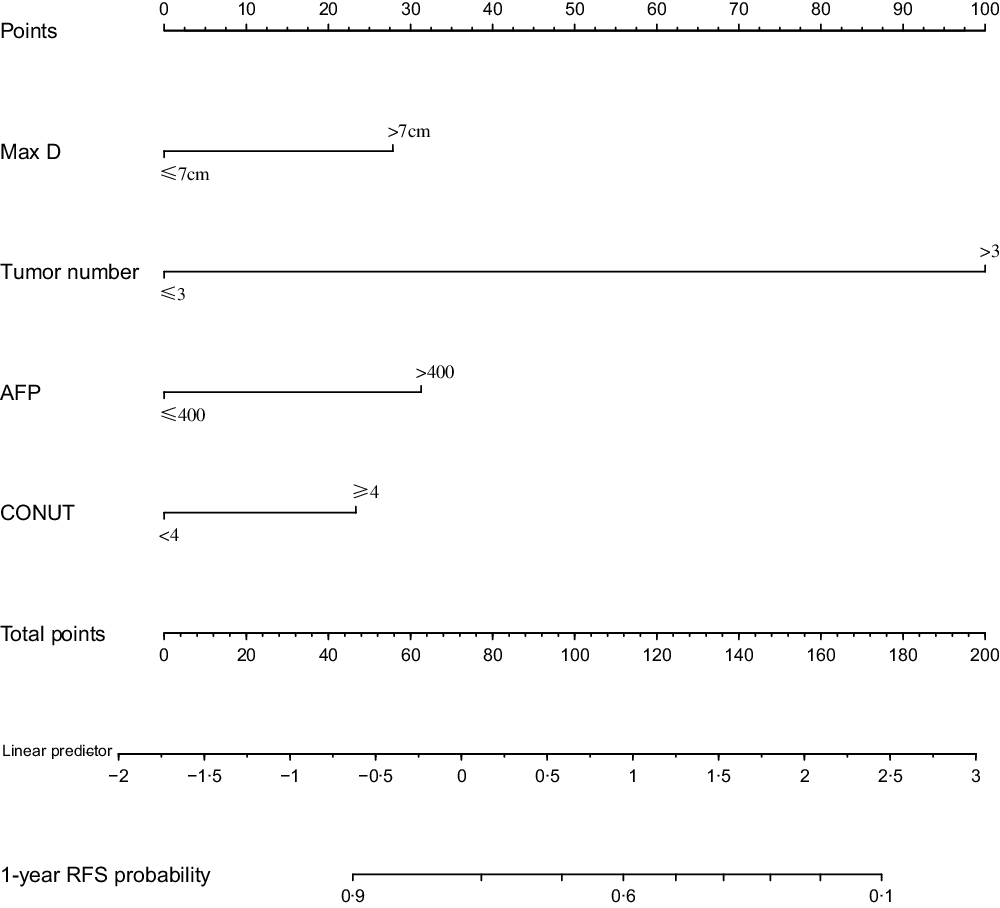
Based on the prognostic factors identified in the Cox regression analysis, nomograms were constructed to predict OS and PFS probabilities for patients with HCC after TACE. Age, tumour number, AFP level and CONUT scores were utilised as categorised variables in the nomogram to predict OS rate. Tumour number, maximum tumour diameter, AFP level and CONUT score were utilised as categorised variables in the nomogram for PFS rate. For each categorised variable, the corresponding points are located on the nomogram. The sum of the points of all variables is the total points, and a straight downward line of the total points shows the predicted OS or PFS rate. The nomograms for OS and PFS were established to predict the 5-year OS rate and 1-year PFS rate (Figs. 3 and 4, respectively).
Nomogram of OS to predict 5-year OS.
Nomogram of progression free survival (PFS) to predict 1-year PFS.
Assessment of the nomograms
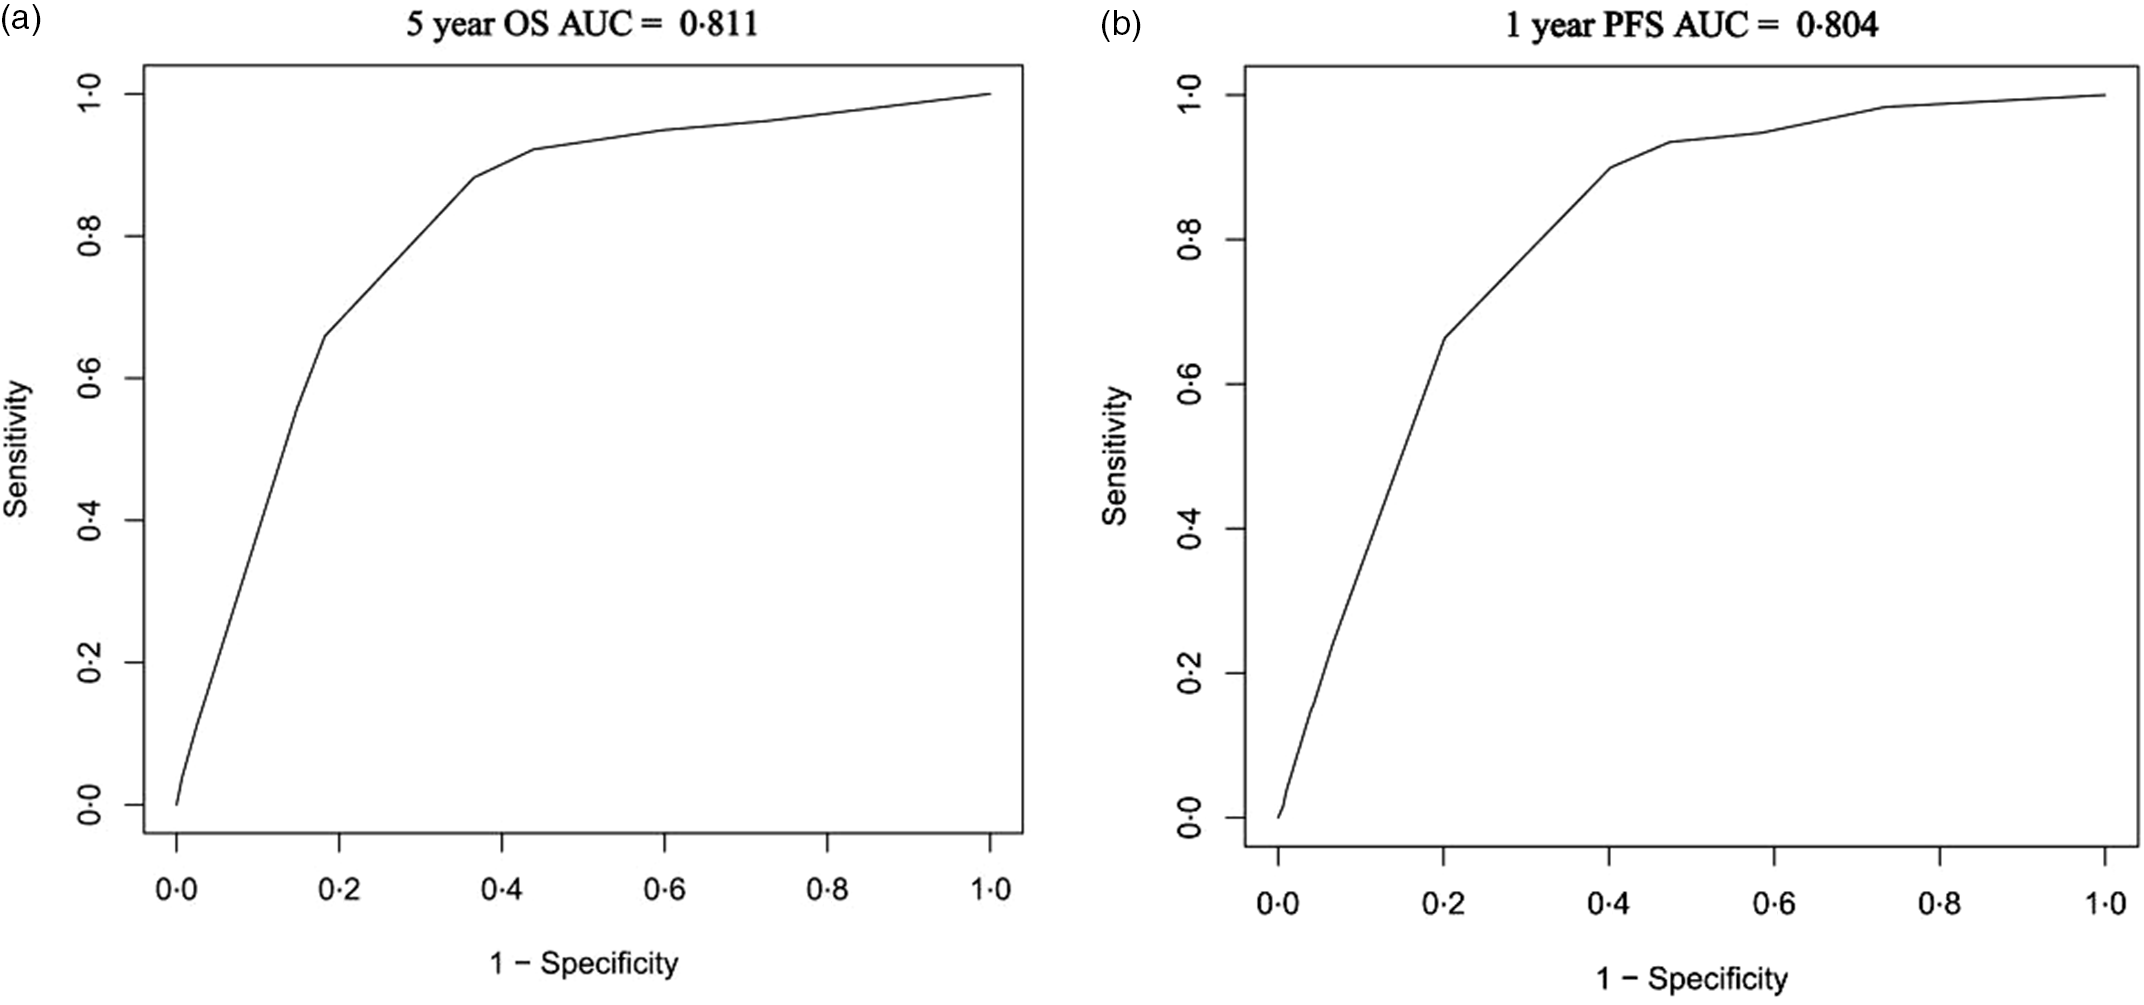
The C-indexes of the nomograms for OS and PFS prediction were 0·794 (95 % CI: 0·747, 0·840) and 0·799 (95 % CI: 0·754, 0·845), respectively. The calibration curves showed good consistency between the prediction determined by the nomogram (x-axis) and the observed OS and PFS rates (y-axis; Fig. 5). The AUC for the nomogram predicting 5-year OS rate was 0·811 (sensitivity [specificity] = 0·883 [0·634], and for the nomogram predicting a 1-year PFS rate was 0·804 (sensitivity [specificity] = 0·900 [0·598], Fig. 6).
Nomogram calibration curves for survival. (a) OS. (b) PFS.

Nomogram area under curve (AUC) for survival. (a) OS. (b) progression free survival (PFS).
Discussion
Many studies have shown that nutritional status is an important factor determining prognosis in malignant tumours(Reference Shimose, Kawaguchi and Iwamoto10,Reference Fukami, Saito and Osawa27,Reference Takagi, Domagala and Polak28) . The CONUT score focuses on the nutritional status of patients, which is a new prognostic scoring system for HCC. In the present study, the multivariate Cox regression analysis showed that age, tumour number, AFP level and CONUT score were risk factors of OS, while tumour number, maximum tumour diameter and CONUT score were prognostic factors of PFS. These results indicate that the CONUT score is an important prognostic factor for both OS and PFS for patients with HCC who have undergone TACE. In the present study, all patients were in intermediate-stage-B, and the CONUT score was an important reflection of OS and PFS. This suggests that for patients with HCC, the CONUT score should be considered seriously.
No validated CONUT score cut-off value has been reported previously, and in the present study, a cut-off of 4 was calculated, based on the maximum Youden index point on the time-dependent receiver operating characteristic. The Kaplan–Meier curves showed significant differences in OS and PFS between the low- (< 4; P = 0·033) and high- (≥ 4; P = 0·047) CONUT-score patient groups. The median OS times of the low- and high-CONUT score groups were, respectively, 44·6 months (95 % CI: 41·5, '48·0 months) and 38·7 months (95 % CI: 35·0, 42·8 months), while the median PFS times of the corresponding groups were 14·2 months (95 % CI: 12·3, 16·4 months) and 12·6 months (95 % CI: 10·7, 14·8 months). High CONUT scores were associated with poor survival outcomes. This suggests that we need to pay attention to the nutritional status of patients with HCC prior to allowing them to undergo TACE.
The mechanism by which the CONUT score predicts the prognosis of HCC is not entirely clear. This may be because the CONUT score is derived from serum ALB concentrations, total cholesterol concentration and lymphocyte count. The ALB concentration is an essential indicator of the nutritional and immune status of patients, and a low ALB concentration indicates malnutrition or cachexia(Reference Harimoto, Yoshizumi and Sakata29,Reference Wang, Chen and Xiang30) , which promotes tumour progression and even death. Carcinogenesis has been linked with the upregulation of cholesterol biosynthesis and uptake and the downregulation or impairment of cholesterol efflux from cells(Reference Cruz, Mo and McConathy31). Therefore, a decrease in cholesterol may lead to a worse prognosis and increased risk of recurrence. Furthermore, a low absolute lymphocyte count is related to poor nutritional status and impaired immune response. Studies have shown that lymphopenia is a risk factor for HCC recurrence(Reference Nagai, Abouljoud and Kazimi32). In summary, because the CONUT score reflects liver function and immune and nutritional status, it is rational that it can predict the prognosis of patients with HCC.
The nomogram is a visual predictive model, which is convenient and effective in practice(Reference Kao, Su and Chiou33). In the present study, the nomogram predicts the 5-year OS incorporated age, tumour number, AFP level and CONUT scores. The nomogram for 1-year PFS included tumour number, maximum tumour diameter, AFP level and CONUT score. By visual representation, the calibration curve shows that the difference between the actual OS and PFS and the predicted OS and PFS is acceptable. The C-indexes of the nomograms for OS and PFS prediction were 0·794 (95 % CI: 0·747, 0·840) and 0·799 (95 % CI: 0·754, 0·845), respectively. The AUC for the nomogram predicting 5-year OS rate was 0·811; the AUC for the nomogram predicting a 1-year PFS rate was 0·804. Thus, the nomograms of the present study were effective based on calibration curve, concordance index and t-AUC. Utilising these nomograms, the prognoses for PFS and OS can be estimated for each patient. The nomograms may help doctors improve the clinical management of patients and develop more appropriate TACE schedules.
To our best knowledge, the present study is the first to utilise the CONUT score as a prognostic factor in patients with intermediate-stage HCC after TACE. The present findings indicate that the CONUT score is an important prognostic factor of both OS and PFS for these patients; specifically, the higher the score, the worse the survival. Therefore, health care providers should pay more attention to patients with a high CONUT score (≥ 4) compared with those with low scores (< 4), for optimal patient management.
There are some limitations to our study. First, the study was retrospective, which may allow potential bias. In addition, this is a single-centre study, and the sample sizes were limited. Therefore, large-scale multicentre randomised control trials are needed to confirm the results. Lastly, more data, including imaging and pathological features, should be included to guarantee reliable and effective predictive models in the future.
Conclusions
The CONUT score is an important prognostic factor of both OS and PFS for patients with intermediate-stage HCC who have undergone TACE. The cut-off value of the CONUT score was 4, and a high CONUT score of 4 or greater suggests a poor survival outcome. The nomograms based on the CONUT score that were developed in this study are good models to predict OS and PFS.
Acknowledgements
This research received no specific grant from any funding agency, commercial or not-for-profit sectors.
Conception and design: Xiang Zhou, Yi Chen; administrative support: Xiang Zhou; provision of study materials or patients: Yi Chen & Xiang Zhou; collection and assembly of data: all authors; data analysis and interpretation: all authors; manuscript writing: Yi Chen & Wen-Ji Xu; final approval of manuscript: all authors.
The authors of this manuscript declare no relationships with any companies, whose products or services may be related to the subject matter of the article.


