


Dietary protein is reported to suppress appetite and reduce subsequent energy intake more than energy-matched loads of carbohydrate or fat(Reference Latner and Schwartz1–Reference Stubbs, van Wyk and Johnstone3). However, in a review of the studies investigating the effects of protein on satiety, Halton & Hu(Reference Halton and Hu4) reported that although many studies demonstrated a significant reduction in energy intake following a high-protein preload compared with a preload that contained less protein, it appeared that high concentrations of protein (>50 % energy) may be required to achieve these effects. In reality, it is unlikely that such large amounts of protein would be consumed as part of a meal; therefore, it is not clear whether supplementing protein into foods would be a feasible way to limit short-term energy intake.
Many studies vary the protein source in order to change the dose of protein, although proteins from different sources have been shown to differ in their satiety responses(Reference Lang, Bellisle and Oppert5–Reference Anderson, Tecimer and Shah8), which may be attributed to differences in composition, structure and rates of digestion and absorption between protein types. Hall et al. (Reference Hall, Millward and Long9) observed that a 1700 kJ mixed macronutrient preload containing 50 % energy from whey protein reduced energy intake at an ad libitum test meal served 90 min after the preload was consumed compared with an energy-matched preload containing 50 % energy from casein protein. However, others have failed to replicate these results(Reference Bowen, Manny and Craige10–Reference Bowen, Noakes and Clifton12). These inconsistencies between studies may be due to the differences in the amount of protein used, or the time interval between the preload and test meal.
A recent study reported that whey protein was able to suppress appetite more than casein at a low dose (10 % energy); however, there were no differences between protein sources at a high dose (50 %). These differences in subjective appetite were observed despite there being no associated differences in energy intake at a test meal between the conditions. The authors suggest that there may be a critical threshold for the amount of protein required to achieve the previously reported effects on satiety, with this threshold varying depending on the source of the protein. Furthermore, consuming doses higher than this threshold amount may not necessarily produce additional effects on satiety(Reference Veldhorst, Nieuwenhuizen and Hochstenbach-Waelen13).
Increasing the amount of protein in foods may be one way to enhance short-term energy restriction. Furthermore, whey protein may be more effective than other sources of protein in achieving these effects in the short term. However, it is unclear regarding the most feasible dose of whey protein that could achieve these effects. The aim of the present study was to investigate the effect of consuming different amounts of whey protein in fixed energy liquid preloads, on subjective appetite sensations, and subsequent energy intake on the same day.
Methods
Two independent studies were performed each using a single-blind, randomised, crossover design. The responses to liquid preloads containing different amounts of whey protein (in exchange of carbohydrate) were assessed and compared with the responses to a control preload (0 energy, 0 protein) used to represent a no-preload condition.
In the first experiment, we investigated the effect of 1675 kJ preloads containing varying amounts of whey protein on subjective appetite ratings and subsequent energy intake in healthy-weight men and women. The second study was designed to investigate if the effects observed in the first study could be replicated when the energy content of the preload was reduced to that comparable to a ‘snack’ that might typically be consumed between meals (1047 kJ). Two of the preloads contained the same absolute amounts of whey protein used in the first study; however, reducing the energy content of the preload resulted in the same amounts of protein representing significantly greater proportions of energy. This experimental design allowed the investigation of a greater range of protein concentrations, and allowed us to compare the effect of absolute protein amounts (g) and protein concentrations (% energy) on satiety.
Subjects
In both studies, subjects were healthy-weight (BMI 19–25 kg/m2) men and women, aged 19–45 years. All were non-smokers, with no history of disease and were not taking any medications other than oral contraceptives. Female subjects were not pregnant or lactating. All subjects reported that they had been weight stable ( ± 3 kg) during the previous 6 months. Subjects were excluded if they scored >7 for restraint in the three-factor eating questionnaire(Reference Stunkard and Messick14) and >10 for The Beck Depression Inventory(Reference Beck, Ward and Mendelson15). Subjects who recorded an average daily intake with >20 % of total energy from protein were excluded due to evidence that habitual high protein intake may be responsible for a reduced satiety response to protein(Reference Long, Jeffcoat and Millward16). The present study was conducted in accordance with the guidelines laid down in the Declaration of Helsinki and the procedures were approved by the University of Nottingham Medical School Ethics Committee. A written informed consent was obtained from all participants before their participation in the study.
Protocol
In each study, subjects were studied on four separate occasions with at least 3 d between each study visit. Female subjects completed trials during days 6–12 of their menstrual cycle. Subjects were advised to refrain from drinking alcohol and undertaking vigorous exercise for 24 h before arrival at the laboratory. Subjects were provided with a menu of foods to consume as their evening meal at approximately 20.00 hours on the day before each study visit. They were instructed that once they had consumed the meal, they were not to consume any other foods or drinks (apart from water) until the next morning. A standardised breakfast was provided for subjects to consume at home at approximately 8.00 hours on the morning of each experiment. Following this, subjects were asked to refrain from eating or drinking (apart from water) until they arrived at the laboratory at approximately 10.45 hours. On arrival, baseline assessments of subjective appetite were collected using computerised visual analogue scales and subjects were provided with one of four liquid preloads, which they had 15 min to consume. In study 2 only, after the subjects had consumed the preloads, they completed taste ratings of the preload using visual analogue scales. Appetite ratings were repeated immediately after the preloads had been consumed, and at 30, 60 and 90 min later. Subjects were then provided with a standard pasta-based test meal ad libitum to consume. They were instructed to eat as much as they wished of the meal, until they felt comfortably full. Following the voluntary termination of the meal, any surplus food was removed by the experimenter, and the subjects completed appetite visual analogue scales immediately and at 30 and 60 min later, and they were then free to leave the laboratory. In addition, in study 2, subjects were asked to record all foods and drinks consumed for the remainder of each visit day in the food diary provided.
Procedures
Screening
Before commencing the trials, all subjects attended a screening visit where they completed a general health questionnaire, the International Physical Activity Questionnaire(Reference Craig, Marshall and Sjöström17), Three Factor Eating Questionnaire(Reference Stunkard and Messick14) and Beck Depression Inventory(Reference Beck, Ward and Mendelson15). Weight (Seca, Hamburg, Germany) and height (Seca, Germany) were measured and subjects were provided with a diary in which to record food intake over a 3 d period (2 week days, 1 weekend day). Training was provided on how to complete the food diary using semi-quantitative household measures. The diary was analysed using dietary analysis software (Microdiet version 1.2; Downlee Systems Limited, Chapel-en-le-Frith, Derbyshire, UK).
Daily energy requirements (DER) were assumed to be equal to total daily energy expenditure (as subjects reported to be weight stable). DER was calculated by multiplying BMR, calculated using the Schofield equation(Reference Schofield18) by a physical activity level, which was estimated using the International Physical Activity Questionnaire(Reference Craig, Marshall and Sjöström17).
Pre-trial standardisation
Subjects were supplied with a menu of foods, on the basis of the foods recorded in the food diary they completed during screening. The meal was designed to provide approximately 30 % of the subject's DER with 16, 36 and 48 % of energy from protein, fat and carbohydrate, respectively. These values were derived from the average UK dietary intakes as reported in the National Diet and Nutrition Survey(Reference Henderson, Gregory and Irving19).
Breakfast
The standardised breakfast consisted of Rice Krispies (Kelloggs, Manchester, UK) and semi-skimmed milk. The cereal:milk ratio was 30 g:125 ml. This meal was equivalent to 10 % of individual DER and the proportion of energy from protein, fat and carbohydrate was 14, 14 and 72 %, respectively.
Preloads
In each study, preloads were three fixed-energy, vanilla-flavoured drinks and a vanilla-flavoured water control. The purpose of using the flavoured water was to represent a no-preload condition so that the percentage compensation at the ad libitum lunchtime test meal for the energy provided by the preload could be calculated.
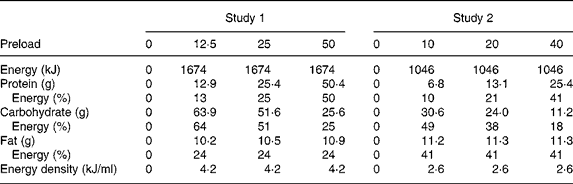
In study 1, preloads were three iso-energetic 1675 kJ drinks containing 12·5, 25 and 50 % of total energy from whey protein, respectively. In study 2, the preloads were three iso-energetic 1047 kJ drinks containing 10, 20 and 40 % of total energy from whey protein, respectively. Flavoured water (0 energy, 0 protein) was used as a control in both the studies. Preload composition is given in Table 1. Preloads were presented to subjects in covered opaque containers and they were ingested through a straw to minimise any visual or olfactory differences between the preloads that may have influenced satiety.
Nutrient composition of preloads
Lunchtime test meal
The lunchtime test meal consisted of pasta (Tesco, Cheshunt, UK), cheddar cheese (Tesco), olive oil (Somerfield, Bristol, UK) and tomato and basil pasta sauce (Masterfoods, Melton Mowbray, UK). The test meal was of a homogeneous nature so that energy intake and macronutrient breakdown could be easily determined by the weight of food consumed (100 g of test meal contained 657 kJ (157 kcal) with 38, 49 and 13 % of total energy provided by fat, carbohydrate and protein, respectively). Subjects were initially supplied with a dish containing approximately 400 g; during the consumption phase, the experimenter added a new portion of food (serving size approximately 250 g) before the dish became empty, and the subject continued to eat. This process was repeated until the subject indicated that they wished to terminate the meal. This ensured that there was always ample hot food available to subjects, and the cue of an empty dish did not prompt meal termination. Subjects could indicate that they had finished eating by using the mouse to click on a button marked ‘Finished’, which was present on a computer screen visible to subjects throughout the meal.
Subjective appetite sensations
Subjective ratings were collected using the Sussex ingestion pattern monitor(Reference Yeomans20), a computer-based system modified from the universal eating monitor for recording subjective appetite sensations(Reference Kissileff, Klingsberg and Van Itallie21). Horizontal line scales were displayed on the monitor with the rating questions presented above the line. The terms ‘Extremely’ and ‘Not at all’ were anchored at either end with the polarity randomised throughout the study. Subjects were instructed to move a vertical bar which appeared in the centre of the line to the desired position using the mouse or cursor keys. Confirmation of the response was made by clicking a button placed in the corner of the screen labelled ‘Done’. All ratings were automatically scored from 0 (not at all) to 500 (extremely) depending on where the subject had placed the marker.
In both studies, appetite was assessed using five questions. The questions were in the form of ‘How (rating) do you feel?’ and the rating was, ‘strong a desire to eat’, ‘full’, ‘hungry’, ‘nauseous’ and ‘thirsty’. Taste properties were in a similar format where questions were ‘How (rating) was the food?’ and the ratings were ‘creamy’, ‘pleasant’, ‘salty’, ‘sweet’ and ‘strong’ (referring to strength of flavour perceived by subjects).
Statistical analysis
Data were analysed using SPSS software (version 14; SPSS, Chicago, IL, USA). All results are presented as means with their standard errors unless otherwise stated. Differences were considered significant at P < 0·05.
ANOVA for repeated measures with preload as within-subject factor and sex as between-subject factor was used to analyse energy intake at the test meal following the four preloads within each study. The intake data from men and women were subsequently analysed separately. If a significant effect of preload was obtained, post hoc analysis was conducted using two-tailed paired t tests with Holm–Bonferroni step-wise correction for multiple comparisons to determine the location of the difference. Energy intake was compared between studies using unpaired t tests.
ANOVA for repeated measures on two factors (preload × time) was used to analyse the differences in visual analogue scale ratings between preload treatments in studies 1 and 2 separately. Preload and test meal responses were analysed separately. If a significant main effect of preload was obtained, post hoc analysis was conducted using two-tailed paired t tests with Holm–Bonferonni step-wise correction for multiple comparisons to determine the location of the difference.
Finally, intake data from studies 1 and 2 were combined and a multiple regression analysis was performed using sex, preload energy and protein content of the preload as factors and energy intake at the test meal-dependent variable.
Results
Subjects
Subject characteristics are displayed in Table 2.
(Mean values and standard deviations)
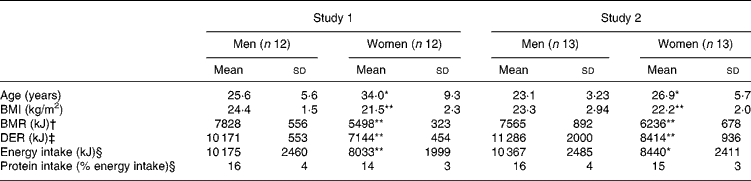
DER, daily energy requirement.
Mean values were significantly different from male subjects (within study): *P < 0·05, **P < 0·01.
† BMR as calculated using the Schofield equations(Reference Schofield18).
‡ DER was calculated by multiplying the BMR with a physical activity level derived from international physical activity questionnaire(Reference Craig, Marshall and Sjöström17).
§ Average energy intake/macronutrient composition estimated from 3 d food diary completed during screening.
Hedonic evaluation of the preloads
Taste ratings of the preloads were measured in study 2 only (1047 kJ preloads).
There was no main effect of sex for taste ratings of the preload (F(1,23) < 1, P = 0·95), indicating that there was no significant difference in the taste ratings between men and women.
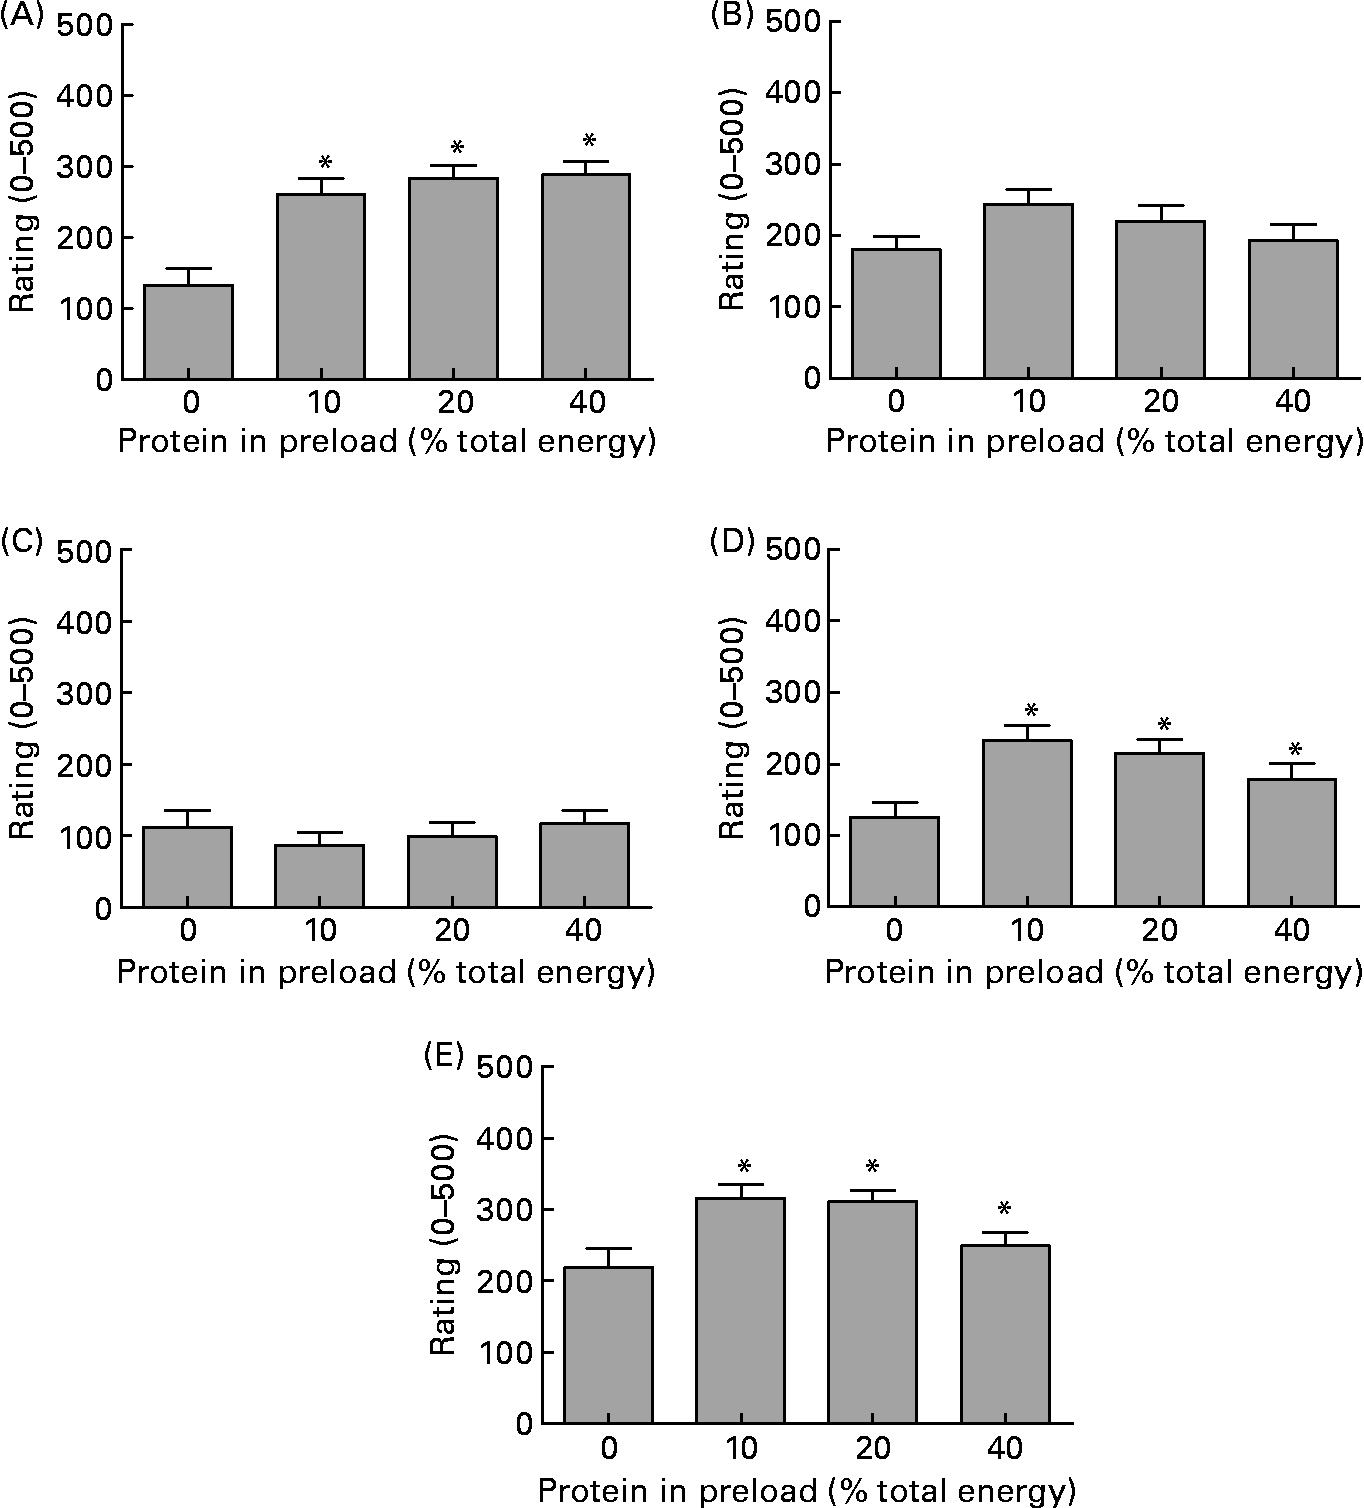
There was a significant effect of preload for ratings of ‘creamy’ (F(3,69) = 11·9, P < 0·01), ‘strong’ (F(3,69) = 9·5, P < 0·01), ‘sweet’ (F(3,69) = 5·5, P = 0·002) and ‘pleasant’ (F(3,69) = 3·7, P = 0·015) ratings (Fig. 1). Creamy ratings showed significant within-subject linear contrast (F(1,23) = 36·2, P < 0·01), with higher protein content of the preload accompanied by an increased ‘creamy’ rating. Post hoc analysis demonstrated that the control preload was rated significantly less creamy than all other preloads (P < 0·01). ‘Strong’ ratings showed a significant within-subject quadratic contrast (F(1,23) = 18·2, P < 0·01). The control preload was rated significantly less strong than each of the protein containing preloads (10, 20 or 40 %) (P < 0·01), but within the protein containing preloads; increasing protein content of the preload was accompanied by a decrease in ‘strong’ rating. ‘Sweet’ ratings showed a significant within-subject quadratic contrast (F(1,23) = 11·5, P = 0·003), with the control preload being rated significantly less sweet than all other preloads (P < 0·05); however, the sweetness rating of the protein containing preloads decreased as the protein content of the preload increased.
Hedonic evaluation of the preloads in study 2 (1046 kJ preloads) containing 10, 20 or 40 % energy from whey protein or a flavoured water control (0 energy, 0 protein). (A) Creamy, (B) pleasant, (C) salty, (D) strong and (E) sweet. Values represent means with their standard errors (n 26) (thirteen men, thirteen women). Repeated-measures ANOVA showed a main effect of preload for creamy ratings (P < 0·01), strong ratings (P < 0·05) and sweet ratings (P < 0·05). * Mean values were significantly different from control preload (P < 0·05).
Subjective appetite ratings in response to the preload
The impact of the preloads on subjective appetite sensations was assessed by analysing the ratings collected before the lunchtime test meal was served. There were no differences in baseline measures between the preload conditions for any of the subjective appetite ratings collected in either study 1 or 2.
In study 1, as expected, ratings of fullness (F(4,92) = 25·16, P < 0·01), hunger (F(4,92) = 21·73, P < 0·01), thirst (F(4,92) = 9·45, P < 0·01), nausea (F(4,92) = 4·43, P = 0·007) and desire to eat (F(4,92) = 23·147, P < 0·01) all displayed a significant main effect of time. Following consumption of the preload hunger and desire to eat ratings decreased, while ratings of fullness and nausea increased; subsequently, ratings gradually returned towards baseline values until the lunchtime test meal was served.
Ratings of hunger displayed a significant main effect of preload (F(3,69) = 3·27, P = 0·05), and desire to eat ratings displayed a significant preload × time interaction (F(12,276) = 2·29, P = 0·03) (Fig. 2).
(A) Computerised visual analogue scales (VAS) appetite ratings of (1) fullness, (2) hunger, (3) desire to eat and (4) hunger, collected in study 1 in response to 1674 kJ preloads containing 12·5 % (–●–), 25 % (–▾–) and 50 % (–■–) of energy from whey protein or a flavoured water control (0 energy, 0 protein) (–♦–). Data are expressed as mean values with their standard errors (n 24) (twelve men and twelve women). (B) Computerised VAS appetite ratings of (1) fullness, (2) hunger, (3) desire to eat and (4) hunger, collected in study 2 in response to 1045 kJ preloads containing 10 % (–○–), 20 % (–▿–) and 40 % (–□–) of energy from whey protein, or a flavoured water control (0 energy, 0 protein) (–⋄–). Data are expressed as mean values with their standard errors (n 26) (thirteen men, thirteen women). In study 1, responses to the preload showed main effect of time for fullness, hunger, nausea, thirst and desire to eat ratings (P < 0·05). There was main effect of preload for ratings of hunger and desire to eat (P < 0·05) and preload × time interaction for desire to eat ratings (P < 0·05). Responses to the test meal using the energy intake at the meal as covariate in the analysis showed main effect of time for ratings of fullness, hunger and desire to eat (P < 0·05). There was a main effect of preload for ratings of hunger, fullness and desire to eat (P < 0·01), and a significant preload × time interaction for ratings of fullness, hunger and desire to eat (P < 0·05). In study 2, responses to the preload showed main effect of time for fullness, hunger, desire to eat and thirst ratings (P < 0·05). There was a main effect of preload for hunger, fullness, desire to eat and thirst ratings (P < 0·05) and preload × time interaction for desire to eat ratings (P < 0·05). Responses to the lunchtime test meal using energy intake at the meal as a covariate in the analysis demonstrated main effect of time for ratings of hunger, fullness and desire to eat ratings (P < 0·01), and there was a significant preload × time interaction for ratings of fullness and hunger (P < 0·05).

Subjective appetite ratings in response to the test meal were analysed using energy intake at the meal as a covariate in the analysis. There was a significant effect of time for ratings of hunger (F(3,383) = 271·66, P < 0·001), fullness (F(3,383) = 220·24, P < 0·001) and desire to eat (F(3,383) = 335·77, P < 0·001). Ratings of hunger and desire to eat were decreased, while ratings of fullness and nausea were increased immediately following the consumption of the lunchtime test meal. There was a significant preload × time interaction for fullness (F(9,383) = 2·95, P = 0·002), desire to eat (F(9,383) = 1·92, P = 0·048) and hunger (F(9,383) = 2·02, P = 0·036) ratings. Ratings of hunger and desire to eat decreased, and ratings of fullness and nausea increased immediately following the consumption of the test meal. Ratings remained elevated or suppressed for the remainder of the protocol.
In study 2, again ratings of hunger (F(4,88) = 33·69, P < 0·001), fullness (F(4,88) = 32·01, P < 0·001), desire to eat (F(4,88) = 15·47, P < 0·001) and thirst (F(4,88) = 19·46, P < 0·001) displayed a significant main effect of time in response to the preload (Fig. 3). Following consumption of the preload hunger and desire to eat ratings decreased, while ratings of fullness and nausea increased; subsequently, ratings gradually returned towards baseline values until the lunchtime test meal was served.
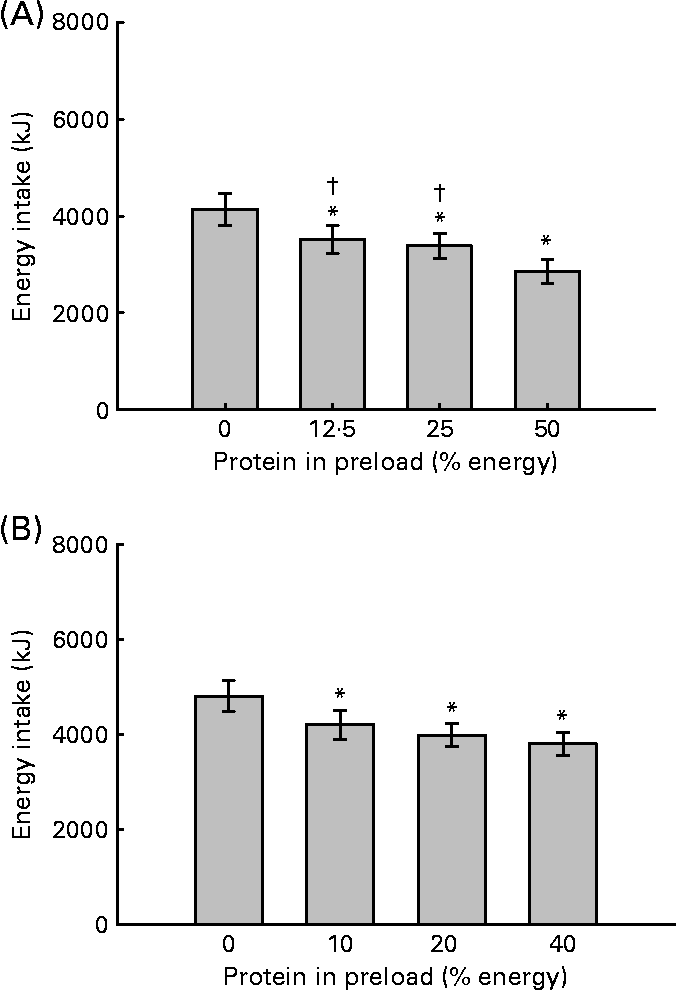
(A) Energy intake at the ad libitum lunchtime test meal in study 1 (1674 kJ preloads). Values represent combined mean values with their standard errors (n 24) (twelve men and twelve women). Energy intake at the test meal showed a main effect of sex (P < 0·01), preload (P < 0·01) and a significant interaction between these factors (P < 0·05). * Mean values were significantly different from control preload (P < 0·05). † Mean values were significantly different from 50 % protein preload (P < 0·05). (B) Energy intake at the ad libitum lunchtime test meal in study 2 (1047 kJ preloads). Values represent combined means with their standard errors (n 26) (thirteen men and thirteen women). Energy intake at the test meal showed a significant main effect of sex (P < 0·01) and preload (P < 0·01), but there was NS interaction between these factors. * Mean values were significantly different from control preload (P < 0·05).
Ratings of fullness (F(3,66) = 4·11, P < 0·01), hunger (F(3,66) = 3·59, P = 0·04), thirst (F(3,66) = 2·99, P = 0·037) and desire to eat (F(3,66) = 5·51, P = 0·002) also displayed a significant main effect of preload.
However, there were no significant differences in the subjective appetite ratings between preload conditions following post hoc analysis and correction for multiple comparisons.
Subjective appetite ratings in response to the test meal were analysed using energy intake at the test meal as a covariate in the analysis. There was a significant effect of time for ratings of hunger (F(3,396) = 397·41, P < 0·001), fullness (F(3,396) = 359·1, P < 0·001) and desire to eat (F(3,396) = 631·26, P < 0·001). There was a significant protein × time interaction for ratings of hunger (F(3,396) = 9·40, P = 0·029) and fullness (F(9,396) = 1·977, P = 0·041). However, following post hoc analysis and corrections for multiple comparisons, there were no significant differences in the subjective appetite ratings between preload conditions in response to the lunchtime test meal when energy intake at the meal was used as covariate in the analysis.
Energy intake at the test meal
Although there was no significant difference in the energy intake at the lunchtime test meal following the control preload between the studies (4136 (sem 337) v. 4801 (sem 325) kJ in studies 1 and study 2, respectively, P = 0·16), combined mean energy intake following the protein containing preloads was lower in study 1 compared with study 2 (3249 (sem 157) v. 3997 (sem 155) kJ in studies 1 and 2, respectively, P < 0·001).
There was a significant effect of preload on energy intake at the test meal in both study 1 (F(1,23) = 15·1, P < 0·001) and study 2 (F(3,72) = 13·337, P < 0·001) (Fig. 4). In both studies, increasing the protein content of the preload was accompanied by a step-wise reduction in ad libitum energy intake at the test meal, and there was a significant within-subject linear contrast in both study 1 (F(1,23) = 31·0, P < 0·001) and study 2 (F(1,24) = 30·42, P < 0·001). Post hoc analysis indicated that in study 1, energy intake at the test meal following control preload was higher than following each of the 12·5, 25 and 50 % protein preloads (P < 0·01). Energy intake following the 12·5 % protein preload was higher than both the 25 and 50 % protein preloads (P < 0·01). In study 2, energy intake at the test meal was higher following the control preload compared with each of the 10, 20 and 40 % protein preloads, respectively (P < 0·01), but there were no differences in energy intake between the energy containing preloads (10, 20 or 40 % protein). The reduction in energy intake at the test meal, represented as the percentage compensation of the energy provided by the preload, relative to the control preload was 37 (sem 8), 45 (sem 13) and 77 (sem 14) % for the 1645 kJ preloads containing 12·5, 25 and 50 % protein, and 57 (sem 15), 78 (sem 15) and 96 (sem 15) % for the 1045 kJ preloads containing 10, 20 and 40 % protein.
(A) Energy intake at the ad libitum lunchtime test meal in study 1 (1674 kJ preloads). Values represent means with their standard errors for men (■ n 12) and women ( n 12). Energy intake at the test meal showed a significant main effect of preload in men (P < 0·05) and women (P < 0·05). * Mean values were significantly different from control preload within sex (P < 0·05). † Mean values were significantly different from 50 % preload within sex (P < 0·05). (B) Energy intake at the ad libitum lunchtime test meal in study 2 (1047 kJ preloads). Values represent means with their standard errors for men (■ n 13) and women (n 13). Energy intake at the test meal showed a significant main effect of preload in men (P < 0·05) and women (P < 0·05). * Mean values were significantly different from control preload within sex (P < 0·05).
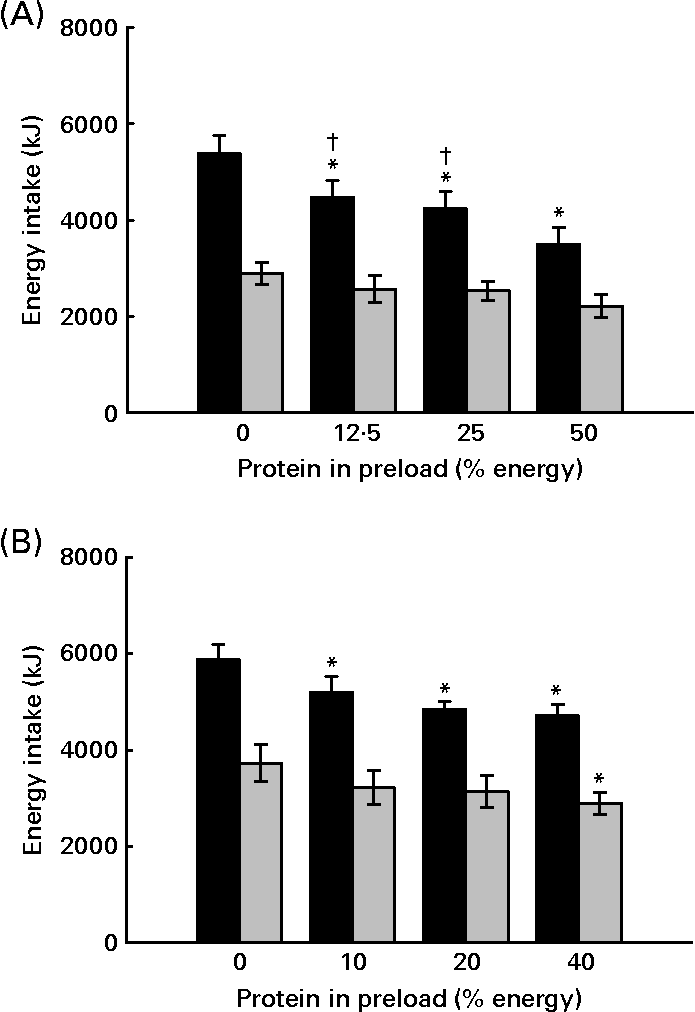
There was a significant effect of sex for ad libitum energy intake at the lunchtime test meal in both study 1 (F(1,22) = 338·45, P < 0·001) and study 2 (F(1,24) = 25·772, P < 0·001). However, in study 1, there was also a significant sex × preload interaction for energy intake at the test meal (F(3,66) = 4·78, P < 0·01). In both studies, overall energy intake in male subjects was greater than that of female subjects (mean difference for study 1: 1845 (sem 378) kJ, P < 0·01 and study 2: 1912 (sem 377) kJ, P < 0·01).
In study 1, both the men (F(3,33) = 16·48, P < 0·001) and the women (F(3,33) = 4·882, P = 0·006) displayed a significant main effect of preload, and there was a significant within-subject linear contrast for both the men (F(1,11) = 39·26, P < 0·001) and the women (F(1,11) = 7·29, P = 0·021). Increasing the protein content of the preload was accompanied by a step-wise reduction in energy intake at the test meal. Post hoc analysis demonstrated that intake following the control preload was higher than following each of the 12·5, 25 and 50 % preloads (P < 0·01), and intake following the 12·5 % preload was higher than intake following the 50 % preload in the men (P < 0·05); however, there were no significant differences in energy intake between preload conditions in the women (Fig. 4). Similarly, in study 2, both men (F(3,36) = 7·2, P = 0·001) and women (F(3,36) = 6·5, P = 0·001) showed a significant main effect of preload. There was a significant within-subject linear contrast for both the men (F(1,12) = 16·9, P = 0·001) and the women (F(1,12) = 13·8, P = 0·003). Again, increasing the amount of protein in the preload was accompanied by a step-wise reduction in energy intake at the test meal in both sexes. In the men, energy intake following the control preload was higher than each of the 20 and 40 % protein preloads (P < 0·01), and in the women, intake following the control preload was higher than following the 40 % preload only (P < 0·01) (Fig. 4).
Test day food diary analysis
Self-reported energy intake during the remainder of the test day in study 2 was not significantly different between trials (3999 (sem 499), 3679 (sem 327), 3890 (sem 321) and 3887 (sem 294) kJ in 0, 10, 20 and 40 % protein preloads, respectively, F(3,69) = 0·77, NS). However, the amount of protein in the preload did affect the macronutrient composition of foods and drinks consumed during the remainder of the day.
There was a main effect of preload for protein intake during the remainder of the day (F(3,69) = 3·62, P = 0·017), and there was a significant within-subjects linear contrast (F(1,23) = 13·0, P = 0·001). An increase in the amount of protein in the preload was accompanied by an increase in the proportion of energy consumed from protein during the remainder of the day (12·6 (sem 1·2), 12·8 (sem 1·1), 13·4 (sem 1·4) and 17·7 (sem 1·4) % energy from protein during the remainder of the day in 0, 10, 20 and 40 % protein preloads, respectively). Protein intake after the 40 % preload trial was higher than following the control preload trial (P = 0·007). There were no significant differences in the proportion of energy derived from either carbohydrate or fat during the remainder of the day.
When total daily energy intake was calculated (by adding all laboratory components to the self-reported intakes), energy intake was not different between preload conditions (10 001 (sem 604), 10 110 (sem 523), 10 103 (sem 436) and 9896 (sem 432) kJ in 0, 10, 20 and 40 % protein preloads respectively, F(3,72) = 0·31, NS). The proportion of total energy intake derived from protein showed a main effect of preload F(3,72) = 27·14, P < 0·001), and there was a significant within-subject linear contrast (F(1,24) = 60·20, P < 0·001). Increasing the protein content of the preload was accompanied by a step-wise increase in the proportion of energy derived from protein over the test day (13·4 (sem 0·4), 13·6 (sem 0·4), 15·0 (sem 0·5) and 18·2 (sem 0·4) % total energy intake over test day from protein in 0, 10, 20 and 40 % protein preload conditions, respectively). Protein intake was higher in the 40 % protein preload condition compared with the control preload, 10 and 20 % (P = 0·006) protein preloads. There was no effect of preload on total daily intake of carbohydrate or fat.
Multiple regression analysis
In order to investigate the relationship between the amount of protein in the preload and ad libitum energy intake at the lunchtime test meal, data on ad libitum intake at the lunchtime test meal in response to the protein-containing preloads from both studies (control preload removed) were combined and a multivariate regression analysis was conducted.
Sex of the subject, the absolute amount of protein in the preload (g) and energy content of the preload were used as factors in the analysis. Sex of the subject had the greatest effect on intake at the ad libitum test meal; energy content of the preload and the amount of protein in the preload (g) were also significant factors (combined adjusted r 2 0·54, P < 0·01). Thus, these variables were able to account for 54 % of the variance in ad libitum intake (regression F(3,148) = 56·6, P < 0·001). Coefficients for the variables are displayed in Table 3.
Coefficients of the regression model which combines the two studies to determine the predictors of ad libitum energy intake at the lunchtime test meal*
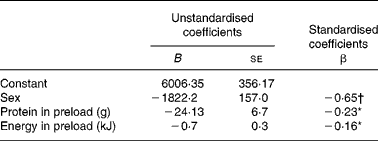
* r 2 0·54.
† P < 0·01 (male = 0, female = 1).
Discussion
The aim of the present study was to investigate the effects of consuming different doses of whey protein in fixed energy liquid preloads used to represent mid-morning snacks. A mid-morning between-meal snack consumed at approximately 11.00 hours may be followed by a lunchtime meal at approximately 12.30 hours; therefore, the interval between preload and test meal was set at 90 min. Subjective appetite sensations and subsequent energy intake following protein containing preloads were compared with the responses to a control preload (0 energy and 0 protein) used to represent a no-snack condition.
Energy intake at a lunchtime test meal was reduced after subjects consumed energy-containing mixed macronutrient preloads (either 1675 or 1047 kJ) as between-meal mid-morning snacks compared with the control preload (0 energy, 0 protein). Increasing the protein content of the preload was accompanied by a reduction in energy intake at the test meal in both studies. However, when the responses to preloads containing similar absolute amounts of protein were compared (i.e. 12·5 % 1645 kJ preload v. 20 % 1047 kJ preload and 25 % 1645 kJ preload v. 40 % 1047 kJ preload), compensation for the 1047 kJ preloads at the lunchtime test meal was approximately twice that observed for the 1645 kJ preloads that contained the same absolute amount of protein.
Assessing the independent effects of macronutrient manipulations is difficult while attempting to control all factors that have been reported to affect satiety, such as the energy content, weight, volume, energy density and sensory and hedonic properties of a food or drink(Reference Stubbs, Ferres and Horgan22–Reference Rolls, Rowe and Rolls25). This protocol was designed to minimise the effects of energy, volume and energy density of the protein-containing preloads, by matching preloads for energy and volume. Furthermore, replacing the protein energy with carbohydrate ensured all energy-containing preloads had similar energy densities. However, exchanging protein for carbohydrate meant that an increase in the amount of protein in the preload was accompanied by a reduction in carbohydrate. We cannot rule out that this difference in the carbohydrate content of the preloads may have contributed to the observed findings without purposefully manipulating the carbohydrate content of the preloads for comparison.
We aimed to minimise the sensory differences between the preloads by using equal amounts of an artificial flavouring in each preload, and sensory exposure was minimised by presenting the preloads to subjects in opaque covered containers, and asking them to consume it through a straw. Despite our intentions, it is likely that differences in the macronutrient composition of the preloads influenced the sensory ratings(Reference Kirkmeyer and Mattes26, Reference Yeomans, Lee and Gray27). Nevertheless, the independent contribution that the sensory properties of a food impart upon satiety are unclear; thus, it is unclear from the present data whether the differences observed in the sensory ratings of the preloads contribute to the differences in appetite and energy intake.
In study 1 (1675 kJ preloads), men and women responded differently to preloads with increasing whey protein content. Although both men and women demonstrated that increasing the whey protein content of the preload reduced ad libitum intake at the test meal in a step-wise manner, in the men, the energy intake following the highest protein preload (50 % total energy) resulted in a reduction of approximately 1886 kJ (i.e. 112 % compensation). By contrast, in women, the same high-protein preload was accompanied by a non-significant compensation of less than 50 % of the preload energy.
In study 2, again both sexes displayed a greater accuracy in compensation at the lunchtime test meal for the energy provided by the preload. However, in the present study, energy intake following the highest protein preload (40 % energy) in the men was accompanied by a reduction in energy intake of approximately 1163 kJ (i.e. 111 % compensation), while the same high-protein preload was accompanied by a reduction in intake of only 838 kJ (80 % compensation) in the women. This observation that the male subjects demonstrated greater compensatory responses to increased protein compared with the female subjects confirms the findings of previous studies that suggest that men can demonstrate a more precise compensatory response to energy-containing preloads than women(Reference Davy, Van Walleghen and Orr28, Reference Rolls, Dimeo and Shide29). The much smaller response in the women may have been due to differences in appetite-regulatory systems between men and women(Reference Lovejoy and Sainsbury30) or may be explained by the fact that the energy content of the preloads provided a significantly greater proportion of the DER of the women compared with the men, which may have overpowered any effect of protein content.
In order to investigate the effects of sex, preload energy and the protein content of the preload, data from both studies were combined and a multivariate analysis was conducted. Sex of the subject was the greatest influence on energy intake; however, when subject sex and energy of the preload are held constant, the model estimated that for each 1 g increase in whey protein content of the preload, intake at the test meal would be reduced by 24 kJ. This supports the previous work that suggested that the reduction in subsequent energy intake caused by protein consumption is greater than the energy provided by protein in the high protein food(Reference Stubbs, Ferres and Horgan22, Reference de Castro31).
In the second study, we estimated subsequent voluntary food intake after the subjects had left the laboratory, and thus determined total daily energy intake. However, there was no significant difference between total daily energy intake when a 1047 kJ liquid preload of mixed composition was consumed as a between-meal mid-morning ‘snack’ compared with when a control preload (which represented a no snack condition) was consumed. This suggests that consuming mixed macronutrient snacks containing between 10 and 40 % energy from whey protein may not result in higher total energy intake as is popularly believed(Reference Berteus Forslund, Torgerson and Sjöström32, Reference Hampl, Heaton and Taylor33), as compensation is achieved by reducing the energy intake at the subsequent meal. It is possible that consuming a snack containing whey protein may help achieve compensation for the energy provided by the snack at a subsequent meal. However, further consideration should be given to the overall impact on the diet of consuming snacks which aim to ultimately replace some of the energy that would otherwise be provided as meals.
Despite observing no significant differences in subjective appetite ratings between preload conditions, whey protein may affect the release of several gut peptides including increases in postprandial cholecystokinin(Reference Hall, Millward and Long9, Reference Bowen, Manny and Craige10, Reference Burton-Freeman34), glucagon-like peptide 1(Reference Bowen, Noakes and Clifton11, Reference Blom, Anne and Annette35, Reference Tannous dit El Khoury, Omar and Sami36) and peptide YY(Reference Batterham, Heffron and Kapoor37), along with some evidence to suggest that protein may enhance the suppression of ghrelin(Reference Bowen, Noakes and Clifton11, Reference Blom, Anne and Annette35, Reference Foster-Schubert, Overduin and Prudom38), although the evidence for the latter is inconsistent(Reference Lejeune, Westerterp and Adam39, Reference Cummings40). The present experimental protocol did not allow for the investigation of possible mechanisms of whey protein on satiety, although it is possible that relatively small changes in these physiological parameters, instigated by differences in macronutrient composition of the preloads, could alter energy intake without affecting the subjective appetite sensations. Future studies should be conducted to determine the mechanisms involved in the enhanced satiety observed for different doses of whey protein.
Although significant differences between protein doses were only observed by comparing high concentrations with the control, the responses to increasing the amount of protein in the preload on subsequent energy intake appear to be cumulative. This conflicts with previous studies that have suggested that there may be a no additional effect on subsequent energy intake of consuming doses of protein above a critical threshold(Reference Veldhorst, Nieuwenhuizen and Hochstenbach-Waelen13), and that high doses of protein (approximately 50 % energy) may be required to achieve these effects(Reference Poppitt, McCormack and Buffenstein2). Furthermore, because it is unclear whether these responses are specific to whey protein, the dose–response relationships to proteins from other sources require further investigation.
Acknowledgements
This work was supported by a BBSRC CASE studentship for N. M. A. with Mars, UK as industrial partners. The authors thank all subjects who took part in the studies. All authors were involved in designing the experimental protocol. N. M. A. and E. J. S. collected and analysed the data and prepared initial copies of the manuscript. M. A. T. and I. A. M. supervised the data collection and analysis and reviewed the initial manuscript. P. M. contributed to the interpretation of the data. E. J. S. was employed by University of Nottingham as part of a project funded by Mars, UK. P. M. is an employee of Mars, UK. M. A. T. and I. A. M. gained funding for the project from Mars, UK. I. A. M. is a paid consultant for the Mars Europe Nutrition Advisory Board.



