Dietary guidelines are instruments through which countries establish recommendations for healthy eating and are aimed at promoting autonomy of healthy food choices by individuals and communities( 1 ). In addition to their applicability in health communication, dietary guidelines also aim to support public policies to promote adequate and healthy diets in different sectors of government, including health, education, industry and agriculture( 1 , 2 ).
The construction of the second edition of the Dietary Guidelines for the Brazilian Population (called the ‘Guide’ hereafter) published by the Brazilian Ministry of Health in 2014 was based on an expanded paradigm of diet and its relationship with health( 3 ). Beyond the biological dimension, this document also includes cultural, social and environmental aspects as determinants of an adequate and healthy diet( Reference Monteiro, Cannon and Moubarac 4 ). In addition, its recommendations are based on the logic of foods and food groups rather than isolated nutrients; this approach is considered more appropriate for understanding the relationship between diet and current epidemiological scenarios( Reference Monteiro, Cannon and Moubarac 4 , Reference Jacobs and Tapsell 5 ). The adoption of systemic perspectives in dietary guidelines has also been observed recently in other countries, including Germany, Qatar and Sweden( Reference Fischer and Garnett 6 ).
An innovative aspect of the Guide is the incorporation of the food processing perspective( Reference Oliveira, da and Silva-Amparo 7 ). The main recommendations were based on the NOVA groups; NOVA is a classification system that groups foods according to the nature, extent and purpose of the processing to which they have been subjected( Reference Monteiro, Cannon and Moubarac 8 ). The adoption of NOVA was motivated by population-based studies conducted over the last decade that evidenced the growing tendency for consumption of ultra-processed foods by the Brazilian population( Reference Levy, Claro and Mondini 9 , Reference Martins, Levy and Claro 10 ) and the negative impact of these foods on the nutritional quality of the diet and health outcomes( Reference Canella, Levy and Martins 11 – Reference Louzada, da, Baraldi and Steele 14 ).
Unlike commonly adopted dietary guideline approaches( Reference Fischer and Garnett 6 ), the Guide recommendations are not presented in terms of the frequency or number of food portions but instead use terms such as ‘prefer’, ‘avoid’ and ‘always when possible’. In addition, illustrations of healthy meal options based on the diet of one-fifth of the Brazilian population with the lowest share of ultra-processed foods according to data from a national survey are shown( Reference Monteiro, Cannon and Moubarac 4 , 15 ). These characteristics are intended to facilitate dialogue with the population, public managers and health professionals (other than nutritionists).
With a view towards implementing dietary guidelines, the FAO recommends that countries develop strategies to disseminate their messages( 1 ). However, the diversity of formats and approaches adopted in these documents imply that there is no universal recommendation for their implementation and that this process should be defined by each country according to its local reality. Additionally, countries should institute mechanisms for monitoring and evaluating both the implementation process and the impact of these instruments on food practices of their populations; this step has been reinforced in technical documents from the FAO( 1 , 2 , 16 ).
Although innovative, the expanded approach to healthy eating proposed by the Guide presents a challenge for the evaluation of its impact on the Brazilian population. Unlike the recommendations of its first edition, which were based on portions of food groups and therefore evaluable through traditional food consumption tools such as 24 h recall, as conducted in a study by Verly et al. ( Reference Verly Junior, de Carvalho and Fisberg 17 ), the challenge of the new edition lies in the selection and use of appropriate tools in line with the content of its recommendations. Because the importance of using validated tools for the evaluation of dietary guidelines is recognized( Reference Andrade and Andrade 18 ), the present study aimed to develop and test the validity and reliability a scale for measuring healthy eating practices according to the recommendations of the current Brazilian food-based dietary guidelines.
Materials and methods
The current study is a methodological study based on knowledge of psychometry, which is a science that studies the measurement of non-directly observable phenomena (i.e. psychological phenomena) that can be characterized using a set of other attributes( Reference DeVellis 19 ). This feature can be useful for the construction of instruments for diet measurement in relation to the adoption of paradigms that consider diet a result of complex relationships among different determinants. A self-administered scale is proposed for the Brazilian adult population (18–60 years old).
The adopted route is composed of three phases, which are described below.
Phase 1: Structuring the theoretical basis of the scale and elaboration of the items
The Guide is systematized into a document with five chapters. The first chapter presents the principles that guide its elaboration. The following chapters present recommendations for food choices (Chapter 2), how to combine foods in the form of meals (Chapter 3) and modes of eating (Chapter 4). The last chapter exposes possible obstacles to adherence to the recommendations and suggests ways to overcome them( 3 ). Because they deal specifically with recommendations, Chapters 2, 3 and 4 of the Guide were selected to compose the domain content of the scale. Following systematic reading of the three selected chapters, all of their recommendations were extracted regardless of whether they were made explicit in the form of sentences or illustrations.
Based on these recommendations, a pool of sentences (items) illustrating eating practices either in line with or in opposition to the Guide contents was created. For these items, the respondents indicated whether they were represented in their daily eating practices through a 4-point Likert scale (‘strongly agree’, ‘agree’, ‘disagree’, ‘strongly disagree’). An even number of response options was adopted with the purpose of avoiding not only the central tendency bias but also a possible variability in the participants’ interpretations of a midpoint in Likert scales (such as ‘no opinion’, ‘unsure’ or ‘neutral’)( Reference Nadler, Weston and Voyles 20 ). Therefore, the respondents were encouraged to analyse the sentence with greater care and then decide on a positive or negative stance( Reference DeVellis 19 ).
Phase 2: Validity tests
Content validity
This step aimed to identify whether the items adequately contemplated the contents of the scale domain( Reference Streiner, Norman and Cairney 21 ). Ten experts in the field of nutritional epidemiology and/or food consumption were invited to participate in a panel. Researchers affiliated with educational institutions (public universities across the country) who had recent scientific publications related to the Guide’s content at the time of panel selection, as well as public managers who participated in the Guide’s elaboration process, identified in a name list published within the Guide, were selected( Reference Pasquali 22 , Reference Rubio, Berg-Weger and Tebb 23 ).
Through an electronic form, the judges assigned a score from 1 to 4 for the clarity, relevance and pertinence of each item. From the answers obtained, the content validity index of the items (CVIi) was calculated based on the averages between the percentages of scores 3 and 4 for each of its three attributes, and the total CVI (CVIt) was obtained from the mean of the CVI values of the items. A CVI>0·8 was considered adequate( Reference Rubio, Berg-Weger and Tebb 23 ). During the panel, the judges were also able to comment on each item or suggest the inclusion of new items in open fields intended for that purpose.
Face validity
This step aimed to assess whether the instrument was adequate and understandable for its target audience( Reference Streiner, Norman and Cairney 21 ). The instrument was pre-tested with twenty adult users of a public primary health care (PHC) service located in the city of São Paulo, SP, Brazil, because this type of service in Brazil attends a wider and heterogenic audience( Reference Guibu, de Moraes and Junior 24 ). Individuals were selected through a purposive approach( Reference Ritchie, Lewis and Elam 25 ) in order to guarantee the representativeness of people from different educational levels and age groups. The application of the instrument was followed by a brief interview with each individual to verify his/her level of understanding about the instrument.
Construct validity
This step aimed to identify the structural components of the construct ‘healthy eating practices according to the Guide’ and the extent to which the set of items was correlated with these components( Reference DeVellis 19 , Reference Streiner, Norman and Cairney 21 , Reference Nunally and Bernstein 26 ). Based on the theoretical basis (delimited in phase 1), construct validity was performed through factor analysis in two steps: exploratory factor analysis (EFA) and confirmatory factor analysis (CFA). R-Studio software version 3.4.3 was used to analyse the data( Reference Core Team 27 ).
Exploratory step
An EFA was used to identify the possible dimensions underlying the data (latent variables) and to reduce the number of items( Reference Streiner, Norman and Cairney 21 , Reference Hair, Black and Babin 28 , Reference Brown 29 ). The data were collected from a convenience sample of users of two PHC services of São Paulo, SP, Brazil. People were invited by an interviewer to respond to the scale during their time in the PHC service waiting room. The recruitment aimed to achieve similar proportions of gender and age groups. An estimated sample size of 350 was calculated based on at least five to ten observations per variable( Reference Nunally and Bernstein 26 , Reference Hair, Black and Babin 28 ). The adequacy of the sample was tested using the Kaiser–Meyer–Olkin (KMO) indicator (range 0 to 1, values >0·5 were considered acceptable) and Bartlett’s sphericity test (P<0·05 was considered acceptable)( Reference Hair, Black and Babin 28 , Reference Field 30 ). To determine the number of factors to be extracted, the Kaiser–Guttman criterion (eigenvalue >1·00) was adopted. To support the decision regarding the number of factors to be maintained after extraction and interpretation, the theoretical and practical plausibility of the obtained results were considered( Reference Hair, Black and Babin 28 , Reference Brown 29 ).
The EFA was executed through the R package ‘Psych’(
Reference Revelle
31
). A polychoric correlation matrix was created that was suitable for ordinal categorical variables, such as Likert scales(
Reference Brown
29
,
Reference Holgado-Tello, Moscoso and Barbero-Garcia
32
). The factors were extracted using the principal axis as a factor method and rotation of the OBLIMIN type. Items with non-significant factor loadings (less than $\left| {0\!\cdot\!4} \right|$
) and those with significant loadings for more than one factor (cross-loading) were excluded(
Reference Nunally and Bernstein
26
). The item analysis and exclusion processes were repeated successively until a stable factorial structure was obtained (i.e. all items had factorial loads greater than
$\left| {0\!\cdot\!4} \right|$
) and those with significant loadings for more than one factor (cross-loading) were excluded(
Reference Nunally and Bernstein
26
). The item analysis and exclusion processes were repeated successively until a stable factorial structure was obtained (i.e. all items had factorial loads greater than $\left| {0\!\cdot\!4} \right|$
in only one factor). The generated solutions were analysed from the theoretical significance perspective, which supported determination of the best model.
$\left| {0\!\cdot\!4} \right|$
in only one factor). The generated solutions were analysed from the theoretical significance perspective, which supported determination of the best model.
Confirmatory step
CFA was used to test the hypothesis that the predefined model was adequate to measure the construct in question, in this case the healthy eating practices according to the Guide recommendations. The sample consisted of 900 (more than ten observations per variable, thus a sufficiently large sample size) adults living in the Brazilian territory. The data collection was performed using an online platform by a company specialized in Internet research that has a panel of more than 500 000 respondents from all five Brazilian macro-regions with different socio-economic statuses and age groups. The questionnaire was programmed on the company’s platform by the researchers, and the recruitment was randomly performed from the panel of respondents. Internal controls were used to guarantee the data consistency (we excluded answers that were provided quicker than the time necessary for 95 % of the respondents to complete the questionnaire and those in which the respondents did not meet the age criteria).
The CFA was executed through the R package lavaan( Reference Rosseel 33 ). The diagonally weighted least-squares estimator was used, which is appropriate for categorical variables( Reference Brown 29 , Reference Li 34 ). The evaluation of model quality was based on the following aspects suggested by Brown( Reference Brown 29 ): (i) inspection of the goodness-of-fit indices; (ii) the presence of tension points, which were evaluated using the modification indices (MI) in the present study; and (iii) the interpretability and statistical significance of the factor loadings. The following goodness-of-fit indicators were considered: root-mean-square error of approximation (RMSEA); standardized root-mean-square residual (SRMR); comparative fit index (CFI); and Tucker–Lewis index (TLI). The RMSEA was evaluated according to the criteria of Browne and Cudeck( Reference Browne and Cudeck 35 ), in which values ≤0·08 indicated an adequate fit, values between 0·08 and 0·10 indicated a mediocre fit and values >0·10 indicated a poor fit. For the CFI, TLI and SRMR analyses, the following cut-off points were used: CFI≥0·95; TLI≥0·90; and SRMR<0·80( Reference Hu and Bentler 36 ).
Total information curves were generated for the full scale and its subscales. These curves indicate the precision with which the scale and its subscales is able to discriminate between individuals as a function of the score distribution (in the Z-score scale)( Reference Barros, Swardfager and Moreno 37 ).
Phase 3: Reliability tests
The reliability of the instrument was evaluated based on two aspects: internal consistency and reproducibility.
For the internal consistency evaluation, Cronbach’s α coefficients were calculated for the scale and its four subscales. Because the interpretability of Cronbach’s α can be restricted in multidimensional scales, McDonald’s ω was also calculated for the total scale since it is considered a reliability index with a lower risk of over- or underestimation of reliability in these cases( Reference Reise 38 – Reference Dunn, Baguley and Brunsden 40 ). For both measures, values equal to or greater than 0·7 were considered satisfactory( Reference Nunally and Bernstein 26 ).
A random sub-sample was obtained from individuals who participated in the confirmatory step of construct validation and responded again to the scale 30 d after the first data collection. The intraclass correlation coefficient (ICC; single-measurement, absolute agreement, two-way mixed-effect model) was calculated to assess test–retest reliability both for the total score and for each single item. ICC values less than 0·4 were interpreted as poor reliability; 0·4 to 0·75 as fair to good; and greater than 0·75 as excellent( Reference Fleiss and Cohen 41 , Reference Koo and Li 42 ). The Bland–Altman plot was used to test the absence of systematic errors between the total score of the two time point measures( Reference Giavarina 43 ).
Results
When structuring the theoretical basis and elaboration of the items, fifty-one recommendations were identified between Chapters 2, 3 and 4 of the Guide. From these recommendations, ninety-six items were formulated. During the content validity step, twenty-three redundant items were excluded and a new item was added (resulting in a subtotal of seventy-four items); additionally, the wording of fifty-five other items was changed. The CVIt was 0·93. In the face validity step, two redundant items were excluded (new subtotal of seventy-two items) and fifteen items were changed. The fifty-one recommendations and the set of seventy-two items kept after these steps can be consulted in the online supplementary material.
Table 1 presents the sociodemographic characteristics of the participants of the exploratory (n 352) and confirmatory (ninety-three responses were unconsidered; n 900) construct validity steps. The average age and the proportion of women were slightly higher in the exploratory step than in the confirmatory step. The samples were also different in terms of region of origin. Both steps had a higher concentration of individuals from the Southeast region of the country, followed by the Northeast region. However, there were more individuals from other regions of the country in the confirmatory step.
Sociodemographic characteristics of the adults aged 18–60 years who participated in the construct validity assessment, according to step (exploratory or confirmatory), of the scale for measuring healthy eating practices according to the Dietary Guidelines for the Brazilian Population recommendations
* From χ 2 test.
† From Student’s t test.
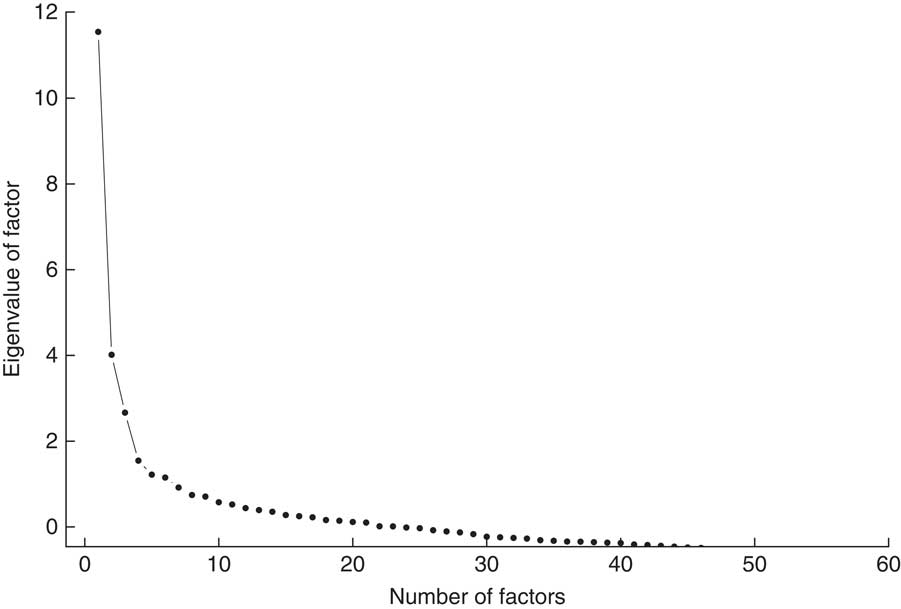
In the EFA, the tests confirmed the sampling adequacy (KMO=0·63; Bartlett sphericity test, P<0·05). Six factors with eigenvalues >1·00 (Fig. 1) were identified. The results of the EFA with extraction of six factors did not present theoretical plausibility. Therefore, analyses were also conducted with extractions of five and four factors for comparison and to choose the best model. The four-factor model was chosen, because it had the most theoretical practical significance. This solution kept thirty-four of the seventy-two initial items and explained 41 % of the variance in the data set (excluded items are highlighted in the online supplementary material).
Number of factors with eigenvalue >1·00 in the exploratory factor analysis of the scale for measuring healthy eating practices according to the Dietary Guidelines for the Brazilian Population recommendations
The extracted factors were interpreted based on the items that composed them and the recommendations of the Guide from which they were derived. From this interpretation, the factors were understood as dimensions of the Guide; names were given and brief descriptions of the hypothetical construct measured by each factor were developed (Table 2).
Factors obtained in the exploratory factor analysis of the scale for measuring healthy eating practices according to the Dietary Guidelines for the Brazilian Population recommendations and the respective measured dimensions according to the interpretation of their item set
* The short name has been used throughout the text for simplification.
We observed that the Choices dimension grouped items which were derived almost exclusively from the recommendations of the second chapter of the Guide (Choosing foods), which justifies its name. The Modes and Organization dimensions mostly retained items related to the fourth chapter of the Guide (Modes of eating), whereas Planning was formed by a combination of items from the three chapters that comprised the scale domain.
In the CFA, the initial model derived from the EFA returned some empty cells in the bivariate table of correlation matrix. This result indicated perfect correlations between two variables and thus an inadmissible factor solution. To make the model admissible, nine items were excluded.
The model generated after the exclusion of these items had unsatisfactory goodness-of-fit indices: $\chi _{{(269)}}^{2} $
=2954·180, P<0·001; RMSEA=0·105 (90 % CI 0·102, 0·109); CFI=0·879; TLI=0·866; SRMR=0·095. In this model, one item of the Organization dimension presented a non-significant factor loading (0·16). Exclusion of this item improved the goodness-of-fit indices (
$\chi _{{(269)}}^{2} $
=2954·180, P<0·001; RMSEA=0·105 (90 % CI 0·102, 0·109); CFI=0·879; TLI=0·866; SRMR=0·095. In this model, one item of the Organization dimension presented a non-significant factor loading (0·16). Exclusion of this item improved the goodness-of-fit indices ( $\chi _{{(264)}}^{2} $
=2349·072, P<0·001; RMSEA=0·103 (90 % CI 0·099, 0·107), P<0·001; CFI=0·893; TLI=0·879; SRMR=0·091).
$\chi _{{(264)}}^{2} $
=2349·072, P<0·001; RMSEA=0·103 (90 % CI 0·099, 0·107), P<0·001; CFI=0·893; TLI=0·879; SRMR=0·091).
The MI inspection of this new model indicated that two of the items of the Modes dimension were also correlated with other factors (cross-loading). Supported by the theory, an item related to ‘eating at the table’ (item 13) was also attributed to the Organization dimension (MI=562·93), and another item related to ‘eating slowly’ (item 9) was also attributed to the Planning dimension (MI=449·8), in which higher factor loadings were obtained. The goodness-of-fit indices of the final model indicated good fits: $\chi _{{(222)}}^{2} $
=1326·37; P<0·001; RMSEA=0·074 (90 % CI 0·071, 0·078), P<0·001; CFI=0·944; TLI=0·937; SRMR=0·067. This final set of items is shown in Table 3 both in Portuguese (original language) and English.
$\chi _{{(222)}}^{2} $
=1326·37; P<0·001; RMSEA=0·074 (90 % CI 0·071, 0·078), P<0·001; CFI=0·944; TLI=0·937; SRMR=0·067. This final set of items is shown in Table 3 both in Portuguese (original language) and English.
Final set of twenty-four items in both the Portuguese (original language) and English (translated)Footnote * scale for measuring healthy eating practices according to the Dietary Guidelines for the Brazilian Population recommendations and intraclass correlation coefficient (ICC) for each item and for the total score
* The translation of the items was made by two independent translators. A third translator resolved the discrepancies between them in order to achieve the better conceptual equivalence.
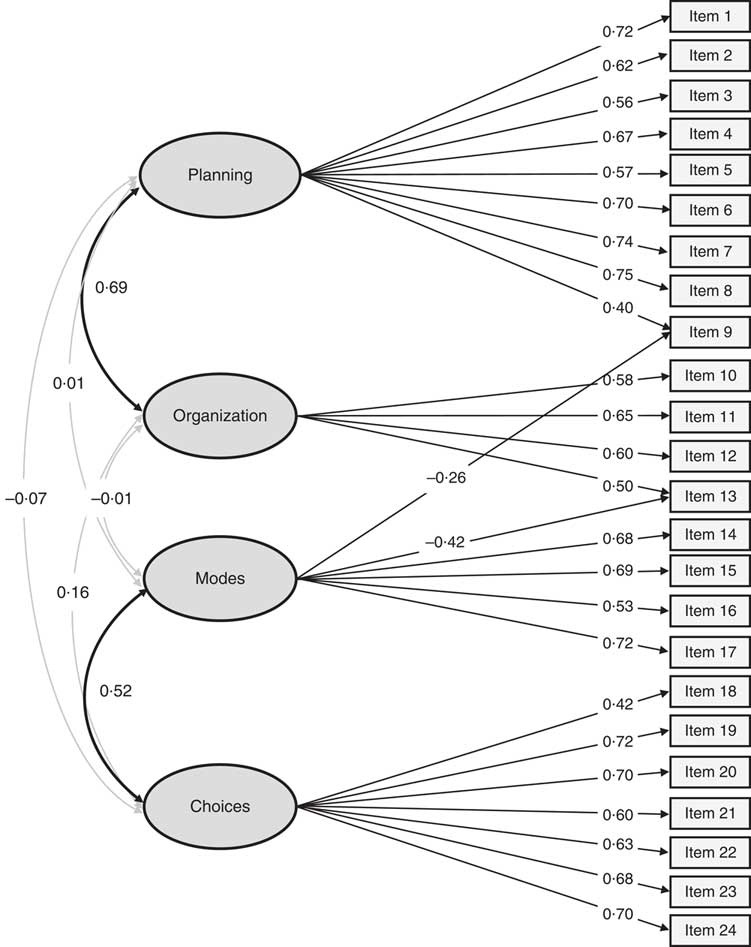
Figure 2 presents a diagram of the model showing the factor loadings of the items and the correlations between dimensions. Positive moderate correlations were found between the Planning and Organization dimensions (r=0·69, P<0·001) and between the Modes and Choices dimensions (r=0·52, P<0·001). The other correlations between dimensions were negligible.
Diagram representing the model of the final scale for measuring healthy eating practices according to the Dietary Guidelines for the Brazilian Population recommendations, showing the factor loadings of the items and the correlations between dimensions

The Planning and Organization dimensions are characterized as positive dimensions, whereas the Modes and Choices dimensions are characterized as negative (i.e. they measure constructs opposed to the Guide recommendations). Notably, the two items with cross-loading present negative factor loadings in the Modes dimension but positive factor loadings in the Organization and Planning dimensions, which reflect the opposite characters between dimensions. Therefore, the scores assigned to the responses of the items in the Choices and Modes dimensions must be reversed to ensure that the sum of the score is determined properly, as shown in Table 4.
Instructions for the sum of the individual scores for the Choices and Modes dimensions of the scale for measuring healthy eating practices according to the Dietary Guidelines for the Brazilian Population recommendations
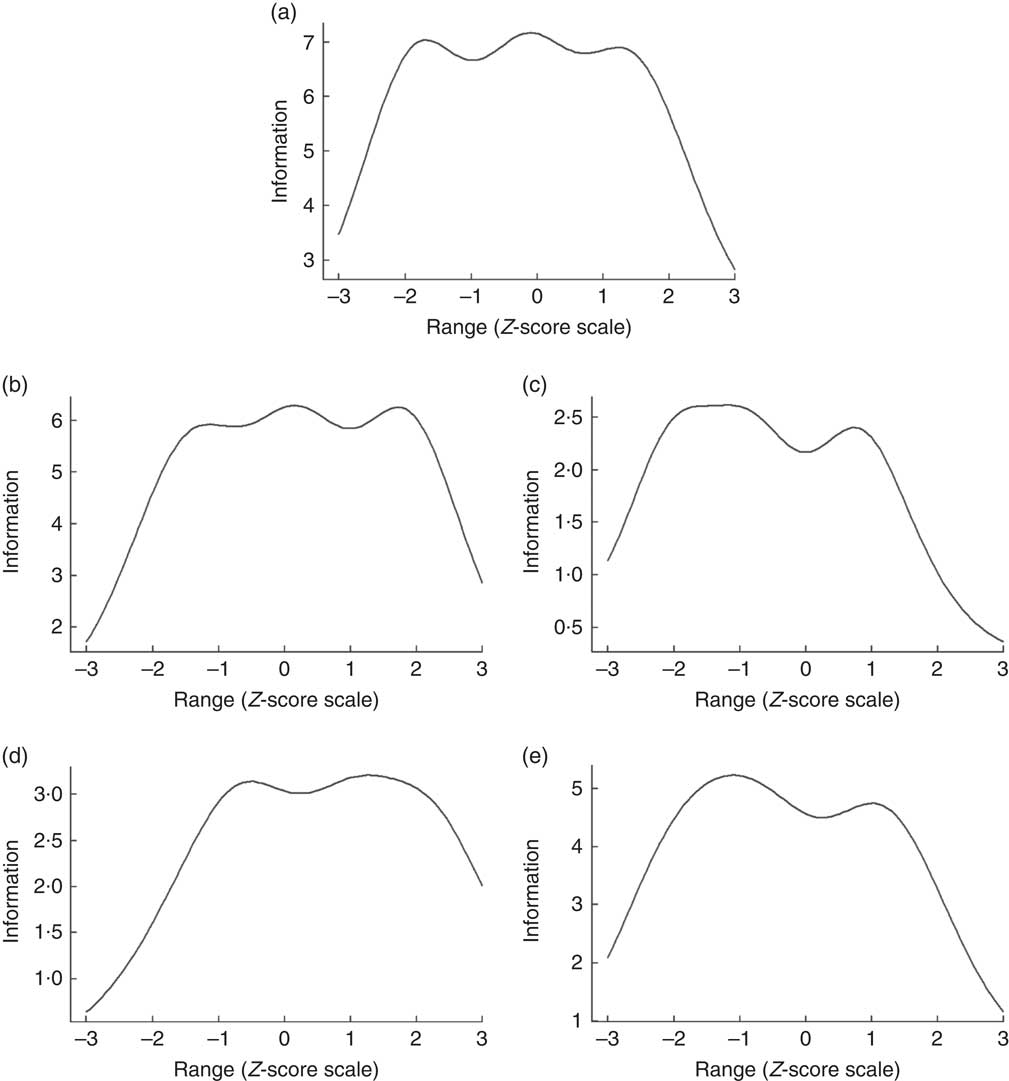
Figure 3 illustrates the total information curves of the full scale and each of the subscales. All curves have a characteristic plateau format, which indicates that they are accurate for individuals with different score ranges. The full scale (Fig. 3(a)) and the Planning and Choices subscales (Figs 3(b) and 3(e)) are accurate between individuals with scores up to 2 sd below or above the mean, indicating a good discrimination capacity even among individuals who have more distal scores. The Organization and Modes subscales have slightly shifted curves, so their discrimination capacity is more limited for specific score ranges (Figs 3(c) and 3(d)).
Test information curves corresponding to the full scale (a) and the Planning (b), Organization (c), Modes (d) and Choices (e) subscales of the scale for measuring healthy eating practices according to the Dietary Guidelines for the Brazilian Population recommendations
In the internal consistency analysis, the following values of Cronbach’s α coefficients were found: α=0·77 (95 % CI 0·79, 0·81) for the total scale; α=0·77 (95 % CI 0·75, 0·8) for the Choices dimension; α=0·68 (95 % CI 0·64, 0·71) for the Modes dimension; α=0·58 (95 % CI 0·53, 0·63) for the Organization dimension; and α=0·82 (95 % CI 0·8, 0·84) for the Planning dimension. McDonald’s ω for the total scale was equal to 0·83.
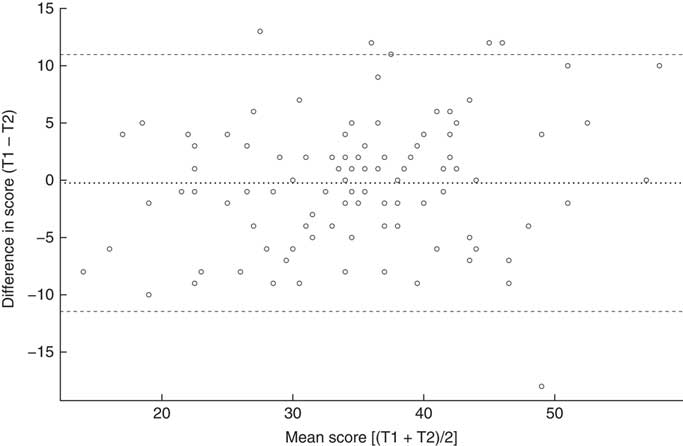
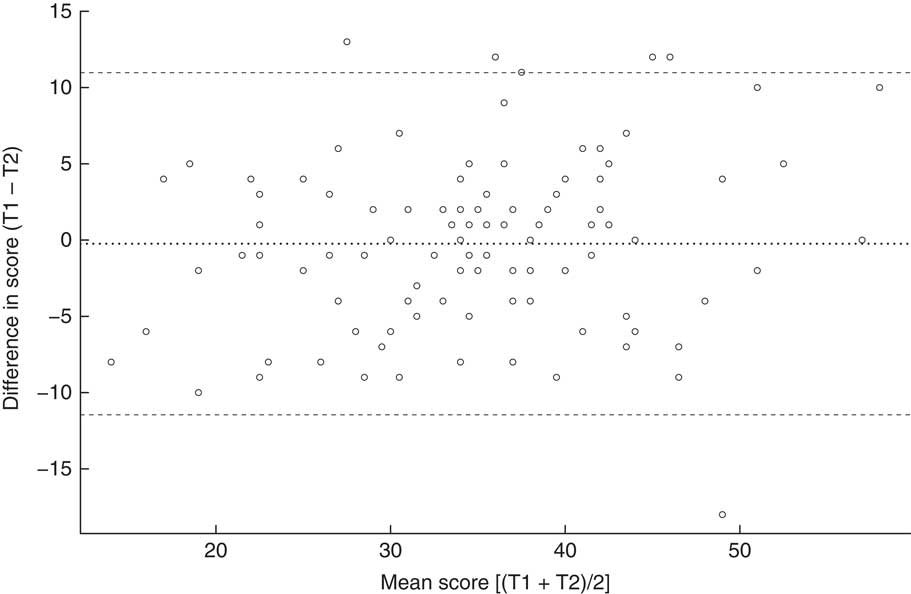
In the reproducibility analysis, the ICC for the total score and for all items are shown in Table 3. The ICC for the total score was 0·82 (95 % CI 0·74, 0·87), which indicates excellent reliability, and the ICC of the items ranged from 0·40 to 0·75, which indicates fair to good reliability. The random distribution pattern of differences noted in the Bland–Altman plot (Fig. 4) suggests the absence of possible systematic errors, such as a learning effect in the test.
Bland–Altman plot showing the distribution of the differences between individuals’ scores at time 1 (T1) and time 2 (T2) v. their mean scores for T1 and T2 (30d apart) among adults aged 18–60 years (n 100) who completed the scale for measuring healthy eating practices according to the Dietary Guidelines for the Brazilian Population recommendations. · · · · · represents the mean difference (bias) and – – – – – represent the limits of agreement
Discussion
The objective of the present study was to develop a valid tool to measure healthy eating practices according to the Brazilian Guide recommendations, which was expected to contribute to the evaluation of this instrument. Throughout the elaboration of this scale, the use of the methodological psychometric framework was appropriate for the characteristics of this guide. In studies of this nature, the item development and the content and face validity phases (in which the items are edited) are considered fundamental since they can influence psychometrical property outcomes( Reference Nunally and Bernstein 26 ). Despite being an uncommon practice in scale development studies, the review of the scales’ items by members of the target population, and not only experts, enables researchers to identify and eliminate potential problems in the scale before it is applied at large( Reference Morgado, Meireles and Neves 44 ). In this sense, the methods adopted in the present study to achieve content and face validities were very important for guaranteeing that both the items and the Likert response options were well understood by the target population.
During construct validity, some methodological considerations are important. At the exploratory step, the sample size for the EFA was close to the minimum limit suggested in the literature (five observations per variable). The size of the sample is directly related to the probability of identification of trusty correlation patterns between the variables; the KMO value is an indicator of this (values closer to 1 are better). In this regard, although a factor analysis can be performed with values greater than 0·5( Reference Field 30 ), the KMO value found in the present study (0·63) indicated a diffuse pattern in almost 40 % of the variance between items, likely due to random errors. For small samples, such as this case, parsimonious interpretation of the obtained results is suggested, since they can be ‘superadjusted’ (i.e. to generate factors that reflect specific characteristics of the sample) and cannot be extrapolated( Reference Hair, Black and Babin 28 ).
In the confirmatory step, both the size and the heterogeneity of the sample were greater than those of the exploratory step, which are good aspects for proceeding with factor analysis because they can increase the diversity of characteristics inherent to the construct of interest( Reference Brown 29 ). Considering the great cultural diversity in Brazilian territory, this sample distribution among the five Brazilian macro-regions was crucial for results generalization. The good fit of the final model validated the model extracted from the EFA since it demonstrated that the same factorial structure can also be fitted even to a heterogeneous population.
Although no previous hypothesis on the dimensionality was established (justifying the adoption of the exploratory step), the multidimensionality of the scale is in line with the complex nature of the healthy diet components recognized by the Guide. Regarding the food and nutrition area, the use of multidimensional approaches has grown as the understanding of diet as a multifaceted phenomenon has broadened. For example, Doustmohammadian et al. ( Reference Doustmohammadian, Omidvar and Keshavarz-Mohammadi 45 ) and Perry et al. ( Reference Perry, Thomas and Samra 46 ) performed studies with the aim of generating scales to measure ‘food literacy’, which is a phenomenon known as the ability to plan, chose, prepare and consume food based on the implication of these attributes in a complex dietary system( Reference Vidgen and Gallegos 47 ). In the current study, the dimensions emerged from the construct validity analysis that represents the core of the three chapters of the Guide that compose the theoretical domains of the scale.
The Choices dimension kept items related to the consumption habits of sugary beverages, ultra-processed snacks and fast foods, which were precisely determined to be the ultra-processed foods most consumed by the Brazilian population, as evidenced in a population budget survey conducted in 2008–2009 to investigate the total energy contribution to the diet( 15 ). This dimension deals specifically with the core recommendation of the Guide, ‘Always prefer natural or minimally processed foods and freshly made dishes and meals to ultra-processed foods’( 3 ), which refers to the tendency to replace foods from the first group with foods from the second group, as observed by Louzada et al. ( Reference Louzada, da, Martins and Canella 13 ). The direction of opposition between the NOVA groups and the presence of the verb ‘prefer’ are consistent with the use of a latent variable for measurement given adherence to this recommendation.
The Modes dimension addresses how food consumption and meals occur, specifically in relation to the regularity, attention and characteristics of the environment. Evidence regarding the influence of these factors on the pleasure provided by eating( Reference Oliveira, da and Silva-Amparo 7 , Reference Scagliusi, da Rocha Pereira and Unsain 48 ) and the quantity and quality of the food ingested( Reference Cohen and Farley 49 ) is increasing. Regarding this latter aspect, inappropriate eating habits seem to be related to the ingestion of ultra-processed foods( Reference Louzada, da, Baraldi and Steele 14 , Reference Ludwig 50 ), which corroborates the positive correlation found between the Modes and Choices dimensions in the present study.
The Organization dimension is related to the preparation and consumption of meals at home, as indicated by the inclusion of the expression ‘in my home’ in different items. The influence of the domestic environment on eating habits has been corroborated in the literature; for example, the study by Pachucki et al. ( Reference Pachucki, Karter and Adler 51 ) found a direct association between diet quality and meals prepared and consumed at home by men and inversely between meals consumed outside of home by women in a sample of diabetic individuals. The authors discuss the gender difference in the light of persistent discrepancies in household task overload. This discrepancy was also explored in the study of Hartmann et al.( Reference Hartmann, Dohle and Siegrist 52 ), which discussed culinary skills for preparing meals at home. These findings from the literature give rise to future analyses of scores on the scale according to gender, particularly since one of the items in this dimension refers specifically to task sharing.
The Planning dimension is expressed in terms of the acquisition of food, the combination of foods in the form of meals and their consumption. Vidgen and Gallegos( Reference Vidgen and Gallegos 47 ) found similar components when defining food literacy, which suggested affinity between the Planning dimension and the food literacy attribute. The positive correlation between this dimension and the Organization dimension is plausible from the theoretical perspective, since they are related to similar attributes, although the specificity of the latter manifests itself within the domicile.
The reliability of the total score was satisfactory in the internal consistency analysis for Cronbach’s α and McDonald’s ω coefficients. Values of α were slightly lower for Modes and Organization dimensions than for Choices and Planning dimensions, which is likely due to the lower number of items (four items) since the α coefficient is sensitive to the number of variables included in the calculation( Reference Streiner 53 ). However, this did not minimize the importance and relevance of these two dimensions within the entire scale but reinforces the fact that this scale must be applied as a whole and its score analysed as the only measure. In the test–retest reliability assessment, a satisfactory agreement was observed between the scores of two time point applications, which suggests a good stability of the instrument. Therefore, the validity and reliability results from the present study raise the potential applicability of this scale in different contexts, including health services, management and scientific research.
In a global panorama, with some exceptions, the actions of evaluation of dietary guidelines have been given in an incipient manner. Surveys conducted in 2011 and 2014 reported that most experiences in this area were performed in isolation with small groups and were directed mainly towards the evaluation of their implementation processes( 2 , Reference Brown, Timotijevic and Barnett 54 ). Since then, some new experiences in the evaluation of dietary guidelines have been published. For example, Bechtold et al. ( Reference Bechthold, Wendt and Laubach 55 ) evaluated population knowledge of the recommendations of the German Dietary Guidelines, and Arentoft et al. ( Reference Arentoft, Hoppe and Andersen 56 ) and Eriksen et al. ( Reference Eriksen, Gibson and Lamb 57 ) evaluated the relationships between adherence to the recommendations of the dietary guidelines from Denmark and the UK, respectively, and specific health outcomes. Given this context, the current study will contribute in an innovative way not only by enabling the establishment of continuous evaluation processes for dietary guidelines, as occurs in USA for instance( Reference Krebs-Smith, Pannucci and Subar 58 ), but also by sharing the experience of developing and validating a tool that measures dimensions that are not directly observable but are part of a healthy eating paradigm.
One limitation of the present study is that convergent validity was not assessed, which would confirm whether the scale measures the eating practices related to the recommendations of the Guide. These validations would be performed, for example, by a comparison between scores on the scale and another measure supposedly correlated with it, such as ultra-processed food consumption, which can be measured through a 24 h eating recall. For such analysis, new data collection within a study with a design differing from the present study would be necessary. Nunally and Bernstein( Reference Nunally and Bernstein 26 ) pointed out that validation is an unending process in which new evidence may reinforce the validity of an instrument or suggest modifications in its composition. Although the construct validity of the scale can be supported both by the theoretical coherence with the Guide and the statistical evidence of model good fit, future analyses in this regard would be very important.
Another limitation is that the sample used in the validation process was not representative of the Brazilian population. However, regional differences were mitigated by the fact that individuals from all Brazilian geographic regions participated in all phases of the study. The electronic data collection for the confirmatory step of construct validity was a decision that might represent a limitation, since psychometric properties identified in questionnaires applied on paper were not necessarily reproduced when the same questionnaires were applied online( Reference Hirsch, Hauschild and Schmidt 59 ). However, this decision was timely, because it allowed wider participation of individuals from different regions and the possibility of applying the scale through this route, since the validity results were satisfactory. This decision is a factor that can broaden the reach of the tool and therefore its use to evaluate the impact of the Guide.
Finally, a multidimensional self-applied scale was developed and validated that could be administered either on paper or electronically (online). Future studies that assess convergent validity with representative samples from different scenarios in Brazil are important for broadening understanding about the phenomena measured by this tool. The present study is innovative in the context of the impact evaluation of dietary guidelines and contributes not only to assessment of the impact of the Brazilian Guide, but can also inspire other countries to develop and validate instruments specific to their local context. Movements in this regard are important for future research on the actual potential of the dietary guidelines to promote healthy diets patterns in a global context.
Acknowledgements
Financial support: This study was financed in part by the Coordenação de Aperfeiçoamento de Pessoal de Nível Superior, Brasil (CAPES) (finance code 001) and by the Brazilian Ministry of Health (grant number 825680/2015). CAPES and the Brazilian Ministry of Health had no role in the design, analysis or writing of this article. Conflict of interest: None. Authorship: K.T.G. and P.C.J. designed the study; K.T.G. carried out the study, analysed the data and wrote the article; P.C.J. edited the article. Ethics of human subject participation: This study was conducted according to the guidelines laid down in the Declaration of Helsinki and all procedures involving human subjects were approved by the Comitê de Ética em Pesquisa da Faculdade de Saúde Pública da Universidade de São Paulo (protocol number 1.687.651). Written informed consent was obtained from all subjects.
Supplementary material
To view supplementary material for this article, please visit https://doi.org/10.1017/S1368980018004123