

Introduction
The Antarctic Peninsula is one of the most climatologically interesting areas of the Antarctic. Over the last 50 years, annual mean near-surface air temperatures on the western side of the peninsula have risen by up to 0.6˚ Cdecade–1 (statistically significant at less than the 1% level), as large a warming as anywhere on Earth (Reference King, Turner, Marshall, Connolley, Lachlan-Cope, Domack, Burnett, Leventer, Conley, Kirby and BindschadlerKing and others, 2003). In addition, a number of floating ice shelves on both the eastern and western sides of the peninsula have disintegrated (Reference Doake and VaughanDoake and Vaughan, 1991), and sea-ice extent over the Bellingshausen Sea has decreased (Reference Zwally, Comiso, Parkinson, Cavalieri and GloersenZwally and others, 2002). However, we have little knowledge of how precipitation has changed over the last 50 years.
Precipitation is extremely difficult to measure at the research stations because of blowing-snow effects, which can cause snow to be added to or removed from snow gauges in the absence of precipitation, once the wind speed exceeds about 10ms–1. Some Antarctic Peninsula stations have used snow gauges, but the results have not been satisfactory. A more commonly used procedure has been to measure net surface mass balance (for a definition of this term and its relationship to precipitation and accumulation see Reference Turner, Lachlan-Cope, Marshall, Morris, Mulvaney and WinterTurner and others (2002)) at the stations or remote sites using a single stake or array of stakes. This method works well at interior locations on the continent where there is little blowing snow and the orography is fairly flat. However, in the coastal region, where the winds are frequently strong, stake measurements are of less value, with the greatest increases observed often being associated with strong wind events rather than heavy precipitation (Reference Turner and ColwellTurner and others, 1995).
Estimates of mass balance from ice cores and pits have proved particularly valuable and have allowed the production of maps of mean mass balance for the whole continent (Reference BromwichBromwich, 1988). With careful analysis, ice cores can yield annual mean accumulation, although the wind can mix large amounts of snow on the surface, thus hindering the identification of annual layers.
Atmospheric models are a powerful tool for examining the precipitation and precipitation–evaporation (P – E) over the continent, providing data across regions where there are no in situ observations. Model output has been used to consider the temporal and spatial variability of these quantities across the Antarctic (Reference Turner, Connolley, Leonard, Marshall and VaughanTurner and others, 1999) and how precipitation may change in coming decades (Reference Budd, Simmonds, Weller, Wilson and SeverinBudd and Simmonds, 1991). However, the relatively coarse horizontal resolution of these models has meant that their performance has been poor in areas of complex orography. Recent experiments with high-resolution, limited-area models have had more success in the Antarctic Peninsula region (Reference Van Lipzig, King, Lachlan-Cope and van den BroekeVan Lipzig and others, 2004), but this is still a challenging area for models.
Atmospheric models have been used as part of data assimilation schemes incorporating in situ and satellite observations to produce meteorological analyses. Recently, some of the major meteorological agencies have reanalyzed all the observational data using current analysis schemes to produce the so-called re-analysis datasets (Reference Gibson, Hernandez, Kaållberg, Nomura, Serrano and UppalaGibson and others, 1996; Reference KalnayKalnay and others, 1996). These provide surface and upper-air meteorological analysis fields at the four main synoptic hours each day, extending back to the 1950s. As discussed below, these fields tend to be rather poor at high latitudes in the pre-satellite era, but nevertheless are an extremely important tool for investigating recent climate variability.
One final form of data that has been used to examine precipitation variability and change is the observations of precipitation occurrence from the stations, made as part of the synoptic reporting programmes (Reference Turner, Lachlan-Cope, Thomas and ColwellTurner and Colwell, 1995). These observations cannot provide information on the amount of precipitation that has fallen, but can yield valuable data on precipitation frequency and the relative occurrence of snow and rain in the Antarctic.
In this paper, we investigate the changes in precipitation that have taken place around the Antarctic Peninsula over the last 50 years, using the European Centre for Medium-Range Weather Forecasts (ECMWF) re-analysis (ERA) data andobservations from Faraday/Vernadsky station (65.4˚ S, 64.4˚ W). The data on precipitation days provide one of the few reliable meteorological datasets on precipitation extending back to the 1950s. We have used this time series in conjunction with the re-analysis fields to infer atmospheric circulation variability and change in the pre-satellite era.
Data Availability and Characteristics
The re-analysis fields
The re-analysis fields produced by the ECMWF provide one of the most reliable and consistent series of surface and upper-air meteorological analyses available. Fields are available every 6 hours and have been produced with a current, state-of-the-art data assimilation scheme that has been run using the historical record of in situ meteorological observations and satellite data. The fields cover the 44 year period 1957–2001, although the project is still known as ERA-40.
In the pre-satellite era the only upper-air meteorological data over the Southern Ocean were from widely spaced island stations, while surface conditions had to be analyzed from ship reports, which tended to come mainly from along the major shipping lanes. It is therefore not surprising that the quality of the ERA-40 fields around the Antarctic is poor in the early years. Reference MarshallMarshall (2003) compared the ERA-40 fields against the available in situ observations and concluded that the mean sea-level pressure (MSLP) and upper-level height fields can be used with confidence as far back as 1973. However, he also noted that the fields from over the Southern Ocean contain considerable errors in the late 1950s and early 1960s. This makes them unsuitable for investigation of atmospheric conditions around the Antarctic Peninsula during this period. Figure 1 shows the differences between the monthly mean MSLP data from Faraday and ERA-40 at the location of the station, and confirms that from 1979 the Faraday MSLP is well represented in ERA-40, although there is a small negative trend. From 1974 the satellite temperature soundings from the Vertical Temperature Profile Radiometer were included in the analysis system, so differences were usually limited to several hPa; but before this, as would be expected given the lack of data, there are very large differences between the Faraday data and ERA-40. The Faraday observations themselves were assimilated, but since the model fields to the west are essentially climatological there is a mismatch between conditions at Faraday and further west, hence the difficulty of fitting the station data to the analysis scheme. It should also be noted that the ERA MSLP data have a positive bias of about 3 hPa at the location of Faraday in the period before about 1970.
Differences between the monthly mean MSLP data from Faraday and ERA-40 at the location of the station.

In this study, we have used the ERA-40 precipitation fields and determined the number of precipitation days at the location of Faraday. We have taken a precipitation day to be any day with >0.1mm of precipitation. This amount was chosen to exclude the extremely small amounts of precipitation generated within the model by numerical instabilities.
Although a number of studies of the quality of the ERA-40 MSLP and height fields have been carried out, it is unclear how accurate the precipitation data, and especially the time series of precipitation days, are for the Antarctic. Figure 2 shows the annual totals of the number of precipitation days at Faraday and in ERA-40 at the location of Faraday. It shows that in the period up to 1983 there was little correlation between the two time series, as a result of the lack of humidity data being assimilated into the analysis system. However, from 1984 onwards there is good agreement between the number of ERA and Faraday precipitation days (correlation coefficient 0.8), indicating that the ERA analysis system accurately simulates the hydrological cycle around the Antarctic Peninsula. In the following we have therefore only used the ERA precipitation data over the period 1984–99.
Annual totals of the number of precipitation days at Faraday and in ERA-40 at the location of Faraday.
Precipitation-day information
For this study we have used the time series of the number of precipitation days occurring each month at Faraday/ Vernadsky station. We have defined a precipitation day as any day when there was at least one report of snow, rain, drizzle, hail or a shower in the past or present synoptic weather reports. Reports of blowing snow and clear-sky precipitation (‘diamond dust’) were not regarded as precipitation reports, and were therefore ignored.
The meteorological observing programme at the station began in 1947, but for the first 3 years the weather reports were made at different frequencies, so the number of precipitation days is lower than in later years. A similar marked drop in the number of precipitation days occurred after 2000, indicating another change in observing practice. Inthe following we have therefore only used Faraday/ Vernadsky precipitation-day data for the period 1950–99, when regular 3 hourly synoptic reports were made.
Although the synoptic reports provide information on precipitation intensity, examination of the time series of these observations shows marked jumps in the frequency with which particular intensities, slight, moderate or heavy, are reported, especially when there was a change of observer. Although the World Meteorological Organization guidelines on making observations provide information on how to estimate snowfall intensity from the reduction in visibility, this is still a very subjective process and dependent on the observer. In this study we have therefore not used the observations of precipitation intensity made by the observers. However, the question arises as to how the statistics on precipitation days relate to the actual amount of precipitation that fell. Figure 3 shows a scatter diagram of the number of precipitation days at Faraday vs the monthly totals of precipitation from ERA-40. The data are for all months over the period 1984–99. It can be seen in Figure 3 that for any particular number of Faraday precipitation days during a month there is a broad spread of ERA-40 precipitation amounts, but this is to be expected, as a precipitation day can range from a few snowflakes to many hours of heavy snowfall. However, Figure 3 does illustrate the general increase in precipitation amount that is found with a greater number of precipitation days in a month.
Faraday precipitation days vs total monthly precipitation from ERA-40. The data are for all months during the period 1984–99.
A further illustration of the value of precipitation-day data from Faraday can be seen in Figure 4, which shows a comparison of monthly precipitation-day totals from the station and ERA-40. There is some scatter since the precipitation-day values are produced by such different means, but the correlation between these two datasets indicates that the model reasonably represents the variability of this quantity at the location of the station. The smaller number of precipitation days in the Faraday record is to be expected, as the observer does not watch the weather continuously and observing conditions become difficult during the long, dark winter nights.
Comparison of monthly totals of precipitation days from Faraday and ERA-40. The data are for all months during the period 1984–99.
Trends In The Faraday/Vernadsky Record Of Precipitation Days
Figure 5 shows the time series of the total number of precipitation days over the year from Faraday/Vernadsky, along with the annual mean temperature. It can be seen that both quantities have increased over the 50 year period: temperatures at a rate of +0.56˚C decade–1 and precipitation days at a rate of +12.4 decade–1, with both increases being statistically significant at less than the 1% level. However, there is only a relatively low correlation of 0.25 between the two datasets, due to the different factors determining these two quantities in a particular year and the timescales on which they operate.
Faraday/Vernadsky annual mean temperature and total number of precipitation days, 1951–99. windsaffecting the area are in turn determined by the synoptic conditions over the Amundsen–Bellingshausen Sea (ABS) with low- (high-)pressure systems resulting in generally northerly (southerly) flow. However, the sea ice does not respond instantaneously to changes in the wind direction and it has been shown that sea-ice anomalies, once created, can last for long periods (Reference KingKing, 1994).
Temperatures at the station, especially during the winter, are highly correlated with the sea–ice extent to the west of the Antarctic Peninsula (Reference KingKing, 1994), years of extensive (little) sea ice being characterized by low (high) temperatures. The sea-ice extent in a particular year is heavily influenced by the frequency of winds from the north or south, with northerlies (southerlies) inhibiting (aiding) the advance of the ice. The winds affecting the area are in turn determined by the synoptic conditions over the Amundsen–Bellingshausen Sea (ABS) with low– (high–)pressure systems resulting in generally northerly (southerly) flow. However, the sea ice does not respond instantaneously to changes in the wind direction and it has been shown that sea-ice anomalies, once created, can last for long periods (Reference KingKing, 1994).
The number of precipitation days at Faraday is dictated to a large extent by the air masses that arrive at the station: moist, north-to-northwesterly (dry, southerly) air masses result in a large (small) number of precipitation days (Reference Turner, Lachlan-Cope, Thomas and ColwellTurner and others, 1995). So, as with sea-ice extent, the winds over a year will influence the number of precipitation days recorded at Faraday. But this quantity will respond almost immediately to changes in wind direction and be more of a direct measure of air-mass origin, and hence depression activity over the ABS, than sea-ice extent or temperature. This can be seen in Figure 6, which shows the monthly mean number of precipitation days recorded throughout the year at Faraday for the period 1951–99. This figure shows that the greatest number of precipitation days occurs in the spring and autumn, in association with the peaks in depression activity as the circumpolar trough moves south and intensifies as a result of the semi-annual oscillation. Examination of the standard deviation of the number of precipitation days throughout the year (not shown) does not suggest any seasonal signal, which would be expected if the quantity were being heavily influenced by the sea-ice extent (as occurs with the temperature record) which has its largest variability during the winter.
Faraday/Vernadsky mean monthly number of precipitation days and the trend of 1951–99.
The close association between the number of precipitation days at Faraday and depression activity over the ABS can be further appreciated by noting that one of the largest totals of precipitation days in the record occurs in 1979 (Fig. 2). This was the year of the First GARP (Global Atmospheric Research Programme) Global Experiment, when Reference PhysickPhysick (1981) noted that there were many deep depressions and low MSLP values in the circumpolar trough.
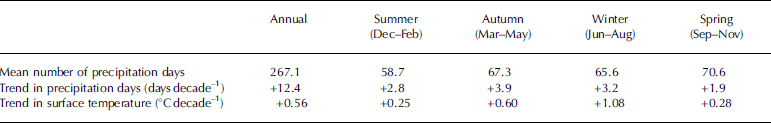
The seasonal trends in the Faraday mean temperatures and number of precipitation days are shown in Table 1. Here it can be seen that the temperature trend has a clear maximum in the winter, when it has almost double the magnitude of any other season, then rapidly decreases towards the spring. On the other hand, the trend in the number of precipitation days is largest during the autumn, although as can be seen in Figure 6, it varies considerably over the year and does not have the smooth form of the temperature trend as shown in Reference King, Turner, Marshall, Connolley, Lachlan-Cope, Domack, Burnett, Leventer, Conley, Kirby and BindschadlerKing and others (2003).
Mean data and trends for Faraday/Vernadsky station. Data are for 1951–99
Relationship Between Atmospheric Circulation and Number Of Precipitation Days
In order to gain insight into the relationship between the number of precipitation days at Faraday and the broad-scale atmospheric circulation, the annual totals of precipitation days from the station and the ERA-40 data at the location of Faraday were correlated with the annual mean values of MSLP across the whole of the Southern Hemisphere (Fig. 7). The two fields are very similar considering the means by which the number of precipitation days was computed using the in situ data and ERA-40 fields. The greatest negative correlations (a large number of precipitation days associated with low MSLP) are over the ABS where values of –0.6 to –0.8 are found with both the ERA and Faraday data, although the area of correlation in this range is larger in ERA. This picture of low MSLP over the ABS during periods of greater number of precipitation events at Faraday is consistent with our understanding of the means by which warm air masses can arrive at the station. Case studies of the arrival of different types of air mass on the western side of the Antarctic Peninsula have shown that the location of the low-pressure centres over the ABS is critical in determining whether the area is affected by air of warm, mid-latitude or cold Antarctic origin (Reference Marshall, Turner and MinersMarshall and others, 1998). The location of the highest values of negative correlation in the southeastern corner of the Bellingshausen Sea is just about optimal in ensuring that air arriving at Faraday has a long fetch over the relatively warm Southern Ocean.
Maps showing the correlation of the annual totals of precipitation days from Faraday (bottom) and the ERA-40 data at the location of Faraday (top) with the annual mean values of MSLP from ERA-40.
Around the rest of the Antarctic coastal zone the correlations are quite low, indicating that over the year as a whole it is synoptic activity over the ABS that mainly determines the number of precipitation days at Faraday and that conditions across the rest of the continent play a relatively small role. However, it should be noted that determining MSLP under the high-Antarctic orography has little physical meaning, and correlations across the higher parts of the Antarctic should be ignored.
Some areas of large positive correlation are found north of the Antarctic in the Western Hemisphere, with values from the ERA data being in excess of 0.8 over the South Atlantic.Again this is to be expected since there is often an anticorrelation between mean MSLP values in the Antarctic coastal region and the 50–60˚ S zone (Reference Marshall and KingMarshall and King, 1998), depending on the storm tracks over the South Pacific.
Similar maps of correlation between precipitation days and MSLP have been produced for each month of the year. In several of the months the area of high correlation has a circular or wavenumber-3 form, with correlation values in excess of 0.6 being found around much of the Antarctic coastal region. This is particularly the case in summer and autumn, as can be seen from the January map shown in Figure 8. In January there is still a regional maximum of correlation in the southeastern Bellingshausen Sea, but similar high correlation values are found around much of the coast of East Antarctica. This pattern suggests that changes in the number of precipitation days at Faraday during certain months are linked to Antarctic-wide, as well as local synoptic, forcing factors in the immediate ABS region. Figure 8 also shows that in January there were areas of high, positive correlation in the 40–60˚ S zone, suggesting Antarctic–mid-latitude linkages play a role in modulating the Faraday precipitation.
During the second half of the year, the maximum correlation is generally located in the southeastern Bellingshausen Sea, with low correlations around the rest of the continent, suggesting that at this time of the year local synoptic conditions have most influence on Faraday precipitation.
The correlation of the January totals of precipitation days from Faraday with the January mean values of MSLP from ERA-40.
Discussion
The number of precipitation days as determined from the Faraday synoptic observations is clearly a valuable measure of meteorological conditions over the ABS. The close agreement between the time series of this quantity from the station and similar measures derived from ERA-40 in recent years suggests that it is a reliable measure of the precipitation falling throughout the day. The high correlation between the Faraday total of precipitation days and ERA-40 MSLP over the ABS indicates that it can be used as a proxy of surface pressure in this area.
The time series of the annual total of Faraday precipitation days (Fig. 5) shows that this quantity increased at a statistically significant rate from the early 1950s up to the late1970s and has been essentially unchanged since that time. The trend varies considerably throughout the year, but generally peaks during the first half of the year. The essentially circular, or ‘annular’, nature of the precipitation-day/MSLP correlation maps, along with the low-/high-latitude out-of-phase relationship, points to the Southern Annular Mode (SAM) playing a role. This is the principal mode of variability in the atmospheric circulation of the Southern Hemisphere extratropics and high latitudes, and involves synchronous anomalies of opposite sign in Antarctica and the mid-latitudes. Following Reference MarshallMarshall (2003), the SAM can be defined as:
where P * 40˚S and P * 65˚S are the normalized monthly zonal MSLP at 40˚ and 65˚ S respectively.
In recent decades the SAM has entered a positive phase, with decreasing pressures over the Antarctic and increasing values in the mid-latitudes (Reference MarshallMarshall, 2003). As shown in Figure 9, the SAM has changed most during the first half of the year. Clearly the trends in the SAM and the number of precipitation days are not directly comparable, but the annular form of the correlation maps and the large trends in the SAM and precipitation data in the summer and autumn both point to the SAM playing a role in the changing nature of precipitation at Faraday.
The monthly trends in the SAM and the number of Faraday precipitation reports, 1958–99.
It is interesting to consider how the changes in the SAM could have resulted in more precipitation days on the western side of the Antarctic Peninsula. The ABS is at the latitude of the circumpolar trough, which is the belt of low pressure around the continent between about 60˚ and 70˚ S. It is present because of the large number of depressions in this zone that have either developed just north of the Antarctic or moved south from mid-latitudes. The fact that pressures have decreased in the trough does not tell us whether the number of depressions has increased or the mean depth of the lows has decreased, with the number of systems remaining constant. Either way, the ready supply of moisture over the Southern Ocean coupled with lower atmospheric pressures will result in greater dynamical lifting and increased precipitation.
As discussed earlier, the temperature at Faraday has increased most during the winter. Examination of the July and August number of precipitation days for Faraday shows that this quantity has increased since the 1950s, pointing to lower pressures over the ABS. However, the SAM has changed less in winter than in summer, suggesting that other factors are responsible for the decrease in sea ice over the ABS. During winter, the sea-ice edge is close to the latitude of Faraday so that any changes in the depth or frequency of synoptic-scale weather systems over the ABS will change the northerly component of the wind, thus amplifying variations in the air masses arriving at the station via the ice– atmosphere feedback mechanism. However, further work, especially using coupled atmosphere–ocean models, is needed to fully explain the marked winter temperature increase over the western Antarctic Peninsula.
It is difficult to compare the Faraday record of precipitation days directly with glaciological measurements of accumulation from the Antarctic Peninsula. Ice cores are a powerful tool for investigating accumulation variability, but must be collected from areas with no summer melt, and there is considerable melt along the coastal strip of the western Antarctic Peninsula where the stations are located. However, ice cores collected in the southeastern part of the peninsula and on James Ross Island near the tip of the peninsula show accumulation increases over the second half of the 20th century, reflecting the precipitation increase suggested by the Faraday data.
Conclusions and Further Work Needed
The time series of the number of precipitation days at Faraday is a good proxy of the MSLP over the ABS and suggests that pressures were higher over the ocean to the west of the Antarctic Peninsula in the 1950s and 1960s. The greatest increase in precipitation days has occurred during the summer and autumn, and appears to be associated with a change in the nature of the SAM. But the reasons for the marked increase in winter near-surface temperature at Faraday over the last 50 years are still not fully understood.
Further work is needed to understand why the SAM has changed, and the results of this shift into a positive phase. Automatic depression-tracking software needs to be run on the ERA-40 fields to understand how the changes in the SAM have altered the synoptic-scale weather systems in the area. Has there been a change in the number of lows and/or in their depth? and have there been changes in the ratio of systems developing in the circumpolar trough and moving south from mid-latitudes?
Model experiments also need to be carried out to determine whether the small changes in the SAM during winter could have influenced the depressions over the ABS sufficiently to change the meridional component of the wind to the point where the ice–atmosphere feedback mechanism could have been responsible for the marked change in surface temperature.


