


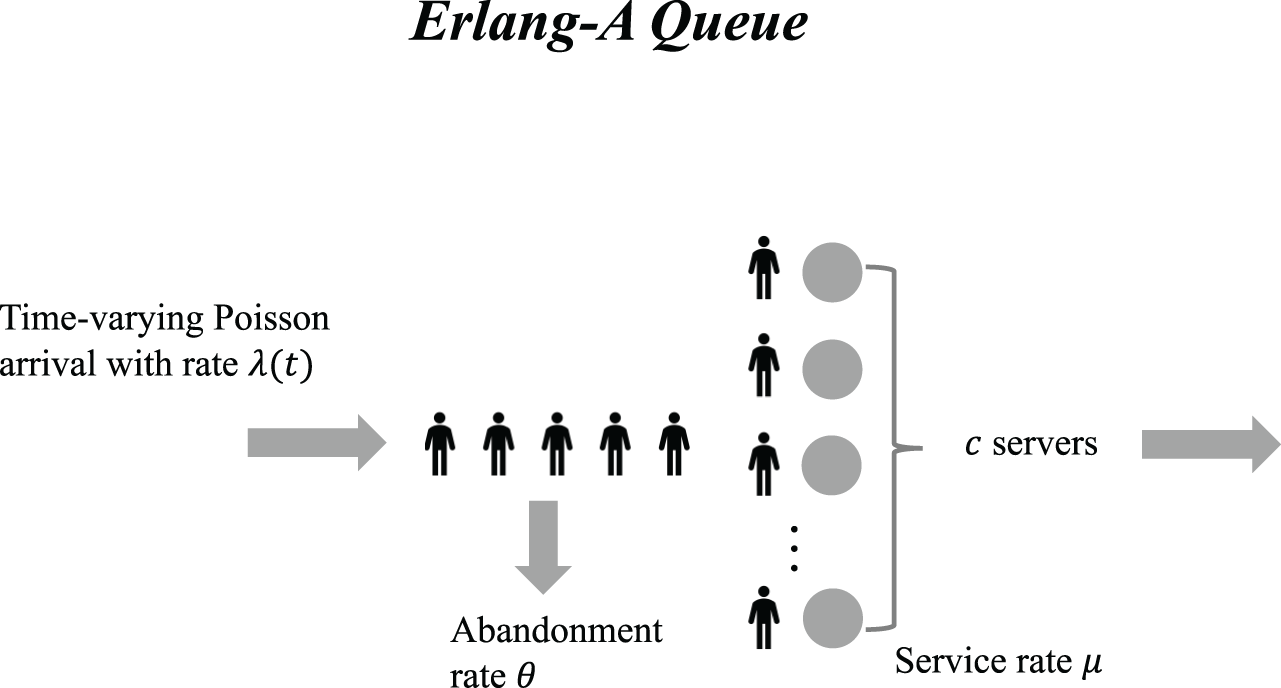
1. Introduction
Gathering during pandemic seasons can be risky. As people congregate in stores to buy essential goods such as water and non-perishable items, the risk of spreading the virus increases. Many service facilities have implemented protective measures, including transparent barriers, air filtration systems, and mandatory mask-wearing for all customers. Additionally, various social and physical distancing protocols have been adopted to limit close interactions between individuals, as discussed by Bove and Benoit [Reference Bove and Benoit4]. Although these measures can reduce the risk of infection to some extent, customers still inevitably interact with each other when present in the same area. In certain places where maintaining distance is not always feasible, such as in workplaces or crowded retail environments, understanding the extent to which customers interact with one another is important.
Most previous studies on COVID-19 have used deterministic compartmentalized models to estimate infection rates and spread dynamics (e.g., Kaplan [Reference Kaplan22], Nguemdjo et al. [Reference Nguemdjo, Meno, Dongfack and Ventelou33], and Dandekar et al. [Reference Dandekar, Henderson, Jansen, McDonald, Moka, Nazarathy, Rackauckas, Taylor and Vuorinen7]). However, in service systems where customers’ arrival and departure processes are stochastic, it is crucial to incorporate the stochastic effects in modeling the infection risk (Kang et al. [Reference Kang, Doroudi, Delasay and Wickeham21], Forien et al. [Reference Forien, Pang and Pardoux17], Drakopoulos et al. [Reference Drakopoulos, Ozdaglar and Tsitsiklis13] , and Palomo et al. [Reference Palomo, Pender, Massey and Hampshire37]).
In this work, we aim to characterize customer interactions in service systems, where arrivals, service, and abandonment behaviors are stochastic. The number of overlaps, defined as the count of people a customer interacts with during their time in the service system, is a key metric for assessing close contact. This metric is particularly important in the context of contact tracing (see World Health Organization [47]). A higher overlap count increases the likelihood of a customer being exposed to an infected individual. Conversely, when an infected customer is present, this metric also indicates how many others are at risk of exposure.
Recent research has shed light on calculating customers’ overlaps in queueing systems. Most of the existing studies evaluate customers’ overlaps in the stationary queues. For instance, Kang et al. [Reference Kang, Doroudi, Delasay and Wickeham21] demonstrate how overlaps can be used to calculate a new R 0 value for analyzing infection rates in stationary  $M/M/c$ queues. Xu et al. [Reference Jin, Young Myoung, Kong and Pender48] derive the number of overlaps in the $M/M/c$ systems with different queueing topology. Meanwhile, Palomo and Pender [Reference Palomo, Pender, Bae, Feng, Kim, Lazarova-Molnar, Zheng, Roeder and Thiesing35] prove that the tail of the distribution of the overlap time between any pair of customers is exponential for the $M/M/1$ queue and depends explicitly on the service distribution, where an overlap time is defined as the duration that both customers are in the queue together. Palomo and Pender [Reference Palomo and Pender38] extend the analysis to the case of batch arrivals, highlighting the practical applications of this analysis for transportation systems like trains and buses. Boxma and Pender [Reference Boxma and Pender5] consider the overlap times in $G/G/1$ queues. These studies mainly concentrate on steady-state overlap distributions, neglecting the transient dynamics of overlaps.
There are very few studies considering the transient behavior of overlaps. Ko and Xu [Reference Young Myoung and Jin23] provide an approximation scheme of the overlap times in a time-varying multi-server queue. Palomo and Pender [Reference Palomo and Pender36] investigate the number of overlaps in an infinite server queue, where the number of overlaps is equivalent to the queue length upon arrival plus the number of additional arrivals during service, as there is no waiting. However, these studies do not capture the realistic scenario where the service provider only has a finite number of servers and customers can thus be impatient due to long waits. Understanding the transient behavior of overlaps in such a finite-server system where customers may abandon the queue is crucial for assessing the risk of joining realistic service systems during peak times.
Our work aims to address these research gaps in the literature by investigating the transient distribution of the number of overlaps in  $M_t/M/c+M$ systems. In this system, customers arrive according to a time-varying Poisson process with a rate $\lambda(t)$, and service at each of the c servers follows an exponential distribution with a rate µ. Customers will abandon the queue if their waiting time exceeds their patience threshold, which is exponentially distributed with rate θ. A demonstrative graph for the $M_t/M/c+M$ system is provided in Figure 1. This investigation into the transient behavior of overlaps is challenging because the analytic frameworks used for steady-state analysis in previous studies by the authors in Refs. [Reference Boxma and Pender5, Reference Jin, Young Myoung, Kong and Pender48] will not apply. Additionally, the number of overlaps derived for an infinite server system, as discussed by Palomo and Pender [Reference Palomo and Pender36] can only serve as a lower bound for any finite server system that includes customer abandonment.
A demonstrative graph of the  $M_t/M/c+M$ queueing system. A virtual customer who arrives at this particular time will overlap with c + 5 customers immediately and will overlap with other new arrivals during her sojourn time in the queue.
1.1. Main contributions of the paper
The main contributions of this work can be summarized as follows:
• To address the challenges identified, we derived exact expressions for the Erlang-A fluid and diffusion differential equations, which allowed us to establish fluid and diffusion limits for the queue length process. Using the digamma and trigamma functions, we then developed new approximations for the mean and variance of waiting times in the Erlang-A queue. Building on these results, we introduced new approximations for the mean and variance of the number of overlaps, which can potentially be adapted to other time-varying queueing systems.
• Our paper presents a new analysis that provides critical insights into finite server systems with customer abandonment. Specifically, our analysis enables us to determine the number of overlaps that occur accurately and sheds light on the distribution of potential overlaps, allowing us to establish prediction intervals. This analysis is practically applicable in preventing large overlaps and serves as a valuable tool for designing service systems by adjusting arrival rates, service distributions, and server numbers. Our work significantly enhances the understanding of queueing systems and can guide decision-making across various service system applications.
1.2. Organization of the paper
The remainder of this paper is structured as follows. Section 2 begins by introducing the Erlang-A queueing model and deriving exact expressions for the fluid and diffusion variance differential equations. In Section 3, we present new approximations for the mean and variance of waiting times in the Erlang-A queue. Building on these, we introduce novel approximations for the mean and variance of the number of overlaps for a virtual customer. The effectiveness of these approximations is then validated through simulation experiments in Section 4. Lastly, Section 5 summarizes our findings and outlines promising directions for future research in this field.
2. The Erlang-A queueing model
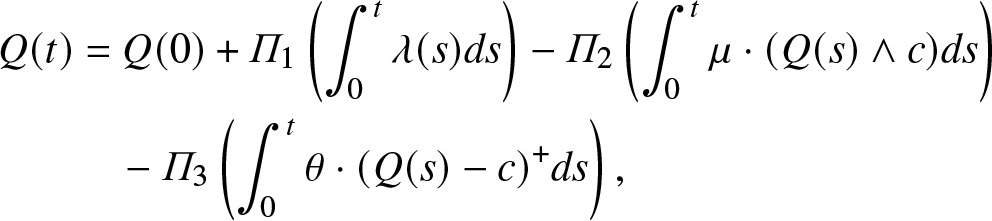
The Erlang-A model incorporates customer abandonment, which is a very important feature of real-world service systems. In particular, Mandelbaum et al. [Reference Mandelbaum, Massey and Reiman30] show that the queue length process for an  $M_t/M/c+M$ queueing system $ Q\equiv \{Q(t) | t \geq 0 \} $ is represented by the following stochastic process:
 \begin{align}
Q(t) &= Q(0) + \varPi_1 \left(\int^{t}_{0} \lambda(s) ds \right) - \varPi_2 \left(\int^{t}_{0} \mu \cdot (Q(s) \wedge c )ds \right) \nonumber \\
&\quad - \varPi_3 \left(\int^{t}_{0} \theta \cdot (Q(s) - c )^+ds \right),
\end{align}
\begin{align}
Q(t) &= Q(0) + \varPi_1 \left(\int^{t}_{0} \lambda(s) ds \right) - \varPi_2 \left(\int^{t}_{0} \mu \cdot (Q(s) \wedge c )ds \right) \nonumber \\
&\quad - \varPi_3 \left(\int^{t}_{0} \theta \cdot (Q(s) - c )^+ds \right),
\end{align} where  $ \varPi_i \equiv \{ \varPi_i(t) | t \geq 0 \} $ for $ i = {1,2,3} $ are i.i.d. standard (rate 1) Poisson processes, $(x \wedge y) = \min\{x,y\}$, and $x^+ = \max\{x,0\}$. In view of Mandelbaum et al. [Reference Mandelbaum, Massey and Reiman30], the sample path of the queue length process of the Erlang-A queue described in Eq. (1) can be uniquely decomposed into three independent unit rate Poisson processes. These processes include the arrival process with rate $\lambda(t)$, the service departure process with rate µ, and the abandonment process with rate θ. The general idea of Eq. (1) is that the queue length at any given time is the initial queue length at time 0, plus the number of arrivals over the period $[0,t]$, minus the number of departures due to service completion or abandonment.
The Erlang-A queueing model and its variants are extensively studied in the queueing literature, see for example Zeltyn and Mandelbaum [Reference Zeltyn and Mandelbaum49], Whitt [Reference Whitt46], Mandelbaum and Zeltyn [Reference Mandelbaum and Zeltyn31], Gurvich et al. [Reference Gurvich, Huang and Mandelbaum18], Engblom and Pender [Reference Engblom and Pender16], Pender [Reference Pender41], Niyirora and Pender [Reference Niyirora and Pender34], Aktekin and Ekin [Reference Aktekin and Ekin1], Braverman et al. [Reference Braverman, Dai and Feng6], Pender [Reference Pender42], Pender and Massey [Reference Pender and Massey43], Bitton et al. [Reference Bitton, Cohen and Cohen3], Azriel et al. [Reference Azriel, Feigin and Mandelbaum2], and van Leeuwaarden et al. [Reference van Leeuwaarden, Mathijsen and Zwart45]. The Erlang-A queue is widely investigated because three classic queueing models are special cases of it. The  $M/M/\infty$, $M/M/c/c$, and $M/M/c/\infty$ queues are all special cases of the Erlang-A queue. The $M/M/\infty$ is obtained from the Erlang-A queue in two ways. The first way is to set the number of servers to infinity, that is, $c = \infty$. The second way is to make $\mu = \theta$. The $M/M/c/c$ is obtained from the Erlang-A queue by letting θ get large, that is, $\theta \to \infty$. This blocking phenomenon was first observed in Hampshire et al. [Reference Hampshire, Jennings and Massey20]. Finally, the $M/M/c/\infty$ is obtained by letting θ = 0. This is obvious as the abandonment process is shut off.
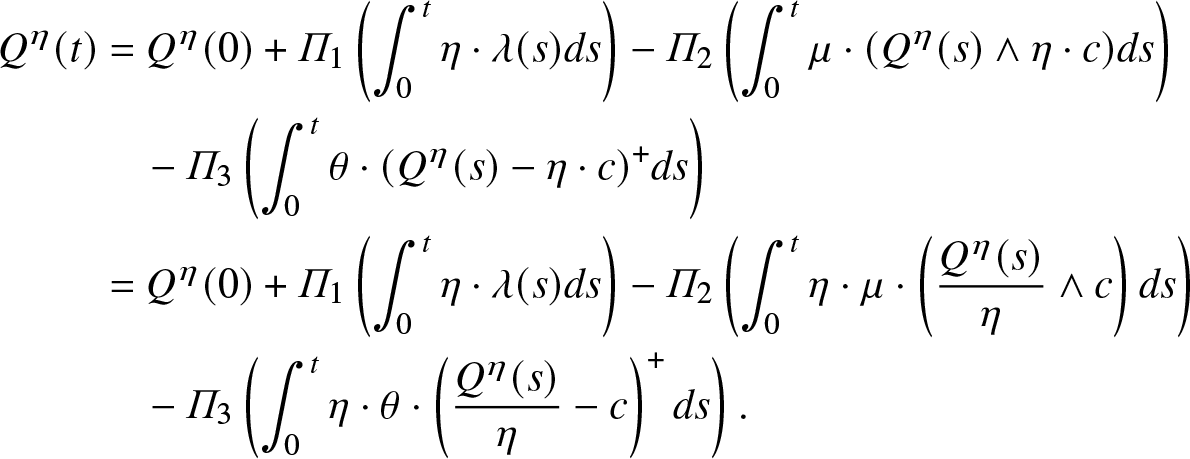
In Halfin and Whitt [Reference Halfin and Whitt19], an important insight emerged regarding multi-server queueing systems, emphasizing the ability to scale up both the arrival rate and the number of servers simultaneously. This scaling approach, known as the Halfin–Whitt scaling, has become pivotal in modeling call centers within queueing literature, as illustrated in works such as Pang et al. [Reference Pang, Talreja and Whitt39]. Given that the  $M(t)/M/c+M$ queueing process is a specialized instance of a single-node Markovian service network, we can extend this concept to construct a uniformly accelerated queueing process. In this accelerated scenario, both the new arrival rate $\eta\cdot\lambda(t)$ and the new number of servers $\eta\cdot c$ are proportionally scaled by a common factor η > 0. By applying the Halfin–Whitt scaling to the Erlang-A model, we derive the following sample path representation for the queue length process as
 \begin{align}
Q^{\eta}(t) &= Q^{\eta}(0) + \varPi_1 \left(\int^{t}_{0} \eta \cdot \lambda(s) ds \right) - \varPi_2 \left(\int^{t}_{0} \mu \cdot (Q^{\eta}(s) \wedge \eta \cdot c )ds \right) \nonumber \\
& \quad - \varPi_3 \left(\int^{t}_{0} \theta \cdot (Q^{\eta}(s) - \eta \cdot c )^+ds \right) \nonumber \\
&= Q^{\eta}(0) + \varPi_1 \left( \int^{t}_{0} \eta \cdot \lambda(s) ds \right) - \varPi_2 \left(\int^{t}_{0} \eta \cdot \mu \cdot \left( \frac{Q^{\eta}(s)}{\eta} \wedge c \right)ds \right) \nonumber \\
& \quad - \varPi_3 \left(\int^{t}_{0} \eta \cdot \theta \cdot \left( \frac{Q^{\eta}(s)}{\eta} - c \right)^+ds \right) .
\end{align}
\begin{align}
Q^{\eta}(t) &= Q^{\eta}(0) + \varPi_1 \left(\int^{t}_{0} \eta \cdot \lambda(s) ds \right) - \varPi_2 \left(\int^{t}_{0} \mu \cdot (Q^{\eta}(s) \wedge \eta \cdot c )ds \right) \nonumber \\
& \quad - \varPi_3 \left(\int^{t}_{0} \theta \cdot (Q^{\eta}(s) - \eta \cdot c )^+ds \right) \nonumber \\
&= Q^{\eta}(0) + \varPi_1 \left( \int^{t}_{0} \eta \cdot \lambda(s) ds \right) - \varPi_2 \left(\int^{t}_{0} \eta \cdot \mu \cdot \left( \frac{Q^{\eta}(s)}{\eta} \wedge c \right)ds \right) \nonumber \\
& \quad - \varPi_3 \left(\int^{t}_{0} \eta \cdot \theta \cdot \left( \frac{Q^{\eta}(s)}{\eta} - c \right)^+ds \right) .
\end{align}The derivation of Eq. (2) is similar to Eq. (1) and the only difference is that the arrival process and the number of servers are scaled by a factor of η. Moreover, taking the Halfin–Whitt limit gives us the fluid models of Mandelbaum et al. [Reference Mandelbaum, Massey and Reiman30], that is,
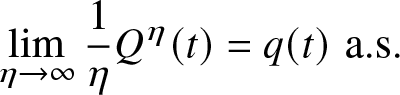 \begin{equation}
\lim_{\eta\to\infty} \frac{1}{\eta} Q^{\eta}(t) = q(t)\,\,\mathrm{a.s.}
\end{equation}
\begin{equation}
\lim_{\eta\to\infty} \frac{1}{\eta} Q^{\eta}(t) = q(t)\,\,\mathrm{a.s.}
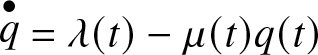
\end{equation}where the deterministic process q(t), the fluid mean, satisfies the following one-dimensional ordinary differential equation (ODE),
 \begin{equation}
{\stackrel{\bullet}{q}}(t) = \lambda(t) - \mu \cdot (q(t) \wedge c) - \theta \cdot (q(t) - c)^+ .
\end{equation}
\begin{equation}
{\stackrel{\bullet}{q}}(t) = \lambda(t) - \mu \cdot (q(t) \wedge c) - \theta \cdot (q(t) - c)^+ .
\end{equation}Moreover, the diffusion limit converges to a diffusion process, that is,
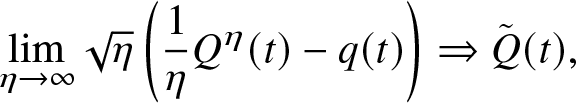 \begin{equation*}
\lim_{\eta\to\infty} \sqrt{\eta} \left( \frac{1}{\eta} Q^{\eta}(t) - q(t) \right) \Rightarrow \tilde{Q}(t),
\end{equation*}
\begin{equation*}
\lim_{\eta\to\infty} \sqrt{\eta} \left( \frac{1}{\eta} Q^{\eta}(t) - q(t) \right) \Rightarrow \tilde{Q}(t),
\end{equation*}and the variance of the diffusion is given by the following ordinary differential equation (the detailed derivation can be found in Theorem 5.2 of Mandelbaum et al. [Reference Mandelbaum, Massey and Reiman30]),
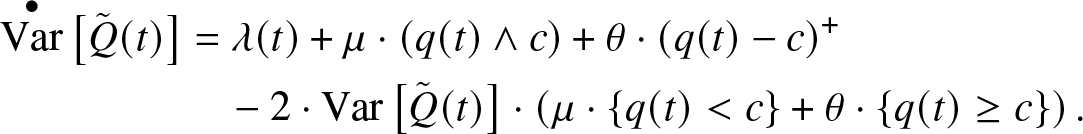 \begin{align}
{\stackrel{\bullet}{\mathrm{Var}}}\left[ \tilde{Q}(t) \right]
& = \lambda(t) + \mu \cdot (q(t) \wedge c) + \theta \cdot (q(t) - c)^+ \nonumber \\
& \quad - 2 \cdot \mathrm{Var}\left[\tilde{Q}(t) \right] \cdot \left( \mu \cdot \{q(t) \lt c \} + \theta \cdot \{q(t) \geq c \} \right) .
\end{align}
\begin{align}
{\stackrel{\bullet}{\mathrm{Var}}}\left[ \tilde{Q}(t) \right]
& = \lambda(t) + \mu \cdot (q(t) \wedge c) + \theta \cdot (q(t) - c)^+ \nonumber \\
& \quad - 2 \cdot \mathrm{Var}\left[\tilde{Q}(t) \right] \cdot \left( \mu \cdot \{q(t) \lt c \} + \theta \cdot \{q(t) \geq c \} \right) .
\end{align}In the following sections, we provide an extensive analysis of the differential equations derived from the fluid and diffusion limits. Although these equations are well-documented in the literature, this paper offers the first detailed analysis of the fluid and diffusion differential equation dynamics in the constant arrival rate case. We begin with the analysis of the differential equations of the fluid limits.
2.1. Fluid analysis
In this section, we present results regarding the fluid limit dynamics under a constant arrival rate. Before delving into our main findings related to the fluid analysis, we first provide a standard result for linear differential equations.
Lemma 2.1. Let q(t) be the solution to the following differential equation
 \begin{equation*}
{\stackrel{\bullet}{q}} = \lambda(t) - \mu(t) q(t)
\end{equation*}
\begin{equation*}
{\stackrel{\bullet}{q}} = \lambda(t) - \mu(t) q(t)
\end{equation*} where  $q(0) = q_0$. Then the solution for any value of t is given by
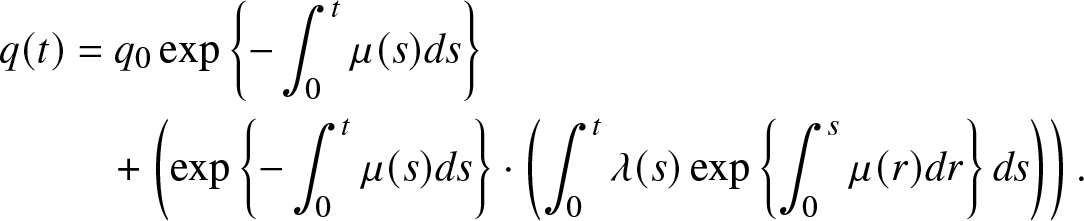 \begin{align*}
q(t) &= q_0 \exp\left\{- \int^{t}_{0} \mu(s) ds \right\} \\
& \quad + \left( \exp\left\{- \int^{t}_{0} \mu(s) ds \right\} \cdot \left( \int^{t}_{0} \lambda(s) \exp\left\{ \int^{s}_{0} \mu(r) dr \right\} ds \right) \right) \nonumber .
\end{align*}
\begin{align*}
q(t) &= q_0 \exp\left\{- \int^{t}_{0} \mu(s) ds \right\} \\
& \quad + \left( \exp\left\{- \int^{t}_{0} \mu(s) ds \right\} \cdot \left( \int^{t}_{0} \lambda(s) \exp\left\{ \int^{s}_{0} \mu(r) dr \right\} ds \right) \right) \nonumber .
\end{align*}Proof. This follows from standard results on ordinary differential equations by varying parameters (see Tenenbaum and Pollard Reference Tenenbaum and Pollard[44]).
Now that we characterize the dynamics of q(t) with time-varying arrival rate  $\lambda(t)$ and service rate $\mu(t)$, our next result provides the explicit solution to the fluid mean q(t) in the steady state, that is, when the arrival and service rates are both constant.
Proposition 2.2. When  $\lambda(t)$ and $\mu(t)$ are constants, the solution q(t) to Eq. (4) is given as follows:
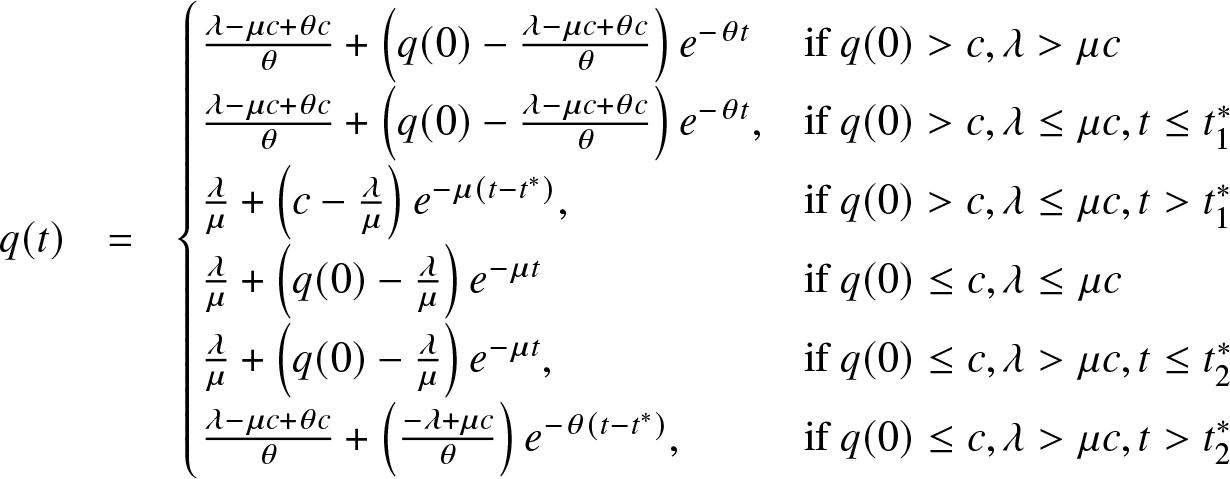 \begin{eqnarray}
q(t) & = & \begin{cases}
\frac{\lambda-\mu c+\theta c}{\theta}+\left(q(0)-\frac{\lambda-\mu c+\theta c}{\theta}\right)e^{-\theta t} & \text{if }q(0) \gt c,\lambda \gt \mu c\\
\frac{\lambda-\mu c+\theta c}{\theta}+\left(q(0)-\frac{\lambda-\mu c+\theta c}{\theta}\right)e^{-\theta t}, & \text{if }q(0) \gt c,\lambda\leq\mu c,t\leq t_{1}^{*}\\
\frac{\lambda}{\mu}+\left(c-\frac{\lambda}{\mu}\right)e^{-\mu(t-t^{*})}, & \text{if }q(0) \gt c,\lambda\leq\mu c,t \gt t_{1}^{*}\\
\frac{\lambda}{\mu}+\left(q(0)-\frac{\lambda}{\mu}\right)e^{-\mu t} & \text{if }q(0)\leq c,\lambda\leq\mu c\\
\frac{\lambda}{\mu}+\left(q(0)-\frac{\lambda}{\mu}\right)e^{-\mu t}, & \text{if }q(0)\leq c,\lambda \gt \mu c,t\leq t_{2}^{*}\\
\frac{\lambda-\mu c+\theta c}{\theta}+\left(\frac{-\lambda+\mu c}{\theta}\right)e^{-\theta(t-t^{*})}, & \text{if }q(0)\leq c,\lambda \gt \mu c,t \gt t_{2}^{*}
\end{cases}
\end{eqnarray}
\begin{eqnarray}
q(t) & = & \begin{cases}
\frac{\lambda-\mu c+\theta c}{\theta}+\left(q(0)-\frac{\lambda-\mu c+\theta c}{\theta}\right)e^{-\theta t} & \text{if }q(0) \gt c,\lambda \gt \mu c\\
\frac{\lambda-\mu c+\theta c}{\theta}+\left(q(0)-\frac{\lambda-\mu c+\theta c}{\theta}\right)e^{-\theta t}, & \text{if }q(0) \gt c,\lambda\leq\mu c,t\leq t_{1}^{*}\\
\frac{\lambda}{\mu}+\left(c-\frac{\lambda}{\mu}\right)e^{-\mu(t-t^{*})}, & \text{if }q(0) \gt c,\lambda\leq\mu c,t \gt t_{1}^{*}\\
\frac{\lambda}{\mu}+\left(q(0)-\frac{\lambda}{\mu}\right)e^{-\mu t} & \text{if }q(0)\leq c,\lambda\leq\mu c\\
\frac{\lambda}{\mu}+\left(q(0)-\frac{\lambda}{\mu}\right)e^{-\mu t}, & \text{if }q(0)\leq c,\lambda \gt \mu c,t\leq t_{2}^{*}\\
\frac{\lambda-\mu c+\theta c}{\theta}+\left(\frac{-\lambda+\mu c}{\theta}\right)e^{-\theta(t-t^{*})}, & \text{if }q(0)\leq c,\lambda \gt \mu c,t \gt t_{2}^{*}
\end{cases}
\end{eqnarray} where  $t_{1}^{*}=\frac{\log\left(\frac{\theta q(0)-\lambda+\mu c-\theta c}{\mu c-\lambda}\right)}{\theta}$ and $t_{2}^{*}=\frac{\log\left(\frac{q(0)-\frac{\lambda}{\mu}}{c-\frac{\lambda}{\mu}}\right)}{\mu}.$
Proof. When  $q(0) \gt c$ and $\lambda \gt \mu c$, we apply Lemma 2.1 to the differential equation given in Eq. (4). When $q(0) \gt c$ and $\lambda\leq\mu c$, from time 0 to time $t_{1}^{*}$ (which is the time that the differential equation hits the value c), we can apply Lemma 2.1 to the differential equation to obtain the solution. After $t_{1}^{*}$, we know the solution is larger than c so that it follows a new differential equation and the solution is also given by Lemma 2.1. The proofs of the other cases are similar, so we omit the details here. This completes the proof.
Now that we have completely described the dynamics of the fluid queue length as a function of time in the previous proposition, hence we can easily obtain the next corollary following Proposition 2.2.
Corollary 2.3. Suppose that  $\lambda(t)$ and $\mu(t)$ are constants, and $q(\infty) = \lim_{t \to \infty} q(t)$. Then we have
 \begin{align*}
q(\infty) & = \begin{cases}
\frac{\lambda-\mu c+\theta c}{\theta} & \text{if }\lambda \gt \mu c\\
\frac{\lambda}{\mu} & \text{if }\lambda\leq\mu c.
\end{cases}
\end{align*}
\begin{align*}
q(\infty) & = \begin{cases}
\frac{\lambda-\mu c+\theta c}{\theta} & \text{if }\lambda \gt \mu c\\
\frac{\lambda}{\mu} & \text{if }\lambda\leq\mu c.
\end{cases}
\end{align*}Proof. The results follow from Proposition 2.2 by letting  $t\to \infty$.
We then turn our attention to analyzing the diffusion variance differential equations. Analyzing the fluid equations first is essential since the diffusion variance differential equations depend on the fluid dynamics in an explicit way.
2.2. Diffusion variance analysis
In this section, we provide an analysis of the diffusion variance differential equations given in Eq. (5). We start with explicit solutions to the diffusion variance equations.
Proposition 2.4. When  $\lambda(t)$ and $\mu(t)$ are constants, the solution v(t) to Eq. (5), is given as follows:
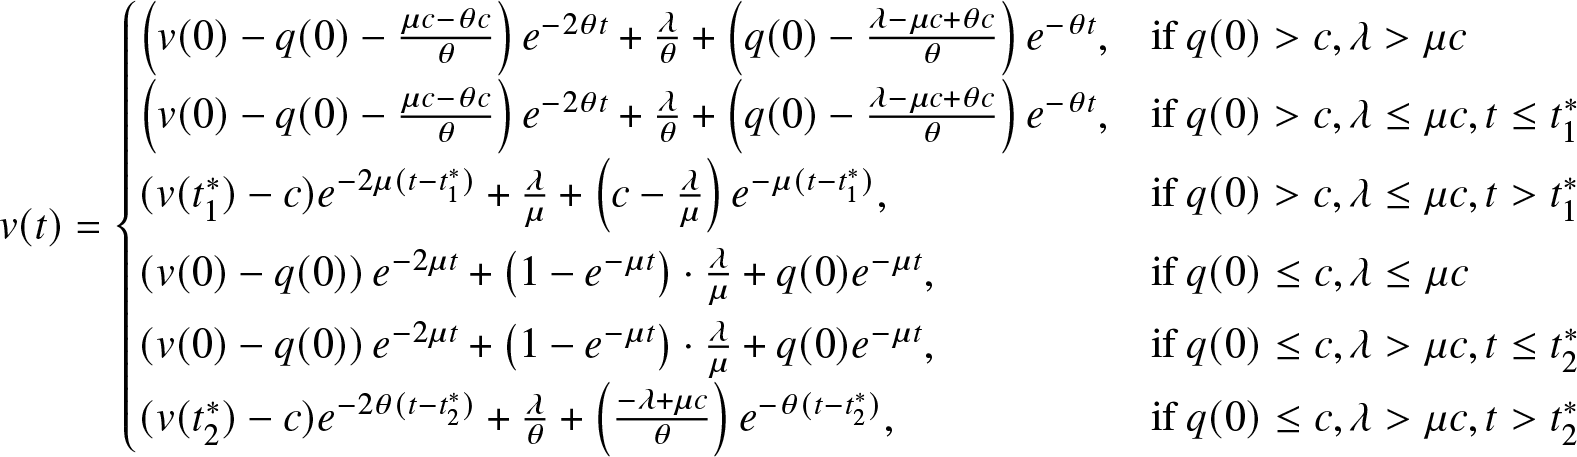 \begin{align}
v(t) = \begin{cases}
\left(v(0)-q(0)-\frac{\mu c-\theta c}{\theta}\right)e^{-2\theta t}+\frac{\lambda}{\theta}+\left(q(0)-\frac{\lambda-\mu c+\theta c}{\theta}\right)e^{-\theta t}, & \mathrm{if}\ q(0) \gt c,\lambda \gt \mu c\\
\left(v(0)-q(0)-\frac{\mu c-\theta c}{\theta}\right)e^{-2\theta t}+\frac{\lambda}{\theta}+\left(q(0)-\frac{\lambda-\mu c+\theta c}{\theta}\right)e^{-\theta t}, & \mathrm{if}\ q(0) \gt c,\lambda\leq\mu c,t\leq t_{1}^{*}\\
(v(t_{1}^{*})-c)e^{-2\mu(t-t_{1}^{*})}+\frac{\lambda}{\mu}+\left(c-\frac{\lambda}{\mu}\right)e^{-\mu(t-t_{1}^{*})}, & \mathrm{if}\ q(0) \gt c,\lambda\leq\mu c,t \gt t_{1}^{*}\\
\left(v(0)-q(0)\right)e^{-2\mu t}+\left(1-e^{-\mu t}\right)\cdot\frac{\lambda}{\mu}+q(0)e^{-\mu t}, & \mathrm{if}\ q(0)\leq c,\lambda\leq\mu c\\
\left(v(0)-q(0)\right)e^{-2\mu t}+\left(1-e^{-\mu t}\right)\cdot\frac{\lambda}{\mu}+q(0)e^{-\mu t}, & \mathrm{if}\ q(0)\leq c,\lambda \gt \mu c,t\leq t_{2}^{*}\\
(v(t_{2}^{*})-c)e^{-2\theta(t-t_{2}^{*})}+\frac{\lambda}{\theta}+\left(\frac{-\lambda+\mu c}{\theta}\right)e^{-\theta(t-t_{2}^{*})}, & \mathrm{if}\ q(0)\leq c,\lambda \gt \mu c,t \gt t_{2}^{*}
\end{cases}
\end{align}
\begin{align}
v(t) = \begin{cases}
\left(v(0)-q(0)-\frac{\mu c-\theta c}{\theta}\right)e^{-2\theta t}+\frac{\lambda}{\theta}+\left(q(0)-\frac{\lambda-\mu c+\theta c}{\theta}\right)e^{-\theta t}, & \mathrm{if}\ q(0) \gt c,\lambda \gt \mu c\\
\left(v(0)-q(0)-\frac{\mu c-\theta c}{\theta}\right)e^{-2\theta t}+\frac{\lambda}{\theta}+\left(q(0)-\frac{\lambda-\mu c+\theta c}{\theta}\right)e^{-\theta t}, & \mathrm{if}\ q(0) \gt c,\lambda\leq\mu c,t\leq t_{1}^{*}\\
(v(t_{1}^{*})-c)e^{-2\mu(t-t_{1}^{*})}+\frac{\lambda}{\mu}+\left(c-\frac{\lambda}{\mu}\right)e^{-\mu(t-t_{1}^{*})}, & \mathrm{if}\ q(0) \gt c,\lambda\leq\mu c,t \gt t_{1}^{*}\\
\left(v(0)-q(0)\right)e^{-2\mu t}+\left(1-e^{-\mu t}\right)\cdot\frac{\lambda}{\mu}+q(0)e^{-\mu t}, & \mathrm{if}\ q(0)\leq c,\lambda\leq\mu c\\
\left(v(0)-q(0)\right)e^{-2\mu t}+\left(1-e^{-\mu t}\right)\cdot\frac{\lambda}{\mu}+q(0)e^{-\mu t}, & \mathrm{if}\ q(0)\leq c,\lambda \gt \mu c,t\leq t_{2}^{*}\\
(v(t_{2}^{*})-c)e^{-2\theta(t-t_{2}^{*})}+\frac{\lambda}{\theta}+\left(\frac{-\lambda+\mu c}{\theta}\right)e^{-\theta(t-t_{2}^{*})}, & \mathrm{if}\ q(0)\leq c,\lambda \gt \mu c,t \gt t_{2}^{*}
\end{cases}
\end{align}where
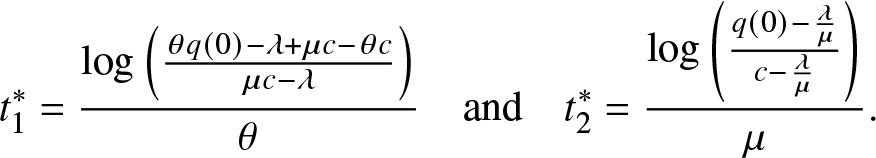 \begin{equation*}
t^*_1 = \frac{\log\left( \frac{\theta q(0) - \lambda + \mu c - \theta c}{\mu c - \lambda} \right)}{\theta} \quad \mathrm{and} \quad t^*_2 = \frac{\log\left( \frac{q(0) - \frac{\lambda}{\mu}}{c - \frac{\lambda}{\mu}} \right)}{\mu}.
\end{equation*}
\begin{equation*}
t^*_1 = \frac{\log\left( \frac{\theta q(0) - \lambda + \mu c - \theta c}{\mu c - \lambda} \right)}{\theta} \quad \mathrm{and} \quad t^*_2 = \frac{\log\left( \frac{q(0) - \frac{\lambda}{\mu}}{c - \frac{\lambda}{\mu}} \right)}{\mu}.
\end{equation*}Proof. See Appendix A.
Now that we have provided an analysis of the transient dynamics of the diffusion variance differential equations, we analyze the steady-state behavior of the diffusion variance differential equation in the following result.
Corollary 2.5. Let v(t) be the solution to Eq. (5), then in steady state, we have
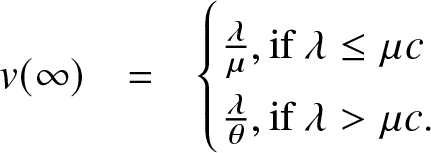 \begin{eqnarray*}
v(\infty) &=& \begin{cases}
\frac{\lambda}{\mu}, \mathrm{if} \ \lambda \leq \mu c \\
\frac{\lambda }{\theta} , \mathrm{if} \ \lambda \gt \mu c .
\end{cases}
\end{eqnarray*}
\begin{eqnarray*}
v(\infty) &=& \begin{cases}
\frac{\lambda}{\mu}, \mathrm{if} \ \lambda \leq \mu c \\
\frac{\lambda }{\theta} , \mathrm{if} \ \lambda \gt \mu c .
\end{cases}
\end{eqnarray*}Proof. The result follows directly from Proposition 2.4 by letting  $t \to \infty$ in Eq. (7).
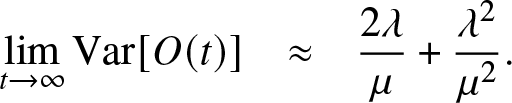
What is apparent from the steady-state variance is that, it is the same as the steady-state mean queue length when  $\lambda \leq \mu c$. This is because, in this regime, the system behaves like an infinite server queue with a Poisson arrival process. Furthermore, when the arrival rate λ is larger than the maximum service rate $\mu c$, the steady-state variance becomes $\lambda/\theta$. This observation is intriguing because when $\theta \lt \mu$, the mean is smaller than the variance, indicating over-dispersion. When $\theta \geq \mu$, the steady-state variance is smaller than the steady-state mean queue length, indicating under-dispersion. For a more detailed discussion on the relationships between mean and variance in the Erlang-A queue, see Daw and Pender [Reference Daw and Pender11].
Now that we have a good understanding of the fluid mean and diffusion variance of the Erlang-A queue, we will show how to use these results in the context of studying overlaps in the Erlang-A queue.
3. The number of overlaps
In this section, we introduce the virtual overlap process, which counts the number of customers that the virtual customer (a hypothetical customer arriving at time t) will overlap with during their time in the queue. This process is crucial from an epidemiological perspective, as it represents the number of individuals who would need to be contact traced for potential exposure if the virtual customer were infectious. For further details, see Kang et al. [Reference Kang, Doroudi, Delasay and Wickeham21], Palomo et al. [Reference Palomo, Pender, Massey and Hampshire37], and Xu et al. [Reference Jin, Young Myoung, Kong and Pender48].
Similar to the infinite server setting, the virtual customer will overlap with the customers already present in the queue and the customers that arrive during the virtual customer’s service time. However, unlike the infinite server setting, the virtual customer—who we assume does not abandon the queue—must also overlap with customers who arrive during their wait for service. Thus, the total number of overlaps for the virtual customer equals the number of customers present upon their arrival plus those they encounter during their sojourn time in the queue. This number of overlaps can be expressed in terms of the queue length Q(t), the virtual waiting time W(t), and the service time of the virtual customer  $\mathcal{S}$, that is,
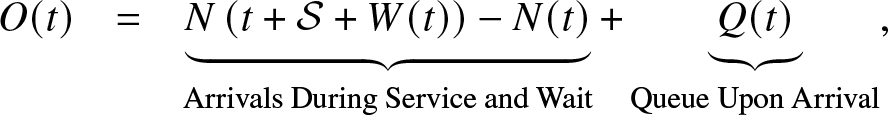 \begin{eqnarray}
O(t) &=& \underbrace{N\left(t+\mathcal{S} + W(t) \right) - N(t)}_{\text{Arrivals During Service and Wait}} + \underbrace{Q(t)}_{\text{Queue Upon Arrival}},
\end{eqnarray}
\begin{eqnarray}
O(t) &=& \underbrace{N\left(t+\mathcal{S} + W(t) \right) - N(t)}_{\text{Arrivals During Service and Wait}} + \underbrace{Q(t)}_{\text{Queue Upon Arrival}},
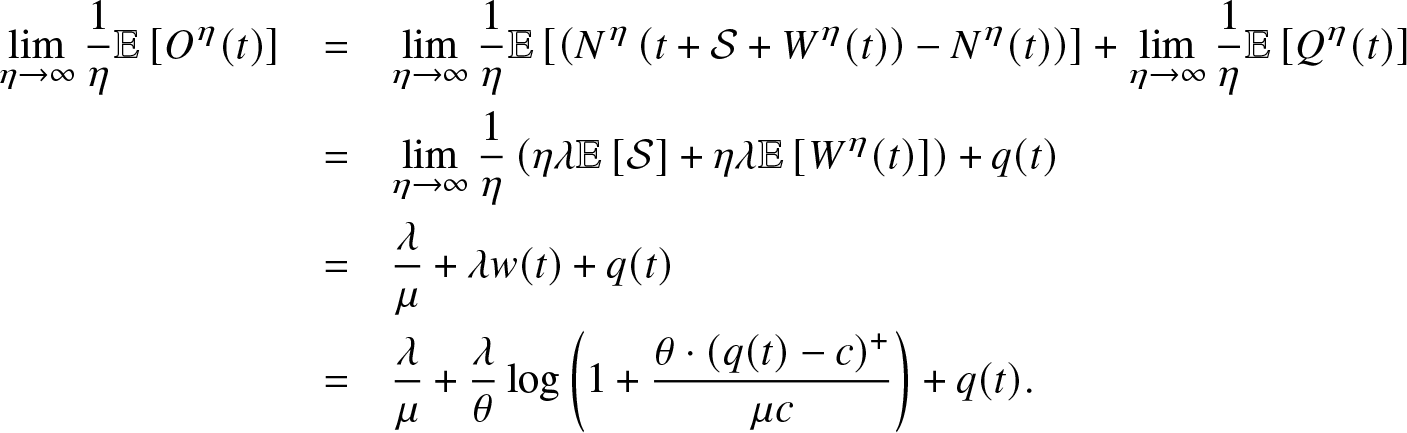
\end{eqnarray}where N(t) denotes the number of arrivals until time t. Using the above representation, we can compute the mean number of overlaps at time t by taking the expectation of the overlap process. Thus, the mean number of overlaps can be written as
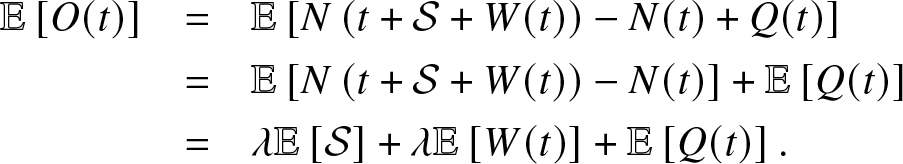 \begin{eqnarray}
\mathbb{E}\left[ O(t) \right] &=&\mathbb{E}\left[ N\left(t+\mathcal{S} + W(t) \right) - N(t) + Q(t) \right] \nonumber \\
&=&\mathbb{E}\left[ N\left(t+\mathcal{S} + W(t) \right) - N(t)\right] + \mathbb{E}\left[ Q(t) \right] \nonumber \\
&=& \lambda \mathbb{E}\left[ \mathcal{S}\right] + \lambda \mathbb{E}\left[ W(t) \right] + \mathbb{E}\left[ Q(t) \right] .
\end{eqnarray}
\begin{eqnarray}
\mathbb{E}\left[ O(t) \right] &=&\mathbb{E}\left[ N\left(t+\mathcal{S} + W(t) \right) - N(t) + Q(t) \right] \nonumber \\
&=&\mathbb{E}\left[ N\left(t+\mathcal{S} + W(t) \right) - N(t)\right] + \mathbb{E}\left[ Q(t) \right] \nonumber \\
&=& \lambda \mathbb{E}\left[ \mathcal{S}\right] + \lambda \mathbb{E}\left[ W(t) \right] + \mathbb{E}\left[ Q(t) \right] .
\end{eqnarray} The last equality of Eq. (9) follows from the fact that the arrival process is Poisson. Unfortunately, the transient mean queue length and the transient mean wait time are not known in closed form for the Erlang-A queue, except in the case, where  $\mu = \theta$. This is a major difference between the Erlang-A and the infinite server queue. In the infinite server queue, the mean wait time is zero and the mean queue can be written as an explicit integral with respect to the service time distribution, see, for example, Eick et al. [Reference Eick, Massey and Whitt14, Reference Eick, Massey and Whitt15]. Consequently, we will use limit theory to approximate the mean number of overlaps.
3.1. The transient mean number of overlaps
In this section, we show how to approximate the transient mean number of overlaps using asymptotic analysis. We first leverage the results of Mandelbaum et al. [Reference Mandelbaum, Massey and Reiman30], which prove almost sure limit theorems for the queue length process in the Halfin–Whitt regime. However, we also need results for the virtual waiting time in order to fully analyze the overlap process. To do this, we will exploit a recent result by Massey and Pender [Reference Massey and Pender32], which proves the following theorem.
Theorem 3.1. Let  $W^{\eta}(t)$ be the virtual wait time of a customer at time t who is not going to abandon, in the scaled process. Then we have
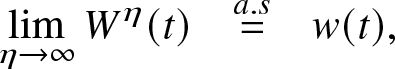 \begin{eqnarray*}
\lim_{\eta \to \infty} W^{\eta}(t) &{\buildrel a.s \over =} & w(t),
\end{eqnarray*}
\begin{eqnarray*}
\lim_{\eta \to \infty} W^{\eta}(t) &{\buildrel a.s \over =} & w(t),
\end{eqnarray*}where w(t) satisfies the following equation
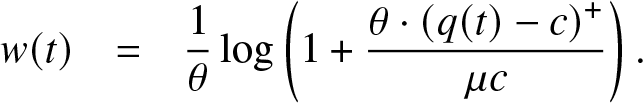 \begin{eqnarray}
w(t) &=& \frac{1}{\theta} \log \left( 1 + \frac{\theta \cdot ( q(t) - c)^+}{\mu c }\right) .
\end{eqnarray}
\begin{eqnarray}
w(t) &=& \frac{1}{\theta} \log \left( 1 + \frac{\theta \cdot ( q(t) - c)^+}{\mu c }\right) .
\end{eqnarray} Moreover, as  $t \to \infty$ we have that when $\lambda \gt \mu c$
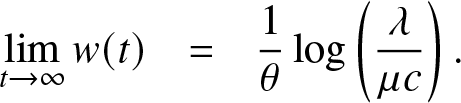 \begin{eqnarray*}
\lim_{t \to \infty} w(t) &=& \frac{1}{\theta} \log \left( \frac{\lambda}{\mu c }\right) .
\end{eqnarray*}
\begin{eqnarray*}
\lim_{t \to \infty} w(t) &=& \frac{1}{\theta} \log \left( \frac{\lambda}{\mu c }\right) .
\end{eqnarray*}Proof. See Theorem 6 of Massey and Pender [Reference Massey and Pender32].
This result shows that the limiting virtual waiting time is a function of the fluid queue length function q(t). When the fluid queue length is less than the number of servers c, then the virtual waiting time is equal to zero. Moreover, when the fluid queue length is greater than the number of servers c, then the virtual waiting time is positive. What is more important is that the fluid limit for the virtual waiting time yields a deterministic function of time. Thus, we are able to approximate the virtual waiting time with a non-random function of time. Now that we have a limiting expression for the virtual waiting time, we can define the scaled overlap process as follows:
 \begin{eqnarray}
O^{\eta}(t) = N^{\eta} \left(t+\mathcal{S} + W^{\eta}(t) \right) - N^{\eta}(t) + Q^{\eta}(t).
\end{eqnarray}
\begin{eqnarray}
O^{\eta}(t) = N^{\eta} \left(t+\mathcal{S} + W^{\eta}(t) \right) - N^{\eta}(t) + Q^{\eta}(t).
\end{eqnarray}We will use the scaled overlap process to prove our main result of the paper, which gives us a deterministic approximation for the transient mean number of overlaps in the Erlang-A queue.
Theorem 3.2. Let  $O^{\eta}(t)$ be the scaled number of people that a customer who arrives at time t will overlap with. Then, we have
 \begin{eqnarray*}
\lim_{\eta \to \infty} \frac{1}{\eta} \mathbb{E} \left[ O^{\eta}(t) \right] &=& \frac{\lambda}{\mu} + \frac{\lambda }{\theta} \log \left( 1 + \frac{\theta \cdot ( q(t) - c)^+}{\mu c }\right) + q(t) ,
\end{eqnarray*}
\begin{eqnarray*}
\lim_{\eta \to \infty} \frac{1}{\eta} \mathbb{E} \left[ O^{\eta}(t) \right] &=& \frac{\lambda}{\mu} + \frac{\lambda }{\theta} \log \left( 1 + \frac{\theta \cdot ( q(t) - c)^+}{\mu c }\right) + q(t) ,
\end{eqnarray*} where q(t) is given in Proposition 2.2. Moreover, when  $t \to \infty$ we have that
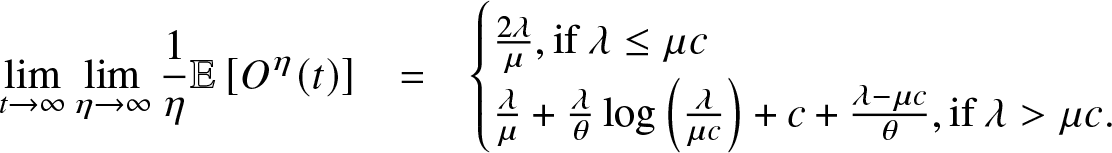 \begin{eqnarray}
\lim_{t \to \infty} \lim_{\eta \to \infty} \frac{1}{\eta} \mathbb{E} \left[ O^{\eta}(t) \right] &=& \begin{cases}
\frac{2\lambda}{\mu} , \mathrm{if} \ \lambda \leq \mu c \\
\frac{\lambda}{\mu} + \frac{\lambda }{\theta} \log \left( \frac{\lambda }{\mu c } \right) + c + \frac{\lambda - \mu c}{\theta} , \mathrm{if} \ \lambda \gt \mu c.
\end{cases}
\end{eqnarray}
\begin{eqnarray}
\lim_{t \to \infty} \lim_{\eta \to \infty} \frac{1}{\eta} \mathbb{E} \left[ O^{\eta}(t) \right] &=& \begin{cases}
\frac{2\lambda}{\mu} , \mathrm{if} \ \lambda \leq \mu c \\
\frac{\lambda}{\mu} + \frac{\lambda }{\theta} \log \left( \frac{\lambda }{\mu c } \right) + c + \frac{\lambda - \mu c}{\theta} , \mathrm{if} \ \lambda \gt \mu c.
\end{cases}
\end{eqnarray}Proof. Based on Eqs. (3), (9), (10), and (11), we have
 \begin{eqnarray*}
\lim_{\eta \to \infty} \frac{1}{\eta} \mathbb{E} \left[ O^{\eta}(t) \right] &=& \lim_{\eta \to \infty}\frac{1}{\eta} \mathbb{E} \left[\left( N^{\eta} \left(t+\mathcal{S}+ W^{\eta}(t) \right) - N^{\eta}(t) \right) \right] + \lim_{\eta \to \infty}\frac{1}{\eta} \mathbb{E} \left[Q^{\eta}(t) \right]\\
&=& \lim_{\eta \to \infty}\frac{1}{\eta} \left( \eta \lambda \mathbb{E} \left[ \mathcal{S} \right] + \eta \lambda \mathbb{E} \left[ W^{\eta}(t) \right] \right) + q(t) \\
&=& \frac{\lambda}{\mu} + \lambda w(t) + q(t) \\
&=& \frac{\lambda}{\mu} + \frac{\lambda }{\theta} \log \left( 1 + \frac{\theta \cdot ( q(t) - c)^+}{\mu c }\right) + q(t) .
\end{eqnarray*}
\begin{eqnarray*}
\lim_{\eta \to \infty} \frac{1}{\eta} \mathbb{E} \left[ O^{\eta}(t) \right] &=& \lim_{\eta \to \infty}\frac{1}{\eta} \mathbb{E} \left[\left( N^{\eta} \left(t+\mathcal{S}+ W^{\eta}(t) \right) - N^{\eta}(t) \right) \right] + \lim_{\eta \to \infty}\frac{1}{\eta} \mathbb{E} \left[Q^{\eta}(t) \right]\\
&=& \lim_{\eta \to \infty}\frac{1}{\eta} \left( \eta \lambda \mathbb{E} \left[ \mathcal{S} \right] + \eta \lambda \mathbb{E} \left[ W^{\eta}(t) \right] \right) + q(t) \\
&=& \frac{\lambda}{\mu} + \lambda w(t) + q(t) \\
&=& \frac{\lambda}{\mu} + \frac{\lambda }{\theta} \log \left( 1 + \frac{\theta \cdot ( q(t) - c)^+}{\mu c }\right) + q(t) .
\end{eqnarray*} In particular, when we look at steady state, we have that when  $\lambda \leq \mu c$,
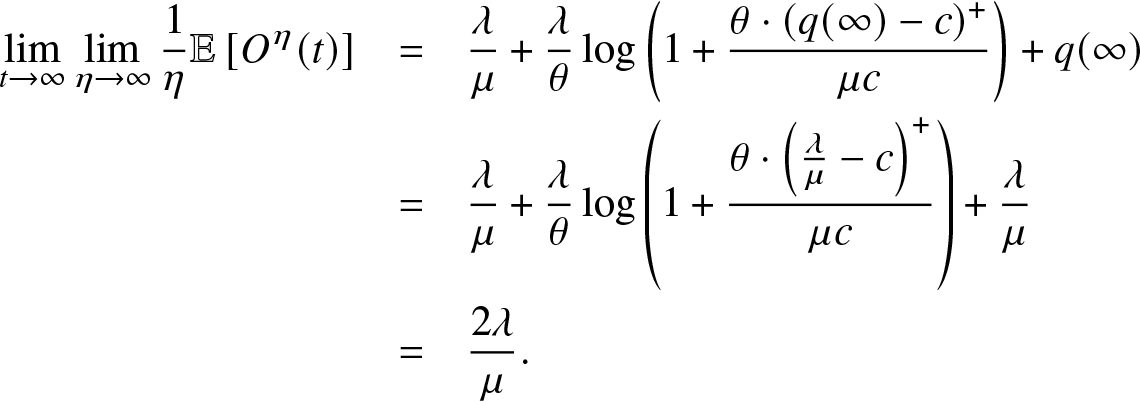 \begin{eqnarray*}
\lim_{t \to \infty} \lim_{\eta \to \infty} \frac{1}{\eta} \mathbb{E} \left[ O^{\eta}(t) \right] &=& \frac{\lambda}{\mu} + \frac{\lambda }{\theta} \log \left( 1 + \frac{\theta \cdot ( q(\infty) - c)^+}{\mu c }\right) + q(\infty) \\
&=& \frac{\lambda}{\mu} + \frac{\lambda }{\theta} \log \left( 1 + \frac{\theta \cdot \left( \frac{\lambda}{\mu} - c \right)^+}{\mu c }\right) + \frac{\lambda}{\mu} \\
&=& \frac{2\lambda}{\mu}.
\end{eqnarray*}
\begin{eqnarray*}
\lim_{t \to \infty} \lim_{\eta \to \infty} \frac{1}{\eta} \mathbb{E} \left[ O^{\eta}(t) \right] &=& \frac{\lambda}{\mu} + \frac{\lambda }{\theta} \log \left( 1 + \frac{\theta \cdot ( q(\infty) - c)^+}{\mu c }\right) + q(\infty) \\
&=& \frac{\lambda}{\mu} + \frac{\lambda }{\theta} \log \left( 1 + \frac{\theta \cdot \left( \frac{\lambda}{\mu} - c \right)^+}{\mu c }\right) + \frac{\lambda}{\mu} \\
&=& \frac{2\lambda}{\mu}.
\end{eqnarray*} When  $\lambda \gt \mu c$, we have
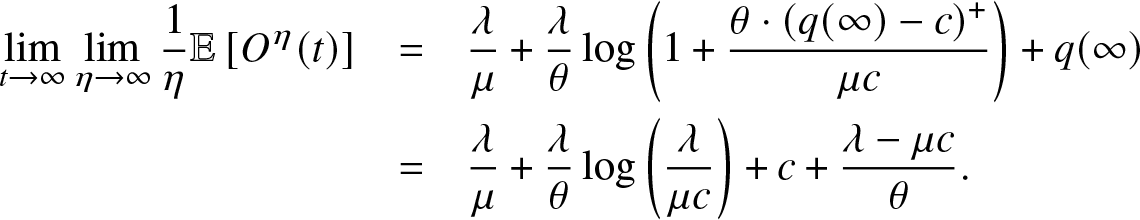 \begin{eqnarray*}
\lim_{t \to \infty} \lim_{\eta \to \infty} \frac{1}{\eta} \mathbb{E} \left[ O^{\eta}(t) \right] &=& \frac{\lambda}{\mu} + \frac{\lambda }{\theta} \log \left( 1 + \frac{\theta \cdot ( q(\infty) - c)^+}{\mu c }\right) + q(\infty) \\
&=& \frac{\lambda}{\mu} + \frac{\lambda }{\theta} \log \left( \frac{\lambda }{\mu c } \right) + c + \frac{\lambda - \mu c}{\theta} .
\end{eqnarray*}
\begin{eqnarray*}
\lim_{t \to \infty} \lim_{\eta \to \infty} \frac{1}{\eta} \mathbb{E} \left[ O^{\eta}(t) \right] &=& \frac{\lambda}{\mu} + \frac{\lambda }{\theta} \log \left( 1 + \frac{\theta \cdot ( q(\infty) - c)^+}{\mu c }\right) + q(\infty) \\
&=& \frac{\lambda}{\mu} + \frac{\lambda }{\theta} \log \left( \frac{\lambda }{\mu c } \right) + c + \frac{\lambda - \mu c}{\theta} .
\end{eqnarray*}This completes the proof.
It is important to note that the expectation for Theorem 3.2 is necessary. Without the expectation the overlap process would explicitly depend on  $\mathcal{S}$ and would be random. It is also worth noting that in the case $\lambda \leq \mu c$, the steady-state mean number of overlaps is equal to $\frac{2\lambda}{\mu}$. This is important from a probability perspective since it is also equal to the steady-state mean number of overlaps in the infinite server queue as well. One should also note that the result does not depend on the staffing level c since it behaves like an infinite server in the steady-state setting.
As we stated earlier, the Erlang-A model is a generalization of multiple queueing systems. We now discuss several special cases of the Erlang-A model in the following based on our results in Theorem 3.2.
Remark 3.3. (M/M/ $\infty$ system): When $c\rightarrow\infty$, all the customers will enter the service directly upon arrival. The system with constant arrival and service rates becomes the M/M/ $\infty$ system. We find from Eq. (12) that the number of overlapped customers will converge to $\frac{2\lambda}{\mu}$. This result matches our analysis in Xu et al. [Reference Jin, Young Myoung, Kong and Pender48]. It is important to distinguish between letting $c \to \infty$ and letting $\theta \to \mu$. Notably, as c approaches infinity, the waiting time converges to zero. Conversely, when θ tends toward µ, the waiting time does not approach zero. Consequently, although the queue lengths are identical and share the same sample path structure, the expected number of overlaps differs between the systems. This observation of the two different systems emphasizes that the number of overlaps is dependent on the customer’s experience instead of only the queue length process. In particular, the customers in the case where $c \to \infty$ all have the same experience in the system, however, in the case where $\theta \to \mu$, abandoning customers have a different overlap experience than those who wait in the queue and then get served. Finally, it is also worth noting that the diffusion limits of the two systems are different, see for example page 167 of Mandelbaum et al. [Reference Mandelbaum, Massey and Reiman30]. This further highlights the difference in the number of overlaps experienced by customers in the two systems.
Remark 3.4. (Erlang-B system): When letting the abandonment rate  $\theta\rightarrow\infty$, we have the Erlang-B system. According to Theorem 3.2, the expected number of people that the virtual customer overlaps in the steady state is $\frac{2\lambda}{\mu}$ when $\lambda\leq\mu c$, and is $\frac{\lambda}{\mu}+c$ when $\lambda \gt \mu c$. The reason is that no customer will wait in the queue, so the virtual customer will always enter the service directly. According to Corollary 2.3, the virtual customer will overlap with $\frac{\lambda}{\mu}$ customers in the system when $\lambda\leq\mu c$, and c customers when $\lambda \gt \mu c$. Moreover, during the service time, the virtual customer is expected to overlap with $\frac{\lambda}{\mu}$ newly arrived customers. Note that although the abandonment rate is infinity, we still assume that every customer will arrive at the system first before abandoning, which explains why the virtual customer will overlap with new arrivals.
Remark 3.5. (Erlang-C system): When shutting off the abandonment process, we have the Erlang-C system. Based on Eq. (12), the number of overlapped customers in the fluid limit becomes  $2\frac{\lambda}{\mu}$ for $\lambda\leq \mu c$. The reason is that the fluid limit of the virtual waiting time becomes 0 in the steady state, according to Theorem 3.1. In the fluid limit, the virtual customer will overlap with $\frac{\lambda}{\mu}$ customers upon arrival, and other $\frac{\lambda}{\mu}$ customers during service.
The transient mean queue length and wait time are not known in closed form. However, if we condition on the queue length, the waiting time distribution is known in closed form for the Erlang-A model. By conditioning on the number of customers ahead of you given that you are waiting, it is easily seen that the waiting time has a hypoexponential distribution, that is,
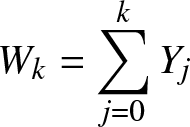 \begin{eqnarray*}
W_k = \sum^{k}_{j=0} Y_j
\end{eqnarray*}
\begin{eqnarray*}
W_k = \sum^{k}_{j=0} Y_j
\end{eqnarray*} where  $Y_j \sim \mathrm{Exp}(\mu c + \theta \cdot j )$ and k is the number of customers that are ahead of the customer upon arrival. Note that j is allowed to be zero when the queue length is identical to the number of servers since in this case, the customer needs to wait an exponential amount of time with rate $\mu c$. With this hypoexponential representation, we can compute the conditional mean and variance of the waiting time. The conditional mean waiting time is
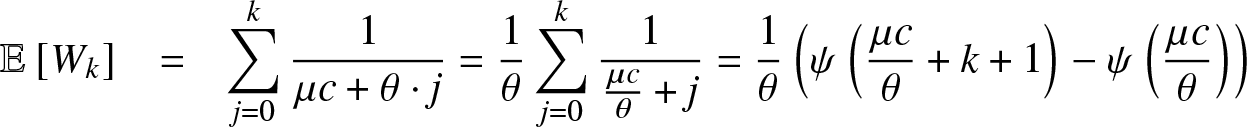 \begin{eqnarray}
\mathbb{E}\left[ W_k \right] &=& \sum^{k}_{j=0} \frac{1}{\mu c + \theta \cdot j } = \frac{1}{\theta} \sum^{k}_{j=0} \frac{1}{\frac{\mu c}{\theta} + j } = \frac{1}{\theta} \left( \psi\left( \frac{\mu c}{\theta} + k+1 \right) - \psi\left( \frac{\mu c}{\theta} \right) \right)
\end{eqnarray}
\begin{eqnarray}
\mathbb{E}\left[ W_k \right] &=& \sum^{k}_{j=0} \frac{1}{\mu c + \theta \cdot j } = \frac{1}{\theta} \sum^{k}_{j=0} \frac{1}{\frac{\mu c}{\theta} + j } = \frac{1}{\theta} \left( \psi\left( \frac{\mu c}{\theta} + k+1 \right) - \psi\left( \frac{\mu c}{\theta} \right) \right)
\end{eqnarray} where  $\psi(x)$ is the digamma function that satisfies $\psi(z+1)-\psi(z)=\frac{1}{z}$. Moreover, since Yi are independent exponential variables, the variance of Wk can be given as
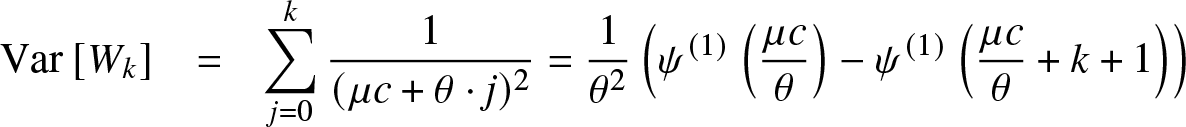 \begin{eqnarray}
\mathrm{Var}\left[ W_k \right] &=& \sum^{k}_{j=0} \frac{1}{(\mu c + \theta \cdot j )^2 }
= \frac{1}{\theta^2} \left( \psi^{(1)}\left( \frac{\mu c}{\theta} \right) - \psi^{(1)}\left( \frac{\mu c}{\theta} + k+1 \right) \right)
\end{eqnarray}
\begin{eqnarray}
\mathrm{Var}\left[ W_k \right] &=& \sum^{k}_{j=0} \frac{1}{(\mu c + \theta \cdot j )^2 }
= \frac{1}{\theta^2} \left( \psi^{(1)}\left( \frac{\mu c}{\theta} \right) - \psi^{(1)}\left( \frac{\mu c}{\theta} + k+1 \right) \right)
\end{eqnarray} where  $\psi^{(1)}(x)$ is the trigamma function that satisfies $\psi^{(1)}(z+1)-\psi^{(1)}(z)=-\frac{1}{z^2}$. One should note that both the digamma and the trigamma functions are special cases of the Hurwitz-Riemann zeta function defined as
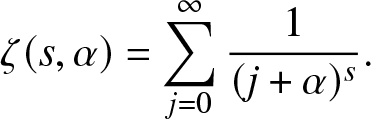 \begin{eqnarray*}
\zeta(s,\alpha) = \sum^{\infty}_{j=0} \frac{1}{(j + \alpha)^s}.
\end{eqnarray*}
\begin{eqnarray*}
\zeta(s,\alpha) = \sum^{\infty}_{j=0} \frac{1}{(j + \alpha)^s}.
\end{eqnarray*}Now that we have explicit expressions for the mean and variance of the waiting time given that there are k customers in front of the current arrival, we should be able to leverage the fluid limits for the queue length process to approximate the mean and variance of the waiting time at any time t.
For a continuously differentiable function f(x), we have from a first-order Taylor expansion around the mean  $\mathbb{E}\left[ Q(t) \right]$ that
 \begin{eqnarray}
f(Q(t)) &\approx& f \left(\mathbb{E}\left[ Q(t) \right] \right) + f' \left(\mathbb{E}\left[ Q(t) \right] \right) \cdot \left( Q(t) - \mathbb{E}\left[ Q(t) \right] \right).
\end{eqnarray}
\begin{eqnarray}
f(Q(t)) &\approx& f \left(\mathbb{E}\left[ Q(t) \right] \right) + f' \left(\mathbb{E}\left[ Q(t) \right] \right) \cdot \left( Q(t) - \mathbb{E}\left[ Q(t) \right] \right).
\end{eqnarray}Thus, taking the expectation on both sides of Eq. (15), the mean of the function can be approximated by
 \begin{eqnarray}
\mathbb{E}\left[ f(Q(t)) \right] &\approx& f \left(\mathbb{E}\left[ Q(t) \right] \right) \approx f \left(q(t)\right).
\end{eqnarray}
\begin{eqnarray}
\mathbb{E}\left[ f(Q(t)) \right] &\approx& f \left(\mathbb{E}\left[ Q(t) \right] \right) \approx f \left(q(t)\right).
\end{eqnarray}Similarly, when taking the variance on both sides of Eq. (15), we can approximate the variance of the function by
 \begin{eqnarray}
\mathrm{Var} \left[f(Q(t)) \right] &\approx& f' \left(\mathbb{E}\left[ Q(t) \right] \right)^2 \cdot \mathrm{Var} \left[ Q(t) \right] \approx f' \left(q(t) \right)^2 \cdot v(t).
\end{eqnarray}
\begin{eqnarray}
\mathrm{Var} \left[f(Q(t)) \right] &\approx& f' \left(\mathbb{E}\left[ Q(t) \right] \right)^2 \cdot \mathrm{Var} \left[ Q(t) \right] \approx f' \left(q(t) \right)^2 \cdot v(t).
\end{eqnarray}Finally, it is also important to compute the following approximation for the covariance as well since we will need it later for computing the variance of the number of overlaps in the Erlang-A queue.
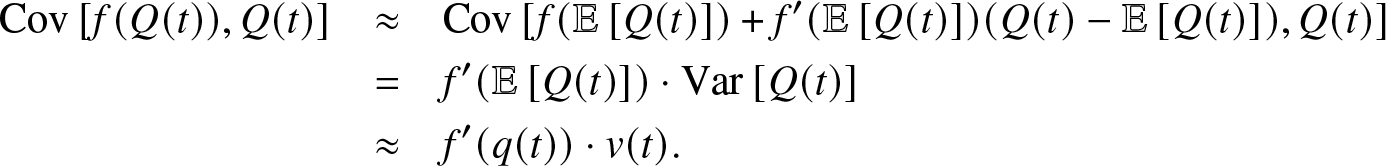 \begin{eqnarray}
\mathrm{Cov}\left[ f(Q(t)), Q(t) \right] &\approx& \mathrm{Cov}\left[ f(\mathbb{E}\left[ Q(t) \right]) + f'(\mathbb{E}\left[ Q(t) \right]) ( Q(t) - \mathbb{E}\left[ Q(t) \right]), Q(t) \right] \nonumber \\
&=& f'(\mathbb{E}\left[ Q(t) \right]) \cdot \mathrm{Var}\left[ Q(t) \right] \nonumber\\
&\approx& f'(q(t)) \cdot v(t).
\end{eqnarray}
\begin{eqnarray}
\mathrm{Cov}\left[ f(Q(t)), Q(t) \right] &\approx& \mathrm{Cov}\left[ f(\mathbb{E}\left[ Q(t) \right]) + f'(\mathbb{E}\left[ Q(t) \right]) ( Q(t) - \mathbb{E}\left[ Q(t) \right]), Q(t) \right] \nonumber \\
&=& f'(\mathbb{E}\left[ Q(t) \right]) \cdot \mathrm{Var}\left[ Q(t) \right] \nonumber\\
&\approx& f'(q(t)) \cdot v(t).
\end{eqnarray}It is worth mentioning that the covariance result is well-known in physics as the linear noise approximation. We will show in the sequel how to use these approximations for estimating the mean and variance of the waiting time for the Erlang-A queue. We will also find that these approximations of the waiting time are essential for computing the mean and variance of the number of overlaps in the Erlang-A queue as well.
Combining Eqs. (13) and (16), we obtain the following expression as an approximation for the mean waiting time
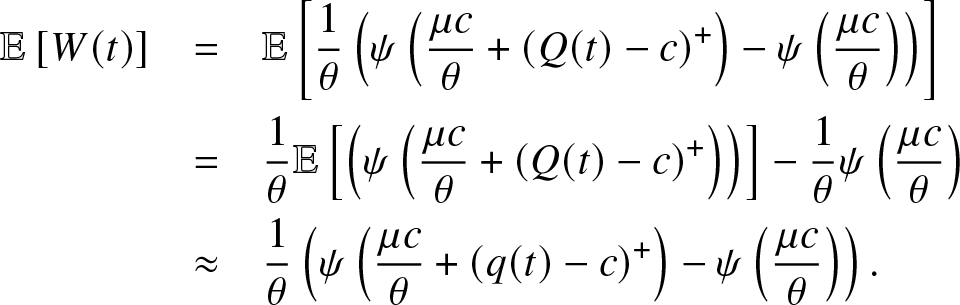 \begin{eqnarray}
\mathbb{E}\left[ W(t) \right] &=& \mathbb{E} \left[ \frac{1}{\theta} \left( \psi\left( \frac{\mu c}{\theta} + (Q(t) - c)^+ \right) - \psi\left( \frac{\mu c}{\theta} \right) \right) \right] \nonumber \\
&=& \frac{1}{\theta} \mathbb{E} \left[ \left( \psi\left( \frac{\mu c}{\theta} + (Q(t) - c)^+ \right) \right) \right] - \frac{1}{\theta} \psi\left( \frac{\mu c}{\theta} \right)\nonumber \\
&\approx& \frac{1}{\theta} \left( \psi\left( \frac{\mu c}{\theta} + (q(t) - c )^+ \right) - \psi\left( \frac{\mu c}{\theta} \right) \right) .
\end{eqnarray}
\begin{eqnarray}
\mathbb{E}\left[ W(t) \right] &=& \mathbb{E} \left[ \frac{1}{\theta} \left( \psi\left( \frac{\mu c}{\theta} + (Q(t) - c)^+ \right) - \psi\left( \frac{\mu c}{\theta} \right) \right) \right] \nonumber \\
&=& \frac{1}{\theta} \mathbb{E} \left[ \left( \psi\left( \frac{\mu c}{\theta} + (Q(t) - c)^+ \right) \right) \right] - \frac{1}{\theta} \psi\left( \frac{\mu c}{\theta} \right)\nonumber \\
&\approx& \frac{1}{\theta} \left( \psi\left( \frac{\mu c}{\theta} + (q(t) - c )^+ \right) - \psi\left( \frac{\mu c}{\theta} \right) \right) .
\end{eqnarray}Moreover, the first-order Taylor expansion also yields the following approximation for the variance of the waiting time
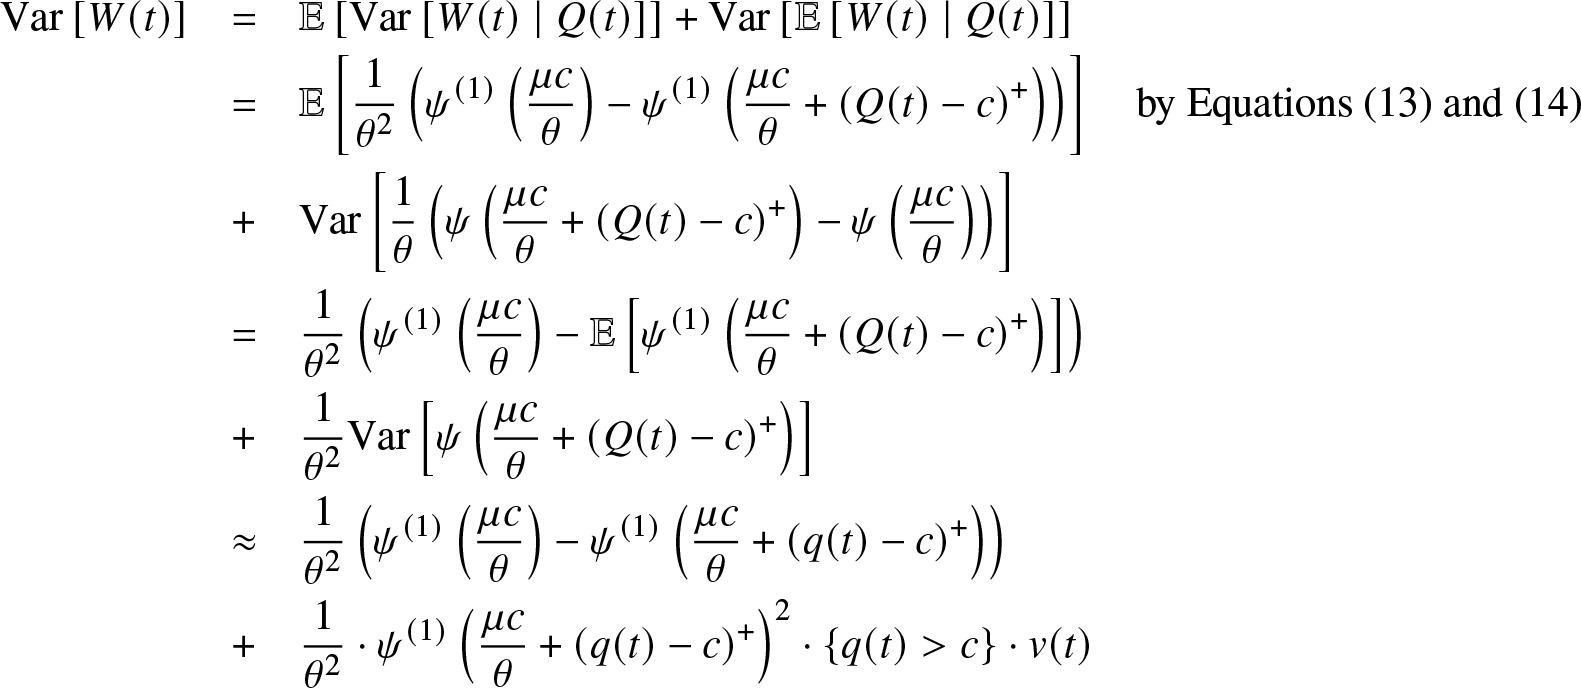 \begin{eqnarray}
\mathrm{Var}\left[ W(t) \right] &=& \mathbb{E} \left[ \mathrm{Var} \left[ W(t) \mid Q(t) \right] \right] +\mathrm{Var} \left[ \mathbb{E} \left[ W(t) \mid Q(t) \right] \right] \nonumber \\
&=& \mathbb{E} \left[ \frac{1}{\theta^2} \left( \psi^{(1)}\left( \frac{\mu c}{\theta} \right) - \psi^{(1)}\left( \frac{\mu c}{\theta} + (Q(t) - c)^+ \right) \right) \right] \quad \text{by Equations (13) and (14)} \nonumber \\
&+& \mathrm{Var} \left[ \frac{1}{\theta} \left( \psi\left( \frac{\mu c}{\theta} + (Q(t) - c)^+ \right) - \psi\left( \frac{\mu c}{\theta} \right) \right)\right] \nonumber \\
&=& \frac{1}{\theta^2} \left( \psi^{(1)}\left( \frac{\mu c}{\theta} \right) - \mathbb{E} \left[ \psi^{(1)}\left( \frac{\mu c}{\theta} + (Q(t) - c)^+ \right) \right] \right)\nonumber \\
&+& \frac{1}{\theta^2} \mathrm{Var} \left[ \psi\left( \frac{\mu c}{\theta} + (Q(t) - c)^+ \right) \right] \nonumber \\
&\approx& \frac{1}{\theta^2} \left( \psi^{(1)}\left( \frac{\mu c}{\theta} \right) - \psi^{(1)}\left( \frac{\mu c}{\theta} + (q(t) - c)^+ \right) \right) \nonumber \\
&+& \frac{1}{\theta^2} \cdot \psi^{(1)}\left( \frac{\mu c}{\theta} + (q(t) - c)^+ \right)^2 \cdot \{q(t) \gt c \} \cdot v(t)
\end{eqnarray}
\begin{eqnarray}
\mathrm{Var}\left[ W(t) \right] &=& \mathbb{E} \left[ \mathrm{Var} \left[ W(t) \mid Q(t) \right] \right] +\mathrm{Var} \left[ \mathbb{E} \left[ W(t) \mid Q(t) \right] \right] \nonumber \\
&=& \mathbb{E} \left[ \frac{1}{\theta^2} \left( \psi^{(1)}\left( \frac{\mu c}{\theta} \right) - \psi^{(1)}\left( \frac{\mu c}{\theta} + (Q(t) - c)^+ \right) \right) \right] \quad \text{by Equations (13) and (14)} \nonumber \\
&+& \mathrm{Var} \left[ \frac{1}{\theta} \left( \psi\left( \frac{\mu c}{\theta} + (Q(t) - c)^+ \right) - \psi\left( \frac{\mu c}{\theta} \right) \right)\right] \nonumber \\
&=& \frac{1}{\theta^2} \left( \psi^{(1)}\left( \frac{\mu c}{\theta} \right) - \mathbb{E} \left[ \psi^{(1)}\left( \frac{\mu c}{\theta} + (Q(t) - c)^+ \right) \right] \right)\nonumber \\
&+& \frac{1}{\theta^2} \mathrm{Var} \left[ \psi\left( \frac{\mu c}{\theta} + (Q(t) - c)^+ \right) \right] \nonumber \\
&\approx& \frac{1}{\theta^2} \left( \psi^{(1)}\left( \frac{\mu c}{\theta} \right) - \psi^{(1)}\left( \frac{\mu c}{\theta} + (q(t) - c)^+ \right) \right) \nonumber \\
&+& \frac{1}{\theta^2} \cdot \psi^{(1)}\left( \frac{\mu c}{\theta} + (q(t) - c)^+ \right)^2 \cdot \{q(t) \gt c \} \cdot v(t)
\end{eqnarray}The last approximation of the above equation follows from Eqs. (16) and (17). Note that in the above approximation, we have replaced the value k in the conditional mean and variance formulas in Eqs. (13) and (14) with the fluid limit queue length at time t.
3.2. The transient variance of the number of overlaps
In addition to the mean, we are also interested in approximating the variance of the number of overlaps. With the variance, we are able to understand the variation around our approximations of the mean. This implies that we can construct prediction intervals for the number of overlaps one might expect at any time t. Using (8), note that the overlap process satisfies the following equation
 \begin{eqnarray*}
O(t) = N\left(t+\mathcal{S} + W(t) \right) - N(t) + Q(t).
\end{eqnarray*}
\begin{eqnarray*}
O(t) = N\left(t+\mathcal{S} + W(t) \right) - N(t) + Q(t).
\end{eqnarray*}Thus, the variance of the number of overlaps is given in the following lemma.
Lemma 3.6. The variance of the number of overlaps is equivalent to the following expression
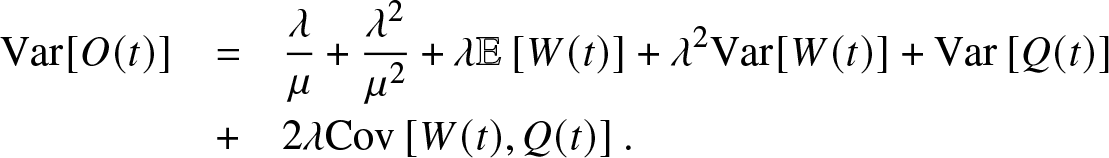 \begin{eqnarray*}
\mathrm{Var}[O(t)] &=& \frac{\lambda}{\mu} + \frac{\lambda^2}{\mu^2} + \lambda \mathbb{E}\left[ W(t) \right] + \lambda^2 \mathrm{Var}[ W(t) ] + \mathrm{Var}\left[ Q(t) \right] \\
&+& 2 \lambda \mathrm{Cov}\left[ W(t) , Q(t) \right].
\end{eqnarray*}
\begin{eqnarray*}
\mathrm{Var}[O(t)] &=& \frac{\lambda}{\mu} + \frac{\lambda^2}{\mu^2} + \lambda \mathbb{E}\left[ W(t) \right] + \lambda^2 \mathrm{Var}[ W(t) ] + \mathrm{Var}\left[ Q(t) \right] \\
&+& 2 \lambda \mathrm{Cov}\left[ W(t) , Q(t) \right].
\end{eqnarray*}Proof. See Appendix B.
The exact variance of both W(t) and Q(t) and their covariance are unknown. Fortunately, because of the fluid and diffusion limits, we have approximations for the mean and variance of the queue length and waiting times. Thus, it remains for us to derive a transient approximation for the covariance between the waiting time and the queue length at time t. In order to compute the covariance of the two processes, we use a conditioning argument based on the queue length, which is natural given the conditional mean waiting time formula of Eq. (13). We outline this argument below.
Lemma 3.7. The covariance of the waiting time process and the queue length process has the following expression in terms of the queue length process
 \begin{eqnarray}
\mathrm{Cov}\left[ W(t), Q(t) \right] &=& \mathrm{Cov}\left[ \psi\left(\frac{\mu c}{\theta} + (Q(t)-c)^+ \right) , Q(t) \right]
\end{eqnarray}
\begin{eqnarray}
\mathrm{Cov}\left[ W(t), Q(t) \right] &=& \mathrm{Cov}\left[ \psi\left(\frac{\mu c}{\theta} + (Q(t)-c)^+ \right) , Q(t) \right]
\end{eqnarray}Proof. See Appendix C.
Based on Lemma 3.7, we exploit the Taylor expansion for the covariance as Eq. (18), we have that
 \begin{eqnarray}
\mathrm{Cov}\left[ W(t), Q(t) \right]
&\approx& v(t) \cdot \psi^{(1)} \left(\frac{\mu c}{\theta} + (q(t)-c)^+ \right) \cdot \{q(t) \gt c \},
\end{eqnarray}
\begin{eqnarray}
\mathrm{Cov}\left[ W(t), Q(t) \right]
&\approx& v(t) \cdot \psi^{(1)} \left(\frac{\mu c}{\theta} + (q(t)-c)^+ \right) \cdot \{q(t) \gt c \},
\end{eqnarray}which provides an approximation for the covariance of the waiting time and the queue length process.
Based on Lemma 3.6, we now apply Eq. (19) digamma to approximate the expectation of waiting time, Eq. (20) to approximate the variance of waiting time, Eq. (22) to approximate the covariance between waiting time and queue length, and the diffusion variance of the solution to Eq. (5) to approximate the variance of queue length. We then obtain the approximation of the transient variance of the number of overlaps as follows:
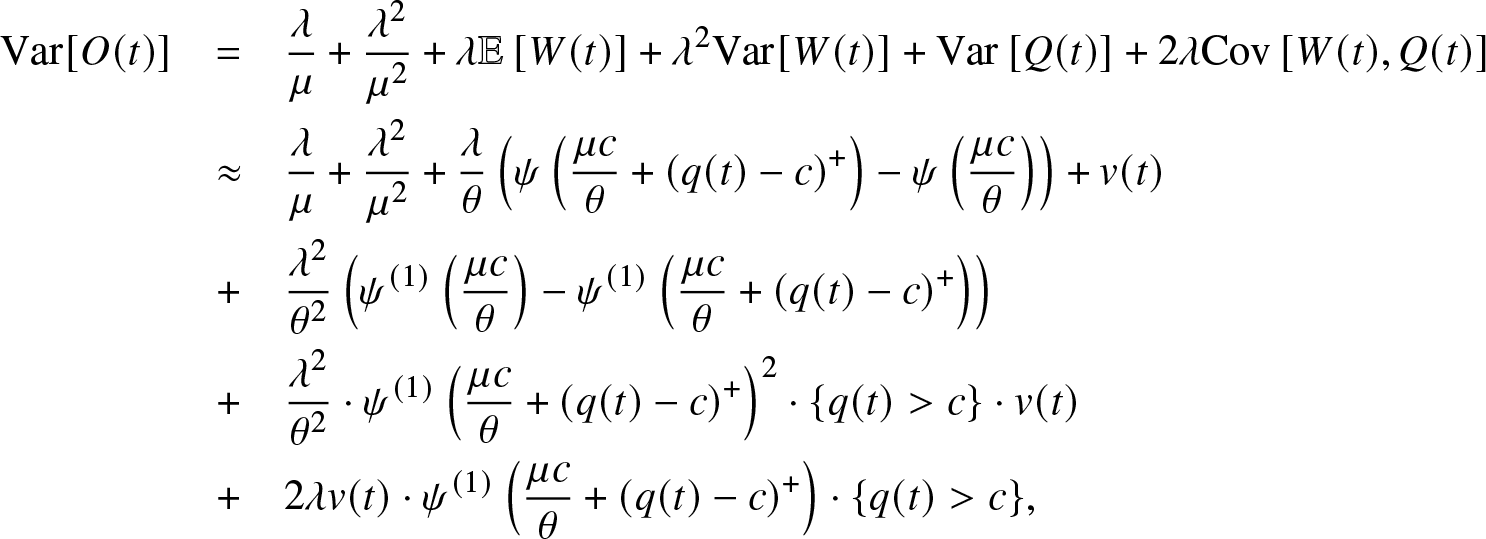 \begin{eqnarray}
\mathrm{Var}[O(t)] &=& \frac{\lambda}{\mu} + \frac{\lambda^2}{\mu^2} + \lambda \mathbb{E}\left[ W(t) \right] + \lambda^2 \mathrm{Var}[ W(t) ] + \mathrm{Var}\left[ Q(t) \right] + 2 \lambda \mathrm{Cov}\left[ W(t) , Q(t) \right]\nonumber \\
&\approx& \frac{\lambda}{\mu} + \frac{\lambda^2}{\mu^2} + \frac{\lambda}{\theta} \left( \psi\left( \frac{\mu c}{\theta} + (q(t) - c)^+ \right) - \psi\left( \frac{\mu c}{\theta} \right) \right) + v(t) \nonumber \\
&+& \frac{\lambda^2 }{\theta^2} \left( \psi^{(1)}\left( \frac{\mu c}{\theta} \right) - \psi^{(1)}\left( \frac{\mu c}{\theta} + (q(t) - c)^+ \right) \right) \nonumber \\
&+& \frac{\lambda^2}{\theta^2} \cdot \psi^{(1)}\left( \frac{\mu c}{\theta} + (q(t) - c)^+ \right)^2 \cdot \{q(t) \gt c \} \cdot v(t)\nonumber \\
&+& 2 \lambda v(t) \cdot \psi^{(1)} \left(\frac{\mu c}{\theta} + (q(t)-c)^+ \right) \cdot \{q(t) \gt c \},
\end{eqnarray}
\begin{eqnarray}
\mathrm{Var}[O(t)] &=& \frac{\lambda}{\mu} + \frac{\lambda^2}{\mu^2} + \lambda \mathbb{E}\left[ W(t) \right] + \lambda^2 \mathrm{Var}[ W(t) ] + \mathrm{Var}\left[ Q(t) \right] + 2 \lambda \mathrm{Cov}\left[ W(t) , Q(t) \right]\nonumber \\
&\approx& \frac{\lambda}{\mu} + \frac{\lambda^2}{\mu^2} + \frac{\lambda}{\theta} \left( \psi\left( \frac{\mu c}{\theta} + (q(t) - c)^+ \right) - \psi\left( \frac{\mu c}{\theta} \right) \right) + v(t) \nonumber \\
&+& \frac{\lambda^2 }{\theta^2} \left( \psi^{(1)}\left( \frac{\mu c}{\theta} \right) - \psi^{(1)}\left( \frac{\mu c}{\theta} + (q(t) - c)^+ \right) \right) \nonumber \\
&+& \frac{\lambda^2}{\theta^2} \cdot \psi^{(1)}\left( \frac{\mu c}{\theta} + (q(t) - c)^+ \right)^2 \cdot \{q(t) \gt c \} \cdot v(t)\nonumber \\
&+& 2 \lambda v(t) \cdot \psi^{(1)} \left(\frac{\mu c}{\theta} + (q(t)-c)^+ \right) \cdot \{q(t) \gt c \},
\end{eqnarray} where v(t) is given in Proposition 2.4. We can approximate the steady-state variance by setting  $ t \to \infty$. Thus, when $\lambda \gt \mu c $
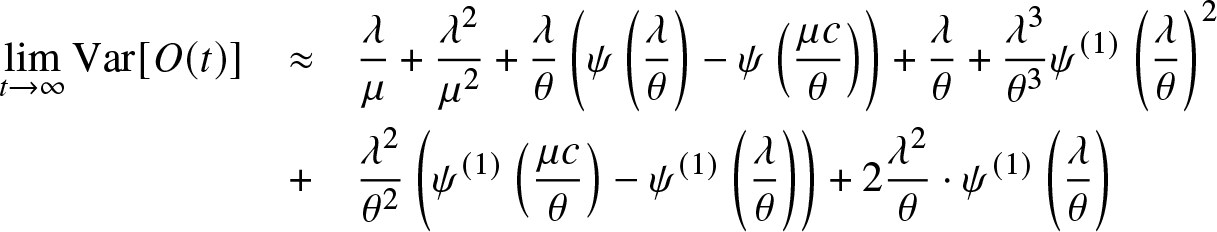 \begin{eqnarray*}
\lim_{t \to \infty} \mathrm{Var}[O(t)] &\approx& \frac{\lambda}{\mu} + \frac{\lambda^2}{\mu^2} + \frac{\lambda}{\theta} \left( \psi\left( \frac{\lambda}{\theta} \right) - \psi\left( \frac{\mu c}{\theta} \right) \right) + \frac{\lambda}{\theta} + \frac{\lambda^3 }{\theta^3} \psi^{(1)}\left( \frac{\lambda}{\theta} \right)^2 \\
&+& \frac{\lambda^2 }{\theta^2} \left( \psi^{(1)}\left( \frac{\mu c}{\theta} \right) - \psi^{(1)}\left( \frac{\lambda}{\theta} \right) \right) + 2 \frac{\lambda^2}{\theta} \cdot \psi^{(1)} \left( \frac{\lambda}{\theta} \right)
\end{eqnarray*}
\begin{eqnarray*}
\lim_{t \to \infty} \mathrm{Var}[O(t)] &\approx& \frac{\lambda}{\mu} + \frac{\lambda^2}{\mu^2} + \frac{\lambda}{\theta} \left( \psi\left( \frac{\lambda}{\theta} \right) - \psi\left( \frac{\mu c}{\theta} \right) \right) + \frac{\lambda}{\theta} + \frac{\lambda^3 }{\theta^3} \psi^{(1)}\left( \frac{\lambda}{\theta} \right)^2 \\
&+& \frac{\lambda^2 }{\theta^2} \left( \psi^{(1)}\left( \frac{\mu c}{\theta} \right) - \psi^{(1)}\left( \frac{\lambda}{\theta} \right) \right) + 2 \frac{\lambda^2}{\theta} \cdot \psi^{(1)} \left( \frac{\lambda}{\theta} \right)
\end{eqnarray*} and when  $\lambda \lt \mu c $
 \begin{eqnarray*}
\lim_{t \to \infty} \mathrm{Var}[O(t)] &\approx& \frac{2\lambda}{\mu} + \frac{\lambda^2}{\mu^2}.
\end{eqnarray*}
\begin{eqnarray*}
\lim_{t \to \infty} \mathrm{Var}[O(t)] &\approx& \frac{2\lambda}{\mu} + \frac{\lambda^2}{\mu^2}.
\end{eqnarray*}It is important to note that the last equation is precisely the same variance of the infinite server queue setting. Thus, when the queue is underloaded, the number of overlaps behaves similarly to an infinite server queue.
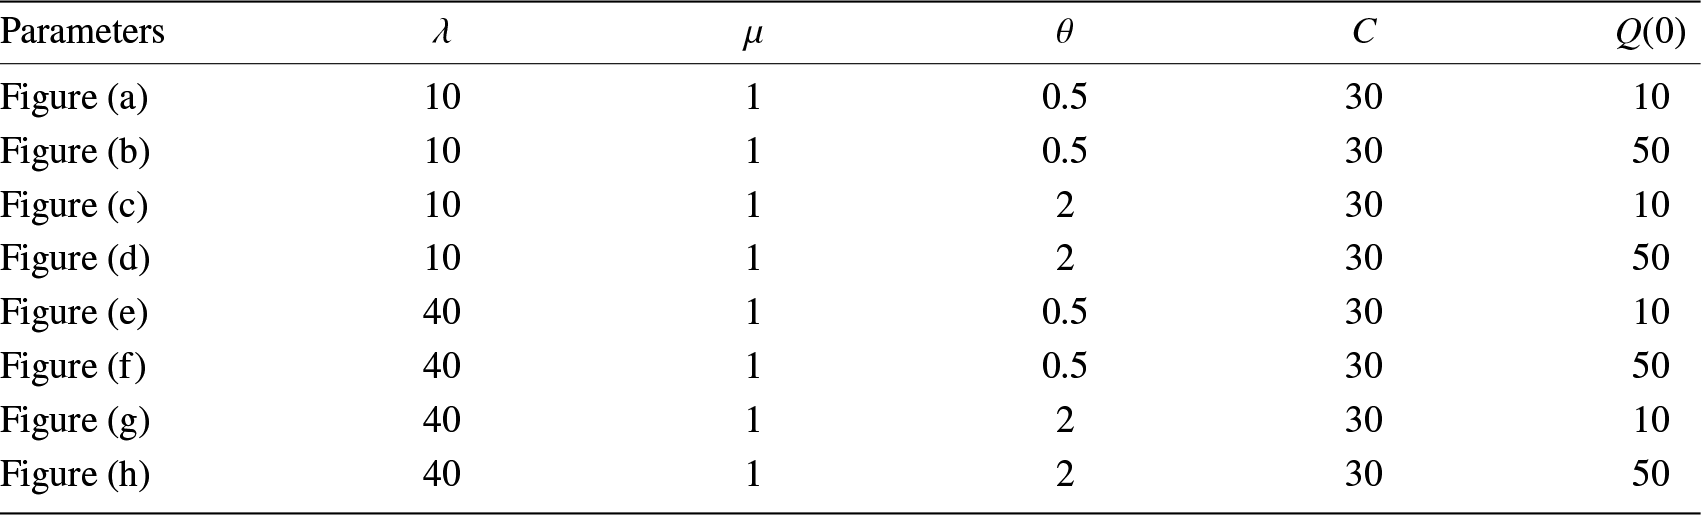
4. Numerical experiments
To understand how our approximations for the mean queue length and the mean number of overlapping customers perform, we present eight different numerical examples below. Before we provide the examples, we list the parameter values for each of the examples in Table 1. In all simulation examples, we simulate the sample paths 10,000 times to produce each curve.
Parameters for examples.
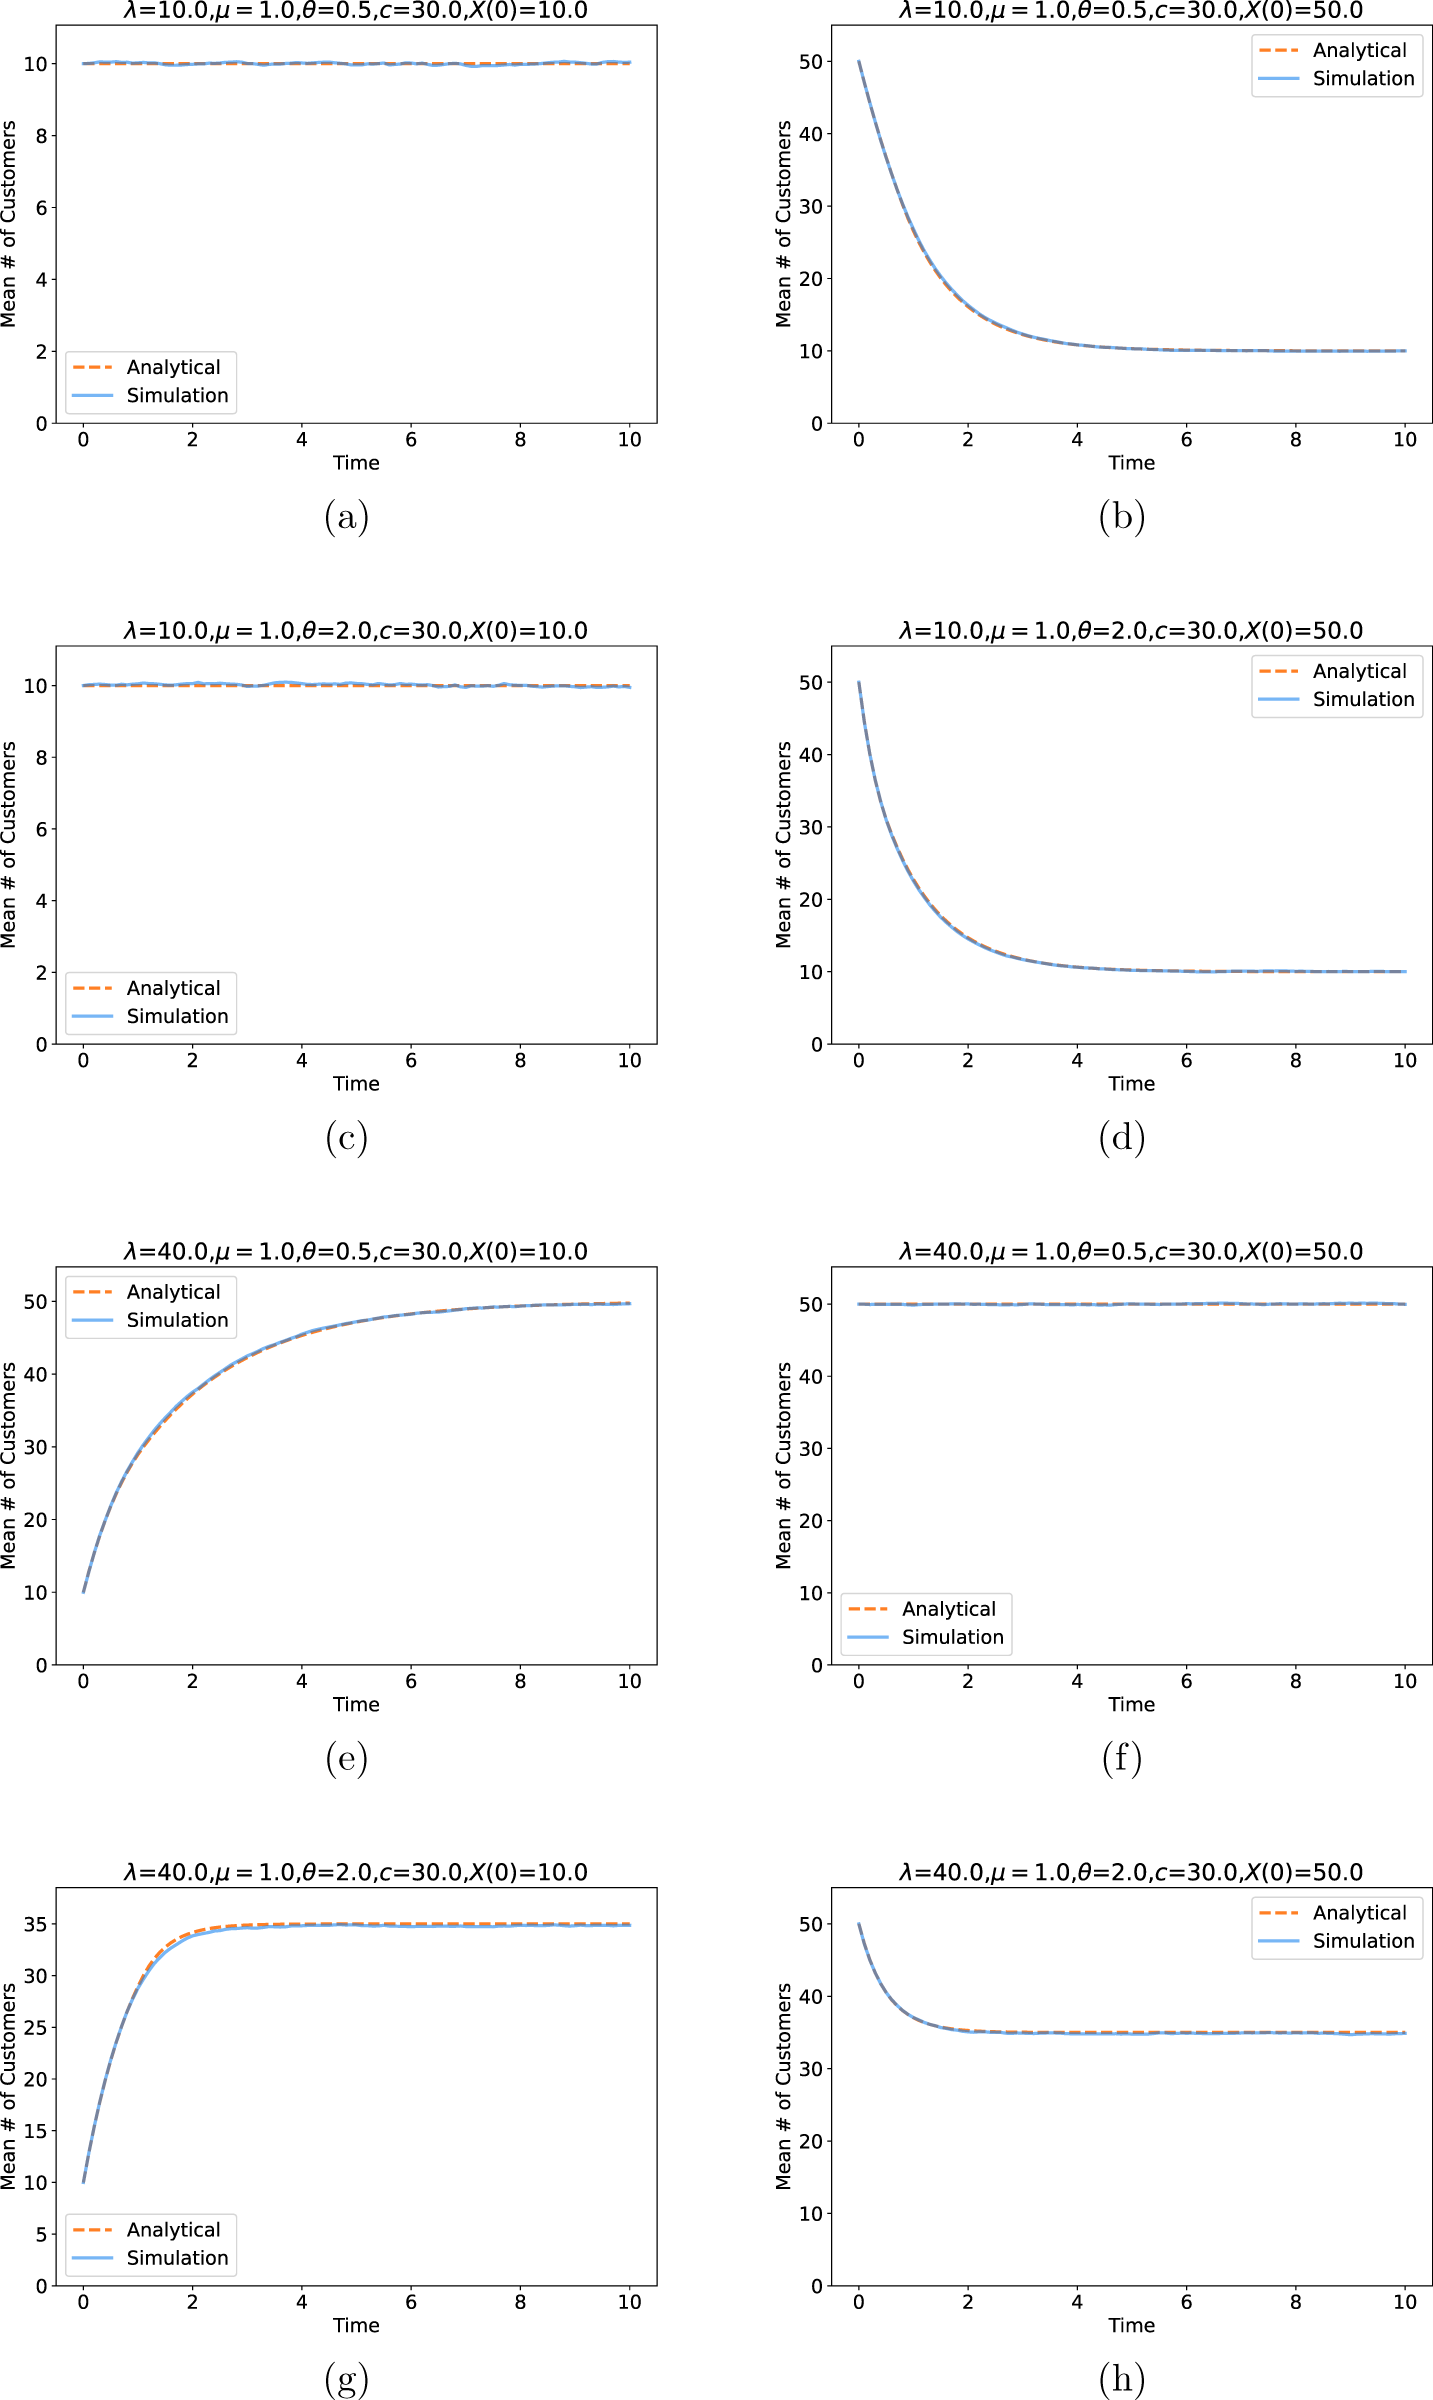
In Figure 2, we present a plot of the simulated mean queue length, which has been approximated by employing the fluid limit as expressed in Eq. (4), denoted as “analytical” in the figures. Our findings indicate that across various parameter settings outlined in Table 1, the fluid approximation consistently and accurately estimates the mean dynamics when juxtaposed with the simulated values. This observation underscores the reliability and effectiveness of the fluid approximation in accurately characterizing the behavior of the mean queue length.
Fluid mean number in system vs. simulation.
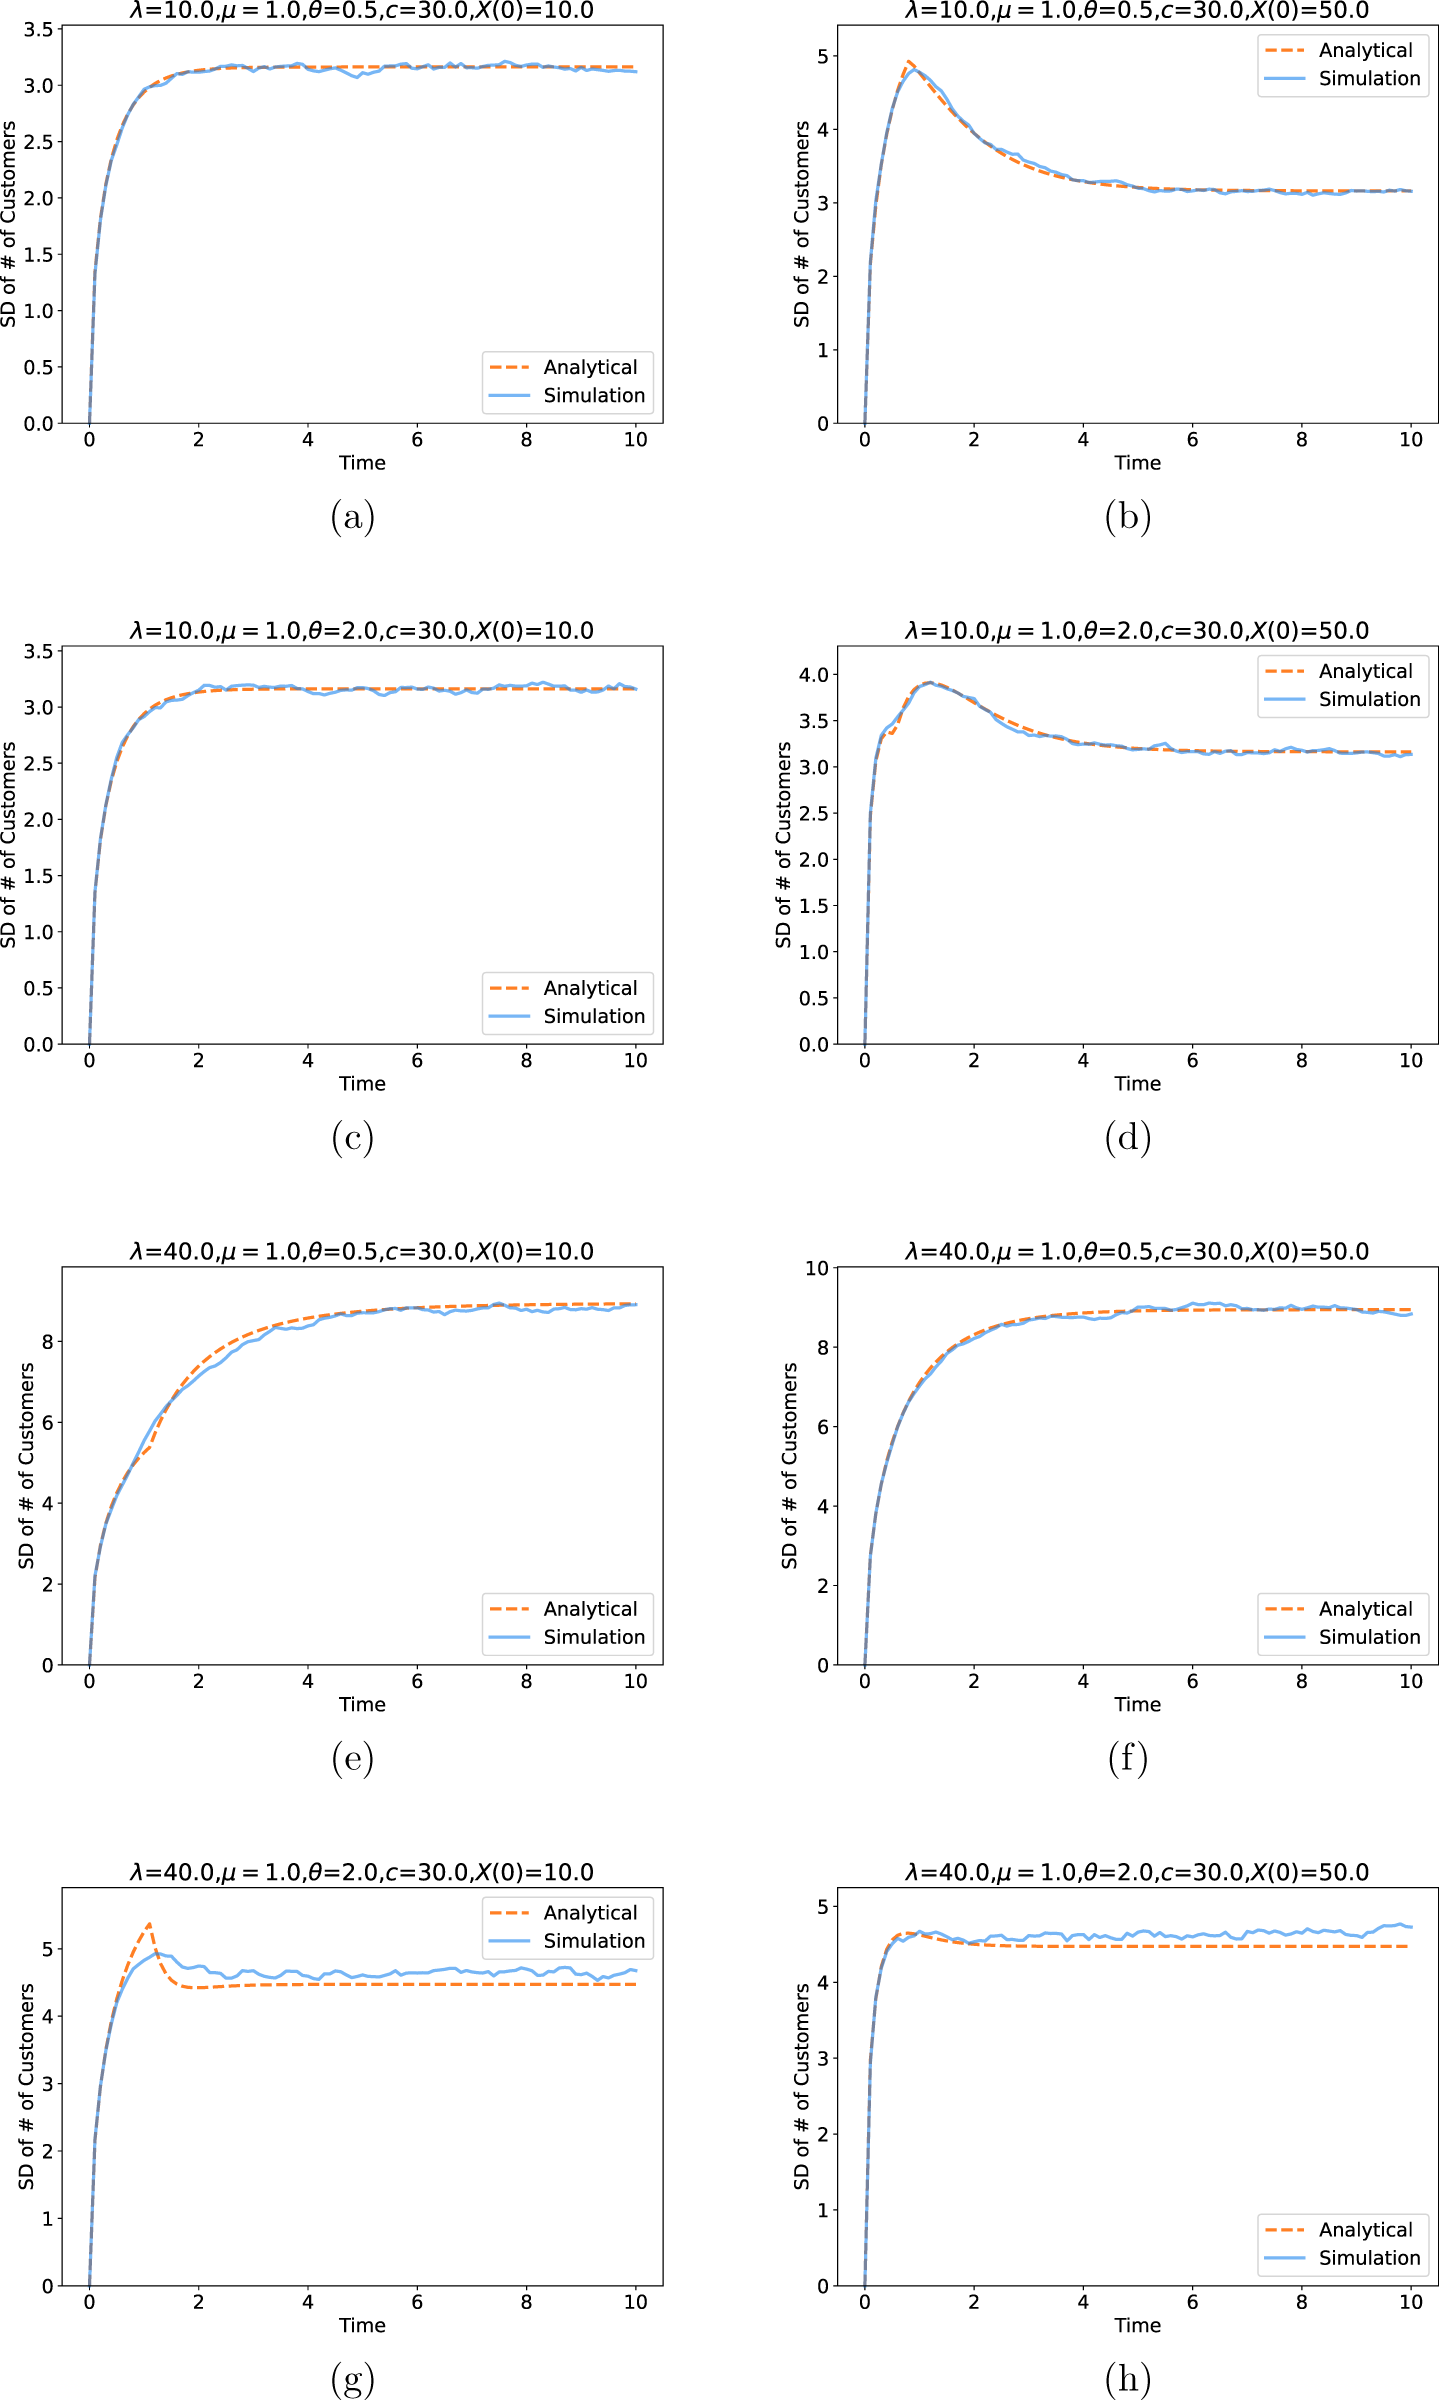
In Figure 3, we plot the standard deviation of the queue length for the parameters outlined in Table 1. We observe that the approximation provided by the diffusion variance, as given in Eq. (5), consistently performs well at approximating the corresponding simulated values, for all of the parameter values. Thus, this illustrates the accuracy of the diffusion variance in effectively approximating the dynamic behavior of the queue length standard deviation. Moreover, with good approximations for the standard deviation, it becomes feasible to construct prediction intervals for the queue length. Such prediction intervals serve as valuable tools for assessing the range within which the actual queue length is likely to fall, providing a measure of confidence in our approximations.
Standard deviation number of customers (analytical vs. simulation).
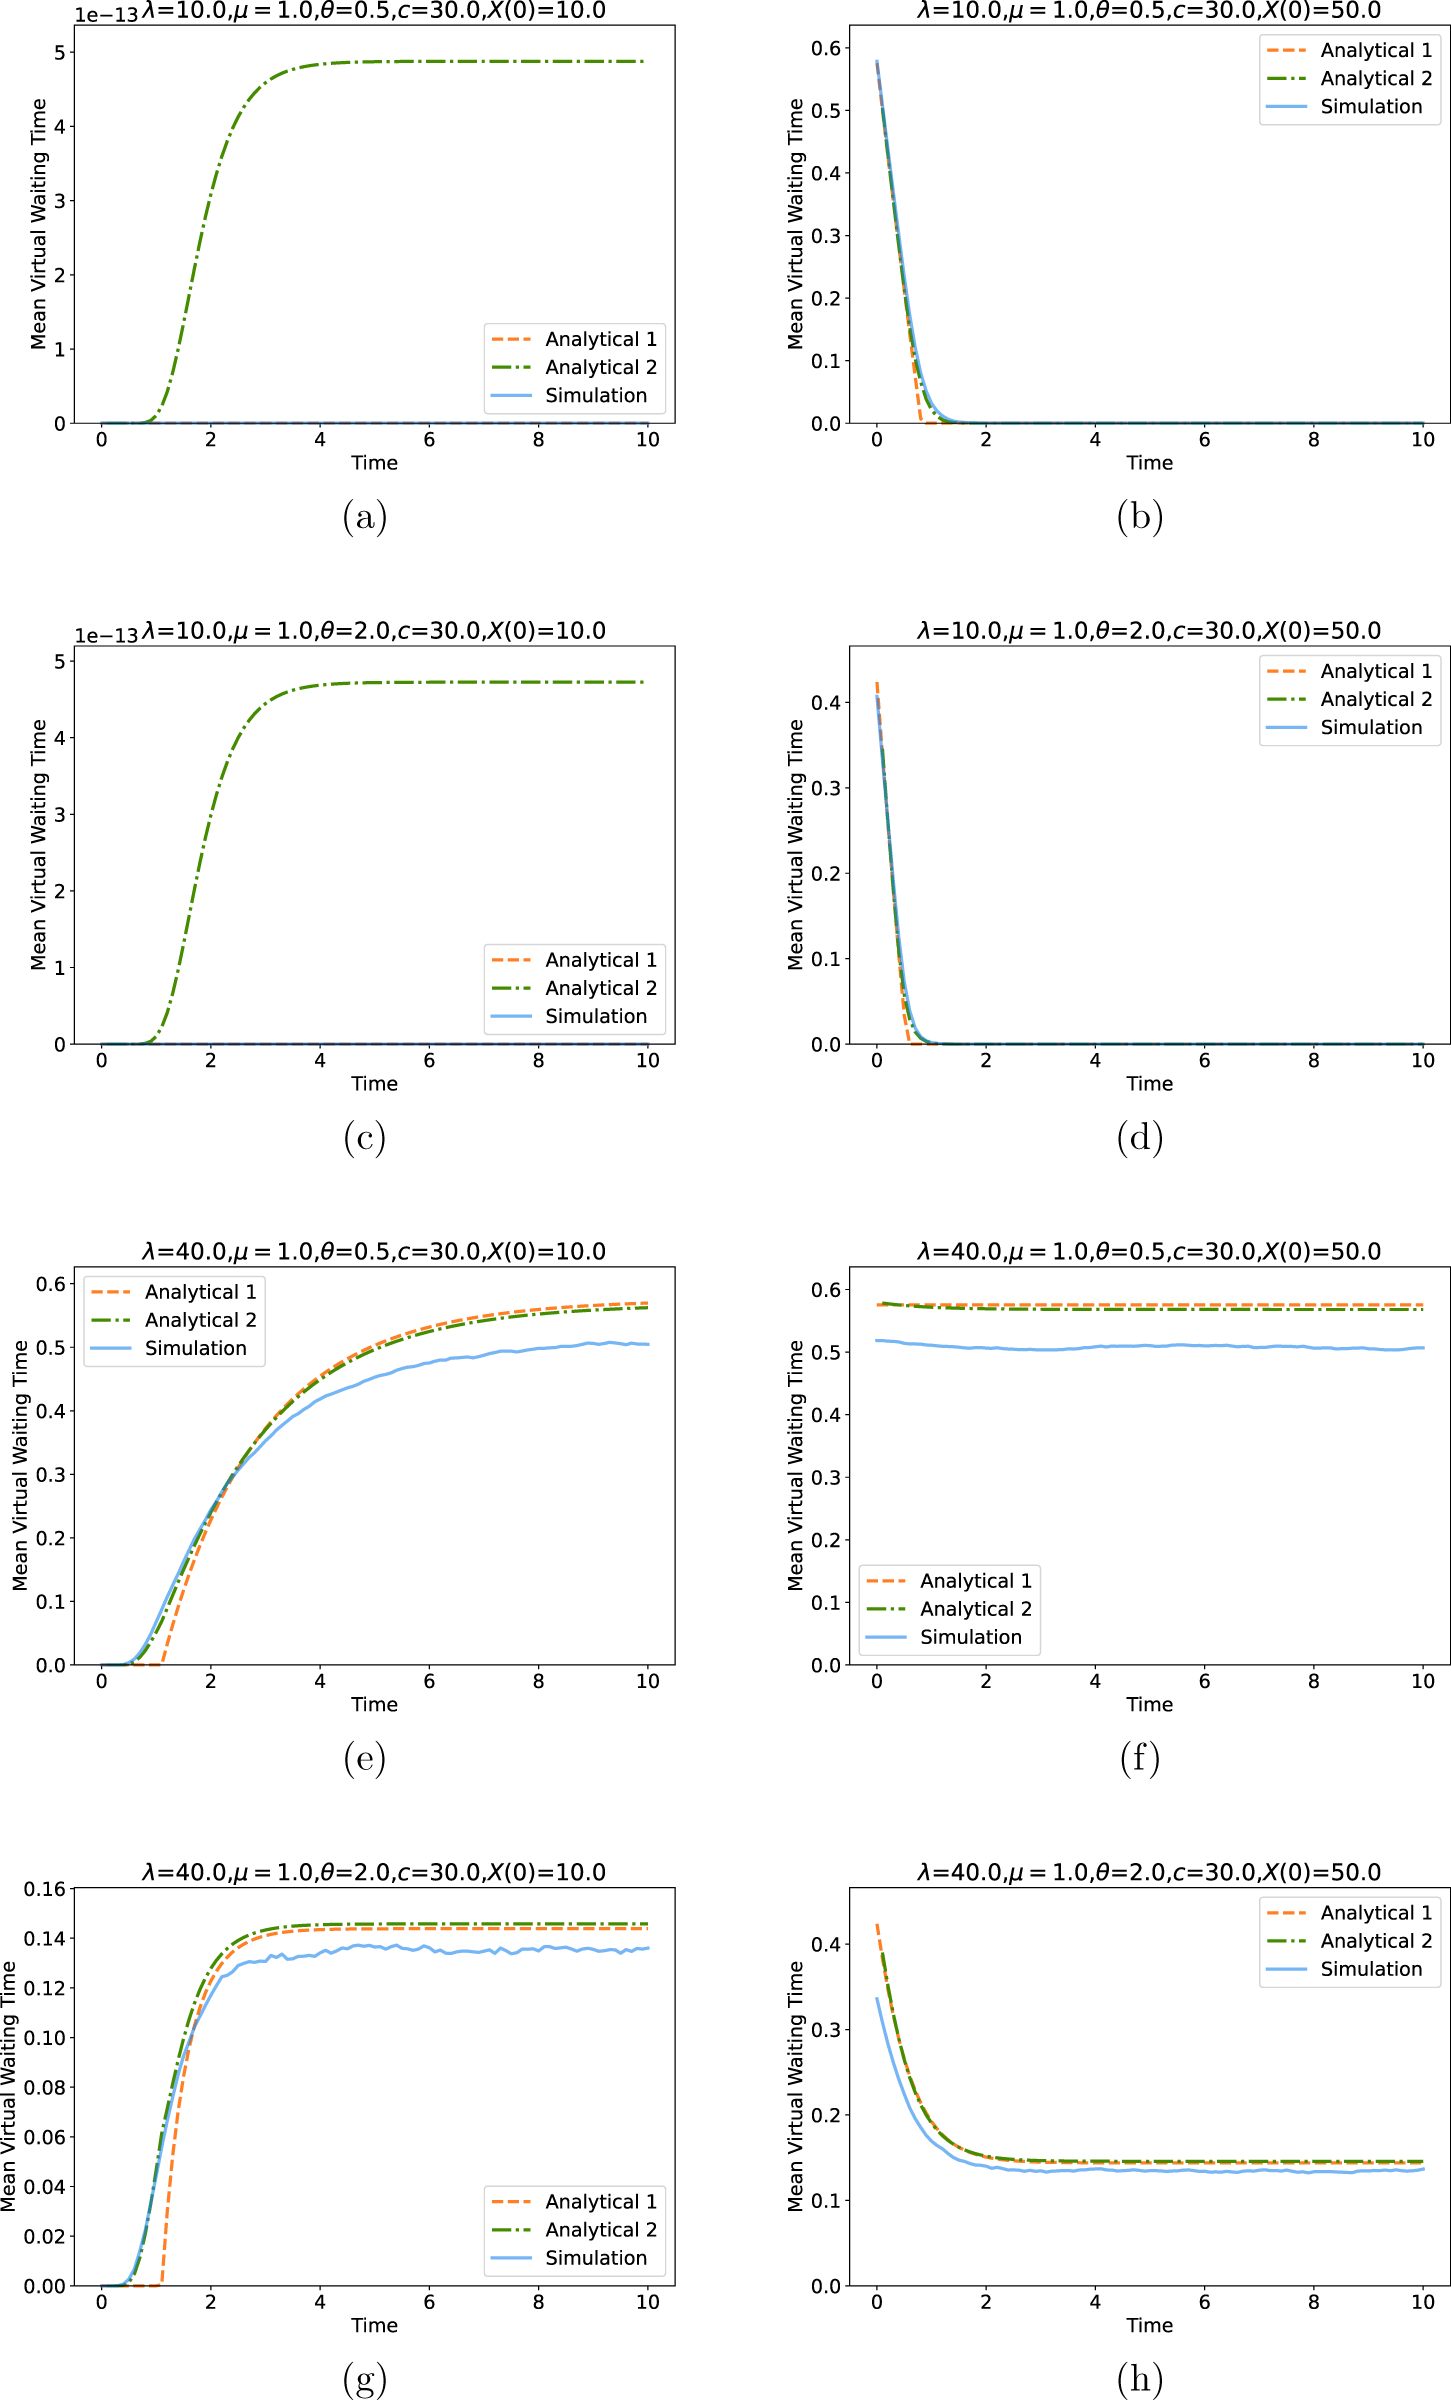
In Figure 4, we plot the simulated mean virtual waiting time with two different approximations. The first approximation, denoted as “analytical 1” in the figures, is derived from the fluid limit, as outlined in Theorem 3.1 and is given in Eq. (10). The second approximation, denoted as “analytical 2” in the figure, is given by Eq. (19), which depends on the digamma function and the fluid queue length. We observe that across all parameter settings provided in Table 1, the approximation employing the digamma function consistently outperforms the fluid-based version in estimating the virtual waiting time.
Mean virtual waiting time (analytical vs. simulation).
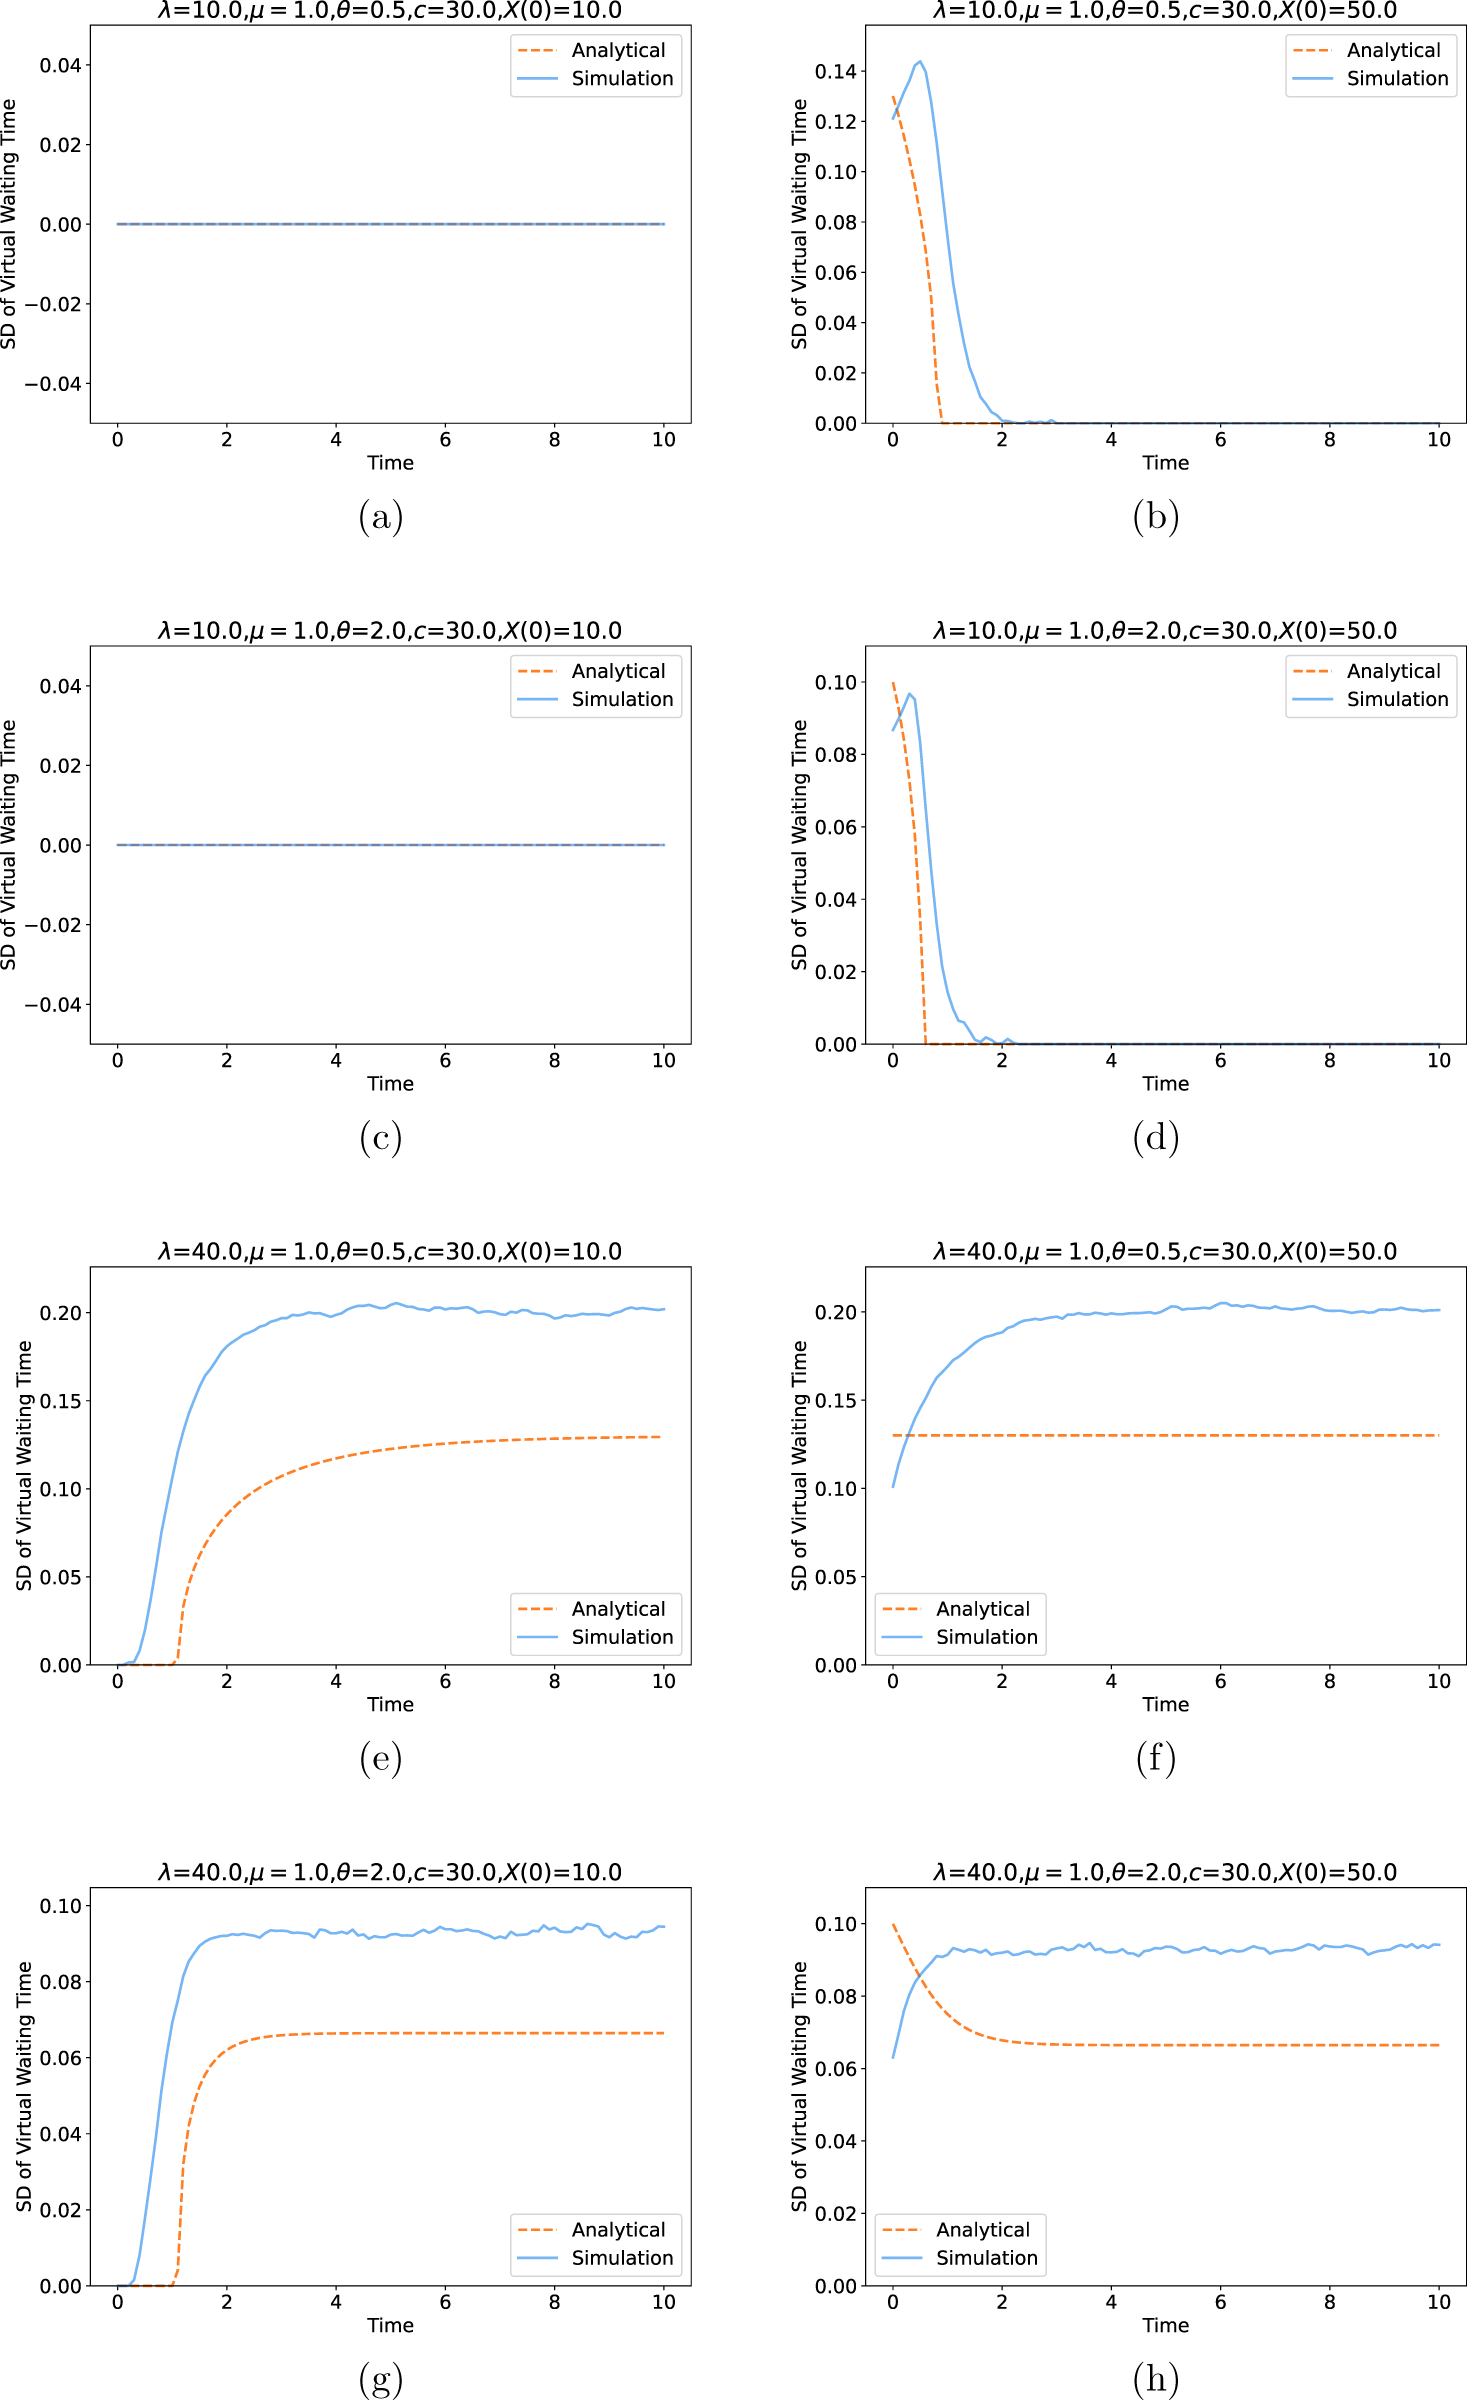
In Figure 5, we plot the simulated standard deviation of the virtual waiting time, utilizing an approximation derived from the trigamma function as given in Eq. (20). The derivation of this approximation involved a Taylor expansion of the variance and the utilization of conditional mean and variance formulas for the wait time, as outlined in Eqs. (13) and (14). Our observations reveal that regardless of the parameter settings examined in Table 1, the trigamma function consistently demonstrates excellent performance in approximating the standard deviation of the virtual waiting time. This consistency and accuracy highlight the reliability and effectiveness of the trigamma-based approximation method.
Standard deviation of virtual waiting time (analytical vs. simulation).
Moving on to Figure 6, we explore the mean number of overlapping customers as a function of time. It is noteworthy that the approximations presented in Theorem 3.2, denoted as “analytical” in the figures, show remarkable accuracy across all parameter values considered. The high level of precision maintained by these approximations reinforces their reliability and usefulness in practical settings.
Mean number of overlapping customers (analytical vs. simulation).
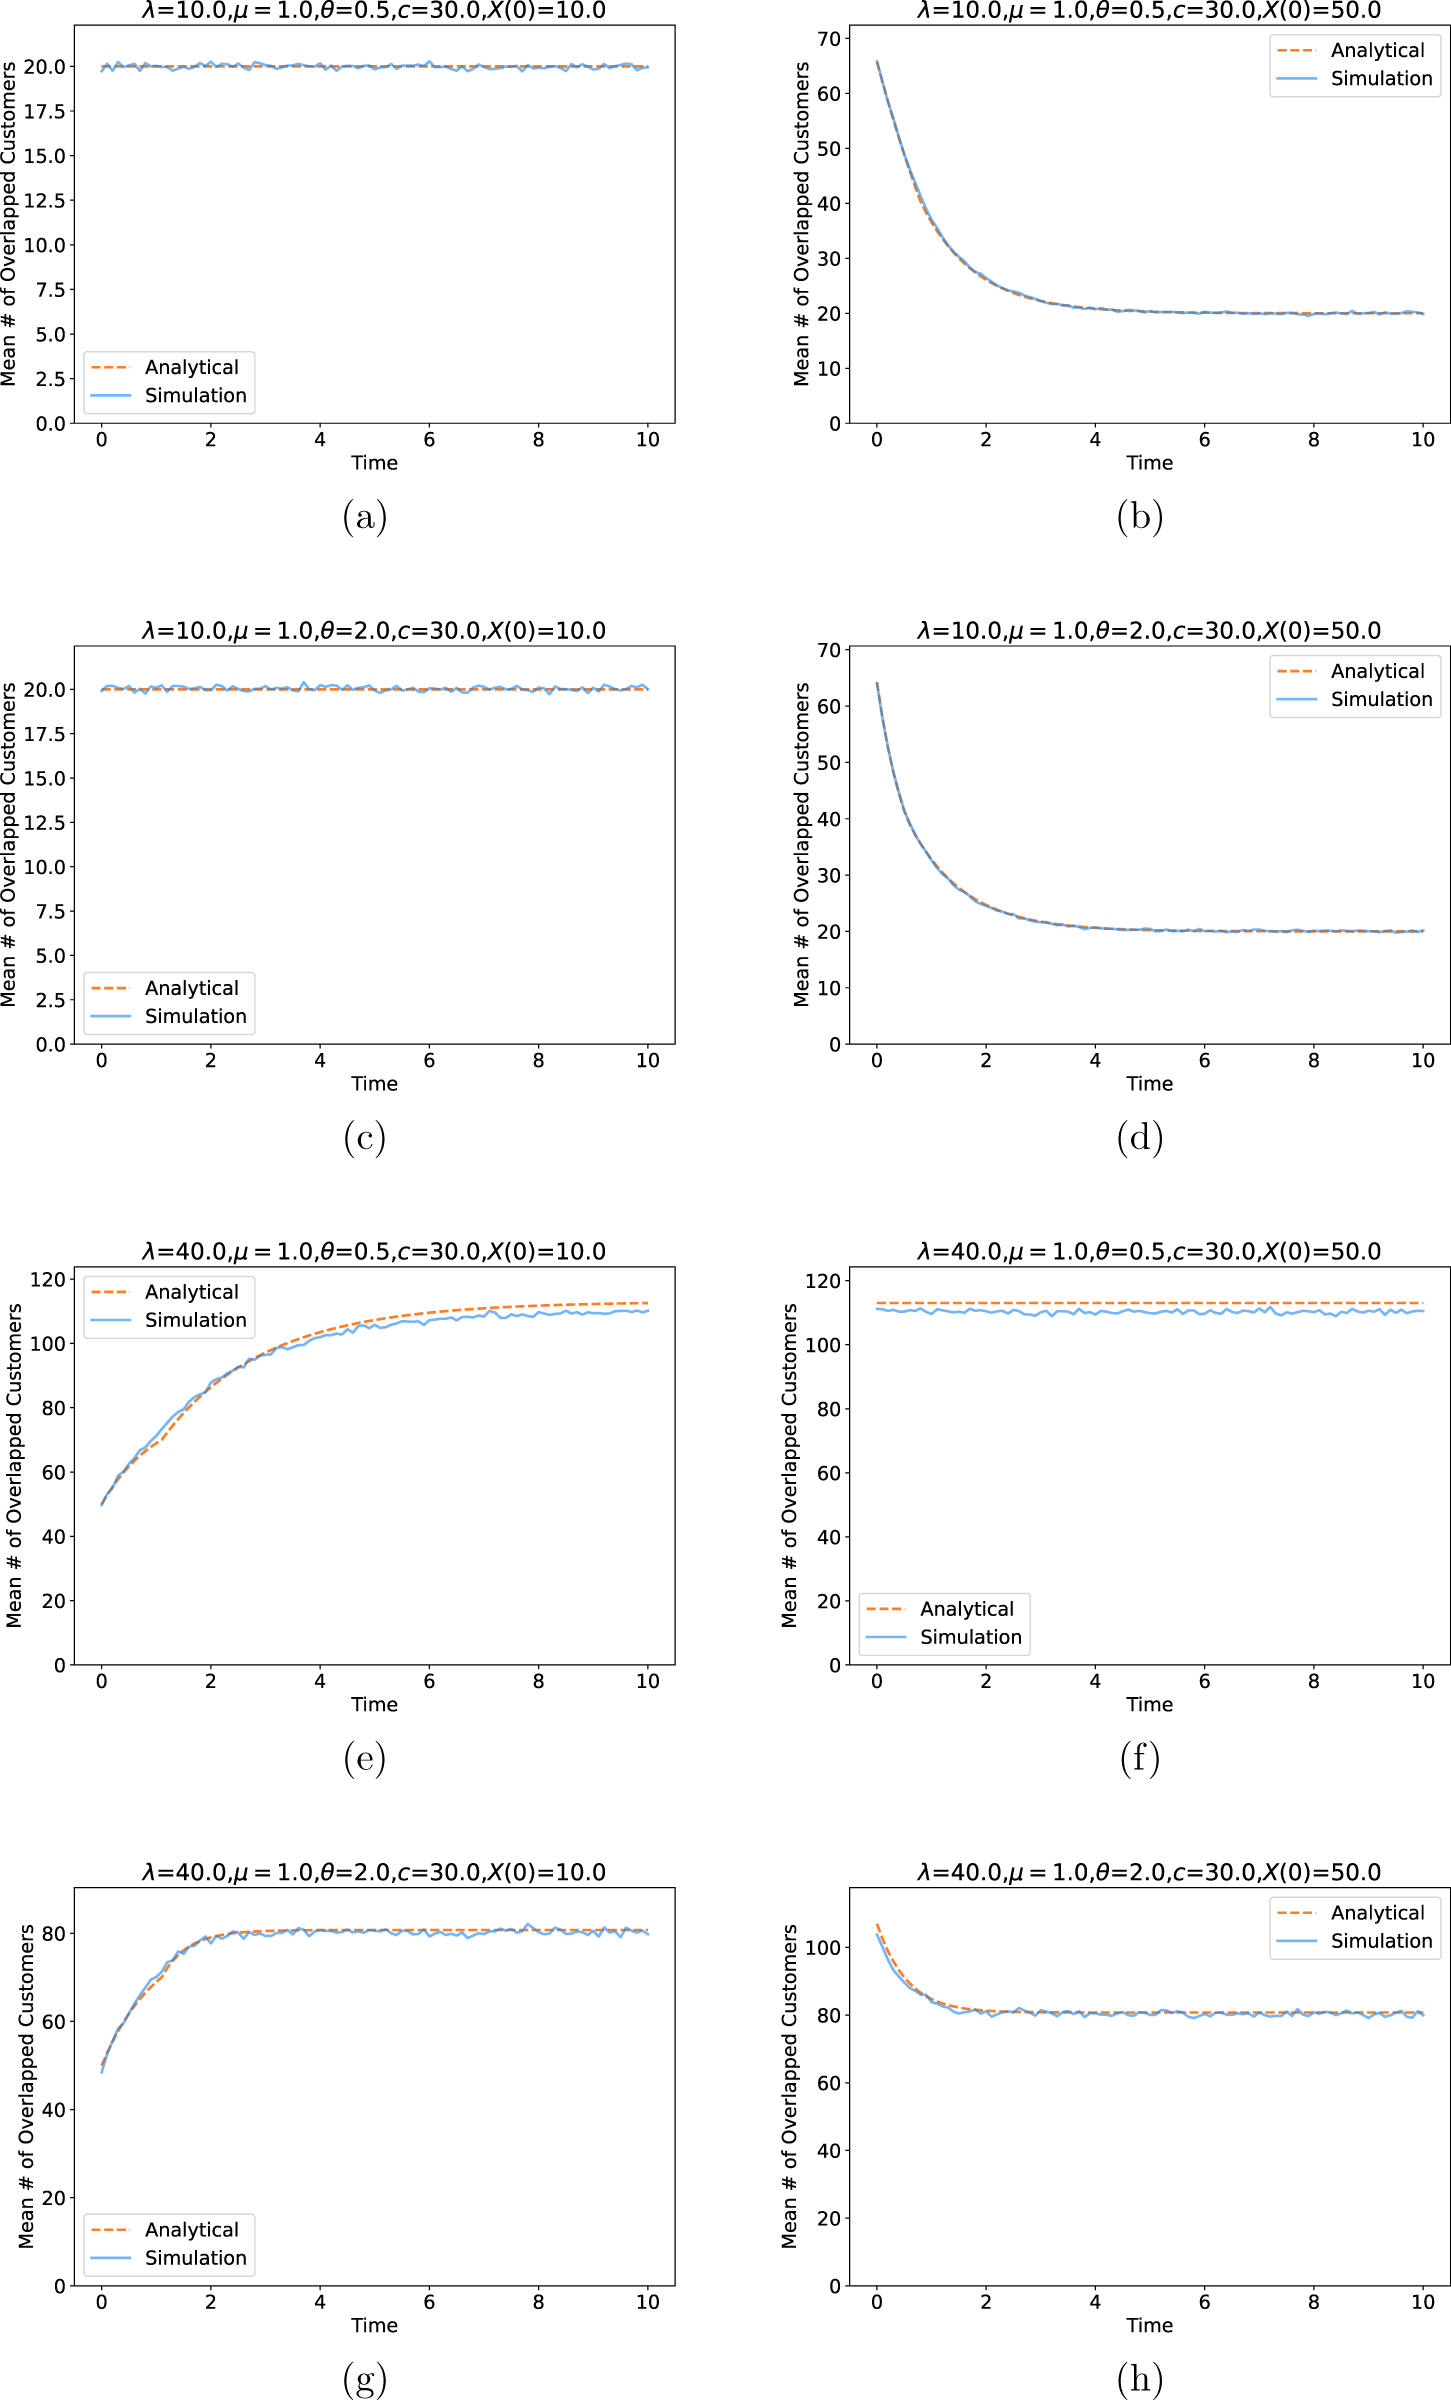
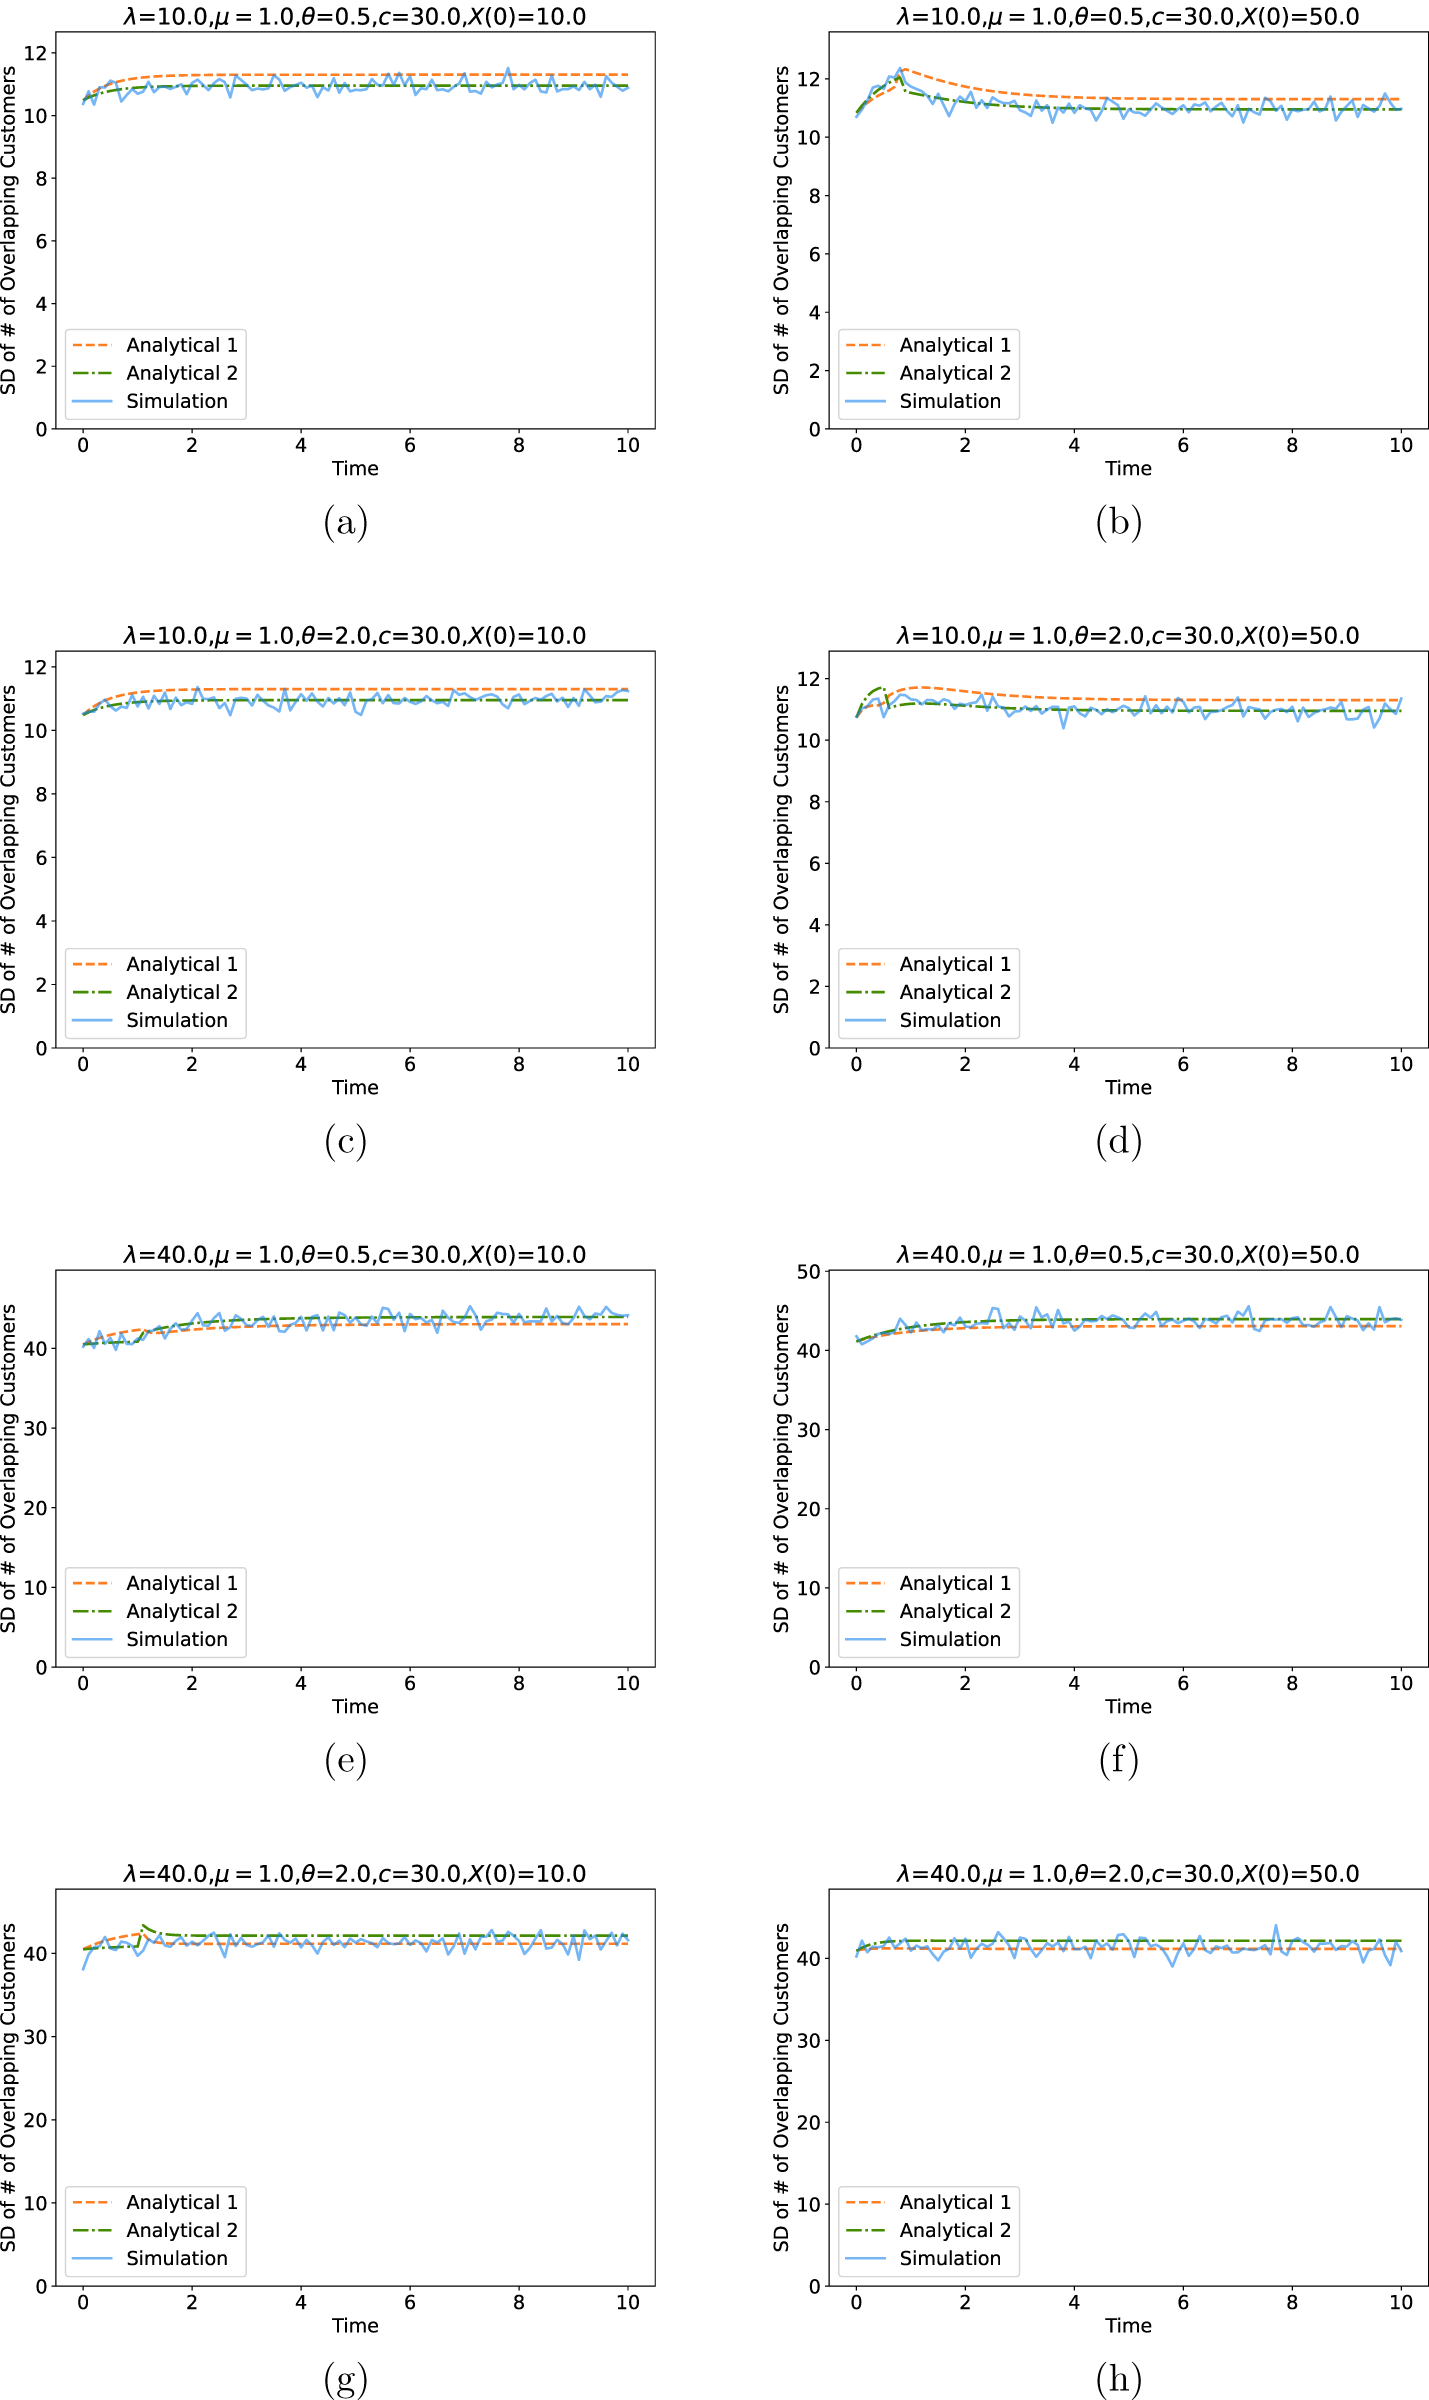
Figure 7 plots the standard deviation of the number of overlapping customers over time for the aforementioned eight examples in Table 1. Our investigation reveals that the two variance approximations presented in Eq. (5) (“analytical 1” in the figures) and Eq. (23) (“analytical 2” in the figures) both exhibit strong performance across all parameter values. The approximation based on the fluid and diffusion limits, as outlined in Eqs. (4) and (5), consistently outperforms the approximation given by Eq. (23). Consequently, with these robust approximations at our disposal, it becomes feasible to construct reliable prediction intervals for determining the customers that a virtual customer may overlap with.
Standard deviation of number of overlapping customers (analytical vs. simulation).
By extending and refining our analysis using advanced approximation techniques derived from trigamma functions and fluid and diffusion limits, we have established a solid foundation for predicting and understanding various aspects of the virtual waiting time and customer overlap dynamics. These findings have significant implications for enhancing the efficiency and effectiveness of virtual customer service systems in a number of practical applications.
5. Conclusion
In this paper, we present a novel analysis of the mean and variance of the number of overlaps in the Erlang-A queue. Our contribution extends the current literature by considering both abandonment and a finite number of servers, thus providing a more realistic model. To achieve this, we employ a methodology based on the fluid and diffusion differential equations introduced by Mandelbaum et al. [Reference Mandelbaum, Massey, Reiman and Stolyar29, Reference Mandelbaum, Massey and Reiman30] and Massey and Pender [Reference Massey and Pender32]. Specifically, we derive exact expressions for these equations using the theory of linear differential equations. Moreover, we utilize these exact expressions to approximate the number of overlaps for a virtual customer that will not be abandoned. Our results show that our fluid and diffusion-based approximations offer reliable estimates of the mean and variance of the number of overlapping customers in the Erlang-A queue.
As a side result, we also present new approximations for the mean and variance of the waiting time in the Erlang-A queue. Notably, our approximations are functions of the digamma and trigamma functions, respectively. These approximations offer a significant improvement over existing results and can be used to enhance the performance of queueing systems in practical applications. Overall, our work contributes to a better understanding of the behavior of the Erlang-A queue and provides useful tools for its analysis in real-world scenarios.
This work opens up several potential avenues for future research that could be valuable to pursue. First, we could explore a more general queueing model with abandonment, such as the  $G/G/C+G$ queue. Although some limit theorems exist for this model Liu and Whitt [Reference Liu and Whitt26, Reference Liu and Whitt27], the analysis of the virtual waiting time and its relationship with the queue length is currently unavailable. A thorough investigation of this relationship would provide insights into how the generality of the arrival, service, and abandonment processes could impact the number of overlaps.
Additionally, we could consider other types of queueing models, such as multidimensional network queueing models like those of Liu and Whitt [Reference Liu and Whitt25, Reference Liu and Whitt28] and Pender and Massey [Reference Pender and Massey43], batch queueing models like those explored in Pang and Whitt [Reference Pang and Whitt40], Daw and Pender [Reference Daw and Pender12], and Daw et al. [Reference Daw, Fralix and Pender9], and even models with self-exciting arrivals like those in Koops et al. [Reference Koops, Saxena, Boxma and Mandjes24], Daw and Pender [Reference Daw and Pender10], and Daw et al. [Reference Daw, Castellanos, Yom-Tov, Pender and Gruendlinger8]. These extensions would offer further opportunities to investigate the impact of various system parameters on the number of overlaps and the waiting time and they represent promising avenues for future research that we intend to pursue.
Acknowledgements
Jamol Pender is supported by the National Science Foundation DMS Award # 2,206,286. Young Myoung Ko is supported in part by the National Research Foundation of Korea (NRF) grants (No. 2021R1A2C1094699 and 2021R1A4A1031019) funded by the Korea government (Ministry of Science and ICT, MSIT). Jin Xu is supported in part by the National Natural Science Foundation of China under Grant 72,301,113.
Appendix A. Proof of Proposition 2.4
Proof. We prove the results in Eq. (7) by discussing the following four cases.
CASE 1: For the first case with  $q(0) \gt c$ and $\lambda \gt \mu c$, we have
 \begin{eqnarray*}
{\stackrel{\bullet}{v}} &=& \lambda + \mu \cdot c + \theta \cdot (q(t) - c) - 2 \cdot \theta \cdot v(t).
\end{eqnarray*}
\begin{eqnarray*}
{\stackrel{\bullet}{v}} &=& \lambda + \mu \cdot c + \theta \cdot (q(t) - c) - 2 \cdot \theta \cdot v(t).
\end{eqnarray*}Using the theory of linear ODEs, this implies that
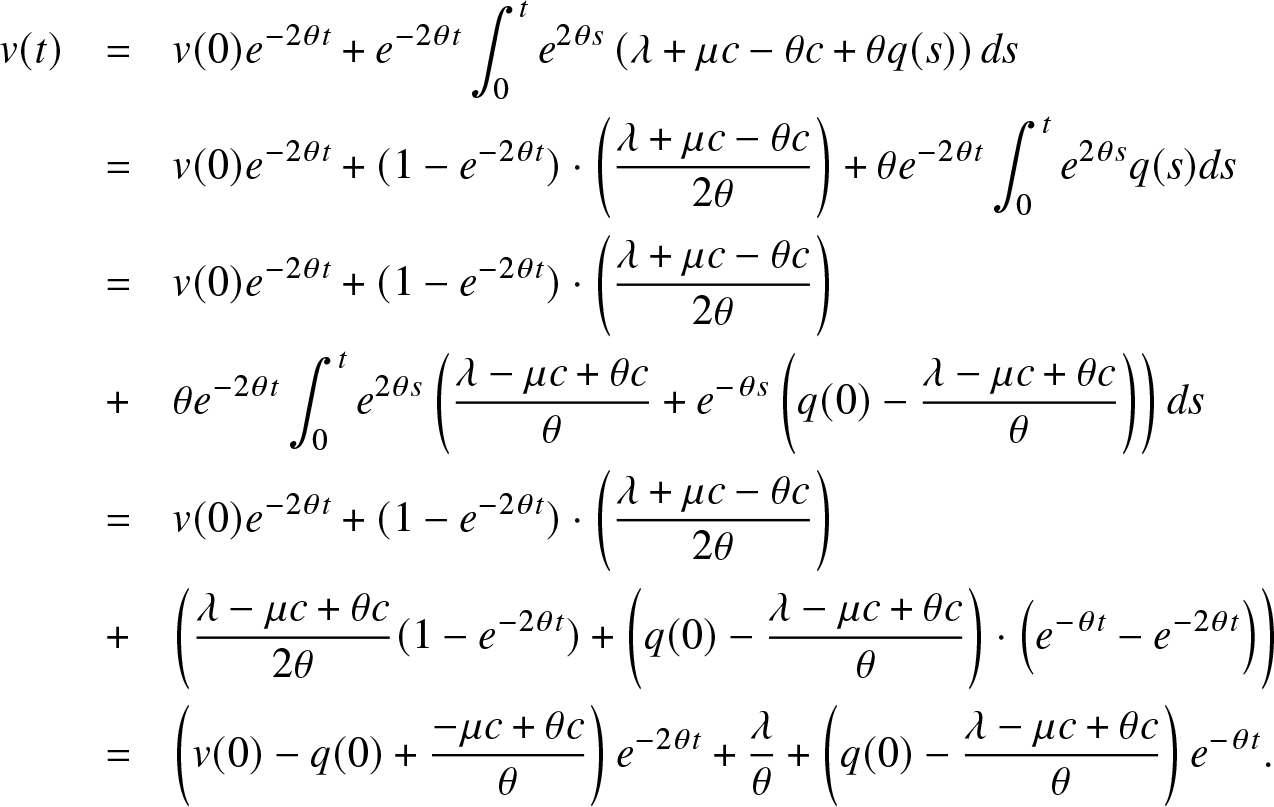 \begin{eqnarray*}
v(t) &=& v(0) e^{-2\theta t} + e^{-2\theta t} \int^{t}_{0} e^{2\theta s} \left( \lambda + \mu c - \theta c + \theta q(s) \right) ds \\
&=& v(0) e^{-2\theta t} + (1 - e^{-2\theta t} ) \cdot \left( \frac{\lambda + \mu c - \theta c }{2\theta} \right) + \theta e^{-2\theta t} \int^{t}_{0} e^{2\theta s} q(s) ds \\
&=& v(0) e^{-2\theta t} + (1 - e^{-2\theta t} ) \cdot \left( \frac{\lambda + \mu c - \theta c }{2\theta} \right) \\
&+& \theta e^{-2\theta t} \int^{t}_{0} e^{2\theta s} \left( \frac{\lambda - \mu c + \theta c}{\theta} + e^{-\theta s} \left( q(0) - \frac{\lambda - \mu c + \theta c}{\theta} \right) \right)ds \\
&=& v(0) e^{-2\theta t} + (1 - e^{-2\theta t} ) \cdot \left( \frac{\lambda + \mu c - \theta c }{2\theta} \right) \\
&+& \left( \frac{\lambda - \mu c + \theta c}{2 \theta} ( 1 - e^{-2\theta t} ) + \left(q(0) - \frac{\lambda - \mu c + \theta c }{\theta} \right) \cdot \left(e^{-\theta t} - e^{-2\theta t} \right) \right) \\
&=& \left(v(0) -q(0)+\frac{-\mu c + \theta c}{\theta}\right) e^{-2\theta t} + \frac{\lambda}{\theta}
+ \left(q(0) - \frac{\lambda - \mu c + \theta c }{\theta} \right) e^{-\theta t}.
\end{eqnarray*}
\begin{eqnarray*}
v(t) &=& v(0) e^{-2\theta t} + e^{-2\theta t} \int^{t}_{0} e^{2\theta s} \left( \lambda + \mu c - \theta c + \theta q(s) \right) ds \\
&=& v(0) e^{-2\theta t} + (1 - e^{-2\theta t} ) \cdot \left( \frac{\lambda + \mu c - \theta c }{2\theta} \right) + \theta e^{-2\theta t} \int^{t}_{0} e^{2\theta s} q(s) ds \\
&=& v(0) e^{-2\theta t} + (1 - e^{-2\theta t} ) \cdot \left( \frac{\lambda + \mu c - \theta c }{2\theta} \right) \\
&+& \theta e^{-2\theta t} \int^{t}_{0} e^{2\theta s} \left( \frac{\lambda - \mu c + \theta c}{\theta} + e^{-\theta s} \left( q(0) - \frac{\lambda - \mu c + \theta c}{\theta} \right) \right)ds \\
&=& v(0) e^{-2\theta t} + (1 - e^{-2\theta t} ) \cdot \left( \frac{\lambda + \mu c - \theta c }{2\theta} \right) \\
&+& \left( \frac{\lambda - \mu c + \theta c}{2 \theta} ( 1 - e^{-2\theta t} ) + \left(q(0) - \frac{\lambda - \mu c + \theta c }{\theta} \right) \cdot \left(e^{-\theta t} - e^{-2\theta t} \right) \right) \\
&=& \left(v(0) -q(0)+\frac{-\mu c + \theta c}{\theta}\right) e^{-2\theta t} + \frac{\lambda}{\theta}
+ \left(q(0) - \frac{\lambda - \mu c + \theta c }{\theta} \right) e^{-\theta t}.
\end{eqnarray*}We thus showed the first item of Eq. (7).
CASE 2: For the second case where  $ q(0) \gt c$ and $\lambda \lt \mu c$, we have
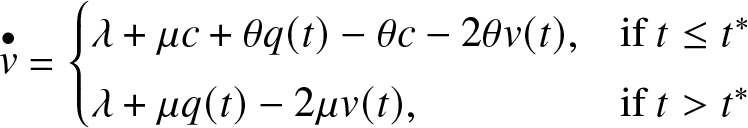 \begin{eqnarray*}
{\stackrel{\bullet}{v}} = \begin{cases}
\lambda + \mu c + \theta q(t) - \theta c - 2 \theta v(t) , & \mathrm{if} \ t \leq t^* \\
\lambda + \mu q(t) - 2 \mu v(t), & \mathrm{if} \ t \gt t^*
\end{cases}
\end{eqnarray*}
\begin{eqnarray*}
{\stackrel{\bullet}{v}} = \begin{cases}
\lambda + \mu c + \theta q(t) - \theta c - 2 \theta v(t) , & \mathrm{if} \ t \leq t^* \\
\lambda + \mu q(t) - 2 \mu v(t), & \mathrm{if} \ t \gt t^*
\end{cases}
\end{eqnarray*} where  $t^*$ is equal to
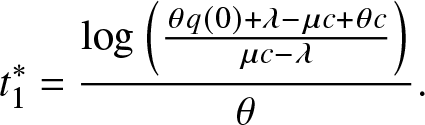 \begin{equation*}
t^*_1 = \frac{\log\left( \frac{\theta q(0) + \lambda - \mu c + \theta c}{\mu c - \lambda} \right)}{\theta}.
\end{equation*}
\begin{equation*}
t^*_1 = \frac{\log\left( \frac{\theta q(0) + \lambda - \mu c + \theta c}{\mu c - \lambda} \right)}{\theta}.
\end{equation*} Using the theory of linear ODEs, this implies for  $t \leq t^*_1$ that
 \begin{eqnarray*}
v(t) = \left(v(0) -q(0)+\frac{-\mu c + \theta c}{\theta}\right) e^{-2\theta t} + \frac{\lambda}{\theta}
+ \left(q(0) - \frac{\lambda - \mu c + \theta c }{\theta} \right) e^{-\theta t}.
\end{eqnarray*}
\begin{eqnarray*}
v(t) = \left(v(0) -q(0)+\frac{-\mu c + \theta c}{\theta}\right) e^{-2\theta t} + \frac{\lambda}{\theta}
+ \left(q(0) - \frac{\lambda - \mu c + \theta c }{\theta} \right) e^{-\theta t}.
\end{eqnarray*} Lastly for  $t \gt t^*_1$ we have that
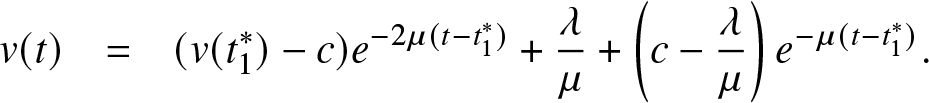 \begin{eqnarray*}
v(t) &=& (v(t^*_1) - c) e^{-2\mu (t - t^*_1)} + \frac{\lambda }{\mu}
+ \left(c - \frac{\lambda }{\mu} \right) e^{-\mu (t - t^*_1)} .
\end{eqnarray*}
\begin{eqnarray*}
v(t) &=& (v(t^*_1) - c) e^{-2\mu (t - t^*_1)} + \frac{\lambda }{\mu}
+ \left(c - \frac{\lambda }{\mu} \right) e^{-\mu (t - t^*_1)} .
\end{eqnarray*}We hence proved the second and third items in Eq. (7).
CASE 3: For the third case where  $ q(0) \leq c$ and $\lambda \lt \mu c$, we have
 \begin{eqnarray*}
{\stackrel{\bullet}{v}} &=& \lambda + \mu \cdot q(t) - 2 \cdot \mu \cdot v(t).
\end{eqnarray*}
\begin{eqnarray*}
{\stackrel{\bullet}{v}} &=& \lambda + \mu \cdot q(t) - 2 \cdot \mu \cdot v(t).
\end{eqnarray*}Using the theory of linear ODEs, this implies that
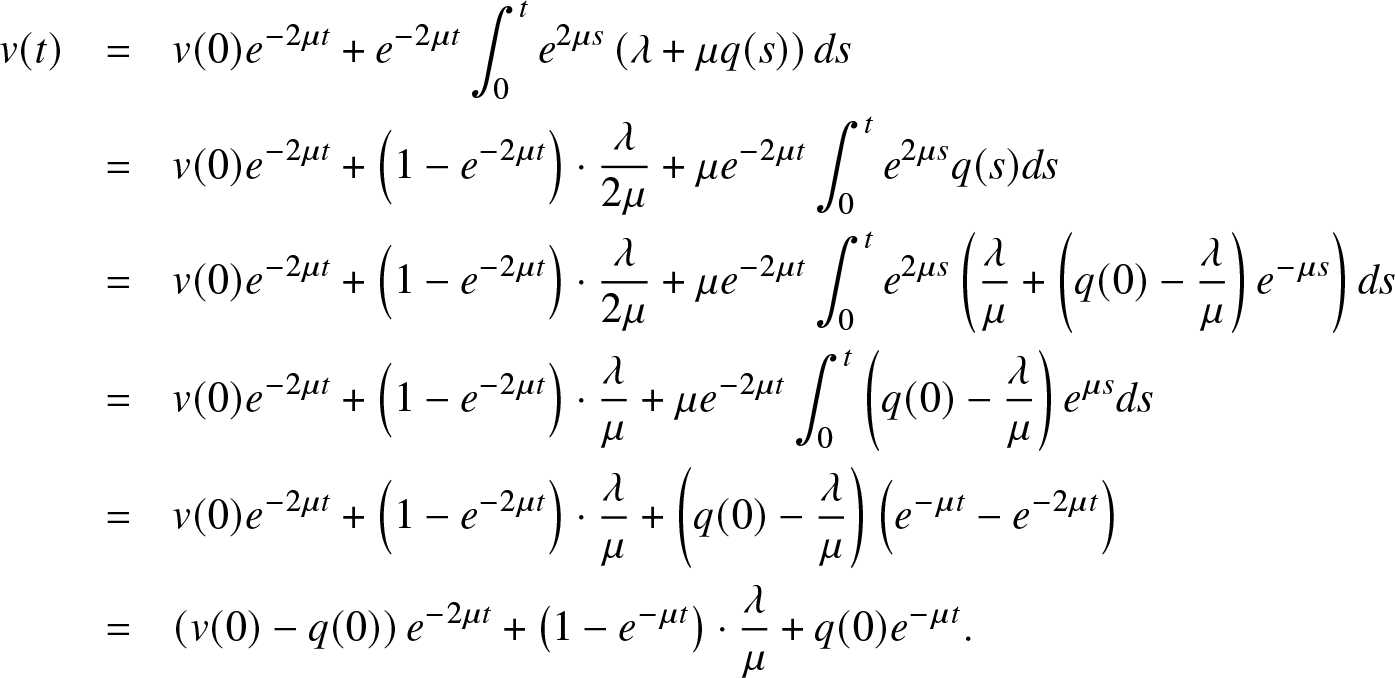 \begin{eqnarray*}
v(t) &=& v(0) e^{-2\mu t} + e^{-2\mu t} \int^{t}_{0} e^{2\mu s} \left( \lambda + \mu q(s) \right) ds \\
&=& v(0) e^{-2\mu t} + \left( 1 - e^{-2\mu t} \right) \cdot \frac{\lambda}{2\mu} + \mu e^{-2\mu t} \int^{t}_{0} e^{2\mu s} q(s)ds \\
&=& v(0) e^{-2\mu t} + \left( 1 - e^{-2\mu t} \right) \cdot \frac{\lambda}{2\mu} + \mu e^{-2\mu t} \int^{t}_{0} e^{2\mu s} \left( \frac{\lambda}{\mu} + \left( q(0) - \frac{\lambda}{\mu} \right) e^{-\mu s} \right) ds \\
&=& v(0) e^{-2\mu t} + \left( 1 - e^{-2\mu t} \right) \cdot \frac{\lambda}{\mu} + \mu e^{-2\mu t} \int^{t}_{0} \left( q(0) - \frac{\lambda}{\mu} \right) e^{\mu s} ds \\
&=& v(0) e^{-2\mu t} + \left( 1 - e^{-2\mu t} \right) \cdot \frac{\lambda}{\mu} + \left( q(0) - \frac{\lambda}{\mu} \right) \left( e^{-\mu t} - e^{-2\mu t} \right) \\
&=& \left( v(0) - q(0) \right) e^{-2\mu t} + \left( 1 - e^{-\mu t} \right) \cdot \frac{\lambda}{\mu} + q(0) e^{-\mu t} .
\end{eqnarray*}
\begin{eqnarray*}
v(t) &=& v(0) e^{-2\mu t} + e^{-2\mu t} \int^{t}_{0} e^{2\mu s} \left( \lambda + \mu q(s) \right) ds \\
&=& v(0) e^{-2\mu t} + \left( 1 - e^{-2\mu t} \right) \cdot \frac{\lambda}{2\mu} + \mu e^{-2\mu t} \int^{t}_{0} e^{2\mu s} q(s)ds \\
&=& v(0) e^{-2\mu t} + \left( 1 - e^{-2\mu t} \right) \cdot \frac{\lambda}{2\mu} + \mu e^{-2\mu t} \int^{t}_{0} e^{2\mu s} \left( \frac{\lambda}{\mu} + \left( q(0) - \frac{\lambda}{\mu} \right) e^{-\mu s} \right) ds \\
&=& v(0) e^{-2\mu t} + \left( 1 - e^{-2\mu t} \right) \cdot \frac{\lambda}{\mu} + \mu e^{-2\mu t} \int^{t}_{0} \left( q(0) - \frac{\lambda}{\mu} \right) e^{\mu s} ds \\
&=& v(0) e^{-2\mu t} + \left( 1 - e^{-2\mu t} \right) \cdot \frac{\lambda}{\mu} + \left( q(0) - \frac{\lambda}{\mu} \right) \left( e^{-\mu t} - e^{-2\mu t} \right) \\
&=& \left( v(0) - q(0) \right) e^{-2\mu t} + \left( 1 - e^{-\mu t} \right) \cdot \frac{\lambda}{\mu} + q(0) e^{-\mu t} .
\end{eqnarray*}We hence have the fourth item of Eq. (7).
CASE 4: For the fourth case where  $\lambda \gt \mu c$ and $ q(0) \leq c$, we have
 \begin{eqnarray*}
{\stackrel{\bullet}{v}} &=& \begin{cases}
\lambda + \mu q(t) - 2 \mu v(t), & \mathrm{if} \ t \leq t^*_2 \\
\lambda + \mu c + \theta q(t) - \theta c - 2 \theta v(t) , & \mathrm{if} \ t \gt t^*_2
\end{cases}
\end{eqnarray*}
\begin{eqnarray*}
{\stackrel{\bullet}{v}} &=& \begin{cases}
\lambda + \mu q(t) - 2 \mu v(t), & \mathrm{if} \ t \leq t^*_2 \\
\lambda + \mu c + \theta q(t) - \theta c - 2 \theta v(t) , & \mathrm{if} \ t \gt t^*_2
\end{cases}
\end{eqnarray*} where  $t^*$ is equal to
 \begin{equation*}
t^*_2 = \frac{\log\left( \frac{q(0) - \frac{\lambda}{\mu}}{c - \frac{\lambda}{\mu}} \right)}{\mu}.
\end{equation*}
\begin{equation*}
t^*_2 = \frac{\log\left( \frac{q(0) - \frac{\lambda}{\mu}}{c - \frac{\lambda}{\mu}} \right)}{\mu}.
\end{equation*} Using the theory of linear ODEs, this implies for  $t \leq t^*_2$ that
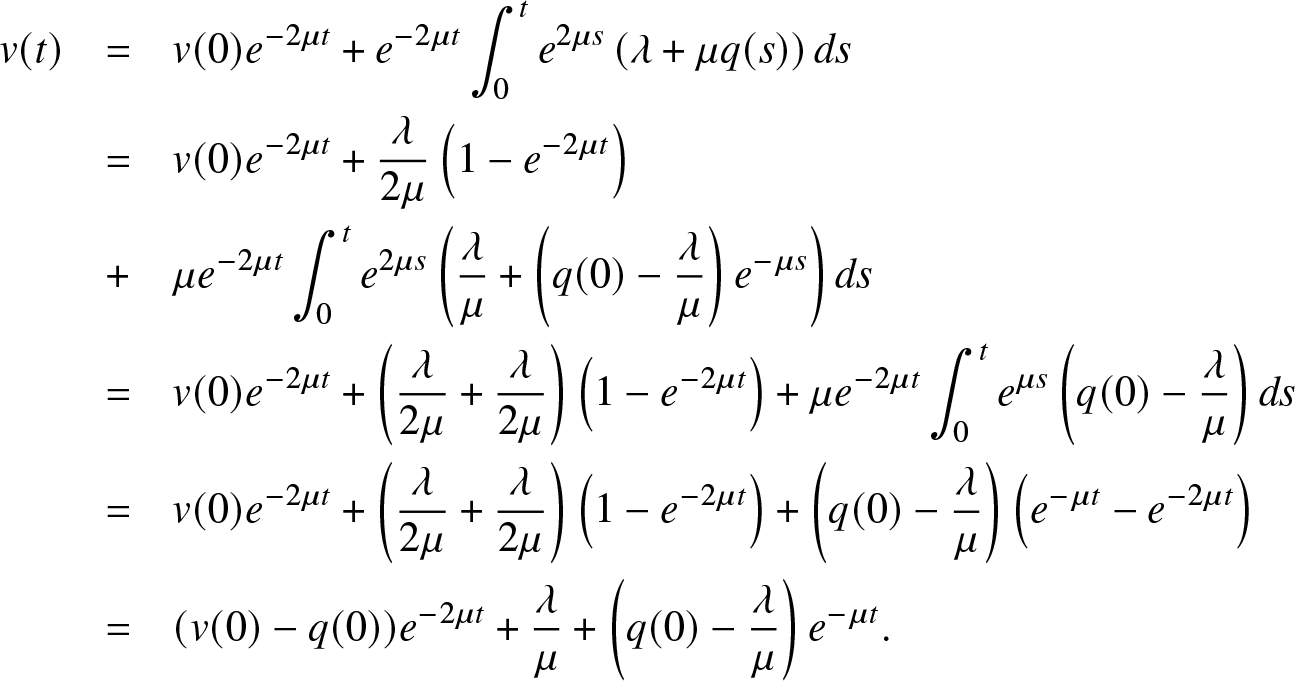 \begin{eqnarray*}
v(t) &=& v(0) e^{-2\mu t} + e^{-2\mu t} \int^{t}_{0} e^{2\mu s} \left( \lambda + \mu q(s) \right) ds \\
&=& v(0) e^{-2\mu t} + \frac{\lambda}{2\mu} \left(1 - e^{-2\mu t} \right) \\
&+& \mu e^{-2\mu t} \int^{t}_{0} e^{2\mu s} \left( \frac{\lambda}{\mu} + \left( q(0) - \frac{\lambda}{\mu} \right) e^{-\mu s}\right) ds \\
&=& v(0) e^{-2\mu t} + \left( \frac{\lambda}{2\mu} + \frac{\lambda }{2\mu} \right) \left(1 - e^{-2\mu t} \right) + \mu e^{-2\mu t} \int^{t}_{0} e^{\mu s} \left( q(0) - \frac{\lambda }{\mu} \right) ds \\
&=& v(0) e^{-2\mu t} + \left( \frac{\lambda}{2\mu} + \frac{\lambda }{2\mu} \right) \left(1 - e^{-2\mu t} \right) + \left( q(0) - \frac{\lambda }{\mu} \right) \left( e^{-\mu t} - e^{-2\mu t} \right) \\
&=& (v(0) - q(0)) e^{-2\mu t} + \frac{\lambda}{\mu} + \left( q(0) - \frac{\lambda }{\mu} \right) e^{-\mu t} .
\end{eqnarray*}
\begin{eqnarray*}
v(t) &=& v(0) e^{-2\mu t} + e^{-2\mu t} \int^{t}_{0} e^{2\mu s} \left( \lambda + \mu q(s) \right) ds \\
&=& v(0) e^{-2\mu t} + \frac{\lambda}{2\mu} \left(1 - e^{-2\mu t} \right) \\
&+& \mu e^{-2\mu t} \int^{t}_{0} e^{2\mu s} \left( \frac{\lambda}{\mu} + \left( q(0) - \frac{\lambda}{\mu} \right) e^{-\mu s}\right) ds \\
&=& v(0) e^{-2\mu t} + \left( \frac{\lambda}{2\mu} + \frac{\lambda }{2\mu} \right) \left(1 - e^{-2\mu t} \right) + \mu e^{-2\mu t} \int^{t}_{0} e^{\mu s} \left( q(0) - \frac{\lambda }{\mu} \right) ds \\
&=& v(0) e^{-2\mu t} + \left( \frac{\lambda}{2\mu} + \frac{\lambda }{2\mu} \right) \left(1 - e^{-2\mu t} \right) + \left( q(0) - \frac{\lambda }{\mu} \right) \left( e^{-\mu t} - e^{-2\mu t} \right) \\
&=& (v(0) - q(0)) e^{-2\mu t} + \frac{\lambda}{\mu} + \left( q(0) - \frac{\lambda }{\mu} \right) e^{-\mu t} .
\end{eqnarray*} Lastly for  $t \gt t^*_2$ we have that
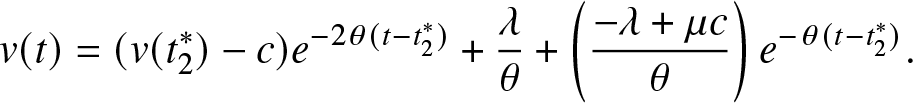 \begin{eqnarray*}
v(t) = (v(t^*_2) - c) e^{-2\theta (t - t^*_2)} + \frac{\lambda }{\theta}
+ \left( \frac{-\lambda + \mu c }{\theta} \right) e^{-\theta (t - t^*_2)} .
\end{eqnarray*}
\begin{eqnarray*}
v(t) = (v(t^*_2) - c) e^{-2\theta (t - t^*_2)} + \frac{\lambda }{\theta}
+ \left( \frac{-\lambda + \mu c }{\theta} \right) e^{-\theta (t - t^*_2)} .
\end{eqnarray*}We thus proved the fifth and sixth items of Eq. (7).
Appendix B. Proof of Lemma 3.6
Proof. To compute the variance of the queue length Q(t), we have
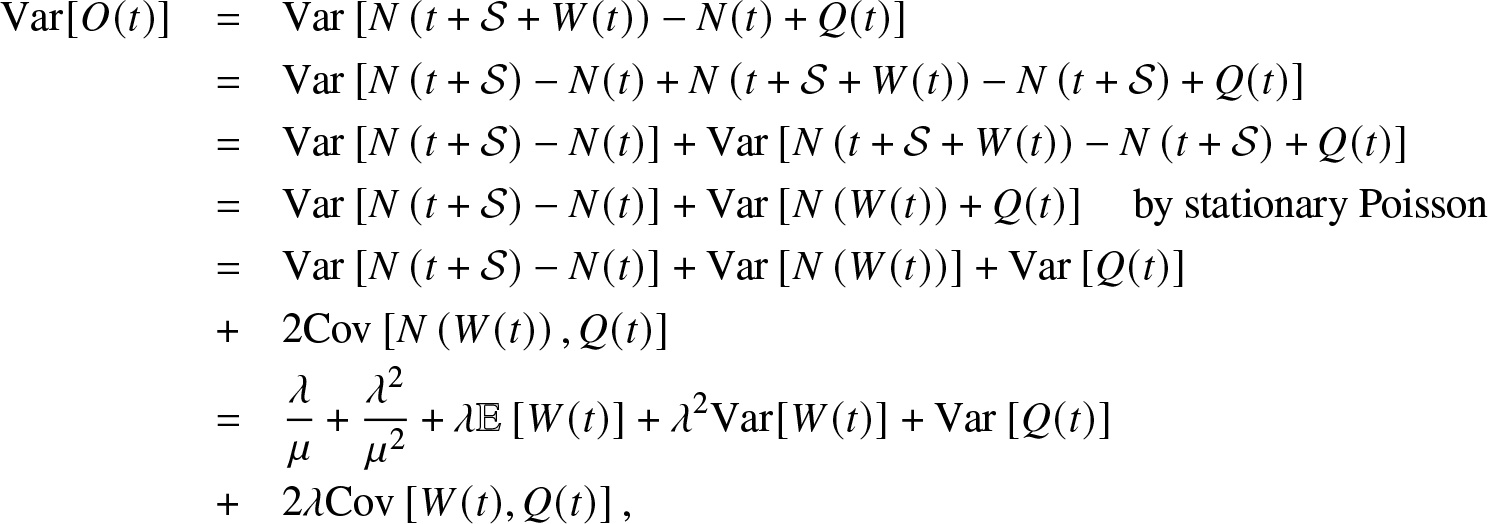 \begin{eqnarray*}
\mathrm{Var}[O(t)] &=& \mathrm{Var}\left[ N\left(t+\mathcal{S} + W(t) \right) - N(t) + Q(t) \right] \\
&=& \mathrm{Var}\left[ N\left(t+\mathcal{S} \right) - N(t) + N\left(t+\mathcal{S} + W(t) \right) - N\left(t+\mathcal{S} \right) + Q(t) \right] \\
&=& \mathrm{Var}\left[ N\left(t+\mathcal{S} \right) - N(t) \right] + \mathrm{Var}\left[ N\left(t+\mathcal{S} + W(t) \right) - N\left(t+\mathcal{S} \right) + Q(t) \right] \\
&=& \mathrm{Var}\left[ N\left(t+\mathcal{S} \right) - N(t) \right] + \mathrm{Var}\left[ N\left( W(t) \right) + Q(t) \right] \text{\quad by stationary Poisson}\\
&=& \mathrm{Var}\left[ N\left(t+\mathcal{S} \right) - N(t) \right] + \mathrm{Var}\left[ N\left( W(t) \right) \right] + \mathrm{Var}\left[ Q(t) \right] \\
&+& 2\mathrm{Cov}\left[ N\left( W(t) \right) , Q(t) \right] \\
&=& \frac{\lambda}{\mu} + \frac{\lambda^2}{\mu^2} + \lambda \mathbb{E}\left[ W(t) \right] + \lambda^2 \mathrm{Var}[ W(t) ] + \mathrm{Var}\left[ Q(t) \right] \\
&+& 2 \lambda \mathrm{Cov}\left[ W(t) , Q(t) \right],
\end{eqnarray*}
\begin{eqnarray*}
\mathrm{Var}[O(t)] &=& \mathrm{Var}\left[ N\left(t+\mathcal{S} + W(t) \right) - N(t) + Q(t) \right] \\
&=& \mathrm{Var}\left[ N\left(t+\mathcal{S} \right) - N(t) + N\left(t+\mathcal{S} + W(t) \right) - N\left(t+\mathcal{S} \right) + Q(t) \right] \\
&=& \mathrm{Var}\left[ N\left(t+\mathcal{S} \right) - N(t) \right] + \mathrm{Var}\left[ N\left(t+\mathcal{S} + W(t) \right) - N\left(t+\mathcal{S} \right) + Q(t) \right] \\
&=& \mathrm{Var}\left[ N\left(t+\mathcal{S} \right) - N(t) \right] + \mathrm{Var}\left[ N\left( W(t) \right) + Q(t) \right] \text{\quad by stationary Poisson}\\
&=& \mathrm{Var}\left[ N\left(t+\mathcal{S} \right) - N(t) \right] + \mathrm{Var}\left[ N\left( W(t) \right) \right] + \mathrm{Var}\left[ Q(t) \right] \\
&+& 2\mathrm{Cov}\left[ N\left( W(t) \right) , Q(t) \right] \\
&=& \frac{\lambda}{\mu} + \frac{\lambda^2}{\mu^2} + \lambda \mathbb{E}\left[ W(t) \right] + \lambda^2 \mathrm{Var}[ W(t) ] + \mathrm{Var}\left[ Q(t) \right] \\
&+& 2 \lambda \mathrm{Cov}\left[ W(t) , Q(t) \right],
\end{eqnarray*}where the last equality follows from the facts that
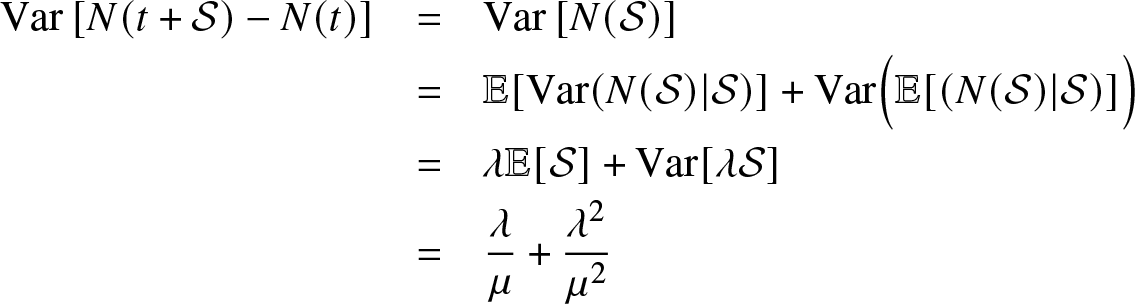 \begin{eqnarray*}
\mathrm{Var}\left[N(t+\mathcal{S})-N(t)\right] & = & \mathrm{Var}\left[N(\mathcal{S})\right]\\
& = & \mathbb{E}[\mathrm{Var}(N(\mathcal{S})|\mathcal{S})]+\mathrm{Var}\Big(\mathbb{E}[(N(\mathcal{S})|\mathcal{S})]\Big)\\
& = & \lambda\mathbb{E}[\mathcal{S}]+\mathrm{Var}[\lambda\mathcal{S}]\\
& = & \frac{\lambda}{\mu}+\frac{\lambda^{2}}{\mu^{2}}
\end{eqnarray*}
\begin{eqnarray*}
\mathrm{Var}\left[N(t+\mathcal{S})-N(t)\right] & = & \mathrm{Var}\left[N(\mathcal{S})\right]\\
& = & \mathbb{E}[\mathrm{Var}(N(\mathcal{S})|\mathcal{S})]+\mathrm{Var}\Big(\mathbb{E}[(N(\mathcal{S})|\mathcal{S})]\Big)\\
& = & \lambda\mathbb{E}[\mathcal{S}]+\mathrm{Var}[\lambda\mathcal{S}]\\
& = & \frac{\lambda}{\mu}+\frac{\lambda^{2}}{\mu^{2}}
\end{eqnarray*}and
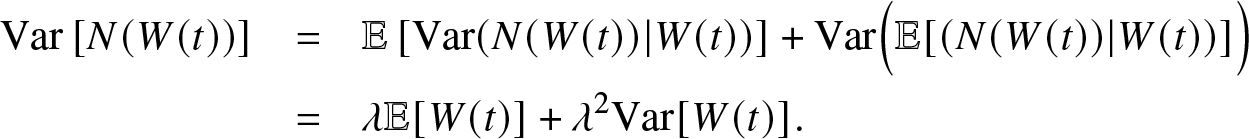 \begin{eqnarray*}
\mathrm{Var}\left[N(W(t))\right] & = & \mathbb{E}\left[\mathrm{Var}(N(W(t))|W(t))\right]+\mathrm{Var}\Big(\mathbb{E}[(N(W(t))|W(t))]\Big)\\
& = & \lambda\mathbb{E}[W(t)]+\lambda^2\mathrm{Var}[W(t)].
\end{eqnarray*}
\begin{eqnarray*}
\mathrm{Var}\left[N(W(t))\right] & = & \mathbb{E}\left[\mathrm{Var}(N(W(t))|W(t))\right]+\mathrm{Var}\Big(\mathbb{E}[(N(W(t))|W(t))]\Big)\\
& = & \lambda\mathbb{E}[W(t)]+\lambda^2\mathrm{Var}[W(t)].
\end{eqnarray*}Hence proved.
Appendix C. Proof of Lemma 3.7
Proof. To compute the covariance of waiting time and queue length, we have
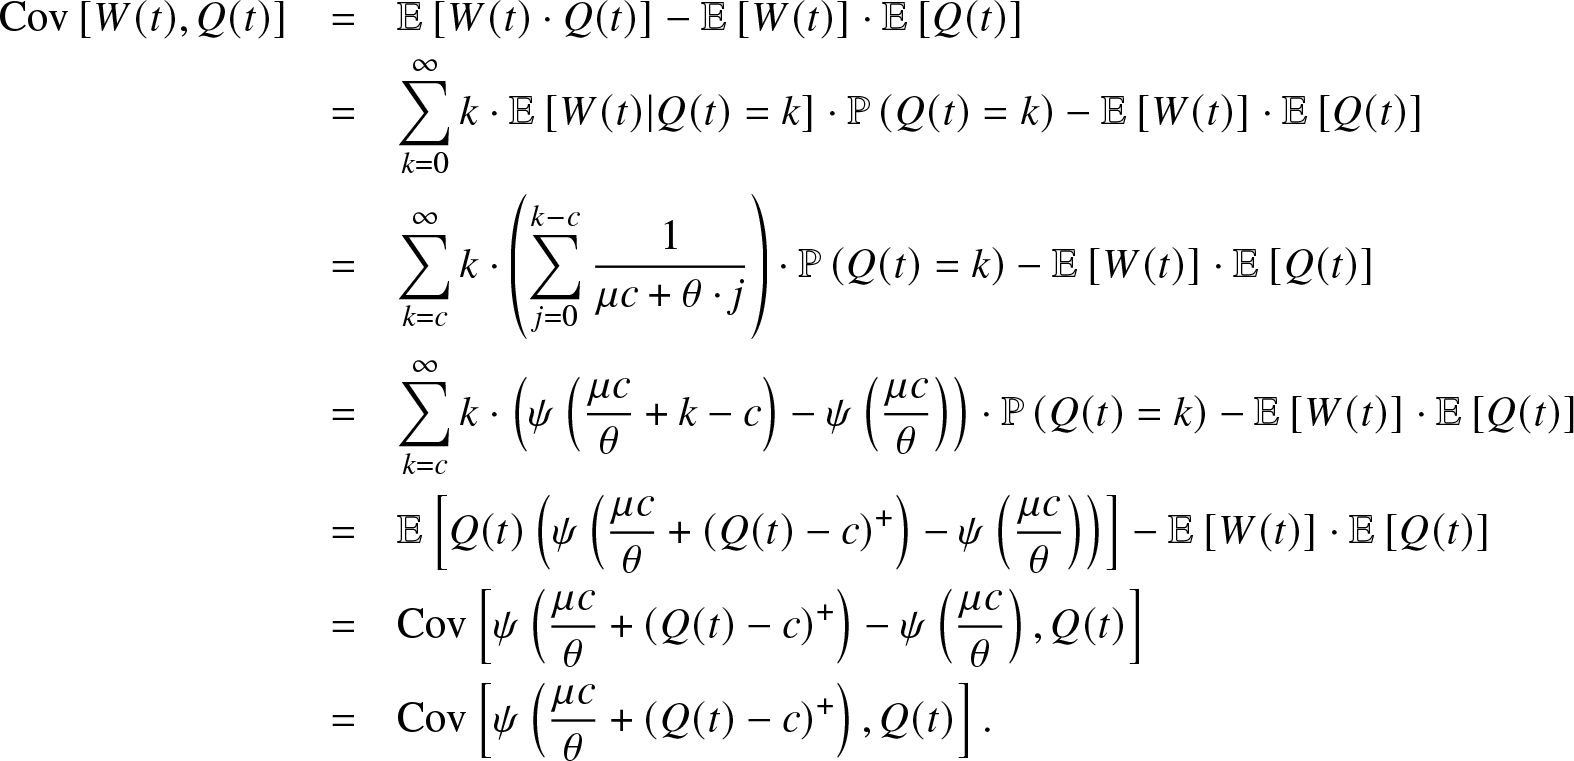 \begin{eqnarray*}
\mathrm{Cov}\left[ W(t), Q(t) \right] &=& \mathbb{E}\left[ W(t) \cdot Q(t) \right] - \mathbb{E}\left[ W(t) \right] \cdot \mathbb{E}\left[ Q(t) \right] \\
&=& \sum^{\infty}_{k=0} k \cdot \mathbb{E}\left[ W(t) | Q(t) = k \right] \cdot \mathbb{P} \left( Q(t) = k \right) - \mathbb{E}\left[ W(t) \right] \cdot \mathbb{E}\left[ Q(t) \right] \\
&=& \sum^{\infty}_{k=c} k \cdot \left( \sum^{k-c}_{j=0} \frac{1}{\mu c + \theta \cdot j } \right) \cdot \mathbb{P}\left( Q(t) = k \right) - \mathbb{E}\left[ W(t) \right] \cdot \mathbb{E}\left[ Q(t) \right] \\
&=&\sum^{\infty}_{k=c} k \cdot \left( \psi\left(\frac{\mu c}{\theta} + k-c \right) - \psi \left( \frac{\mu c}{\theta} \right) \right) \cdot \mathbb{P}\left( Q(t) = k \right) - \mathbb{E}\left[ W(t) \right] \cdot \mathbb{E}\left[ Q(t) \right] \\
&=& \mathbb{E}\left[ Q(t) \left( \psi\left(\frac{\mu c}{\theta} + (Q(t)-c)^+ \right) - \psi \left( \frac{\mu c}{\theta} \right) \right) \right] - \mathbb{E}\left[ W(t) \right] \cdot \mathbb{E}\left[ Q(t) \right] \\
&=& \mathrm{Cov}\left[ \psi\left(\frac{\mu c}{\theta} + (Q(t)-c)^+ \right) - \psi \left( \frac{\mu c}{\theta} \right) , Q(t) \right] \\
&=& \mathrm{Cov}\left[ \psi\left(\frac{\mu c}{\theta} + (Q(t)-c)^+ \right) , Q(t) \right] .
\end{eqnarray*}
\begin{eqnarray*}
\mathrm{Cov}\left[ W(t), Q(t) \right] &=& \mathbb{E}\left[ W(t) \cdot Q(t) \right] - \mathbb{E}\left[ W(t) \right] \cdot \mathbb{E}\left[ Q(t) \right] \\
&=& \sum^{\infty}_{k=0} k \cdot \mathbb{E}\left[ W(t) | Q(t) = k \right] \cdot \mathbb{P} \left( Q(t) = k \right) - \mathbb{E}\left[ W(t) \right] \cdot \mathbb{E}\left[ Q(t) \right] \\
&=& \sum^{\infty}_{k=c} k \cdot \left( \sum^{k-c}_{j=0} \frac{1}{\mu c + \theta \cdot j } \right) \cdot \mathbb{P}\left( Q(t) = k \right) - \mathbb{E}\left[ W(t) \right] \cdot \mathbb{E}\left[ Q(t) \right] \\
&=&\sum^{\infty}_{k=c} k \cdot \left( \psi\left(\frac{\mu c}{\theta} + k-c \right) - \psi \left( \frac{\mu c}{\theta} \right) \right) \cdot \mathbb{P}\left( Q(t) = k \right) - \mathbb{E}\left[ W(t) \right] \cdot \mathbb{E}\left[ Q(t) \right] \\
&=& \mathbb{E}\left[ Q(t) \left( \psi\left(\frac{\mu c}{\theta} + (Q(t)-c)^+ \right) - \psi \left( \frac{\mu c}{\theta} \right) \right) \right] - \mathbb{E}\left[ W(t) \right] \cdot \mathbb{E}\left[ Q(t) \right] \\
&=& \mathrm{Cov}\left[ \psi\left(\frac{\mu c}{\theta} + (Q(t)-c)^+ \right) - \psi \left( \frac{\mu c}{\theta} \right) , Q(t) \right] \\
&=& \mathrm{Cov}\left[ \psi\left(\frac{\mu c}{\theta} + (Q(t)-c)^+ \right) , Q(t) \right] .
\end{eqnarray*}We hence proved the lemma.


 Open access