


Why do some people experience social success in the real world despite underlying vulnerabilities that make it more challenging to understand and get along well with others? A neurodiversity framework posits that compensation of cognitive shortcomings through unique cognitive strategies could be a potential advantage of having neurological differences (Rządeczka et al., Reference Rządeczka, Wodziński and Moskalewicz2023). The term compensation has been used in the psychological literature to describe situations when people who are expected to be limited in a certain domain of functioning (for example, a psychiatric condition) perform better than expected. A variety of definitions and conceptualizations of compensation exist in the literature, but most include a sense of doing well despite a propensity to do poorly, or the balancing of limitations and strengths (Adler, Reference Adler1935; Adler & Jelliffe, Reference Adler and Jelliffe1917; Adler & Wolfe, Reference Adler and Wolfe1958; Adler, Reference Adler1927; Bäckman & Dixon, Reference Bäckman and Dixon1992; Emerson, Reference Emerson1900; Vaughan, Reference Vaughan1927). These questions are of broad interest to social, clinical, and developmental psychology and build off of the broader construct of resilience – why some people do well under high-risk circumstances while others do poorly (Luthar et al., Reference Luthar, Cicchetti and Becker2000; Masten & Cicchetti, Reference Masten and Cicchetti2016).
The main idea is that compensation contributes to a mismatch between behavior and the pertinent underlying skill, such that behavioral presentation is better than would have otherwise been expected based on underlying abilities. A variety of terminologies have been mentioned that allude to the construct of compensation, including camouflaging or masking (Lai et al., Reference Lai, Lombardo, Ruigrok, Chakrabarti, Auyeung, Szatmari, Happé and Baron-Cohen2016; Petrolini et al., Reference Petrolini, Rodríguez-Armendariz and Vicente2023), compensatory learning (Frith, Reference Frith1991), adaptation (Johnson et al., Reference Johnson, Jones and Gliga2015), developmental modifiers (Johnson et al., Reference Johnson, Charman, Pickles and Jones2021), coping (Lai & Szatmari, Reference Lai and Szatmari2019), compensatory neural activity for genetic risk (Kaiser et al., Reference Kaiser, Hudac, Shultz, Lee, Cheung, Berken, Deen, Pitskel, Sugrue and Voos2010), resilience (Stallworthy & Masten, Reference Stallworthy and Masten2022), and nonlinearity (Cicchetti & Cannon, Reference Cicchetti and Cannon1999). All these concepts focus on individual differences in the underlying vulnerabilities that promote an improvement or worsening of a phenotype.
Social behavior challenges vary dimensionally across the population. The autism literature, which describes one context in which social challenges manifest, offers a framework for characterizing and understanding normative variations in compensation for deficits or vulnerabilities (Livingston & Happé, Reference Livingston and Happé2017). For example, research on trajectories of development in autism suggests many autistic people experience improvement over time, with extensive variation in behavioral and cognitive abilities (Helles et al., Reference Helles, Gillberg, Gillberg and Billstedt2017; Howlin & Magiati, Reference Howlin and Magiati2017; Lord et al., Reference Lord, Bishop and Anderson2015; Woodman et al., Reference Woodman, Smith, Greenberg and Mailick2015, Reference Woodman, Smith, Greenberg and Mailick2016). However, the field does not yet fully understand why there is such heterogeneity in behavior and cognition and what it means for understanding and supporting neurodivergent people. Some studies show cognition and behavior are not associated in autism (Altschuler et al., Reference Altschuler, Sideridis, Kala, Warshawsky, Gilbert, Carroll, Burger-Caplan and Faja2018; Geurts et al., Reference Geurts, Corbett and Solomon2009), as well as other conditions such as those with diagnoses of mood (Demant et al., Reference Demant, Vinberg, Kessing and Miskowiak2015) and anxiety (Dyer et al., Reference Dyer, Attwood, Penton-Voak and Munafò2022) disorders, which suggests some people may be using other compensatory resources to exhibit adaptive behavior despite not having the full foundation of requisite cognitive skills. Moreover, given developmental psychopathology theory (Cicchetti, Reference Cicchetti1984) which suggests social behavior challenges vary dimensionally in the community to reflect individual differences in real-world adaptive social behavior (Constantino et al., Reference Constantino, Davis, Todd, Schindler, Gross, Brophy, Metzger, Shoushtari, Splinter and Reich2003), research is needed to test whether compensatory skills are evident among children in the community who vary in observable real-world social behavior challenges.
The literature on social compensation to date suggests cognitive and mental health differences characterize compensators. Studies suggest having better cognitive abilities, such as higher intelligence and executive function skills, is a potential mechanism of compensation (Hull et al., Reference Hull, Petrides and Mandy2021; Livingston et al., Reference Livingston, Colvert, Social Relationships Study, Bolton and Happé2018). However, other studies did not show such cognitive differences (Corbett et al., Reference Corbett, Schwartzman, Libsack, Muscatello, Lerner, Simmons and White2021; Hull et al., Reference Hull, Petrides and Mandy2021). Some studies suggest that this compensation may come at a “cost” in terms of poorer mental health, with compensators who have more socially adaptive behavior despite underlying social cognitive challenges also struggling with higher internalizing symptoms (Livingston et al., Reference Livingston, Colvert, Social Relationships Study, Bolton and Happé2018). This is particularly true for camouflaging, a specific type of compensation defined as the subjective experience of trying “to put on their best normal,” as people who camouflage autistic behaviors have been found to have worse depression, anxiety, and stress across multiple studies (Bernardin et al., Reference Bernardin, Lewis, Bell and Kanne2021; Cage et al., Reference Cage, Di Monaco and Newell2018; Cage & Troxell-Whitman, Reference Cage and Troxell-Whitman2019; Hull et al., Reference Hull, Levy, Lai, Petrides, Baron-Cohen, Allison, Smith and Mandy2021; Livingston et al., Reference Livingston, Colvert, Social Relationships Study, Bolton and Happé2018; Zhuang et al., Reference Zhuang, Tan, Reddrop, Dean, Maybery and Magiati2023). Camouflaging has also been linked with engaging in unhealthy and dangerous coping mechanisms, such as substance use (Livingston, Reference Livingston2021; Weir et al., Reference Weir, Allison and Baron-Cohen2021) and suicidal ideation (Cassidy et al., Reference Cassidy, Bradley, Shaw and Baron-Cohen2018, Reference Cassidy, Gould, Townsend, Pelton, Robertson and Rodgers2020). Therefore, more work is needed to examine the cognitive and mental health characteristics of compensation to best understand and support people who may experience a mismatch between cognition and behavior.
The two main ways of measuring social compensation in the literature are the behavior-cognition discrepancy approach and the self-report approach (Milner et al., Reference Milner, Colvert, Mandy and Happé2023). The behavior-cognition discrepancy approach is thought to elucidate underlying mechanisms of compensation that are not apparent when considering self-report of behavior alone (Livingston et al., Reference Livingston, Colvert, Social Relationships Study, Bolton and Happé2018; Livingston & Happé, Reference Livingston and Happé2017; Livingston et al., Reference Livingston, Shah and Happé2019a, Reference Livingston, Shah and Happé2019b; Livingston et al., Reference Livingston, Shah, Milner and Happé2020; McPartland, Reference McPartland2019). This approach operationalizes compensation by comparing individuals with adaptive real-world social behavioral functioning (i.e., fewer social behavior challenges) despite an underlying propensity (i.e., difficulties with social cognition skills) for maladaptive real-world social behavioral functioning (high compensation group) to individuals with equally poor underlying propensity but with maladaptive real-world social behavioral functioning (low compensation group), suggesting that observed differences between the two groups indicate potential compensatory mechanisms or consequences. People with adaptive real-world social behavioral functioning and without an underlying propensity for maladaptive real-world social behavioral functioning (deep compensation group) are compared to those with maladaptive real-world social behavioral functioning despite no underlying propensity for maladaptive real-world social behavioral functioning (unknown compensation group) as a control to establish that differences between groups are not simply a function of variability on the real-world adaptive behavior measure (Milner et al., Reference Milner, Colvert, Mandy and Happé2023).
One potential reason for the mixed findings in the social compensation literature to date is that only a limited range of tasks have been used, despite the literature suggesting there are a variety of related social cognitive processes that are interdependent rather than independent from each other (Happé et al., Reference Happé, Cook and Bird2017). The majority of literature to date on the behavior-cognition discrepancy approach to studying social compensation has focused on theory of mind as the underlying cognitive vulnerability for maladaptation used to create groups, but a variety of other social cognitive and perceptual processes have been found to be associated with social behavior challenges, including face processing and emotion recognition (Morrison et al., Reference Morrison, Pinkham, Kelsven, Ludwig, Penn and Sasson2019). Therefore, it is likely that other social cognitive or perceptual processes may be involved in social compensation. Behavior-cognition discrepancy compensation work is needed to test the possibility that other potential underlying vulnerabilities besides theory of mind, such as emotion recognition, may play a crucial role in compensation.
In addition to methodological variation, the literature on social compensation to date has not yet considered the stability versus change of compensation grounded in developmental psychopathology theory. A developmental psychopathology perspective provides a framework to advance the concept of compensation, based on the large literature examining how people adapt and show resilience in the face of risk (Luthar et al., Reference Luthar, Cicchetti and Becker2000; Masten, Reference Masten2001, Reference Masten2006; Masten & Cicchetti, Reference Masten and Cicchetti2016; Masten & Curtis, Reference Masten and Curtis2000; Masten et al., Reference Masten, Lucke, Nelson and Stallworthy2021). In developmental psychopathology, there has been longstanding interest in the idea that adaptive and maladaptive functions and behaviors change over time to promote or undermine development with significant implications for causal theory, prevention, and treatment (Cicchetti, Reference Cicchetti2013, Reference Cicchetti, Hartup and Weinberg2014; Cicchetti & Curtis, Reference Cicchetti and Curtis2007). Overall, a developmental psychopathology perspective is needed to understand circumstances that would lead children to start to draw on alternative cognitive or neural pathways to solve a problem or perform a function in a particular context and to understand the pathways through which these circumstances arise across the lifespan (Cook et al., Reference Cook, Hull, Crane and Mandy2021; Hull et al., Reference Hull, Petrides, Allison, Smith, Baron-Cohen, Lai and Mandy2017; Masten, Reference Masten2006; Masten & Cicchetti, Reference Masten and Cicchetti2010). From this framework, we can begin to answer the questions: how does compensation manifest across the full range of dimensional neurotypical and neurodivergent forms of ontogenesis, and to what extent does compensation demonstrate stability versus change across development?
It is critical to examine social compensation in community-ascertained, population-based samples, rather than clinical samples, to reflect developmental psychopathology theory on the full continuum of neurodiversity across development and the latest research on psychopathology that has been shifting toward a dimensional approach (Altschuler & Krueger, Reference Altschuler and Krueger2021; Kotov et al., Reference Kotov, Krueger and Watson2018; Krueger et al., Reference Krueger, Kotov, Watson, Forbes, Eaton, Ruggero, Simms, Widiger, Achenbach and Bach2018; Michelini et al., Reference Michelini, Palumbo, DeYoung, Latzman and Kotov2021). Moreover, recent work across neurodevelopmental conditions suggests compensation is not unique to autism (van Der Putten et al., Reference van Der Putten, Mol, Groenman, Radhoe, Torenvliet, van Rentergem and Geurts2024). If compensators have underlying social cognitive vulnerabilities but are not demonstrating these vulnerabilities with their external social behavior, they are less likely to meet criteria for traditional Diagnostic and Statistical Manual categorical diagnoses, which often involve behavioral observation to assess diagnostic features. People may have underlying vulnerabilities that they compensate for and thus do not exhibit during traditional diagnostic assessments. Accordingly, the field does not yet have a precise idea of how widespread the challenges are related to features of social cognition in the general population, since these difficulties have been a focus of clinical studies with relatively homogeneous comparison “control” groups rather than population-based studies with a wider range of clinical traits. To our knowledge, only two studies to date have examined compensation in a population-based sample, and they assessed self-reported camouflaging rather than behavior-cognition discrepancy approach to measuring compensation (Ai et al., Reference Ai, Cunningham and Lai2024a, Reference Ai, Cunningham and Lai2024b). Particularly given the theoretical and empirical rationale suggesting compensators may be missed in research that focuses on clinical samples or clinical recruitment strategies as defined by traditional categorical diagnoses and case–control designs, work is needed to examine compensation in the general population using community-ascertained recruitment methods.
Using community-ascertained samples that include people who do not meet the threshold for traditional categorical diagnoses will help elucidate compensatory processes for people with underlying vulnerabilities that are not currently part of the Diagnostic and Statistical Manual criteria for categorical diagnoses. For example, if someone has poor theory of mind but strong social skills, they will likely not come to clinical attention despite using compensation. It is problematic for advancing a comprehensive understanding of compensation that the literature has primarily focused on people who have categorical clinical diagnoses, because these people are less likely to be successfully compensating than people who do not have clinical diagnoses. Who compensates by exhibiting adaptive social behavior despite underlying social cognitive vulnerabilities? Most likely, many of these people will not fit with traditional clinical characterization strategies. Moreover, there has not yet been a longitudinal study examining the stability versus change in compensation group membership over time, which is critical for advancing an understanding of the developmental processes involved in compensation. Finally, beyond providing more information to understand the construct of compensation, a shift in research focus to population-based community samples that show evidence of compensation will also shed light on dimensional approaches to psychopathology.
The present study
To overcome limitations of extant compensation literature and reflect developmental psychopathology theory, it is therefore necessary to utilize and interpret a dimensional and developmental approach to psychopathology in a community-based and longitudinal sample. Indeed, evidence of compensation in community-ascertained, non-clinical samples would suggest that people who may not meet traditional categorical diagnostic criteria may be experiencing underlying vulnerabilities and challenges that warrant additional support and consideration when conceptualizing pathological tendencies. As well, exploration of instability versus stability of compensation group membership across different individuals in a longitudinal study of compensation would suggest that people who show changes in their discrepancy between skills and behavior across time may be exhibiting distinct developmental pathways for compensation compared to individuals who demonstrate the same pattern of discrepant skills and behavior across time.
In a study with a community-ascertained and longitudinal design, we used measures of social perception (emotion recognition) and real-world difficulties with social reciprocity (social behavior challenges) to define compensators. In addition, the following three measures were examined as correlates of compensation: self-report questionnaires assessing anxiety and depression as internalizing symptoms given the literature suggesting worse internalizing symptoms in compensators is specific to self-report of internalizing symptoms rather than parent-report (Livingston et al., Reference Livingston, Colvert, Social Relationships Study, Bolton and Happé2018), an intelligence test given the literature suggesting compensators have higher intelligence (Livingston et al., Reference Livingston, Colvert, Social Relationships Study, Bolton and Happé2018), and a task designed to test three attentional networks (alerting, orienting, and executive control) given the literature suggesting compensators have better cognitive function (Livingston et al., Reference Livingston, Colvert, Social Relationships Study, Bolton and Happé2018).
Based on developmental psychopathology theory, this study aims to understand the development of social compensation in a community-based sample that includes a wider range of functioning across the neurotypical and neurodivergent continuum across childhood. We aim to replicate the existing social compensation behavior-cognition discrepancy literature, which has exclusively focused on clinical samples to date, and extend this work to a longitudinal, community-ascertained sample to advance our understanding of developmental psychopathology across the neurotypical and neurodivergent continuum.
Aims
Aim 1. What are the concurrent cognitive and mental health characteristics of childhood social compensation?
Cognitive characteristics
We hypothesize that children with fewer social behavior challenges and poor emotion recognition performance (i.e., high compensators) will have better cognitive characteristics compared to children with more social behavior challenges and equally poor emotion recognition performance (i.e., low compensators). We hypothesize that cognitive characteristics will not differ for children with more social behavior challenges and good emotion recognition performance (i.e., unknown) compared to children with fewer social behavior challenges and equally good emotion recognition performance (i.e., no compensators), suggesting differences in these cognitive characteristics among high and low compensating children are due to compensation rather than simply variation in social behavior challenges.
Mental health characteristics
We hypothesize that high compensators will have elevated internalizing symptoms compared to low compensators; in contrast, internalizing symptoms will not differ for children with more social behavior challenges and good emotion recognition performance (i.e., unknown) compared to children with no compensation, suggesting differences in these mental health characteristics among high and low compensating children are due to compensation rather than differences simply being due to variation in social behavior challenges.
Aim 2. Does childhood social compensation classification demonstrate stability versus change?
We will explore the extent to which compensation group membership demonstrates stability versus change by first describing the percentage of children categorized as the same compensation group one year later (i.e., enduring classification) and the percentage of children categorized as a different compensation group one year later (i.e., unstable classification). We will then proceed with exploratory analyses to understand the extent of stability versus change in compensation classification. We will explore whether baseline compensation groups differ in the likelihood of stability in compensation group membership one year later.
Methods
Participants and procedure
This study used data from the Nathan Kline Institute Rockland Sample (NK-RS), as described in Nooner et al. (Reference Nooner, Colcombe, Tobe, Mennes, Benedict, Moreno, Panek, Brown, Zavitz and Li2012) and Tobe et al. (Reference Tobe, MacKay-Brandt, Lim, Kramer, Breland, Tu, Tian, Trautman, Hu and Sangoi2022), which is a repository of information collected from a nationally representative community sample of participants aged 6 to 85 years old. All measures examined in the present study were assessed at both Timepoint 1 (baseline) and Timepoint 2 (twelve to fifteen months after baseline). Participants were recruited to reflect the demographic composition of residents within Rockland County, New York, which is representative of the broader U.S. population. Written informed consent was obtained from adult participants and the parents or legal guardians of child participants, while assent was obtained from child participants. Participants then completed a comprehensive assessment with trained personnel during a 1-or 2-day visit to the Nathan Kline Institute. A follow-up visit was conducted twelve to fifteen months after the baseline visit. Participants were compensated $200 to $250 plus travel and meal costs. Ethics approval for this project was obtained from an Institutional Review Board at the Nathan Kline Institute and Montclair University. The present study included all minor participants who provided data on the Social Responsiveness Scale questionnaire and the Penn Emotion Identification Test from the Penn Computerized Neurocognitive Battery. The resultant sample consisted of 315 children (140 female), aged 7–17 years old (M = 12.15, SD = 2.97). For all demographic questions, participants aged 12 to 17 years old answered the questions, and the guardians of participants aged 7 to 11 years old answered the questions (see Table 1).
Participant demographic questions (N = 315)

Table 1 Long description
A table summarizing participant demographics including sex, ethnicity, race, language, household income, and more. The table has 12 rows and 3 columns. Column headers are 'n', '%', and the questions asked. Row labels include questions such as 'What is your sex?', 'What is your ethnicity?', 'What is your race?', 'What is your native language?', 'What second language do you and your family speak at home?', and 'What is your annual household income?'. The table lists the number of participants (n) and the percentage (%) for each response category. For example, under 'What is your sex?', there are 175 males (55.56 percent) and 140 females (44.44 percent). The table provides detailed demographic information about the participants in the study.
Measures
The number of participants varied for each task depending on age range and data completion (see Table 2 for number of participants with complete data, range, mean, and standard deviation for each task per group). Prior to testing, participants were asked to turn off their cell phones (if applicable) to limit any potential distractions or interruptions. Participants were encouraged to take short breaks as needed in between assessments to prevent interruptions during individual parts of the battery. White noise machines were turned on outside of the testing room to limit any background noise coming from other parts of the testing center and ensure privacy. Participants were seated directly across from the examiner, and all testing materials were hidden from participants’ view when not in use.
Participant characteristics at timepoint 1 (N = 315)

Table 2 Long description
The table presents participant characteristics at timepoint 1, divided into five groups: Low compensation, High compensation, No compensation, Unknown, and Full sample. It includes 12 rows and 15 columns. The columns are labeled as follows: N, M, Min, Max, and SD for each group, plus an overall Median and M for the Full sample. The rows are labeled with different variables: Age, FSIQ, VIQ, NVIQ, Sex Ratio, PEIT, PRS, SCI, ANT Alert, ANT Orienting, ANT Conflict, MASC, and CDI. Each row provides specific values for the variables across the different groups. For example, the Age row shows the number of participants (N), mean (M), minimum and maximum values (Min - Max), and standard deviation (SD) for each group. The table captures detailed numerical data for each variable and group, allowing for comparisons across different compensation levels.
Note. PEIT = Penn Emotion Identification Test Age-Normed Accuracy Scores; PRS = Penn Emotion Identification Test Raw Accuracy Scores; SCI = Social Responsiveness Scale-Parent Report Social Communication and Interaction Scale t-score; ANT Alert = Attention Network Task Alert Effect; ANT Orienting = Attention Network Task Orienting Effect; ANT Conflict = Attention Network Task Conflict Effect; MASC = Multidimensional Anxiety Scale for Children Total t-score; CDI = Children’s Depression Inventory Total t-score.
Intellectual ability
The Wechsler Abbreviated Scale of Intelligence-Second Edition (Wechsler, Reference Wechsler2011) (WASI-2) estimates intelligence quotient (IQ) for 6–90-year-olds. The WASI has documented reliability and validity (Watkins & Canivez, Reference Watkins and Canivez2022; Wechsler, Reference Wechsler2011). The WASI-2 consists of four subtests. The Vocabulary and Similarities subtests comprise a Verbal Comprehension Index, assessing verbal crystallized ability, which is used to index verbal IQ (VIQ). The Block Design and Matrix Reasoning subtests comprise a Perceptual Reasoning Index, assessing nonverbal, fluid ability, which is used to index nonverbal IQ (NVIQ). Full-scale intelligence (FSIQ) was examined in the present study, with larger scores indicating higher intelligence. In the full sample used in the present study, the mean was 103.4 and the standard deviation was 13.0.
Social cognition
The Penn Computerized Neurocognitive Battery (Gur et al., Reference Gur, Richard, Hughett, Calkins, Macy, Bilker, Brensinger and Gur2010) (PCNB) is a computerized battery. The PCNB has documented reliability and validity (Di Sandro et al., Reference Di Sandro, Moore, Zoupou, Kennedy, Lopez, Ruparel, Njokweni, Rush, Daryoush and Franco2024; Gur et al., Reference Gur, Ragland, Moberg, Turner, Bilker, Kohler, Siegel and Gur2001, Reference Gur, Richard, Hughett, Calkins, Macy, Bilker, Brensinger and Gur2010; Moore et al., Reference Moore, Reise, Gur, Hakonarson and Gur2015; Scott et al., Reference Scott, Moore, Roalf, Satterthwaite, Wolf, Port, Butler, Ruparel, Nievergelt and Risbrough2023). It takes an average of one hour to complete and provides measures of accuracy and speed in a variety of neurocognitive domains using tests that were previously validated with functional neuroimaging. For this battery, the following instructions were given to the participants: “We will now do some memory and puzzle-like games on the computer. Some are easy and some are more difficult. Don’t worry if you make mistakes – everyone does. Try your hardest, work accurately and quickly. Some questions may take more time than others, and that’s OK. Just do your best for each one. I will let you know when you can take a break, if you want one. Do you have any questions?” All participants were given noise-canceling headphones to wear during testing to prevent background noises from distracting them or interfering with the task. Throughout testing, participants were actively monitored by examiners. Extra assistance was provided as needed by providing verbatim instructions clearly as participants moved through the practice rounds. Extra assistance was provided only during the practice rounds and never during the tests themselves. Breaks were provided between tasks at examiner discretion as deemed necessary. One neurocognitive domain from this battery is used in the present study, the Penn Emotion Identification Test, which measures the social cognition domain of emotion recognition: specifically, the ability to decode and correctly identify facial expressions of emotion. Participants are shown 40 faces (one at a time) and must determine whether the emotional expression conveyed by the actor’s face is happiness, sadness, anger, fear, or neutral. There are 4 women and 4 men depicting each emotion (4 × 2 × 5 = 40 stimuli). Accuracy and speed values are recorded. Given normative changes in reaction time across development and the wide age range of the present study, emotion recognition accuracy (a minimum possible value of 0 and a maximum possible value of 40) was used. Participants’ accuracy scores were age-normed to create the dependent variable used in the present study, with higher scores indicating better emotion recognition ability. In the sample used in the present study, the mean was −0.12 and the standard deviation was 1.03.
Social behavior challenges
The Social Responsiveness Scale-Parent Report (Constantino et al., Reference Constantino, Davis, Todd, Schindler, Gross, Brophy, Metzger, Shoushtari, Splinter and Reich2003) (SRS) is a 65-item parent-report questionnaire for children and adolescents that measures the degree of difficulties with reciprocal social behavior as they occur in natural social settings. The SRS has documented reliability and validity (Bölte et al., Reference Bölte, Poustka and Constantino2008; Constantino et al., Reference Constantino, Davis, Todd, Schindler, Gross, Brophy, Metzger, Shoushtari, Splinter and Reich2003; Hus et al., Reference Hus, Bishop, Gotham, Huerta and Lord2013; Wigham et al., Reference Wigham, McConachie, Tandos, Le Couteur and Gateshead Millennium Study core2012). In the present study, this questionnaire was given to parents of child participants between 7 and 17 years old. The SRS assesses social awareness, social information processing, capacity for reciprocal social communication, social anxiety/avoidance, and autistic preoccupations and traits. Each item on the scale asks about an observed aspect of real-world behavior. Behaviors are rated on a 4-point scale, with 0 = Not true, 1 = Sometimes true, 2 = Often true, 3 = Almost always true, and 4 = Always true. Higher scores on the SRS Social Communication and Interaction Scale (SRS SCI) indicate higher degrees of real-world difficulties with social reciprocity (more social behavior challenges). The SRS SCI t-score is calculated by combining raw scores from the Awareness (e.g., Is aware of what others are thinking or feeling), Cognition (e.g., Takes things too literally and doesn’t get the real meaning of a conversation), Communication (e.g., Is able to communicate his or her feelings to others), and Motivation (e.g., Would rather be alone than with others) subscales and converting the total into the SRS SCI t-score, which is normed by gender (“male” / “female”). The SRS SCI is used in the present study. In the current sample, the mean t-score was 49.86 (standard deviation = 8.10). Forty-four participants scored above the SRS SCI t-score clinical cut-off of 59.
Attentional networks
The Attention Network Task (ANT) (Fan et al., Reference Fan, McCandliss, Sommer, Raz and Posner2002; Posner & Petersen, Reference Posner and Petersen1990) is a computer-based task designed to measure alerting, orienting, and executive control attention networks. The ANT has documented reliability and validity (Fernández-Marcos et al., Reference Fernández-Marcos, de la Fuente and Santacreu2018; Ishigami et al., Reference Ishigami, Eskes, Tyndall, Longman, Drogos and Poulin2016; MacLeod et al., Reference MacLeod, Lawrence, McConnell, Eskes, Klein and Shore2010). For this task, participants 13 years old and older were given the following instructions: “This is an experiment investigating attention. You will be shown an arrow on the screen pointing either to the left or to the right. Your task is to press the left arrow key on the keyboard when the middle arrow points left and the right arrow when the middle arrow points right. Use your index finger for the left arrow and your right index finger for the right arrow…Sometimes the middle arrow will be surrounded by two arrows to the left and right. Your task is to respond only to the direction of the central arrow. Please make your response as quickly and accurately as possible…There will be a cross in the center of the screen, and the arrows will appear either above or below the cross. You should try to look at the cross throughout the experiment. On some trials there will be asterisks indicating when or where the arrow will occur. You may look at these asterisks when they appear…There is one practice session, which takes 2 minutes. Then there are 3 test sessions; each are 5 minutes long. You can take a short break between the sessions if you’d like. If you have any questions, please ask the experimenter. If you understand these instructions, you may start the practice session.” If participants began using one hand to select the arrow keys, they were reminded to use their right and left index fingers for the right and left arrow keys, respectively. All testing was performed in a quiet environment with active monitoring by an examiner. Participants under 13 years old were given a nearly identical task, but the arrows were instead represented by fish, which were “fed” by the participant with each correct response. For this version of the test, instructions were read verbatim from the ANT task on the computer screen. All participants were given noise-canceling headphones to wear during testing to prevent background noises from distracting them or interfering with the task.
After the initial fixation crosshair of random variable duration (i.e., 400–1600 ms), one of four possible warning cues appears for 100 ms (e.g., no cue, center cue, double cue, spatial cue). After another fixation phase of 400 ms, both the target and the flankers appear until the participant responds or a maximum of 1700 ms has elapsed. The target stimulus (leftward or rightward arrowhead) is flanked on either side by two arrows pointing in the same direction (congruent condition), opposite direction (incongruent condition), or by simple lines (neutral condition). Participants are required to indicate the target direction by pressing one of the two input keys on a keyboard. Then, an inter-trial interval of 3500 ms occurs. Each session consists of 24 practice trials, followed by 3 experimental blocks of 96 trials.
The ANT yields 3 variables. Attentional conflict, alerting, and orienting effects were computed as derived by Fan et al. (Reference Fan, McCandliss, Sommer, Raz and Posner2002). The ANT conflict effect was the primary dependent variable in the present study because it measures executive function. The ANT alerting effect and the ANT orienting effect were explored in the present study to understand the role of other forms of attention.
The ANT conflict effect, with higher scores indicating worse executive function performance, assesses executive control through resolving conflict among responses. The conflict effect was calculated by subtracting the mean reaction time of all congruent flanker conditions, summed across cue types, from the mean reaction time of incongruent flanker conditions. Eleven participants (3.49%) had missing data for the ANT conflict effect. In the current sample (n = 304), the mean was 79.61 ms (standard deviation = 73.7 ms).
The ANT alerting effect, for which higher scores indicate better alerting performance, measures the ability to achieve and maintain an alert state. The alerting effect was calculated by subtracting the mean reaction time of the double-cue conditions from the mean reaction time of the no-cue conditions. Ten (3.17%) participants had missing data for the ANT alerting effect. In the current sample (n = 305), the mean was 54.58 ms (standard deviation = 70.2 ms).
The ANT orienting effect, for which higher scores indicate better orienting performance, measures the selection of information from sensory input. Orienting is manipulated by presenting a cue indicating where in space a person should attend, thereby providing a basis for the person to direct attention to the cued location either overtly by moving the eyes or covertly without eye movement. The orienting effect was calculated by subtracting the mean reaction time of the spatial cue conditions from the mean reaction time of the center cue. Nine participants (2.86%) had missing data for the ANT orienting effect. In the full sample used in the present study (n = 306), the mean was 31.64 ms (standard deviation = 67.7 ms).
Internalizing symptoms
The Multidimensional Anxiety Scale for Children (March et al., Reference March, Parker, Sullivan, Stallings and Conners1997) (MASC) is a 39-item self-report questionnaire that assesses anxiety in children and adolescents (ages 8–19 years old). The MASC has documented reliability and validity (Baldwin & Dadds, Reference Baldwin and Dadds2007; March & Parker, Reference March and Parker2004; March et al., Reference March, Parker, Sullivan, Stallings and Conners1997; Villabø et al., Reference Villabø, Gere, Torgersen, March and Kendall2012). It uses four basic scales (physical symptoms, harm avoidance, social anxiety, and separation/panic) to form the measure of total anxiety. Participants are asked to rate their own behavior on a 4-point scale, with 0 = Never true about me, 1 = Rarely true about me, 2 = Sometimes true about me, 3 = Often true about me, and 4 = Always true about me. The MASC total t-score was used as a dependent variable in the present study, with higher scores indicating more self-reported anxiety symptoms. Twenty-two participants (6.98%) had missing data for the MASC. In the current sample (n = 293), the mean was 49.33 with a standard deviation of 10.80. Use of clinical cutoff scores is not recommended for the MASC (van Gastel & Ferdinand, Reference van Gastel and Ferdinand2008).
The Children’s Depression Inventory-Second Edition (Kovacs, Reference Kovacs1992) (CDI-2) is a 28-item self-report questionnaire that assesses current cognitive, affective, and behavioral signs of depression in children and adolescents (ages 7–17 years old). The CDI has documented reliability and validity (Anant et al., Reference Anant, Kaur, Nadarajan, Phua, Chong, Gluckman, Yap, Chen, Broekman and Meaney2023; Helsel & Matson, Reference Helsel and Matson1984; Kovacs, Reference Kovacs1992; Saylor et al., Reference Saylor, Finch, Spirito and Bennett1984; Yelimineti et al., Reference Yelimineti, Mackin, Goldstein, Finaas and Klein2025). Two scales (Emotional Problems and Functional Problems) and four subscales (Negative Mood/Physical Symptoms, Negative Self-Esteem, Interpersonal Problems, and Ineffectiveness) are assessed. Participants are asked to rate their own behavior by choosing which statement out of three possible statements for each item best describes their experience from the past two weeks. Specifically, participants are given the following instructions: “Kids sometimes have different feelings and ideas. This form lists the feelings and ideas in groups. For each group of three sentences, pick one sentence that describes you best for the past two weeks. After you pick a sentence from the first group, go on to the next group. There is no right or wrong answer. Just pick the sentence that best describes the way you have been recently.” For example, Item 1 lists the options “I am sad once in a while,” “I am sad many times,” and “I am sad all the time,” while Item 2 lists the options “Nothing will ever work out for me,” “I am not sure if things will work out for me,” and “Things will work out for me O.K.” The CDI-2 total t-score was used as the dependent variable in the present study, with higher scores indicating more depressive symptoms. Four participants (1.27%) had missing data for the CDI-2. In the current sample (n = 311), the mean was 51.82 with a standard deviation of 9.89. Use of clinical cutoff scores is not recommended for the CDI-2 (Matthey & Petrovski, Reference Matthey and Petrovski2002).
Analytic approach
Group creation
Based on existing social compensation literature (Livingston et al., Reference Livingston, Colvert, Social Relationships Study, Bolton and Happé2018), a median split approach was used create the primary groups of interest: a high compensation group (those with low social behavior challenges despite poor emotion recognition) and a low compensation group (those with high social behavior challenges and poor emotion recognition). High versus low performance group membership for the Penn Emotion Identification Test was determined by first age-norming the raw accuracy scores through a regression-based approach calculating the residuals based on prior literature (Gur et al., Reference Gur, Butler, Moore, Rosen, Ruparel, Satterthwaite, Roalf, Gennatas, Bilker and Shinohara2021; Oosterhuis et al., Reference Oosterhuis, van der Ark and Sijtsma2016). Then, the age-normed Penn Emotion Identification Test accuracy scores were used to create groups using median splits (high-performance group for participants at or above the median and low-performance group for participants below the median). Next, high versus low social behavior challenges group membership was determined from the Social Responsiveness Scale by using the clinically validated cutoff of a t-score greater than or equal to 59 on the Social Responsiveness Scale Social Communication Index subscale as an indicator of high social behavior challenges (“scores in this range indicate deficiencies in reciprocal social behavior that are clinically significant and may lead to mild or moderate interference with everyday social interactions”) and a t-score less than 59 on the Social Responsiveness Scale Social Communication Index subscale as an indicator of low social behavior challenges. These thresholds resulted in four groups defined by these two measures (see Figure 1): 132 (41.90%) High Compensation (low social behavior challenges on the Social Responsiveness Scale and poor social cognition on the Penn Emotion Identification Test), 26 (8.25%) Low Compensation (high social behavior challenges on the Social Responsiveness Scale and poor social cognition on the Penn Emotion Identification Test), 139 (44.13%) No Compensation (low social behavior challenges on the Social Responsiveness Scale and good social cognition on the Penn Emotion Identification Test), and 18 (5.71%) Unknown (high social behavior challenges on the Social Responsiveness Scale and good social cognition on the Penn Emotion Identification Test).
The relation between Penn emotion identification test scaled scores and social responsiveness social communication and interaction T-scores. Dashed lines represent the (a) median penn score, and (b) the clinical cutoff of 59 for the SRS social communication and interaction scale t-score, resulting in four quadrants: Low compensation (n = 26), High compensation (n = 132), No compensation (n = 139), and Unknown (n = 18).

In the autism literature, the combination of having fewer social behavior challenges and better social cognition performance has been described as “deep compensation” because in autistic samples, it is expected that autistic people would have high social behavior challenges and low social cognition, so that autistic people with opposite pattern – low social behavior challenges and high social cognition – are thought to be deep compensators. However, in a community-based sample, we refer to this group as “no compensation” because of conceptual differences in the expected pattern. In a community-based sample, low social behavior challenges and high social cognition is the expected neurotypical pattern (“no compensation”).
Before proceeding with analyses, we checked the composition of the groups to ensure the groups were matched on the key demographic variables. There were no age or sex differences between the high and low compensation groups or between the no compensation and unknown groups (see Table 3).
Group comparisons (N = 315)

Table 3 Long description
The table compares demographic and cognitive variables across different compensation groups. It has two main sections: High Compensation versus Low Compensation and No Compensation versus Unknown Compensation. Each section includes columns for t (df), p-value, and Cohen's d. The rows are labeled with variables such as Age, FSIQ, VIQ, NVIQ, Sex Ratio, PEIT, SCI, ANT Alert, ANT Orienting, ANT Conflict, MASC, and CDI. Each row provides values for t (df), p-value, and Cohen's d for both sections. For example, the Age row shows t (df) values of 0.31 (156) and -0.94 (155), p-values of 0.75 and 0.35, and Cohen's d values of 0.07 and -0.24 respectively. The table captures the statistical comparisons and differences between the groups for each variable.
Note. PEIT = Penn Emotion Identification Test Age-Normed Accuracy Scores; SCI = Social Responsiveness Scale-Parent Report Social Communication and Interaction Scale t-score; ANT Alert = Attention Network Task Alert Effect; ANT Orienting = Attention Network Task Orienting Effect; ANT Conflict = Attention Network Task Conflict Effect; MASC = Multidimensional Anxiety Scale for Children Total t-score; CDI = Children’s Depression Inventory Total t-score; *=Chi square test for sex ratio; effect size is Cramer’s V.
Dimensional modeling
We then examined whether the results remained the same when emotion recognition ability was modeled dimensionally. We conducted separate regression analyses for each cognitive and mental health characteristic as the outcome while controlling for age, with the interaction between the clinically validated SRS group and the continuous emotion recognition ability measure as a predictor for each model.
Outliers
Given the likelihood of extreme scores in a community sample that covers a wider range of functioning than traditional clinical samples, any scores that were valid (i.e., possible to achieve on the measure) were included in analyses rather than removing statistical outliers. However, the number of outliers, defined as three standard deviations from the mean of the entire sample, for each task and comparison of results including or excluding outliers are shown in Supplemental Tables; the significance and direction of results remained the same when outliers were excluded.
Normality
Shapiro–Wilk tests were used to test whether values for each variable were normally distributed. FSIQ met the threshold for normality. All other variables (age, PEIT, SCI, ANT Alert, ANT Orienting, ANT Conflict, MASC, and CDI) showed non-normal distributions. Given that some but not all variables were normally distributed, group comparisons were conducted with both t-tests and Mann-Whitney U tests; the significance and direction of results remained the same for parametric and non-parametric tests (see Supplemental Tables).
Missing data
Missing data were handled listwise, such that any participant that had any missing value on any of the variables used in each analysis was excluded. We also examined whether there were differences in Penn Emotion Identification Test scores and Social Responsiveness Scale t-scores from children with and without missing data for each outcome and found that there were no differences between the missing and non-missing groups for all outcomes for which there was missing data.
Results
Characteristics of the four groups (low compensation, high compensation, no compensation, and unknown) and statistical results from one-way analyses of variance analyses comparing the four groups are shown in Table 2. A critical assumption of the study design is that key groups are matched on emotion recognition ability. This was true in the current dataset: low and high compensation groups did not differ statistically on emotion recognition scores (and both had low scores). Likewise, the no compensation and unknown groups did not differ from one another on emotion recognition scores (and both had high scores) (see Table 3). The results for the primary analyses of theoretical interest are reported in Tables 3 and 4.
Dimensional modeling regression results (N = 315)

Table 4 Long description
A table with 10 rows and 6 columns. The columns are labeled Estimate, Std. Error, t value, p-value, and R2. The rows are labeled FSIQ, VIQ, NVIQ, ANT Alert, ANT Orienting, ANT Conflict, MASC, and CDI. Each row contains values for each column. For example, the FSIQ row shows Estimate: 0.18, Std. Error: 0.53, t value: 0.35, p-value: 0.73, and R2: 0.00. The table presents regression results for different cognitive measures, with notable p-values and R2 values indicating the significance and fit of the models.
Note. Social behavior challenges (SCI) and emotion recognition (PEIT) interaction predicting cognitive and mental health outcomes controlling for age (N = 315); PEIT = Penn Emotion Identification Test Age-Normed Accuracy Scores; SCI = Social Responsiveness Scale-Parent Report Social Communication and Interaction Scale t-score; ANT Alert = Attention Network Task Alert Effect; ANT Orienting = Attention Network Task Orienting Effect; ANT Conflict = Attention Network Task Conflict Effect; MASC = Multidimensional Anxiety Scale for Children Total t-score; CDI = Children’s Depression Inventory Total t-score; R 2 = semi-partial (the proportion of variance in the outcome uniquely explained by the interaction, controlling for age); * = p < .05.
Aim 1. What are the concurrent cognitive and mental health characteristics of childhood social compensation?
To test the hypothesis that children with fewer social behavior challenges and poor emotion recognition performance (i.e., high compensators) have higher cognitive skills and more mental health challenges, t-tests were conducted comparing high compensators and low compensators on cognitive and mental health characteristics. To test the specificity of observed differences based on compensation versus variation as a function of social behavior challenges, t-tests were conducted comparing attentional alerting in children with more social behavior challenges and good emotion recognition performance (i.e., unknown group) to children with low social behavior challenges and good emotion recognition performance (i.e., no compensation group). To test whether the concurrent cognitive and mental health characteristics of child social compensation were consistent when emotion recognition was modeled dimensionally, regression analyses were conducted to test the hypothesis that there would be a significant interaction between SRS group (high versus low as determined by the clinically validated cutoff) and emotion recognition ability for the cognitive and mental health characteristics hypothesized. Results from the t-tests (see Table 3) were consistent in magnitude and significance with results from the regression analysis interaction effects (see Table 4).
Cognitive characteristics
Executive control as measured by the ANT conflict score did not differ significantly between high compensators (M = 85.61, SD = 64.02, n = 128) and low compensators (M = 110.80, SD = 60.29, n = 24). Intelligence also did not differ significantly between high compensators (M = 101.81, SD = 13.29, n = 132) and low compensators (M = 90.23, SD = 15.33, n = 26) although mean values were in the expected direction. Therefore, the current results were not consistent with the hypothesis that high compensators would have better executive control and higher intelligence compared to low compensators.
Attentional orienting did not differ significantly between high compensators (M = 30.63, SD = 69.84, n = 130) and low compensators (M = 29.5, SD = 78.23, n = 24). However, there was a significant difference in attentional alerting between high compensators (M = 61.85, SD = 69.84, n = 128) and low compensators (M = 7.92, SD = 46.19, n = 24), such that high compensators had a larger mean ANT alerting effect compared to low compensators. To test the specificity of this difference to compensation versus variation as a function of social behavior challenges, we compared attentional alerting in children with more social behavior challenges and good emotion recognition performance (i.e., unknown group) to children with fewer social behavior challenges and good emotion recognition performance (i.e., no compensation group). Attentional alerting did not differ significantly between the unknown group (M = 49.56, SD = 66.24, n = 18) and the group with no compensation (M = 56.65, SD = 72.04, n = 135). These results are consistent with differences in cognitive ability related to compensation, although the effect is present in a more basic aspect of attention than hypothesized (see Figure 2).
The interaction between emotion recognition ability and social behavior challenges significantly predicts attentional alerting (a) Stratified by SRS SCI group (high vs. low) and (b) SRS SCI represented continuously, with darker shading indicating higher SRS SCI t-scores.

Given the possibility that results based on the ANT could be driven by participants with accuracy scores below chance, all Aim 1 analyses involving the ANT were recomputed after eliminating participants with ANT accuracy scores below 50% (n = 29) to examine whether inclusion of children with low performance accuracy could be biasing the results. All effects remained the same when participants with chance performance on the ANT were excluded (see Supplemental Tables).
The literature on executive control predicts a positive value for the ANT conflict effect. That is, participants are expected to respond more slowly to the high-conflict trials than to the low-conflict trials. Therefore, negative scores are somewhat unexpected for the ANT conflict effect scores, indicating that participants are faster at responding to the conflict trials compared to the trials without conflict. To rule out the potential impact of unexpected negative scores on group differences among those who showed the expected effect, we re-ran all Aim 1 analyses involving the ANT after eliminating participants with ANT effect scores that were zero or negative (ANT Alert n = 48, ANT Orienting n = 75, ANT Conflict n = 34) to examine whether inclusion of participants with negative scores could be overly influencing the results. The results remained the same without the participants with zero or negative ANT scores (see Supplemental Tables).
Mental health characteristics
Anxiety symptoms did not differ significantly between high compensators (M = 49.44, SD = 10.91, n = 126) and low compensators (M = 48.96, SD = 11.53, n = 25); t(149) = 0.20, p = .84. There were significant differences in self-reported depression symptoms between high compensators (M = 51.34, SD = 10.30, n = 130) and low compensators (M = 57.42, SD = 10.59, n = 26) with low compensators showing elevated self-reported depression symptoms; t(154) = −2.74, p = 0.007. However, there were also significant differences in self-reported depression symptoms between children with more social behavior challenges and good emotion recognition performance (i.e., unknown) (M = 55.56, SD = 9.16, n = 18) compared to children with no compensation (M = 50.72, SD = 9.06, n = 137) with the unknown group showing elevated self-reported depression symptoms; t(153) = −2.13, p = 0.04. These results suggest that the group differences in internalizing symptoms may be due to variation in social behavior challenges rather than due to compensation.
Aim 2. Does childhood social compensation classification demonstrate stability versus change?
To explore the extent to which compensation group membership demonstrates stability versus change, the percentage of children categorized as having the same compensation group membership one year later (i.e., enduring classification) and the percentage of children categorized as having a different compensation group membership one year later (i.e., unstable classification) were evaluated. Only 43.17% of total participants who provided compensation group membership data at baseline (N = 315; low compensation [n = 26], high compensation [n = 132], no compensation [n = 139], and unknown [n = 18]) also had the social behavior challenges and emotion recognition measures needed to determine compensation group membership data one year later (N = 136; low compensation [n = 5], high compensation [n = 45], no compensation [n = 81], and unknown [n = 5]). Of the 136 participants with required compensation group membership data at both timepoints, 62.50% (n = 85) retained the same group membership one year later, and 37.50% (n = 51) changed group membership from baseline to follow-up one year later. At timepoint two (one year later), most participants were in the high compensation group (n = 45) or the no compensation group (n = 81), and only a few participants were in the low compensation group (n = 5) or the unknown group (n = 5). While the sample size for each of the four groups was not large enough to answer questions about growth trajectories or differences between groups over time, descriptive results revealed some patterns of both stability and change in compensation group membership over time. High compensators at baseline (n = 57) tended to either have an enduring classification (n = 29, 50.88% of high compensation at baseline) or change to the no compensation group (n = 26, 45.61% of high compensation group at baseline). Reciprocally, those in the no compensation group at baseline (n = 64) tended to either have an enduring classification (n = 51, 79.69% of no compensation at baseline) or change to the high compensation group (n = 12, 18.75% of no compensation at baseline) (see Figure 3).
The change in compensation group membership between timepoint 1 (baseline) and timepoint 2 (one year later).

To explore whether baseline compensation group membership differed in the likelihood of stable classification one year later, logistic regression analysis was conducted comparing the likelihood of enduring classification versus unstable classification based on baseline compensation group membership. The high compensation group was more likely to have unstable classification relative to the no compensation group, z = −3.26, p = 0.001, OR = .26. None of the other compensation groups significantly differed in their likelihood of having enduring classification relative to high compensators, ps > 0.19, ORs = 0.97–3.11. Change in SRS SCI t-scores and Penn scores between Timepoint 1 and Timepoint 2 based on Timepoint 1 compensation group membership are shown in Figure 4 (full sample) and Figure 5 (by age group).
Change in SRS SCI T-score and penn emotion identification test scaled score from timepoint 1 to timepoint 2.

Change in SRS SCI T-score and penn emotion identification test scaled score from timepoint 1 to timepoint 2 by age group.

Discussion
This study used a developmental psychopathology framework to understand a subgroup of children in the community who, despite difficulties with social cognition, show relatively few real-world social challenges in their behavior and are thus considered social compensators. To our knowledge, the present study is the first to look at social compensation using the behavior-cognition discrepancy approach in a community-based sample, as well as the first to examine the longitudinal stability versus instability of compensation group membership across development. Based on developmental psychopathology theory (Cicchetti, Reference Cicchetti1984, Reference Cicchetti2002, Reference Cicchetti2013, Reference Cicchetti, Hartup and Weinberg2014; Cicchetti & Cannon, Reference Cicchetti and Cannon1999; Cicchetti & Curtis, Reference Cicchetti and Curtis2007; Cicchetti & Toth, Reference Cicchetti and Toth2009; Luthar et al., Reference Luthar, Cicchetti and Becker2000) and dimensional approaches to psychopathology (Altschuler & Krueger, Reference Altschuler and Krueger2021; Kotov et al., Reference Kotov, Krueger and Watson2018; Krueger & DeYoung, Reference Krueger and DeYoung2020; Michelini et al., Reference Michelini, Palumbo, DeYoung, Latzman and Kotov2021), we predicted that studying compensation longitudinally and in a community-ascertained sample of children would provide valuable insight about compensation, neurotypical and neurodivergent development, and psychopathology more broadly. In this study, we applied a model of social compensation from the autism literature to a community sample using similar constructs of social behavior challenges and social cognition given our prediction that social compensation would be evident in the broader community of children who do not come to clinical attention. Cognitive correlates were examined to elucidate the cognitive processes that might facilitate having fewer social behavior problems despite underlying challenges in social cognition, and mental health correlates were examined to understand the potential “cost” of compensation. Previous autism literature has examined compensation in clinical samples including those with an autism diagnosis, but this approach is limited since exclusively examining compensation in clinical samples ignores the full range of social behavior and cognitive functioning seen across the neurotypical and neurodivergent continuum. Results of the present study supported our prediction that many children from the general population may be social compensators.
Concurrent cognitive and mental health characteristics of childhood social compensation
The first aim of the present study was to evaluate the concurrent cognitive and mental health characteristics of childhood social compensation in a community sample. To evaluate this, we first needed to create compensation groups using novel methods based on the prior compensation literature in autism but applied to a community-based sample. In the present study using a community-based sample, 41.90% of the sample were categorized in the high compensation group (n =132) at baseline while only 8.25% of the sample were classified as the low compensation group (n = 26) at baseline. In prior work with autistic samples such as Livingston et al. (Reference Livingston, Colvert, Social Relationships Study, Bolton and Happé2018), 31.82% of the sample was in the high compensation group (n = 32) and 29.63% of the sample was in the low compensation group (n = 40). Therefore, as expected, more community participants in the present study were classified as high compensators, while more autistic participants from past research were classified as low compensators. Nonetheless, there is still a substantial proportion of this community sample overall in the a priori compensation groups of interest – either in the high compensation or low compensation group (50.16%). Having this sample size to compare groups of children who have equally poor emotion recognition but vary in real-world social behavior skills allowed us to examine the effect of compensation and answer the individual differences question – why some people do well socially while others do poorly socially despite having equally poor social cognitive skills? The finding that over half of the community-based sample was in the compensation comparison groups of a priori theoretical interest (i.e., either in the high compensation or no compensation group) is noteworthy because it suggests the feasibility of further studying and understanding compensation in community samples.
While developmental psychopathology theory led us to expect distinct group differences, several of our predicted group differences were not observed. Contrary to our hypotheses, no unique concurrent differences between high and low compensators (without there also being differences between the control comparison groups as was the case for depression) were detected in internalizing symptoms, intelligence, or executive control. One possible reason for the lack of unique differences in internalizing symptoms is that this study focused on compensation defined as the discrepancy between expected behavior and cognition rather than considering more specifically masking (i.e., intentionally changing social behavior to fit into societal standards for acceptable social behavior and hide social behavior challenges). Self-reported intentions of changing social behavior and other ways of measuring masking were not measured in the present study, but this is important area of future follow up research on compensation in community samples. The question of whether community participants also mask behavior, or whether the masking type of compensation is specific to clinical populations, will provide valuable insight about the construct of compensation from a developmental psychopathology perspective. The literature on masking in autism demonstrates that masking is associated with autistic people feeling disconnected from their sense of identity and can lead to serious mental health concerns such as suicidal ideation (Miller et al., Reference Miller, Rees and Pearson2021). Future work is needed to test the possibility that internalizing symptoms associated with the “cost” of compensation may stem from the labeling and stigma associated with a clinical diagnosis of autism and with the intentionality of behavior change rather than simply having social behavior challenges from a dimensional perspective.
Although the expected effect of differences in executive function based on compensation was not found, novel differences in basic attentional processes that have not yet been examined in a compensation framework were detected in this community sample. Consistent with our exploratory hypothesis that there would be concurrent differences between high and low compensators in more basic forms of attention, differences in attentional alerting were detected concurrently. Compared to age-and intelligence-matched children with equally poor emotion perception but substantially more social behavior challenges (“low compensators”), high compensators demonstrated a better ability to achieve and maintain a general state of activation of cognitive systems (i.e., attentional alerting). Critically, this difference between high and low compensators in attentional alerting was not simply due to variation in assessed social behavior challenges; the other two groups in this sample, similarly split on social behavior challenges but showing good emotion perception, were comparable in their ability to achieve and maintain a general state of activation of cognitive systems. Moreover, this finding was also replicated with a dimensional analytic modeling approach that kept the emotion recognition ability assessment as continuous. Thus, it appears that the specific combination of having low social behavior challenges, despite average or below average emotion recognition ability, is associated with better attentional alerting.
Hyperfocus or flow – complete absorption in a task to the point where someone seems to completely “tune out” everything else – has been described as one attentional strength in the autism literature (Ashinoff & Abu-Akel, Reference Ashinoff and Abu-Akel2021; Dupuis et al., Reference Dupuis, Mudiyanselage, Burton, Arnold, Crosbie and Schachar2022). Attentional alerting is responsible for achieving and maintaining a state of sensitivity to incoming information. Although attentional alerting has been broadly studied in autism (Keehn et al., Reference Keehn, Lincoln, Müller and Townsend2010, Reference Keehn, Müller and Townsend2013), it has not been examined in a compensation framework. Inconsistent results have been found for attentional alerting in autism (Keehn et al., Reference Keehn, Lincoln, Müller and Townsend2010, Reference Keehn, Müller and Townsend2013; Pudło & Pisula, Reference Pudło and Pisula2022). To explain the inconsistent results, it has been hypothesized there may be separate subgroups on the autism spectrum with hyper-versus hypo-arousal (Keehn et al., Reference Keehn, Müller and Townsend2013). Our results suggest it is possible that there are subgroups of social compensators in the community with high levels of attentional alerting to help them overcome underlying challenges with social cognition. However, given literature suggesting low reliability for the ANT attentional alerting scores, which has been interpreted as suggesting this measure may reflect state-dependent processes rather than enduring characteristics of attention (MacLeod et al., Reference MacLeod, Lawrence, McConnell, Eskes, Klein and Shore2010), future work examining attentional alerting alongside a larger battery of attentional processing measures among compensators in community and clinical samples is needed to determine the extent to which our results replicate across samples and reflect enduring versus state-dependent processes of attention. Nonetheless, better alerting among children who compensate for challenges with social cognition found in the present study may explain some of the inconsistent findings in past clinical studies and allude to an attentional skill of sensitivity to information as a unique strength of social compensators in the community.
Stability versus change in childhood social compensation classification
The second aim of the present study was to examine the extent to which childhood social compensation classification demonstrates stability versus change. Results showed that baseline compensation group membership predicted the likelihood that compensation group membership was enduring versus unstable one year later. Specifically, the high compensation group was more likely to have unstable classification relative to the no compensation group. This is potentially consistent with the idea in the autism literature that “deep compensators” – with fewer social behavior challenges and good social cognition – are the most fully adapted to their environmental demands. From a developmental psychopathology perspective, it could be argued that enduring high compensators are more fully adapted than unstable high compensators since their classification of being a high compensator stays the same one year later, providing them with opportunities for continued positive cascading effects of adaptive social developmental interactions (Masten & Cicchetti, Reference Masten and Cicchetti2010).
Conclusions and future directions
The construct of compensation requires a developmental psychopathology-informed perspective to understand what compensation is and how it develops across the lifespan, along the neurotypical and neurodivergent continuum, and using multiple levels of analysis. A strength of this study is that it uses different measures of social cognition (i.e., emotion recognition) and social behavior challenges (i.e., a questionnaire designed for dimensional measurement in nonclinical community samples). This is useful because most prior compensation work has exclusively focused on the construct of theory of mind as the social cognition measure, even though other social cognitive skills are implicated in autism. For example, many studies have documented a difference showing that autistic groups have worse emotion recognition compared to neurotypical groups (e.g., Altschuler et al., Reference Altschuler, Trevisan, Wolf, Naples, Foss-Feig, Srihari and McPartland2021; Baron-Cohen et al., Reference Baron-Cohen, Leslie and Frith1985, Reference Baron-Cohen, Bowen, Holt, Allison, Auyeung, Lombardo, Smith and Lai2015; Block et al., Reference Block, Jannati, Maynard, Pascual-Leone and O’Connor2021; Zıvralı Yarar et al., Reference Zıvralı Yarar, Howlin, Charlton and Happe2021). From a dimensional perspective, lower levels of emotion recognition have also been found for people with high levels of self-reported social behavior challenges, independent of an autism diagnosis (e.g., Kothari et al., Reference Kothari, Skuse, Wakefield and Micali2013; Pazhoohi et al., Reference Pazhoohi, Forby and Kingstone2021). However, other studies did not find such differences in emotion recognition between autistic and neurotypical groups (e.g., Ammons et al., Reference Ammons, Doss, Bala and Kana2018; Carpenter et al., Reference Carpenter, Williams and Nicholson2019; Castelli, Reference Castelli2005; Gillespie-Lynch et al., Reference Gillespie-Lynch, Daou, Obeid, Reardon, Khan and Goldknopf2021; Gonzalez-Gadea et al., Reference Gonzalez-Gadea, Baez, Torralva, Castellanos, Rattazzi, Bein, Rogg, Manes and Ibanez2013; Tang et al., Reference Tang, Chen, Falkmer, Bölte and Girdler2019). Future research that follows up on our findings by utilizing neuroimaging, behavioral, cognitive, and physiological methods will inform a better understanding of whether some children are recruiting alternative neural or cognitive resources to achieve the same task performance as others who do not need to recruit such neural or cognitive resources. It critical for future research to examine compensation measured with multiple levels of analysis and multiple types of social cognition and social behavior to fully elucidate the developmental mechanisms of compensation.
Research suggests that some people engage in socially adaptive behavior such as eye contact by recruiting distinct physiological and neurological resources – a pattern that would not necessarily be detected from behavioral observation alone. This is in line with the hyperarousal model, which posits that the face and eyes of others are aversive stimuli to autistic people and therefore gaze avoidance is an adaptive response to this affective arousal (Richer & Coss, Reference Richer and Coss1976). This is also consistent with findings showing weaker functional connectivity between amygdala and fusiform gyrus in autistic participants when they process faces compared with neurotypical controls (Kleinhans et al., Reference Kleinhans, Richards, Sterling, Stegbauer, Mahurin, Johnson, Greenson, Dawson and Aylward2008). An ideal study to test compensation would examine differences in physiological arousal and brain function during tasks with high ecological validity to test the hypothesis that compensators will be recruiting more cognitive resources, using different neural networks (for example, recruiting non-social brain networks to perform in real-world social tasks for which non-compensators recruit social brain networks), and showing higher arousal than non-compensators to achieve the same surface-level behavior on a given social task. This approach would advance existing research that has been focused on the case–control design by comparing compensators versus non-compensators on neural, physiological, cognitive, and behavioral levels of analysis.
The present study has several limitations that limit the generalizability of our conclusions. The wide age range and relatively small sample size of the present study limit our ability to draw firm conclusions about how compensation may develop differently across different age ranges. For example, it is possible that children with poor emotion recognition may be more likely to be high compensators during developmental periods when emotion recognition is even more crucial for social success. In early childhood, there may be less reliance on other more verbal social cues, and it is more developmentally typical to struggle with emotion recognition compared to young adulthood. Therefore, it is possible that it might be easier to identify compensators at younger ages when using emotion recognition as the measure of social cognition. The developmental trajectory of emotion recognition is important to study alongside the developmental trajectory of compensation in future work. Moreover, future work should consider more developmentally appropriate measures of social cognition, such as advanced theory of mind tasks, for young adults. There is research showing theory of mind and emotion recognition are overlapping constructs, but there is debate about the extent to which emotion recognition is a more advanced form of social cognition versus a more basic emotion perception skill (Oakley et al., Reference Oakley, Brewer, Bird and Catmur2016).
In addition, it is possible that some of the findings in this community sample that did not replicate the findings in previous autistic samples – such as higher intelligence, executive control, and internalizing symptoms – could be due to differences in the measures used to define compensation rather than a difference between the community sample and prior clinical samples. It is important for future work to study compensation in both community and clinical samples, truly capturing the full range of potential compensation. This is particularly true because emotion recognition difficulties are transdiagnostic and linked to conditions including depression, anxiety, and schizophrenia as well as autism (England-Mason, Reference England-Mason2020; Revilla et al., Reference Revilla, Nelson, Heilman, Prothro, Cheever, Hersey, Dede and Hudac2025; Zarate-Guerrero et al., Reference Zarate-Guerrero, Duran and Naismith2022). Future work should measure multiple types of behavior and cognition, as well as neuroimaging and physiological measures, to assess the construct of compensation using measures of social adaptation and social cognition in clinical and community samples with a full range of functioning across development to understand compensation. For example, examining the relations among multiple behavioral, neurobiological, and cognitive variables of theoretical interest and their potential effects on compensation across a full spectrum of transdiagnostic clinical and nonclinical community samples, can identity which factors are most strongly associated with compensation outcomes over time as well as how these multiple levels of analysis may interact to influence compensation outcomes. Finally, future work should follow up on our novel finding about attentional alerting as a characteristic of compensation in community samples. The extent to which attentional alerting, hyperfocus, and compensation are associated in community samples is an open question. While our results suggest the specificity of the alerting attentional network, rather than conflict and orienting, in characterizing compensation, future longitudinal work is needed to tease apart the directionality of the effect and establish whether enhanced attentional alerting among high compensators is helping children compensate or is a result of compensation.
Our findings suggest that children in the community who are struggling with an underlying social cognitive challenge but warrant clinical support may not be coming to clinical attention. Policies that enact population-based screening measures to identify high compensators that are not yet coming clinical attention may be useful. In addition, our results suggest the need to take a neurodiversity-affirming approach to education about compensation and screening for social vulnerabilities beyond traditional methods of clinical care. Many people who are compensating experience stigma and shame and feel as though they must hide their challenges to prevent social, educational, and occupational difficulties (Ai et al., Reference Ai, Cunningham and Lai2024a; Han et al., Reference Han, Scior, Avramides and Crane2022; Perry et al., Reference Perry, Mandy, Hull and Cage2022; Rivera & Bennetto, Reference Rivera and Bennetto2023; Tamura et al., Reference Tamura, Cage, Perry, Hongo, Takahashi, Seto, Shimizu and Oshima2025). Our findings suggest that a large proportion of children who are not clinical patients have the capacity to compensate and overcome underlying vulnerabilities. Children who are taught early in development that being different does not mean being less, the message of the neurodiversity movement, may be more likely to seek out resources to help them compensate without the “cost” of mental health struggles.
In the neurotypical world, many neurodivergent people feel as though they need to hide their differences due to “neuronormativity” (Wise, Reference Wise2023). A community-based, developmental psychopathology framework to conceptualizing compensation has the potential to help inform advocacy work promoting acceptance of neurodivergence. Specifically, by focusing on how some children have unique strengths (e.g., attentional mechanisms) that help them overcome underlying challenges (e.g., emotion recognition difficulties) to adapt socially (e.g., reduce social behavior challenges), many people with underlying social cognitive challenges may feel empowered to develop and seek support for promoting their strengths. From an intervention standpoint, the results of this study suggest that promoting increased attentional alerting may facilitate compensation in the broader community. For example, prior work has shown that training through video games or computer exercises can improve aspects of attentional alerting (Posner et al., Reference Posner, Rothbart and Tang2015). Attentional networks develop in childhood with significant variability in self-regulation in response to training (Pozuelos et al., Reference Pozuelos, Paz-Alonso, Castillo, Fuentes and Rueda2014; Rueda et al., Reference Rueda, Fan, McCandliss, Halparin, Gruber, Lercari and Posner2004, Reference Rueda, Posner, Rothbart, Blair, Zelazo and Greenberg2016). The existing literature on enhancing attention through training suggests a starting point for strength-based training that could be useful to apply to research, practice, and policy work extending beyond clinical populations and potentially integrating such training programs into schools to reach more people who may benefit from compensating. Directing people with challenges in social cognition to harness attentional strengths may help them compensate for underlying vulnerabilities.
Overall, this study was the first to examine whether the construct of social compensation exists in a community-based sample in children who are low in social behavior challenges despite having poor emotion recognition and to examine stability and change in social compensation over time. Understanding the construct of compensation in a community-ascertained rather than a clinical sample is critical for elucidating a broader phenotype of neurodiversity and resilience using a strength-based perspective.
Supplementary material
The supplementary material for this article can be found at https://doi.org/10.1017/S0954579425101077.
Data availability statement
The data are available upon request from the Nathan Kline Institute. The analysis code is available upon request.
Acknowledgements
The authors would like to thank Dr Kathleen Thomas and Dr Dante Cicchetti for their feedback, as well as Dr Emily Slade and Ms. Megan Hall from the Biostatistics Consulting and Interdisciplinary Research Collaboration Lab for their assistance with the revision. The authors would also like to thank Mr. Howard Altschuler for his steady encouragement and support. Preliminary results were presented at the Society for Research in Child Development Annual Meeting in Minneapolis, MN in May 2025.
Funding statement
Data for this project were provided by the Nathan Kline Institute Rockland Sample (NKI-RS). We gratefully acknowledge the grants supporting the generation of the NKI-RS dataset: R01MH094639, R01MH101555, R01AG047596, and U01MH099059. This material is based upon work supported by the National Science Foundation Graduate Research Fellowship Program (NSF-GRF 00074041) to Dr Melody Altschuler. Any opinions, findings, and conclusions or recommendations expressed in this material are those of the author(s) and do not necessarily reflect the views of the National Science Foundation.
Competing interests
The authors declare none.
Pre-registration statement
This study used existing data from the Nathan Kline Institute Rockland Sample and originated as part of the first author’s dissertation, with hypotheses specified in a committee-approved dissertation proposal but not formally preregistered on a public platform.
AI statement
No generative AI tools were used to generate text, analyze data, or create images for this manuscript. All writing, analyses, and interpretations were conducted by the authors.
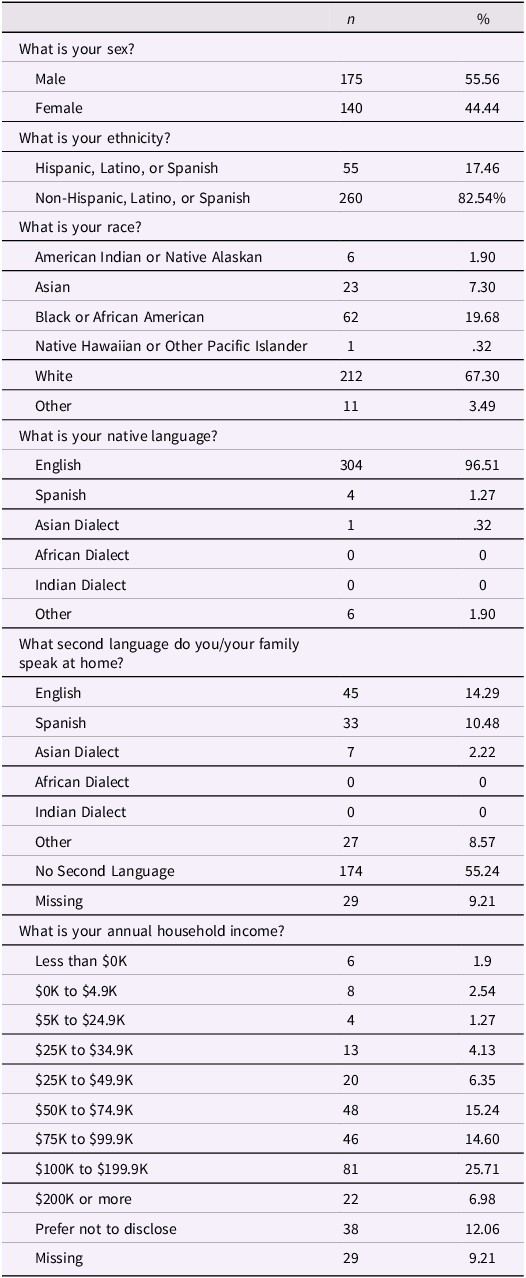
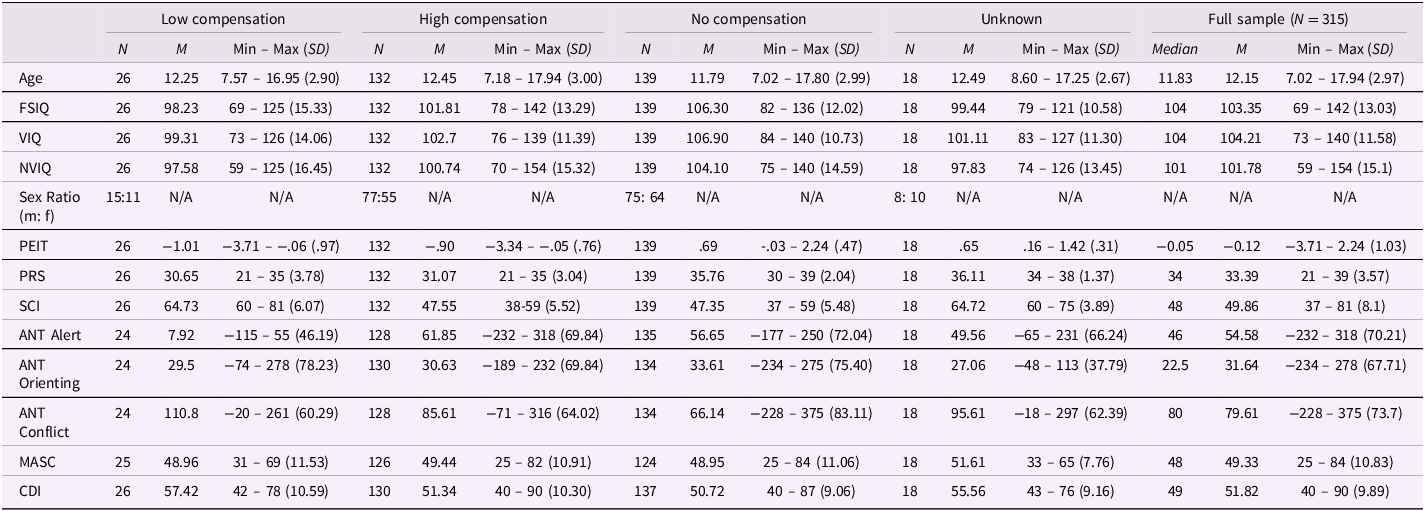

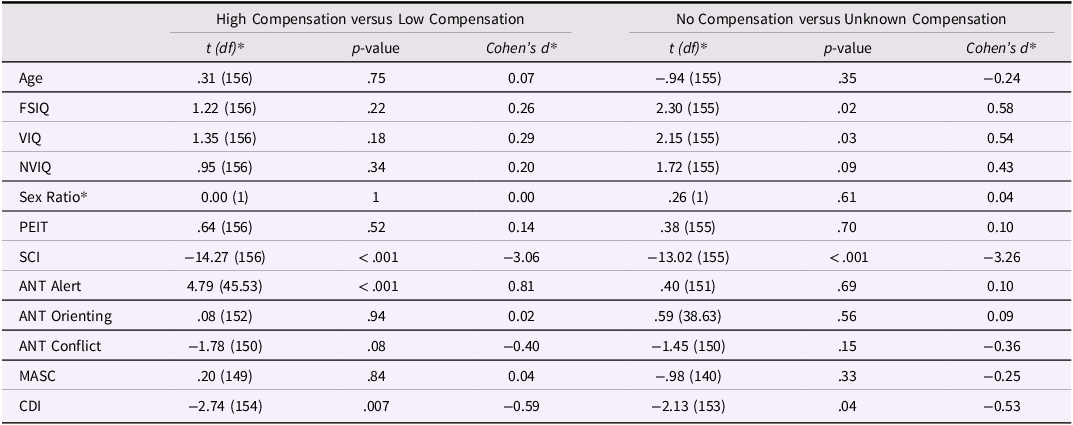
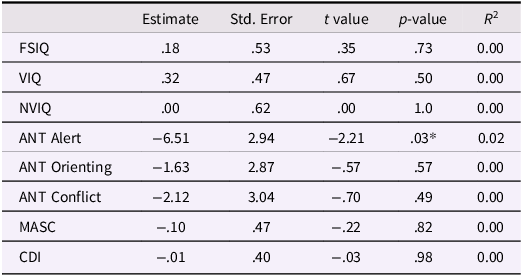


 Open access