

Women’s presence in national parliaments is on a slow increase around the world. Still, there is an emerging literature on gender, parliaments, and power that finds that even if women are entering parliaments in greater numbers, newcomers—and particularly women newcomers—tend to behave differently than experienced representatives and often feel disadvantaged (Beckwith Reference Beckwith2007; Cowley and Childs Reference Cowley and Childs2003; Ollion Reference Ollion2021). One important explanation for this phenomenon is that formal and informal seniority-based hierarchies in legislatures are male dominated, and these structures prevail even after parliaments are diversified (see Erikson and Josefsson Reference Erikson and Josefsson2022; Jeydel and Taylor Reference Jeydel and Taylor2003; Kerevel and Atkeson Reference Kerevel and Atkeson2013; Murray Reference Murray2010; Puwar Reference Puwar2004; Wängnerud Reference Wängnerud2015). These studies suggest that endurance in parliament, in and of itself, may serve as a source of parliamentary power. In that case, a gender gap in seniority would mean that there is a source of parliamentary power that men have more access to than women just because they stay there longer. This begs the question, as women are entering parliaments in greater numbers, how common are women among the seniors in parliaments?
Thus far, only a few studies exist on the topic of gender differences in the length of parliamentary careers, and the empirical evidence is inconclusive as to whether women, once elected, have shorter parliamentary careers than men. Some studies find that women have shorter careers and provide explanations why (Carroll Reference Carroll1985; Lawless and Theriault Reference Lawless and Theriault2005; Lazarus, Steigerwalt, and Clark Reference Lazarus, Steigerwalt and Clark2023; Mariani Reference Mariani2008; Vanlangenakker, Wauters, and Maddens Reference Vanlangenakker, Wauters and Maddens2013). Yet others document how men’s and women’s legislative careers in many countries are (surprisingly) alike in terms of average length of stay (Joshi and Och Reference Joshi and Och2021; Praino and Stockemer Reference Praino and Stockemer2018). These studies either use survival probabilities or averages of women’s and men’s career length, which are well suited for finding out whether women’s careers end quicker than men’s. Yet such studies do not tell us how common women representatives are among those who have served the longest in parliament—the seniors.
We move beyond these conventional approaches calculating the expected or actual average career length by proposing an alternative institutional approach focused on the gendered composition of parliament by terms in office. By shifting the focus from individual careers to the composition of parliament, our perspective is centered on when and where gender gaps among the most senior members of parliament (MPs) occur. This way, we can study whether, where, and when there is a move toward gender balance in seniority in parliaments, considering that knowledge about the formal and informal workings of parliament may serve as a source of power.Footnote 1 Specifically, if the share of women is low among the senior MPs, and the senior members have more influence in policy making, then a gender gap among seniors may have repercussions for the power dynamics within parliaments.
Moreover, our analytical framework introduces three measures to capture political seniority—to study the persistence of gender inequalities in parliaments at large. Our continuous measure captures the gender gap among those who have served for a specific number of terms, starting from one term and proceeding to the highest number of terms served. If we want to discuss seniors as a group of parliamentarians who have served long enough to accumulate advantages that come with longevity (three or more terms), we can use our dichotomous static measure, which provides a clear cutoff point between those that have had the opportunity to acquire knowledge by endurance and those who have not. Finally, as parliamentarians tend to serve longer in some parliaments than others, we also present a relational measure, which documents the gender gap among the 25% who have served the longest in any given legislature. We demonstrate that all three measures reveal high gender gaps among seniors in parliaments and show that similar gaps are not disclosed when we calculate averages of career length.
In conjunction, these measures can flesh out whether there are gender gaps among the senior parliamentarians, which is what we expect based on the literature. Moreover, the measures help us understand whether such gender gaps are closing as women representatives are becoming more common, a trend that is likely but not necessarily automatic. Specifically, we argue that the share of senior women will be correlated with the share of women in parliament, leading us to expect that countries with few women in parliament have higher gender gaps in seniority, while countries with many women in parliament will have smaller gaps.
The empirical analysis is based on individual-level MP data spanning 1965 to 2020 and capturing MPs in nine Western democracies: (the United States, Canada, France, Germany, Spain, Ireland, Norway, the United Kingdom, and Austria). We descriptively map gender gaps in seniority across both space and time, documenting that gender gaps in seniority are still large but decreasing over time. We also find support for the assumption that the share of women in parliament is related to the size of the gender gap in seniority. Focusing on senior MPs, we see that there are still some battles left to fight. Gender balance is not just about presence, but also about equal opportunities to represent voters over a longer period. Political endurance in elected office is critical as representatives’ capability to deliver on their promises to the voters is likely to increase as they gain more firsthand knowledge about how the parliament works.
From New to Senior Parliamentarians
Anne Phillips’s (Reference Phillips1995) coining of the term “politics of presence” inspired a debate in political science on women’s exclusion from politics that engaged scholars to study questions related to political representation (Franceschet and Piscopo Reference Franceschet and Piscopo2008; Mansbridge Reference Mansbridge1999), political ambition (Fox and Lawless Reference Fox and Lawless2005; Bos et al. Reference Bos, Greenlee, Holman, Oxley and Lay2022), and women’s policy agencies (McBride and Mazur Reference McBride and Mazur2010). Many studies focused on mechanisms of exclusion and explained why there is a gender gap in political representation and what could be done to increase the number of women in politics through means such as gender quotas and political financing (Buckley and Mariani Reference Buckley and Mariani2023; Clayton, Josefsson, and Wang Reference Clayton, Josefsson and Wang2017; Krook Reference Krook2009; Muriaas, Mazur, and Hoard Reference Muriaas, Mazur and Hoard2022; Tripp and Kang Reference Tripp and Kang2008; Weeks Reference Weeks2022). One critical concern that emerged was the likelihood that power dynamics in politics would not be altered solely as an effect of an increase of women parliamentarians (Barnes Reference Barnes2012; Bratton Reference Bratton2005; Childs and Krook Reference Childs and Krook2006; Dahlerup Reference Dahlerup2006). Women would have to get access to elite political networks traditionally dominated by men for change to happen (Bjarnegård Reference Bjarnegård2013; Franceschet and Piscopo Reference Franceschet and Piscopo2014; Murray Reference Murray2014; O’Brien Reference O’Brien2015).
With this article, we aim to start a scholarly debate on the power that rests in enduring in politics rather than breaking down barriers to get into politics (Murray, Muriaas, and Wang Reference Murray, Muriaas and Wang2023; Weeks Reference Weeks2022). We assume that those who have served longer than others in a parliament can benefit from the experience, authority, and networks they have accumulated over the years (Murray and Sénac Reference Murray and Sénac2018). Hence, if there are gendered patterns in who makes it to the rank of senior parliamentarian and who does not, this is crucial knowledge for the scholarship of gender and politics. As Kerevel and Atkeson (Reference Kerevel and Atkeson2013) argue, when there are both newcomers and incumbents in a political chamber, there are likely to be institutional norms that reward seniority. Still, so far, studies on gender and the parliament have tended to focus mostly on “the positive pole”—to use the term of Goertz and Mazur (Reference Goertz and Mazur2008)—the newcomers, while lacking the same analytical interest in the gender dynamics that evolve among those at the opposite (negative) pole—the seniors.
Previous studies on gender and parliament have taken a particular interest in understanding how informal rules affect power dynamics in parliament and highlight the challenging situation that newcomers face when they are elected to political office (Beckwith Reference Beckwith2007; Barnes Reference Barnes2012; Ollion Reference Ollion2021; Puwar Reference Puwar2004). For instance, young women experience higher demands and anxiety and are more subject to negative treatment compared to other groups (Erikson and Josefsson Reference Erikson and Josefsson2021). Puwar (Reference Puwar2004, 67) finds that the influx of women, Black, and Asian MPs in Westminster following the 1997 election demonstrated how these “groups” were conceptually “space invaders” who disrupted political institutions “built by men and shaped by men, in men’s image.” Another study of parliamentary behavior after the 1997 British election finds that newly elected women were “significantly less likely to have rebelled” than other Labour MPs and significantly more loyal to the party leadership than any other group in the parliament, including more experienced women parliamentarians (Cowley and Childs Reference Cowley and Childs2003, 352). More recent research also finds that years in office affect communication style (Hargrave and Langengen Reference Hargrave and Langengen2021).
There is, however, less reflection about what kind of power those who have served longer than others have access to and how it is gendered, even if seniority tends to be one factor that affects political behavior and opportunities (Strøm Reference Strøm1998; Cirone et al. Reference Cirone, Cox and Fiva2021). In some contexts, a small group of legislators with longer careers tend to dominate leadership posts and the political agenda (Grimmer and Powell Reference Grimmer and Powell2013; Jones et al. Reference Jones, Saiegh, Spiller and Tommasi2002; Jeydel and Taylor Reference Jeydel and Taylor2003; Lawless and Theriault Reference Lawless and Theriault2005; Murray and Sénac Reference Murray and Sénac2017; Squire Reference Squire1988). Some studies have demonstrated how formal—and not just informal—rules provide senior MPs with certain rewards and privileges (Heinsohn and Schiefer Reference Heinsohn and Schiefer2019), which again supports theories that explain how institutional rules enable or constrain MPs (Blomgren and Rozenberg Reference Blomgren, Rozenberg, Blomgren and Rozenberg2012). For example, although modified over the years, seniority is rewarded in the U.S. Congress, as senior members can choose committee assignments and seniority is used to decide committee chairmanships (Jones et al. Reference Jones, Saiegh, Spiller and Tommasi2002; Squire Reference Squire1988).
Hence, the continued marginalization of women in politics could at least partly be a consequence of seniority-based hierarchies in which women’s legislative careers may not last long enough for them to join the ranks of seniors, and thus there is a source of parliamentary power that is less accessible for women than men. Following the logic of Merton’s (Reference Merton1957) concept of an accumulative advantage, endurance can be seen as a source of power in and of itself, although it is likely to overlap with other sources of power. When someone starts to gain knowledge and learn skills in an organization, they will be rewarded, and this again will lead to more advantages that can be used to get even further ahead. Parliamentarians who have served in a parliament over multiple terms can therefore make use of a power that is less accessible to those who have served for a shorter time.
In our definition, seniority is distinguished from the concept of political experience, which arguably is a broader concept that includes people’s pre-parliamentary background, like having served as local officeholders, leaders in parties, or other positions inside and outside politics (Buckley et al. Reference Buckley, Mariani, McGing and White2015; Górecki and Kukołowicz Reference Gorecki and Kukolowicz2014). Neither does our definition include parliamentarians’ track record of roles in the parliament or government—for example, if they have been frontbenchers or backbenchers or served as ministers or not. Such a parsimonious definition facilitates comparisons across time and countries.
Gender Gaps in Political Seniority: Measurements and Expectations
While both gendered representation and parliamentary power are well theorized fields of study, a critical gap exists in exploring the intersection between women’s presence and endurance in parliaments. To start, we need to develop precise, measurable definitions of when parliamentarians can be considered seniors, and then we can find out how common it is for a woman to be one. This study thus has three main aims; (1) to build a conceptual framework for understanding what seniority is, (2) to test a few assumptions about gender gaps in parliamentary seniority, and (3) to distinguish our institutional approach from those that focus on career length.
Institutional Approach: Gender Gaps among Senior Members of Parliament
The gender gap in seniority lies at the not yet conceptualized intersection of seniority in parliament and gender balance. It involves both deciding when someone can be considered a parliamentary senior and women’s presence among seniors. Here, we lay out three different measurements of seniority and show how gender gaps can be tested.
One way of measuring seniority is to think of it as a continuum that starts with the newcomers and ends with the most senior MPs. The longer you have served, the more time you have had to acquire knowledge and build networks. Such a continuous measure captures the share of women who serve by term, starting from the share of women among those who have served only one term and going all the way up to the share of women among those who have served the highest observed number of terms. The benefit of this measure is that it captures how the gender gap unfolds as we move from the newcomers to the most senior members, checking whether gaps are closing or widening by terms served. That said, with a continuous measure, we do not define exactly who falls within or outside the group of senior parliamentarians, as the measure captures trends and dynamics of seniority rather than defining who among the parliamentarians qualifies as such.
We may also be interested in defining seniority as a parliamentary group. First, we can use a static measure. The theoretical logic behind this measurement is that there is likely to be a saturation point in the accumulation of skills, knowledge, and networks needed to benefit from endurance, and after a couple of terms, parliamentarians have served long enough to make it matter in their role as a parliamentarian. Specifically, returning MPs have experienced something often enough to know whether it is unusual or usual, and they have the skills to survive both selection and reelection, not just once but maybe also two or three times. Hence, a static measure of seniority, which establishes a precise and constant threshold for seniority—like those having served three or more terms—across time and place captures the gender gap among those who can capitalize on the authority gained from their endurance.
Second, we can use a relational measure of seniority when we want to account for the fact that the length of parliamentary careers differs across time and space. What matters is not the number of times a representative has experienced the same situation, but that a parliamentarian can benefit from a level of endurance exceeding that of most others. The relational measure thus considers that someone is senior if they have stayed longer than others. A “senior” will change across time and parliaments, reflecting that how long parliamentarians serve varies widely. Women could be among the longest-serving MPs after being reelected only once in some contexts, while they would have had to serve for nine terms in others. To identify the gender gap among the seniors, one must therefore first decide on an upper percentile (25%, for instance) and identify the share of women among those belonging to this cohort.
We assume that there are gender-gaps across the static and relational measure in contemporary parliaments, but that our static measure shows smaller gaps as it is less sensitive to historical discrimination.
Expectation 1: There is a gender gap in parliamentary seniority across measures.
Gender Balance: In Parliaments and Among Seniors
We know there has been a large influx of women into contemporary parliaments in recent decades, and worldwide, the share of women in parliaments is up from 12% in 1997 to 26% in 2022 (IPU 2022). In two of the European countries included, Norway and Spain, there is almost full gender parity in the national assembly, while the gender balance is poorer in countries like the United States and Ireland. The question is how this development has impacted the gender gap in seniority.
The literatures on both turnover and candidate renomination suggest that this trend of increased female representation might translate into more senior women. The emerging literature related to turnover in legislatures shows that women are both entering and, more importantly, reentering parliaments in greater numbers. Turnover in parliaments is commonly measured as the rate of individual membership change from one parliament to the next (François and Grossman Reference François and Grossman2015). One of the few studies on turnover that discusses questions related to gender finds that gender quotas influence turnover indirectly as they create opportunities for women newcomers to oust incumbent men (Gouglas, Maddens, and Brans Reference Gouglas, Maddens and Brans2018). While turnover studies interestingly map patterns of change among those who enter and exit parliaments at a given time, they are unable to capture whether an incumbent returns for the first or the twelfth time. Still, on the basis of the turnover literature, we can build the expectation that an increased share of women in parliaments could translate into more senior women.
Such an assumption is strengthened by candidate renomination studies, which find that women are quite successful in getting re-selected by their political parties, although they do not explore whether women are successful in their electoral bids and how their endurance matters (Muyters, Put, and Maddens Reference Muyters, Put and Maddens2022). Studying the Czech Republic, Smrek (Reference Smrek2020) finds that well-performing female MPs are just as likely as their male colleagues to secure a favorable renomination. Van de Wardt et al. (Reference van de Wardt, van Witteloostuijn, Chambers and Wauters2021, 486) show that when women make up 15% or more of a parliamentary party, their odds of exit no longer differ significantly from those of men. Similarly, Muyters, Put, and Maddens (Reference Muyters, Put and Maddens2022) find that men—not women—in Belgium are particularly punished by a bad electoral performance. Even if these studies provide minimal information about the composition of parliaments, they still provide support for the assumption that an increase of women representatives is positively linked to the share of senior women MPs.
To explore whether more female MPs translate into more seniors over time, we can use the static and relational measures. The correlation between these and numeric representation of women will probably be strongest on the static measure because the measure sets a fixed three or more term limit to become a senior MP, which is a relatively short period of time and can adjust for historical gender discrimination in representation. Conversely, qualifying as a senior on the relational measure might demand several terms depending on context, which may hit women harder given their historical underrepresentation. Even though some countries have longer legislative terms than others, we will still be able to capture the potential translation of women MPs into seniors in very recent parliaments, as such to a large extent avoiding the historical bias in parliamentary representation between men and women.
Expectation 2: Gender gaps among seniors decrease when gender balance in parliament increases
The Career Length Approach
One of the main purposes of this article is to demonstrate how our institutional approach—which takes the gender composition of parliaments into consideration—differs from those that focus on the length of individual careers. Still, studies of career length serve as an important complementary way of understanding gender differences beyond that of presence in politics. However, these approaches look at women as a group and compare women’s averages with men’s, and thus they do not have as their purpose to find out how gender gaps in seniority can shape patterns of power in parliaments. Still, these are interesting studies that with adifferent approach contributes to explaining whether and why there is a leaky pipeline in politics—that is, why women’s careers are more likely to be interrupted and terminated earlier than men’s (Lee Reference Lee2019). If there is a leaky pipeline, we may find that gender gaps in seniority do not disappear even in contexts of increasing gender balance, reflecting the studies documenting a persistent glass ceiling even in countries with high levels of gender equality (Folke and Rickne Reference Folke and Rickne2016; Vanlangenakker, Wauters, and Maddens Reference Vanlangenakker, Wauters and Maddens2013).
Most studies using the career length approach have found that women leave parliaments earlier than men. For example, by studying congressional retirement in the United States, Lawless and Theriault (Reference Lawless and Theriault2005) find that women tend to retire voluntarily after a shorter time in office than men because they are more likely to retire when their ability to influence the legislative process stalls. Other studies connect women’s earlier exit to age or family obligations, as women tend to enter politics either before or after their childbearing years (Carroll Reference Carroll1985; Lazarus, Steigerwalt, and Clark Reference Lazarus, Steigerwalt and Clark2023; Mariani Reference Mariani2008). Research also suggests that glass ceilings discourage women from staying in politics as women’s promotions are slower compared to men’s (Folke and Rickne Reference Folke and Rickne2016). Others find that women, compared to men, are more likely to be pushed out of politics at an earlier stage of their parliamentary careers by their parties (Vanlangenakker, Wauters, and Maddens Reference Vanlangenakker, Wauters and Maddens2013).
Some recent studies contradict the conventional assumption that there are gender differences in parliamentary survival rates. Praino and Stockemer (Reference Praino and Stockemer2018) find that, on average, men have a significantly longer tenure in the U.S. Congress than women, but they conclude that this difference is driven by a few men who have had very long careers. Consequently, they argue that the gender difference is caused by the fact that women have only recently started to enter Congress in larger numbers (Praino and Stockemer Reference Praino and Stockemer2018, 447–48). Similarly, Joshi and Och (Reference Joshi and Och2021) calculate the length of legislative careers across 78 parliaments and find a significant gender difference in only about half the countries. In sum, this leads us to assume that women have shorter parliamentary careers on average than men, although the trend might not be clear-cut. By using the same data to calculate both gender gaps in career length and seniority, we can get a broader understanding of how these two different approaches matter for theory building.
Expectation 3: Using the conventional average length approach, we expect that men on average have longer legislative careers than women.
Research Design
As far as we know, this article presents the first attempt in the literature to document gender gaps in parliamentary seniority. The article gives a descriptive mapping of gender imbalances on the three seniority measures to outline how they vary and the feasibility of adopting them for future studies. Given that our empirical analysis is descriptive—not causal—we do not aim for a representative sample of countries, but rather a sample that can help us outline the specificities of our three measures and offer suggestions for future research. We rely on an openly available individual-level MP data set: the Comparative Legislators Database (CLD) (Göbel and Munzert Reference Göbel and Munzert2022). The CLD has user-generated information (Wikipedia) on the political careers of over 45.000 contemporary and historic politicians. We include eight of the countries in the data set: Canada, the United States, Austria, France, Germany, Ireland, the United Kingdom, and Spain. To the CLD, we add Norwegian data, which is available through the Norwegian Agency for Shared Services in Education and Research.
In total, we have endurance data across countries in North, South, and Central Europe, plus North America. Additionally, the countries exhibit rich variation on five relevant system-level variables for political endurance. First, reflecting the analytical framework presented earlier, the share of women in parliament is expected to be related to the share of seniors. Thus, it is crucial to outline seniority patterns in contexts with varying shares of women in parliament (see Table 1). Second, and relatedly, the presence of gender quotas is linked to the increased share of women in parliaments (Weeks Reference Weeks2022) and to turnover, as gender quotas make it possible for women newcomers to oust incumbent men (Gouglas, Maddens, and Brans Reference Gouglas, Maddens and Brans2018). Thus, we include countries with both voluntary party quotas (Germany and Norway), legislated quotas (Spain and France), and countries with no quotas (United States). Third, existing studies have pointed to the importance of electoral volatility for turnover (Gouglas, Maddens, and Brans Reference Gouglas, Maddens and Brans2018), a factor that can shape the ability of parliamentarians to achieve seniority status. Specifically, high volatility is associated with higher turnover. We include countries that range from 8.5 (United Kingdom) to 43.7 (France) in volatility scores.
Overview of core characteristics of selected countries
a Legislated quota captures whether the country has implemented a gender quota as part of its constitution or secondary law.
b Defined as “the net change within the electoral party system resulting from individual vote transfers.” See Appendix D for volatility figures over time.
Sources: Hughes et al. (Reference Hughes, Paxton, Clayton and Zetterberg2019); Hughes, Paxton, and Krook (Reference Hughes, Paxton and Krook2017); IDEA (n.d.); Casal Bértoa (Reference Casal Bértoa2022).
Fourth, the design of the electoral system has been related to both the presence of women in parliaments and turnover (Gouglas, Maddens, and Brans Reference Gouglas, Maddens and Brans2018; Matland and Studlar Reference Matland and Studlar2004; Wängnerud Reference Wängnerud2009). Thus, including proportional representation countries (Norway and Spain), which are normally associated with more women in parliament and higher turnover, and majoritarian systems (United Kingdom and United States) associated with the opposite (Matland and Studlar Reference Matland and Studlar2004), enables us to look for both descriptive differences in seniority and propel future studies to causally investigate these potential differences. Finally, length of legislative term is significantly associated with increased legislative turnover (Gouglas, Maddens and Brans Reference Gouglas, Maddens and Brans2018; Heinsohn Reference Heinsohn2014). When term length is long, as in France, the United Kingdom, and Ireland, turnover is higher, while shorter term length, as in the United States, is associated with lower turnover.
Our data include MPs represented in parliaments from 1965 to 2020.Footnote 2 Prior to 1965, not many women were represented in the selected parliaments, making it hard to document gender gaps among seniors. Also, 1965 as a cutoff year signifies that we capture the crucial years during which women’s emancipation has taken place globally, including the first UN World Conference on Women in Mexico City in 1975 and the 1995 UN Beijing Declaration and Platform for Action (Krook and True Reference Krook and True2012; Paxton, Hughes and Green Reference Paxton, Hughes and Green2006).
The variables of interest in the data set are name, terms served, and gender.Footnote 3 We count those representatives who were present in parliament immediately after the election and do not consider whether they went on leave (e.g., to become minsters). Also, we do not distinguish between whether a representative is present for consecutive terms or not, as our focus is mainly on whether there is a gender gap in the ability to remain in parliament—whether consistently or on and off. The definition of a senior parliamentarian differs across the relational and static measures, but the way we calculate them is similar: we first differentiate between seniors and newcomers before calculating the gender difference between men and women within the category of seniors, as opposed to calculating the share of female seniors by all parliamentarians. This way we avoid percentages that include parliamentarians with short parliamentary careers, whose inclusion would have given us a skewed impression of the gender gap among seniors.
Results
The analysis is structured according to expectations. First, we empirically explore whether there is a gender gap in seniority across our nine selected countries. Furthermore, we analyze whether there is a correlation between the shares of women and senior women in parliament before we demonstrate how our institutional approach and the more conventional length of stay approach are different but complementary.
Expectation 1: Gender Gap in Seniority across Measures
To explore whether there is a gender gap in seniority, we use all three measures for all the countries in our sample over the full time period (1965–2020). Figure 1 shows that only 11% of those who are seniors on the relational measure are women, while 89% are men, generating a gender gap of 76 percentage points. On the static measure, the figures are similar: 84% of the seniors were men and 16% were women, creating a gender gap of 68 percentage points. There is therefore solid empirical support for our first expectation that there is a substantial gender gap in seniority—across two different measures—in a range of Western democracies from 1965 until today.
Gender distribution among seniors on the relational and static measures, all countries, 1965–2020. Seniors on the relational measure are MPs serving five or more terms, as four terms denote the 75th percentile in the full data set (across all years). Source: Comparative Legislators Database.

The continuous measure outlines whether the gender gap in seniority increases as the number of terms served goes up. Figure 2 shows that this is the case, and it demonstrates substantial gender gaps for all levels of endurance, both in the European countries plus Canada and in the United States. For the former group of countries, the gap clearly increases when moving from few to many terms served.
Gender gap in percentage points on the continuous measure, by legislative terms served. All countries. N (total) as labels. The gender gap is calculated by subtracting the share of female MPs from the share of male MPs that serve for X legislative periods. We only report endurance levels (i.e., number of legislative periods served) for which at least 20 representatives qualified. See Appendix E for a country overview with N. We present the United States with a separate line given its two-year congressional terms. Source: Comparative Legislator Database.
Specifically, we observe an increase in the gender gap from 52 percentage points among those having served only one legislative term to 90 percentage points among those having served nine terms in the trend line, which excludes the United States. Note that only 105 representatives served nine terms. Interestingly, the gender gap for the nine countries jumps with more than 10 percentage points when we move from three to four terms. Thus, women keep up with men—to a certain extent—until three periods but then progressively disappear, corroborating the findings on our two seniority measures. Since the gender gap increases from three periods already, we cannot relate it exclusively to historical biases in representation, as women have had time to accumulate more than three periods of endurance since their influx into many of the parliaments included here.
In the United States, the gender gap is consistently large, amounting to around 80 percentage points for all levels of endurance, reflecting the literature documenting the large gender gap in numeric representation (e.g., Carroll and Sanbonmatsu Reference Carroll and Sanbonmatsu2013; Dodson Reference Dodson2006) and the comparatively strong incumbency advantage in U.S. elections (see, e.g., Cox and Katz Reference Cox and Katz1996; Jacobson Reference Jacobson2015). We will return to this finding under Expectation 3, where survival probabilities corroborate these findings.
Expectation 2: More Women MPs, More Senior Women?
The literatures on turnover and candidate renomination have suggested that the presence of more women MPs might result in more senior women. In the following, we assess, with the help of the relational and static measures, whether this is the case. Relatedly, we explore whether a high share of women in parliament in some countries is linked to a low gender gap in seniority and vice versa.
Figure 3 shows a strong and significant correlation between the share of women in parliament (x-axis) and the share of senior women (y-axis) on both the static measure (left-hand side plot) and the relational measure (right-hand side plot). As expected, the correlation is stronger on the static measure given that this measure allows an MP to qualify as a senior after “only” three terms, while the relational measure, depending on the context, demands more terms than three to be a senior (see Table 2 and Appendix H for details). Thus, the historical underrepresentation of women in parliaments is more likely to manifest itself on the relational measure than the static, potentially impacting the strength of the correlation. The same strong and significant correlation between the numeric representation of women and the static and relational measures respectively is also visible in the individual country plots (Appendix F).
Correlation between the numeric representation of women and share of female seniors on the static and relational measures respectively, 1965–2020. Please consult Appendix A for an overview of the end date of data in different countries. Source: Comparative Legislator Database.
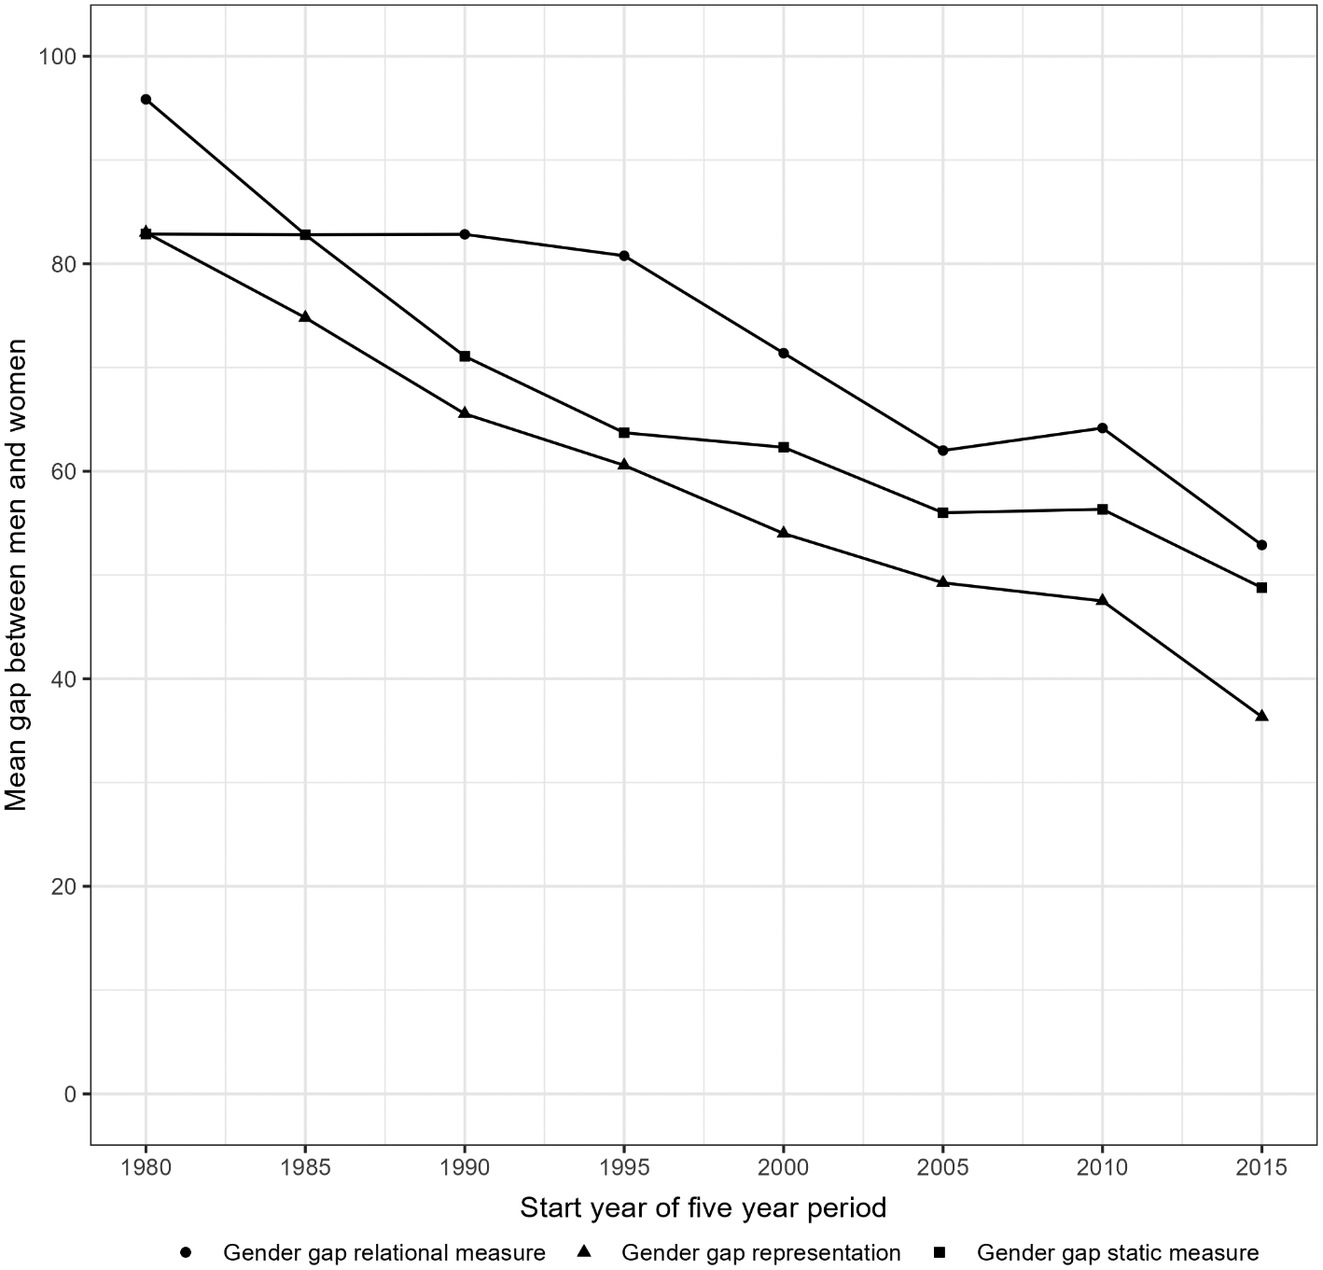
Another way to portray the relationship between the share of women in parliament and the relational and static measures is to look at longitudinal figures. Figure 4 shows the average gender gaps within five-year periods (1980–84, 1985–89, etc.) in the numeric representation in parliament and on the static and the relational measures across all our countries.Footnote 4 The data demonstrate that all three measures decrease nearly in parallel from 1980 onward. The gender gap dropped from nearly 100 percentage points on the relational measure and 83 percentage points on the static measure in the period 1980–84, to 53 and 49 percentage points, respectively, in 2015–19. Similarly, the gender gap in representation falls from above 80 to below 40 percentage points in the same period, reflecting the correlation documented earlier. Nevertheless, Figure 4 outlines that the existence of more gender balanced parliaments does not automatically translate into the same level of gender balance in seniority, not even in the last period (2015–19). In fact, the gender gap in representation is nearly 15 percentage points lower than the gender gap on the static and relational measures in this period. Also, note that the gap across our nine countries has never fallen below a mean of 49 percentage points, documenting that the gender gap remains substantial to this day.
Development in gender gap on relational and static measures over time, and numeric representation, all countries, 1980–2019. Source: Comparative Legislators Database.
When we assume that the gender gap in seniority will depend on the numeric representation of women, we also expect rich inter-country variation in gender gaps, reflecting the varying levels of female representation in contemporary parliaments. Therefore, we expect that Figure 4—by lumping countries and time periods together—hides substantial country-differences in the relationship between the share of women in parliament and the share of senior women. In the following, we demonstrate these intercountry differences.Footnote 5 The results on the static and relational measures per country are quite similar, and since the relational measure is the most exclusive seniority measure, this is the one we focus on here. Figures on the static measure are found in Appendix I.
Before presenting the results on the relational measure, we first outline how many terms an MP needs to serve to qualify as a senior in each legislature in every country. We calculate the minimum and maximum number of legislative terms served by all MPs within each legislature in each country over time. Then we calculate how many terms an MP had to serve to be among those MPs with the 25% longest endurance (senior). Appendix H outlines these results, which are the basis for the calculations in Figures 5 and 6. Table 2 focuses on the thresholds to be considered a senior on the relational measure when all legislatures within each country are calculated together. The number of terms required to be in the top percentile exceeds three—that is, the cutoff to be a senior on the static measure in all countries. In the United Kingdom and Ireland, the top 25% of MPs served six or more terms, while the same number was four in France, Norway, and Spain. When all legislatures in the selected countries since 1965 are calculated together, the seniors are those serving for five or more terms.
Overview of terms served by the 75th and top 25th percentile of MPs
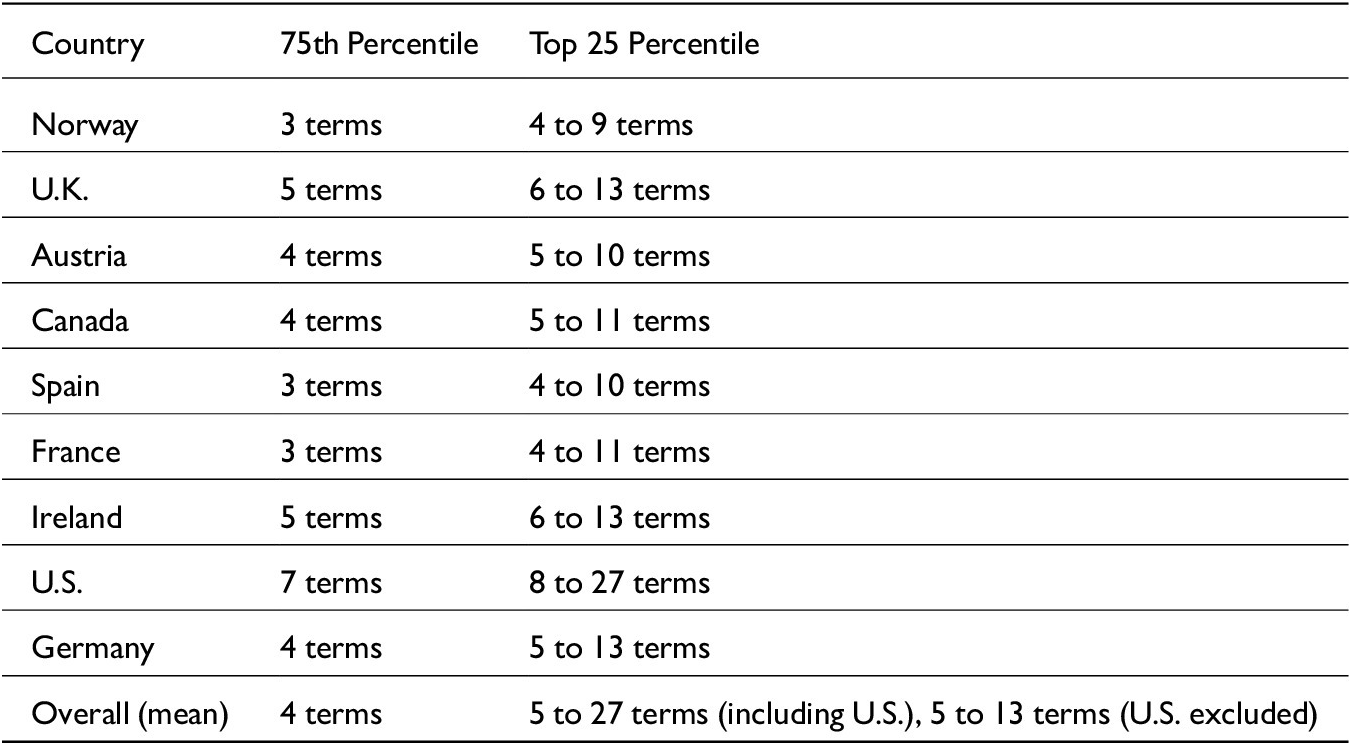
Source: Comparative Legislators Database.
Figure 5 outlines the development in the gender gap on the relational measure for countries with less than 40% women in parliament in 2021, namely, Ireland, the United States, Germany, France, Canada, and the United Kingdom, while Figure 6 presents the same plot for Norway, Spain, and Austria, which had more than 40% women in parliament that year.
Development in the gender gap on the relational measure over time in countries with less than 40% female representation in parliament in 2021, 1980–2019. Source: Comparative Legislators Database.
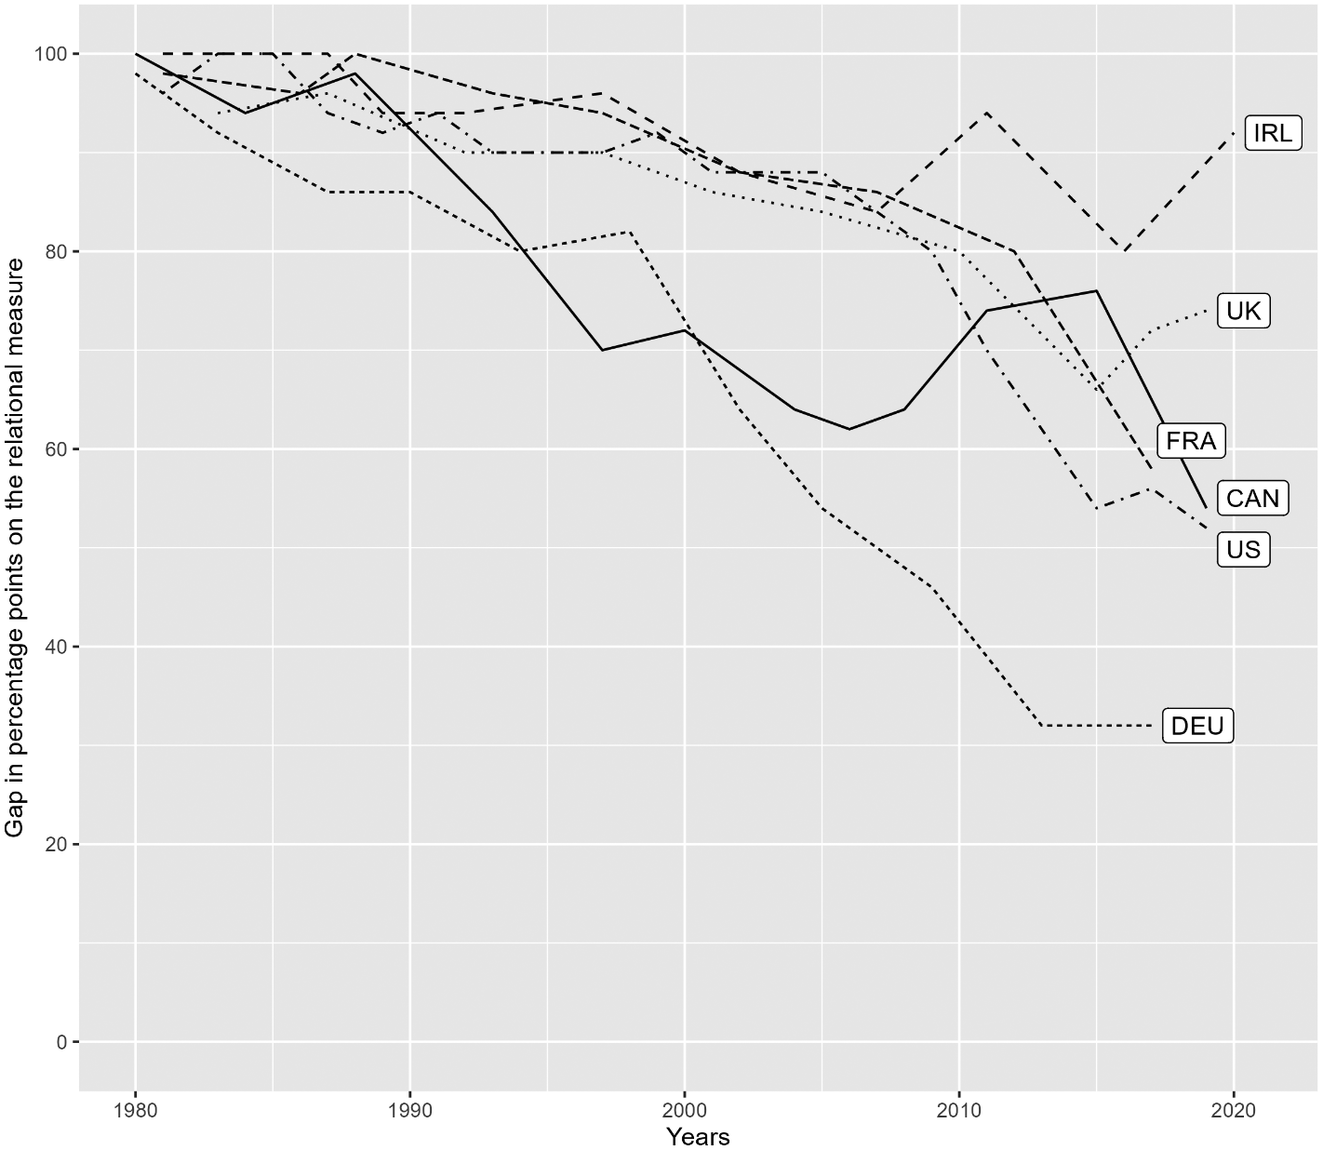
Figure 5 shows that the gender gap in seniority decreases over time, but it remains substantial across all countries. The gender gap currently lingers above 50 percentage points on the relational measure in all the countries apart from Germany, where it lies at just above 30 percentage points. While the gender gap in all countries starts out between 90 and 100 percentage points in 1980, it drops to less than 60 percentage points in Canada, France, Germany, and the United States in the latest period. Both Ireland and the United Kingdom had a rising trend in their gender gap on the relational measure in the latest periods and ended up with a gender gap of more than 70 (United Kingdom) and 90 percentage points (Ireland). Interestingly, this development happened despite an increased female presence in the British parliament, indicating that the last election in the United Kingdom involved a drainage of the most senior female MPs. In Ireland, the increased gender gap coincided with fewer women in parliament in the latest legislature.
As mentioned earlier, the figures on the static measure in Appendix I show similar trends, suggesting that women in these contexts struggle just as much to be part of the group of seniors who serve three or more terms, as being in the group serving in the top 25th percentile. Thus, the crucial threshold for women’s seniority in these countries is at three terms or even lower. The only country where there is a marked difference in the gender gap across the two measures is the United Kingdom. While the gender gap in the United Kingdom rises on the relational measure in the last period (70 percentage points), it drops on the static measure—to 40 percentage points. This shows that the senior women in the latest legislature in the United Kingdom to a much larger extent had served three or more terms, rather than six, which was required to qualify as a senior on the relational measure in the latest parliament.
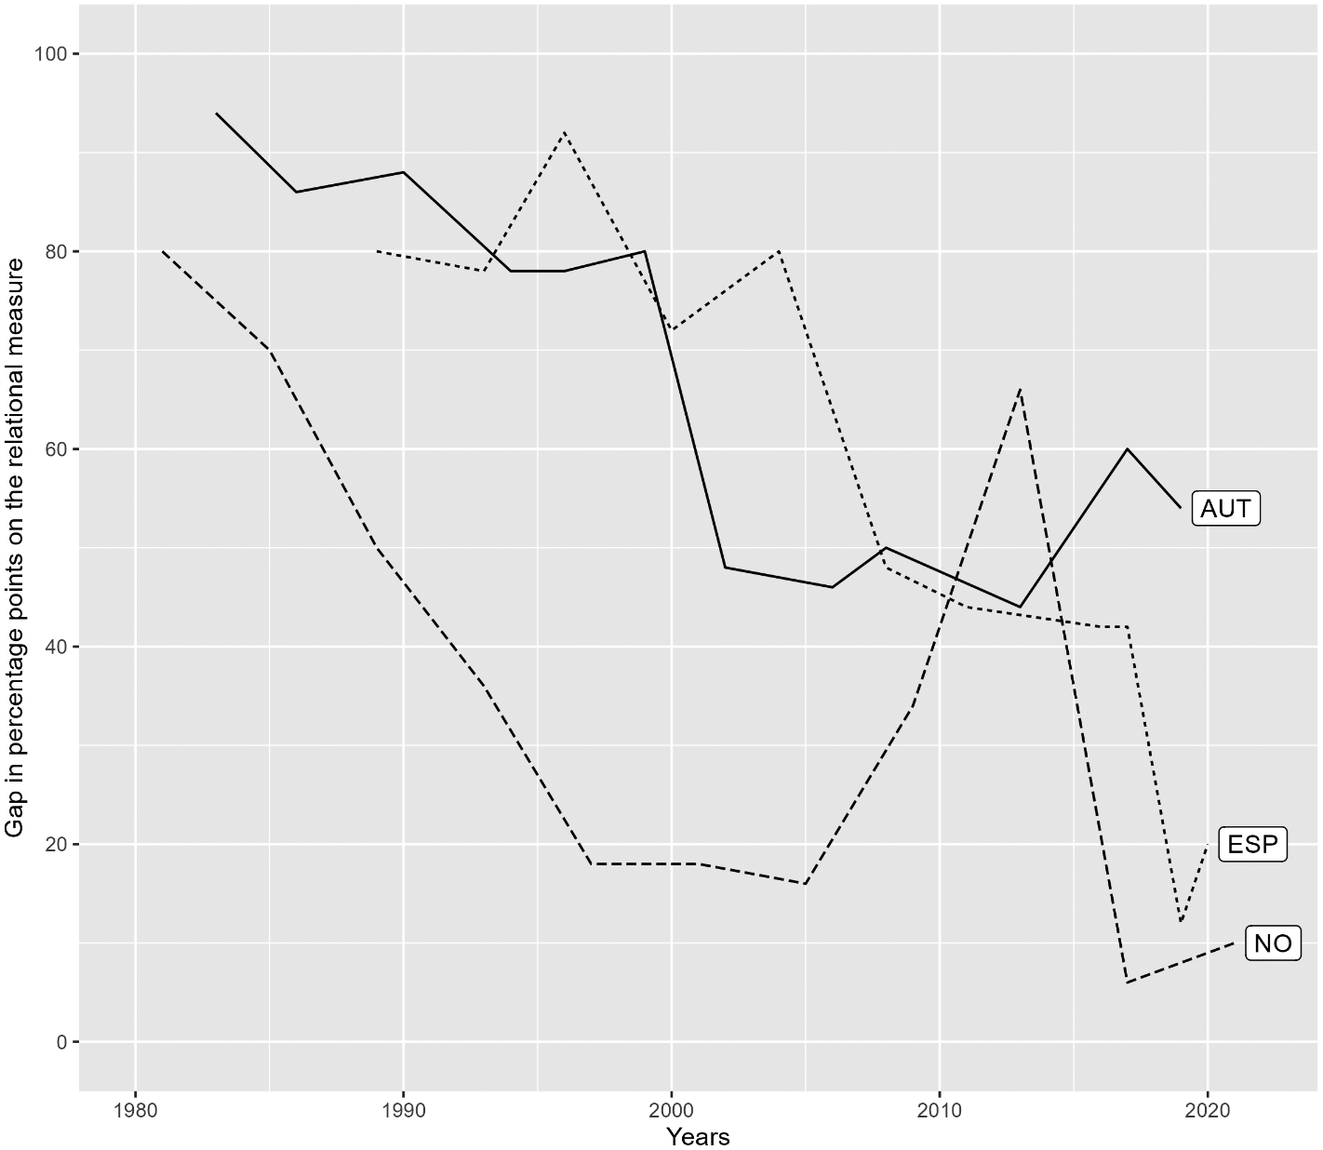
Figure 6 shows the gender gap in seniority on the relational measure for countries with more than 40% women in parliament in 2021. Norway and Spain start out with a gender gap of around 80 percentage points. The similarity is interesting, as Norway had a higher share of women in parliament than Spain at this point, but still not a smaller seniority gap. Furthermore, the gender gap on the relational measure in Austria remains around 50 percentage points even if women hold over 40% of the seats in parliament. The results from Austria suggest that gender gaps do not automatically disappear when the number of women is increasing, even if gaps are clearly reduced in Spain and Norway. It is worth noting, however, that Austria in the 2000s has a somewhat lower share of women in parliament compared to Norway and Spain. Nevertheless, our findings indicate that there are likely to be other factors than numeric gender balance that affect gender gaps in political seniority (see conclusion).
Development in gender gap on the relational measure over time in countries with more than 40% female representation in parliament in 2021, 1980–2019.
Source: Comparative Legislators Database.
Expectation 3: The Career Length Approach
We expect that, on average, men will have longer legislative careers than women. First, we replicate Joshi and Och’s (Reference Joshi and Och2021) and Praino and Stockemer’s (Reference Praino and Stockemer2018) calculations to investigate whether their documented patterns hold across our countries. We reiterate that these calculations capture individual-level differences in career length and constitute an important and complementary basis for understanding our institutional approach.
Figure 7 outlines the Kaplan-Meier curves for career length in parliament for the United States and the remaining eight countries. The United States is separated out because of its two-year congressional periods. The data is right censored, including those MPs who have not yet ended their legislative careers. The survival probabilities in the right-hand side plot show—as expected—that men overall have a higher probability of enduring in parliament than women. Specifically, men have an edge over women in the likelihood of serving between two and eight terms and 11 terms onward. The gender difference in survival probabilities is significant (chi square = 6, p = .01), indicating that men overall have longer careers. Men in these contexts have not only historically outnumber women but also staying longer. The gender difference is particularly marked from three terms onward, suggesting a critical point for female legislative careers in the transition from serving three to serving four terms, a point that was also discussed under the continuous measure on our first expectation.
Kaplan-Meier curve/survival probabilities for men and women, all countries and the United States. U.S. plot: N women = 268, N men = 2,039 All countries plot: N women = 3,470, N men = 12,963. Country-level plots for the countries included in the right-hand side plot can be found in Appendix G. Source: Comparative Legislator Database.
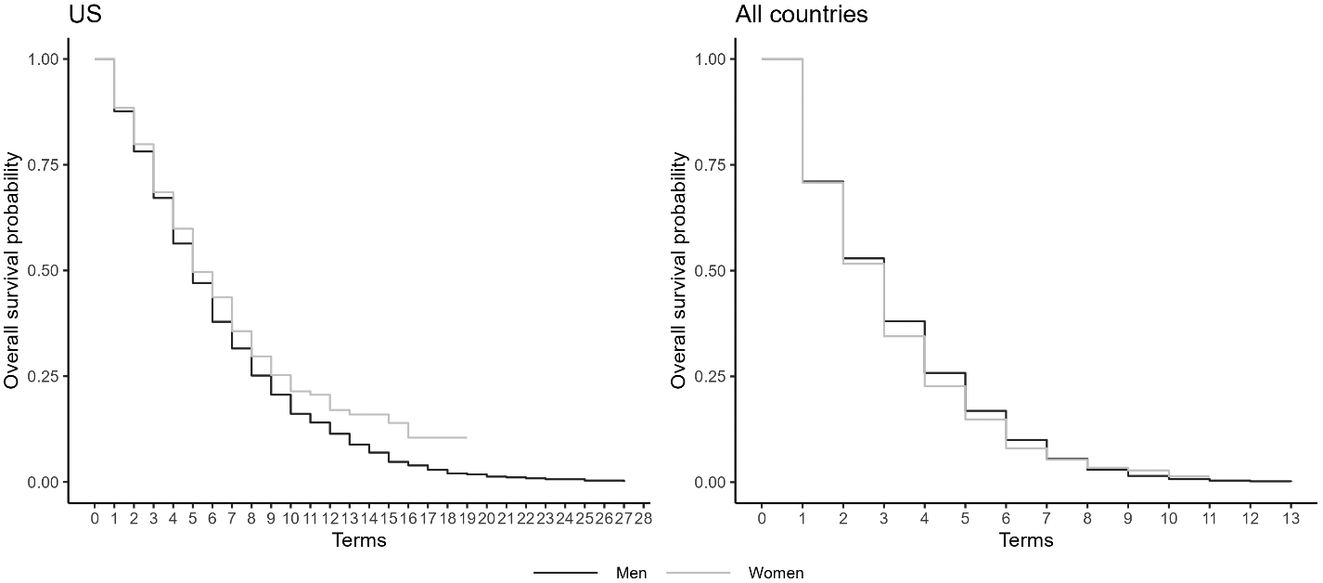
Contrary to the other countries, women parliamentarians in the United States have a higher likelihood of surviving up to 19 terms than men. The survival rates for women and men are significantly different (chi square = 4.8, p = .03), the opposite conclusion of Praino and Stockemer (Reference Praino and Stockemer2018). We believe the contrasting results stem from the fact that we have longer time-series data than those authors. The U.S. data suggest that even if women are underrepresented in Congress, both historically and today, the few women who get elected are remarkably able to hold on to their seats, suggesting that the incumbency advantage documented for the U.S. Congress (Cox and Katz Reference Cox and Katz1996; Jacobson Reference Jacobson2015) also applies to women. Finally, the figure shows that no woman has served more than 19 terms, which could stem from the fact that women enter Congress at a later stage than men and tend to leave earlier (Carroll Reference Carroll1985; Lazarus, Steigerwalt, and Clark Reference Lazarus, Steigerwalt and Clark2023; Mariani Reference Mariani2008), possibly hindering them in realizing the career length of men. Or, it suggests that women in the U.S. Congress have not yet had time to accumulate the same career tenures as men (Praino and Stockemer Reference Praino and Stockemer2018).
Still, even if women’s survival rates in the U.S. Congress are high, the gender gaps in seniority are still large across all measures, and this is a critical distinction for those concerned with parliamentary power. Furthermore, when we look at the survival rates of women parliamentarians outside the United States, there seems to be a leaking pipeline, as women, on average, stay for a shorter time in the parliament than men.
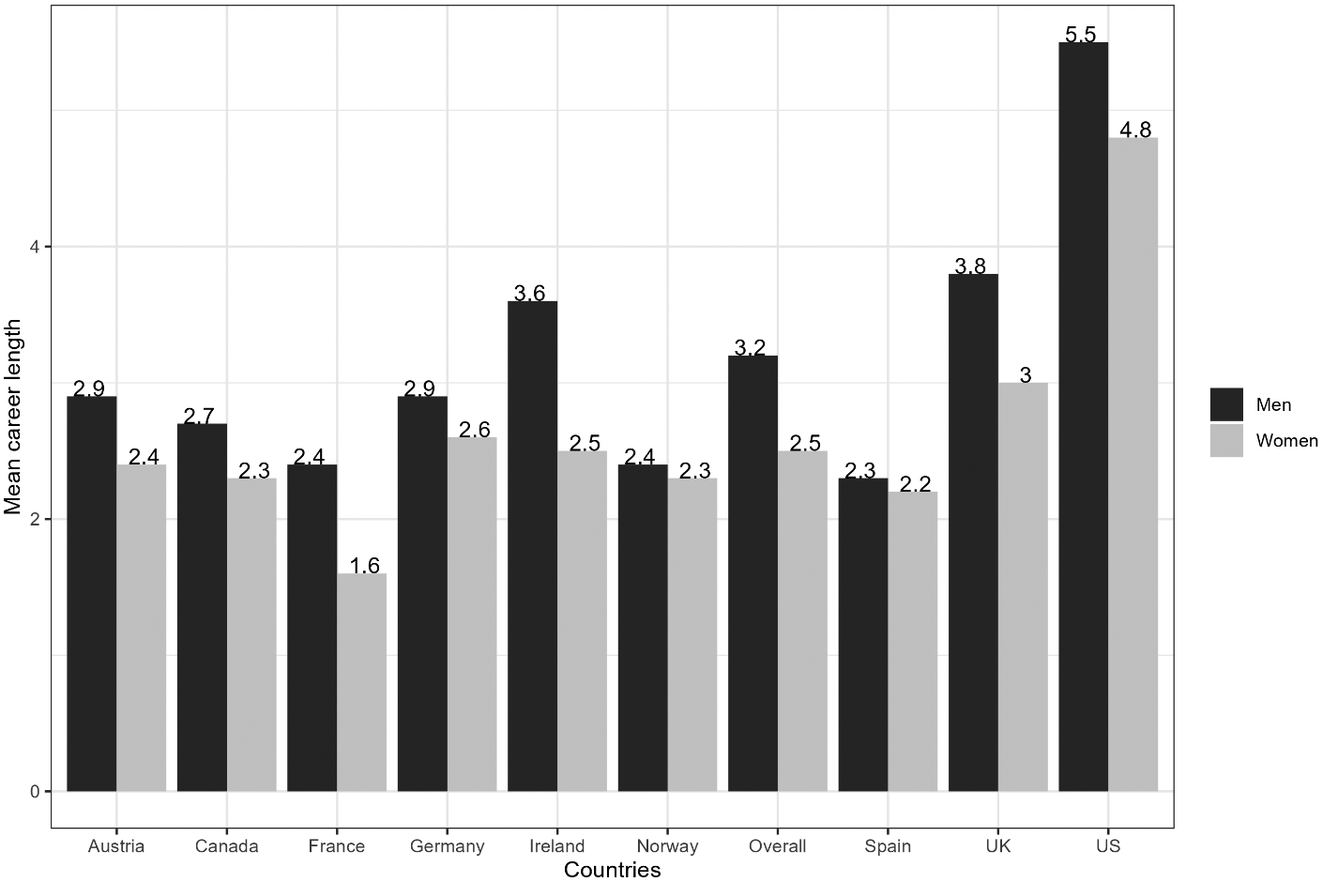
The other way to empirically analyze the expectation that men have longer careers is to calculate the average length of men’s and women’s parliamentary careers. Figure 8 provides more support for our expectation, showing that men overall serve longer than women. All countries combined, the gender gap in endurance amounts to less than one term—only 0.7, supporting Joshi and Och’s (Reference Joshi and Och2021) findings. The mean length of a parliamentary career in the selected countries, irrespective of gender, is three terms (3.07).Footnote 6 The shortest legislative careers among women are found in France and among men in Spain, while the longest careers are found in the United States, where women serve for 4.8 periods on average and men for 5.5 periods, but the legislative periods are also the shortest in this sample.
Mean length of parliamentary careers, men and women, 1965–2020. N men: 15,002, N women: 3,738.
Source: Comparative Legislators Database.
Interestingly, these results are based on the same data that we used to calculate seniority, underlining that gendered differences in seniority measured with our institutional approach are much more grave compared to when we calculate averages of career length.
Conclusion
This article makes a case for expanding traditional approaches to studying gender and political seniority, to pinpoint gendered differences pertaining to one source of parliamentary power that has been overlooked in the literature thus far. We are the first to empirically show persistently high gender gaps among senior parliamentarians, despite a decreasing trend over time. The findings are clear across the three seniority measures used here. We found that the gender gaps in seniority on the relational and static measures are 76 and 68 percentage points, respectively, and that the gender gap on the continuous measure increases with the number of terms served. Thus, seniority in many parliaments in Western democracies has been and continues to be a male-dominated domain. Of course, we cannot assume that institutional constraints and patterns of seniority affect all women legislators similarly (Zetterberg Reference Zetterberg2008). Still, if endurance, in and of itself, is a source of power in the parliament, as studies of both newcomers and seniors have indicated, then there is a type of power—linked to knowledge, authority, and networks—that women as a group have less access to than men.
The article has outlined that the gender gap in seniority is correlated with the share of women in parliament. We propose that future studies take this as a starting point for more advanced causal endeavors, for example, investigating why some countries still have high gender gaps despite an increased female presence in parliament. Austria, for instance, has had more than 30% women MPs over the past two decades, but it has remarkably higher gender gaps than Spain and Norway. France currently has high gender balance in parliament, but it has substantial gender gaps in seniority, potentially reflecting the fact that women only more recently have entered parliament in higher numbers. Future studies could shed light on whether there is a breaking point in the share of female representation in parliament required to tip the gender gap in seniority in a decreasing direction, similar to the findings of van de Wardt et al (Reference van de Wardt, van Witteloostuijn, Chambers and Wauters2021, 491), who conclude that a presence of 15% women ensures parliamentary survival of minorities. A related approach would be to explore how the different levels of gender balance potentially impact the continuous, static and relational measures differently. In turn, this will answer a pressing question: how do different levels of gender balance impact the seniority level at which men propel away from women in contemporary parliaments?
Our case selection ensures variation on gender quota regulations, electoral system, length of legislative terms, and volatility in addition to gender balance in parliaments. Ireland is the only country in the sample that has a proportional single transferrable vote system, and it stands out with particularly stubborn gender gaps in seniority. Therefore, its electoral system’s potential impact on gender gaps in seniority merits future academic attention. Moreover, the three other proportional electoral systems in the sample—Norway, Spain, and Austria—stand out with higher gender balance in parliaments, but gender gaps in seniority vary, suggesting the relevance of studies on electoral systems effects. In addition, the introduction of gender quotas in France (1999), Ireland (2012), and Spain (2007) led to an increase in women MPs without closing the gender gap in the two former countries. So, our descriptive findings indicate that quotas are not able—at least not alone—to secure the production of senior women, echoing the literature on benevolent sexism (Batista Pereira and Porto Reference Batista Pereira and Nathália2020). Therefore, we invite future studies to investigate how gender quotas affect seniority in more depth.
Finally, we documented how individual-level approaches based on averages of career length capture something substantially different from our seniority measures. For example, using the same data, the individual-level approach showed how congresswomen in the United States have a higher likelihood of surviving up to 19 terms than men, while our seniority measures documented very high gender gaps. This outlines how women who enter congress, are remarkably able to endure. Future studies could benefit from integrating individual and institutional level approaches to fully understand patterns of gender inequality in parliaments.
In addition to research on the causes of the gender gap in seniority, we also must explore its consequences, for example, by looking into how gender gaps shape legislative behavior in parliamentary party groups and committees and the type and amount of policy coming out of a parliament. As existing studies have established that there are disadvantages to being a newcomer, we invite future studies to systematically investigate whether high gender gaps, for instance, can impact previously documented differences in MPs’ party loyalty (Cowley and Childs Reference Cowley and Childs2003). If we can document that gender gaps systematically shape power dynamics within parliaments, legislative behavior, and not least the policy output, then a gender gap among parliamentary seniors represents a grave challenge for democracy.
Supplementary material
The supplementary material for this article can be found at http://doi.org/10.1017/S1743923X23000533.
Acknowledgments
We thank the editor and the anonymous reviewers of Politics & Gender. Also, the authors are grateful to Toril Aalberg, Britt Anlar, Elisa Bellé, Lise Lund Bjånesøy, Francesca Feo, Elisabeth Ivarsflaten, Mona Lena Krook, Laura Morales, Étienne Ollion, Seréna Nilsson Rabia, Leslie Schwindt-Bayer, Endre Tvinnereim, and Vibeke Wang, as well as other seminar participants at LIEPP and CEE SciencesPo (Paris), the DIGSSCORE seminar at University of Bergen, the online seminar of Women in Legislative Studies (WILS), Noviciat en Politiques in Lille, and the Norwegian National Conference in Political Science for discussions and feedback on previous versions of this article. We are especially thankful to Sascha Göbel and Simon Munzert for making the Comparative Legislators Database open access. We also wish to extend our thanks to Sigmund Andreas Tveit in the Norwegian Agency for Shared Services in Education and Research for providing assistance with the Norwegian data.
Funding statement
This study is supported by the European Research Council (ERC) under the European Union’s Horizon 2020 research and innovation program grant number 101002248 (SUCCESS).


 Open access