


1. Introduction
Understanding the role of cognitive and affective states in design activities is important to further investigate the nature and mechanism of the design process and to improve designer performance. This effort generally falls into the realms of psychology and design. According to Bloom’s taxonomy (Bloom, Reference Bloom1956), different cognitive aspects involved in a learning process include remembering, understanding, applying, analysing, evaluating and creating (Krathwohl, Reference Krathwohl2002; Conklin, Reference Conklin2005). Under the context of design, the studied cognitive states include designer’s attention, memory, knowledge, reasoning and problem solving (Poldrack et al., Reference Poldrack, Kittur, Kalar, Miller, Seppa, Gil, Parker, Sabb and Bilder2011; Sylcott, Cagan, & Tabibnia, Reference Sylcott, Cagan and Tabibnia2011; Balters & Steinert, Reference Balters and Steinert2017). Affective states include pleasure, pain, fear, anger and other common emotions by borrowing the definition of ‘affect’ in psychology (Arnold, Reference Arnold1960). Bloom’s taxonomy also talks about affective domain, which includes how we handle things with our emotions such as feelings, values, appreciation, enthusiasms, motivations and attitudes (Morshead, Reference Morshead1965). Cognitive and affective studies in cognitive psychology require well controlled experiments where the causal relation between a stimulus and a response can be effectively modelled and tested (Klimesch, Reference Klimesch1999; Jensen & Tesche, Reference Jensen and Tesche2002; Delplanque et al., Reference Delplanque, Silvert, Hot, Rigoulot and Sequeira2006; Thut et al., Reference Thut, Nietzel, Brandt and Pascual-Leone2006). The controllable and measurable parts of design activities have been well studied in the current design research (Gero & McNeill, Reference Gero and McNeill1998; Bashir & Thomson, Reference Bashir and Thomson2001; Summers & Shah, Reference Summers and Shah2010). However, well controlled experiments are limited in investigating creative and uncontrollable design activities (Nguyen & Zeng, Reference Nguyen and Zeng2012); as a result, rigorous findings on uncontrollable design activities are limited (Dietrich & Kanso, Reference Dietrich and Kanso2010; Abraham et al., Reference Abraham, Pieritz, Thybusch, Rutter, Kröger, Schweckendiek, Stark, Windmann and Hermann2012; Abraham, Reference Abraham2013; Nguyen & Zeng, Reference Nguyen and Zeng2014a; Hu, Booth, & Reid, Reference Hu, Booth and Reid2015; Oxman, Reference Oxman2017; Rieuf et al., Reference Rieuf, Bouchard, Meyrueis and Omhover2017; Liu et al., Reference Liu, Li, Xiong, Cao and Yuan2018; Dietrich, Reference Dietrich2019).
In researching into uncontrollable design activities, we assume:
Assumption 1: Regularities and patterns are implied in human activities.
Assumption 2: Human cognitive activities are reflected in electroencephalogram (EEG) signals.
The first assumption is the main motivation of design research aiming at finding hidden regularities in design activities. The second assumption is the reason why designer’s cognitive and affective states can be inferred from EEG data and why EEG data are processed during different steps within the proposed framework.
Based on the two assumptions above, this paper proposes a task-related EEG research framework, denoted as task-related EEG (tEEG) framework, to infer designer’s cognitive and affective states from neuro-cognitive and physiological data from uncontrolled or loosely controlled experiments. As the name suggests, the proposed tEEG framework aims to investigate a complex design process by conducting task-level analysis regarding different subtasks or subprocesses, which is enabled by loosely controlled experiments and a series of decomposition. Loosely controlled experiments are proposed to target the uncontrollable part of design activities whereas additional processing/analysis is requisite to alleviate the dangers of informal ‘reverse inference’ (Poldrack, Reference Poldrack2006, Reference Poldrack2011). As a result, clustering-based segmentation is proposed as a bridge from loosely controlled experiments to task-level analysis. The task-related framework consists of three main parts: data collection from loosely controlled experiments, clustering-based segmentation of unstructured design protocol and EEG-based segment analysis.
The objective of the first part, data collection from loosely controlled experiments, is to collect data for investigating the uncontrollable part of design activities which cannot be tested under well-controlled experimental conditions. Most of the existing neuro-cognitive research relies strongly on event-related potential (ERP) method (Friedman & Johnson, Reference Friedman and Johnson2000; Kutas & Federmeier, Reference Kutas and Federmeier2011), which averages neuro-responses across multiple trials under strictly controlled conditions where a repeatable behavioural pattern could occur in a statistically significant manner. However, design process is uncontrollable and should therefore not be too rigidly controlled. The same designer may produce different design solutions for the same design problem at different moments; and different designers may produce different solutions for the same problem in the same time. Besides, any artificial control can almost definitely change the nature of a design problem. Therefore, experimental participants should be given certain degrees of freedom to explore the assigned problem and generate new solutions, which is exactly what loosely controlled experiments can offer.
Clustering-based segmentation of unstructured design protocol, which is the second important part of the proposed tEEG framework, aims to structure the unstructured data collected from loosely controlled experiments into structured stimulus–response pairs (Bezdek, Ehrlich, & Full, Reference Bezdek, Ehrlich and Full1984; Xu & Wunsch, Reference Xu and Wunsch2005). During this step, both EEG data and designer’s behaviours will be processed, which is different from traditional segmentation in protocol analysis where only design behaviours are considered. That is to say, within the proposed tEEG framework, segmentation will be done not only based on the analysis of designer’s observable behaviours, but also by the captured similarity and dissimilarity within the collected EEG data. According to the second assumption, an improvement in segmentation result can be expected by considering the information conveyed in EEG data for segmentation. The necessity of such process can be explained from the viewpoint of ‘reverse inference’ (Poldrack, Reference Poldrack2006, Reference Poldrack2011). As a result, a complex design process is thereafter decomposed into several primitive cognitive activities, each of which is dominated by one or a few patterns.
Different from the two aforementioned parts that are proposed based on a series of analysis, the last part, namely segment analysis, includes most analysis steps applied in current EEG studies (Murugappan, Ramachandran, & Sazali, Reference Murugappan, Ramachandran and Sazali2010; Yohanes, Ser, & Huang, Reference Yohanes, Ser and Huang2012; Wang & Sourina, Reference Wang and Sourina2013; Blanco et al., Reference Blanco, Johnson, Jaquess, Oh, Lo, Gentili and Hatfield2017). Segment analysis deals with individually extracted segments resulted from the step of clustering-based segmentation. Each extracted segment can be analysed by traditional hypothesis test methods where some of the existing results and techniques on EEG-based cognitive and affective states may be adopted and integrated. Therefore, the repeatable and reproducible causal relations underlying the unstructured design process can be captured through applying the proposed tEEG framework which combines loosely controlled experiments and clustering-based segmentation.
This research contributes to design research in many different manners given that the tEEG framework aims to infer designer’s cognitive and affective states which may affect designer’s mental stress and performance (Nguyen & Zeng, Reference Nguyen and Zeng2012). First, the consideration of designer’s performance in design adds another dimension to the further development of design theories. Second, online application of the proposed tEEG framework is promising to construct an adaptive computer-aided design (CAD) system where designers can respond adaptively to their cognitive and affective states during a conceptual design process (Becattini et al., Reference Becattini, Borgianni, Cascini and Rotini2012; Zeng & Horváth, Reference Zeng and Horváth2012). Finally, among others, the tEEG framework can be applied to improve design training process by capturing designer’s cognitive and affective states during design activities (Waks, Reference Waks2001; Demirbas & Demirkan, Reference Demirbas and Demirkan2007; Steif, Fu, & Kara, Reference Steif, Fu and Kara2014; Nguyen & Zeng, Reference Nguyen and Zeng2014b; Nguyen & Zeng, Reference Nguyen and Zeng2017a, Reference Nguyen and Zeng2017b).
The remainder of the paper is organized as follows. Section 2 discusses and analyses the difficulties in applying EEG to design activities. Section 3 presents the proposed tEEG framework for cognitive studies of design activities while addressing how EEG signals are used for recognizing cognitive and affective states. Section 4 provides three examples of experimental application of the tEEG framework. Finally, Section 5 concludes this paper.
2. Applying EEG to design studies
2.1. Cognitive/affective factors influencing designer’s performance
Design, as a basic human activity, is to create a new product to its environment. From this perspective, design activities are a set of interactions among and between designer (D), product (S) and environment (E) (Zeng, Reference Zeng2004). The environment represents all of the objects in this world other than the product itself. A product comes from the environment, serves the environment and changes the environment (Zeng, Reference Zeng2015). From the original design problem, a designer generates tentative solutions; the tentative solutions will not only improve designer’s understanding, but also help reformulate the design problem; with the new understanding, the designer adjusts the solutions to fit the newly redefined problem; the adjustment, in turn, triggers new problems. The idea of the evolving environment is also reflected in situatedness, ‘which emphasizes that the agent’s view of a world changes depending on what the agent does’ (Gero & Kannengiesser, Reference Gero and Kannengiesser2004). Such a recursive process continues until the designer decides that a solution is satisfactory.
The process described above implies the nature of design thinking, which is co-evolutionary and follows the recursive logic of design (Zeng & Cheng, Reference Zeng and Cheng1991; Roozenburg, Reference Roozenburg1993; Dorst & Cross, Reference Dorst and Cross2001; Maher & Tang, Reference Maher and Tang2003; Gero & Kannengiesser, Reference Gero and Kannengiesser2004; Dong, Reference Dong2005, Reference Dong2007; Hatchuel & Weil, Reference Hatchuel and Weil2008; Nguyen & Zeng, Reference Nguyen and Zeng2012). Design, which can be seen as a designer’s mental effort to create product descriptions (design solution) from an initial design problem, involves looping and jumping among design problem, design knowledge and design solutions. During such a recursive design process, the environment evolves (Zeng & Gu, Reference Zeng and Gu1999a; Zeng, Reference Zeng2002, Reference Zeng2004) as shown in Figure 1. Each state of the evolution is a result of a primary design process cycle including defining problem, searching for knowledge, finding possible solutions, evaluating the solutions and making decisions (Gero, Reference Gero1990; Eekels, Reference Eekels2001; Nguyen & Zeng, Reference Nguyen and Zeng2012). A product will become a part of the environment (E) once it is taken as a design solution.
Design evolution process.

Design tasks can be understood as open-ended tasks, which do not have a predefined right outcome and may have uncountable acceptable solutions. A design task bears the following characteristics (Simon, Reference Simon1969, Reference Simon1973; Zeng & Cheng, Reference Zeng and Cheng1991; Roozenburg, Reference Roozenburg1993; Zeng & Gu, Reference Zeng and Gu1999a; Dorst & Cross, Reference Dorst and Cross2001; Hatchuel & Weil, Reference Hatchuel and Weil2003; Tan, Otto, & Wood, Reference Tan, Otto and Wood2017):
-
(i) Ill-defined in that a solution to accomplish a design task may consequently change and/or redefine the original task from which new tasks may emerge.
-
(ii) Different emergent design tasks will trigger different design knowledge and different design solutions, which will in turn further change and/or redefine the tasks.
-
(iii) The process required to accomplish the design task depends on the emerging design tasks and the perceived priorities to accomplish the tasks.
-
(iv) The criteria to judge a design solution are defined by the design solution itself.
-
(v) There are neither predetermined design solutions nor the optimal solution, and many feasible solutions may exist to accomplish an open-ended design task.
The characteristics above were generalized into the Postulate of Recursive Reasoning by Nguyen and Zeng (Reference Nguyen and Zeng2012), which states that design problem, design knowledge and design solutions will evolve simultaneously. Naturally, there is a great degree of uncertainty and unpredictability in the design evolution process (Nguyen & Zeng, Reference Nguyen and Zeng2012; Zeng, Reference Zeng2016). The uncertainty and unpredictability will trigger mental stresses. This leads to the Postulate of Mental Stress-Creativity Relation which states that designer’s creativity is related with his/her mental stress following an inverted U shaped curve (Figure 2), by adapting findings from psychology (Yerkes & Dodson, Reference Yerkes and Dodson1908).
Inverse U-shaped relationship between mental stress and creativity (Nguyen & Zeng, Reference Nguyen and Zeng2012; Nguyen & Zeng, Reference Nguyen and Zeng2017a, Reference Nguyen and Zeng2017b).

Borrowed the concept of stress from the strength of materials (Timoshenko, Reference Timoshenko1940), Nguyen and Zeng defined mental stress in a mathematical expression (Nguyen & Zeng, Reference Nguyen and Zeng2012; Nguyen & Zeng, Reference Nguyen and Zeng2017a, Reference Nguyen and Zeng2017b):
 $$ \mathrm{Mental}\ \mathrm{Stress}=\frac{\mathrm{Perceived}\ \mathrm{Workload}}{\mathrm{Mental}\ \mathrm{Capacity}} $$
The perceived workload, which is the workload perceived by an individual, can be greater or smaller than the actual workload depending on the individual’s mental capacity. In this regard, the perceived workload reflects the result of a series of cognitive processes (Guenther, Reference Guenther1997). The mental capacity can be understood as the individual’s capability to process his/her perceived workload.
Furthermore, the influencing factors of mental capacity have been identified as knowledge, skill and affect. Eq. (1) can be further expressed, in a conceptual manner, as:
 $$ \mathrm{Mental}\ \mathrm{Stress}=\frac{\mathrm{Perceived}\ \mathrm{Workload}}{\left(\mathrm{Knowledge}+\mathrm{Skills}\right)\times \mathrm{Affect}} \mathrm{Affect} \in \left(0,1\right) $$
It must be noted that Eq. (2) can only be interpreted as a conceptual relationship. The perceived workload is people’s actual and experienced workload during their interactions with the environment. Knowledge and skills represent the individual’s rational process in dealing with the perceived workload whereas affect refers to the individual emotional response to the perceived workload. The affect would determine how much of the individual’s rational capability can be effectively used in accomplishing the workload.
According to Bloom’s taxonomy, the basic learning activities can be classified into different cognitive aspects (Krathwohl, Reference Krathwohl2002; Conklin, Reference Conklin2005). For example, high-level cognitive activities can be identified through writing and drawing as summarizing and creating may occur during those activities (Plack et al., Reference Plack, Driscoll, Marquez, Cuppernull, Maring and Greenberg2007). In addition, cognitive aspects like attention, comparing and inferring may be expected cognitive findings when participants browse the websites. Furthermore, the mentioned human cognitive states are closely related to the influencing factors of stress identified in Eq. (2). Skills refer to an individual’s thinking styles, thinking strategy or reasoning methods, which include the individual’s capability to analyse and decompose the workload, to retrieve, search and digest the relevant and right knowledge to tackle the workload, to accomplish the related tasks by using the identified knowledge. The individual’s knowledge could help in the solution generation; however, the utilization of inappropriate knowledge may cause design fixations (Jansson & Smith, Reference Jansson and Smith1991; Viswanathan et al., Reference Viswanathan, Atilola, Esposito and Linsey2014; Crilly, Reference Crilly2015), which is considered as a disadvantage of cognitive control in (Chrysikou & Weisberg, Reference Chrysikou and Weisberg2005; Thompson-Schill, Ramscar, & Chrysikou, Reference Thompson-Schill, Ramscar and Chrysikou2009; Chrysikou, Reference Chrysikou2018). Both knowledge and skills are closely related to cognitive states like reasoning, memory, analysis, synthesis and so forth (Thorndyke, Reference Thorndyke1977; Gick & Holyoak, Reference Gick and Holyoak1983; Fagin et al., Reference Fagin, Moses, Halpern and Vardi2003; Brun, Masson, & Weil, Reference Brun, Masson and Weil2016). Therefore, a mapping could be established from the aforementioned cognitive states to design activities through a stress model-based analysis. In this way, the results from current EEG-based cognitive studies become more meaningful for design research. Table 1 presents a mapping between Bloom’s cognitive states, factors influencing mental stress involved, and corresponding design activities, where the design activities are identified in Nguyen & Zeng (Reference Nguyen and Zeng2012) and Suwa et al. (Reference Suwa, Purcell and Gero1998).
Mapping between Bloom’s cognitive states (Krathwohl, Reference Krathwohl2002), influencing factors of stress (Nguyen & Zeng, Reference Nguyen and Zeng2012), and design activities (Suwa, Purcell, & Gero, Reference Suwa, Purcell and Gero1998; Nguyen & Zeng, Reference Nguyen and Zeng2012)

Meanwhile, affective domain includes how we handle things with our emotions such as feelings, values, appreciation, enthusiasms, motivations and attitudes according to Bloom’s taxonomy. Researchers have proposed different models to describe and distinguish human emotions (Russell, Reference Russell1980; Watson & Tellegen, Reference Watson and Tellegen1985; Oatley & Johnson-laird, Reference Oatley and Johnson-laird1987; Ekman, Reference Ekman1992; Plutchik, Reference Plutchik1994). In general, those models can be classified into two types: one is multidimensional models such as the circumplex model containing valence and arousal dimensions (Russell, Reference Russell1980) and the model of positive affect (PA) and negative affect (NA) (Watson & Tellegen, Reference Watson and Tellegen1985); the others identify several basic discrete emotions like the five basic emotions model proposed by (Oatley & Johnson-laird, Reference Oatley and Johnson-laird1987), Ekman’s six basic emotions model (Ekman, Reference Ekman1992) and Plutchik’s eight basic emotions model (Plutchik, Reference Plutchik1994). Ekman’s model is chosen as an example of discrete emotion model due to a series of theoretical discussion on basic emotions presented in (Ekman, Reference Ekman1992; Ledoux, Reference Ledoux1998). Increasing effort has been made to investigate the influence of emotion (affect) on mental stress and performance (Kahneman, Reference Kahneman1973; Bagozzi, Gopinath, & Nyer, Reference Bagozzi, Gopinath and Nyer1999; Bechara, Damasio, & Damasio, Reference Bechara, Damasio and Damasio2000; Lazarus, Reference Lazarus2006; Zhao et al., Reference Zhao, Yang, Liu and Zeng2018). Scholars suggest that PA has a positive effect on one’s mental capacity in promoting broader attention, increased organization and reinforced integration ability (Isen, Reference Isen1993; Fredrickson, Reference Fredrickson2001). Research has also emphasized the role of PA in fostering more creative ideas (Isen, Daubman, & Nowicki, Reference Isen, Daubman and Nowicki1987; Baas, De Dreu, & Nijstad, Reference Baas, De Dreu and Nijstad2008; Conner & Silvia, Reference Conner and Silvia2015). Whereas NA could influence one’s mental capacity in an opposite way. Therefore, Table 2 represents how the six basic emotions identified by (Ekman, Reference Ekman1992) would influence designer’s mental capacity (a combination of knowledge and skills according to Nguyen & Zeng, Reference Nguyen and Zeng2012) by first mapping those emotions to the model of PA and NA (Watson & Tellegen, Reference Watson and Tellegen1985).
Mapping between Ekman’s basic emotions (Ekman, Reference Ekman1992), positive affect and negative affect model (Watson & Tellegen, Reference Watson and Tellegen1985), and designer’s mental capacity (Nguyen & Zeng, Reference Nguyen and Zeng2012)

The identification of designers’ cognitive and affective states is critical for further investigation of the nature and mechanism of the design process and for designer performance improvement.
2.2. Difficulties with EEG-based design studies
Efforts have been made to investigate design scenarios with EEG for two decades (Göker, Reference Göker1997; Nguyen & Zeng, Reference Nguyen and Zeng2010, Reference Nguyen and Zeng2014b; Hu et al., Reference Hu, Booth and Reid2015; Liu et al., Reference Liu, Li, Xiong, Cao and Yuan2018; Vieira et al., Reference Vieira, Gero, Delmoral, Gattol, Fernandes, Parente and Fernandes2019). The results presented in Göker (Reference Göker1997) indicate that the activated brain areas are different for novices and experts during design problem solving. A preliminary study was conducted by Nguyen and Zeng (Reference Nguyen and Zeng2010) which uses EEG to identify the regularities underlying a design process. The EEG results in Hinterberger, Zlabinger, & Blaser (Reference Hinterberger, Zlabinger and Blaser2014) show the neurophysiological discriminability of three mental locations (intrapersonal, extrapersonal and perspective taking) and two attentional foci (self and object). A physiological study (Nguyen & Zeng, Reference Nguyen and Zeng2014b) is conducted to investigate the relationship between designer’s mental effort (cognitive aspect) and mental stress. Hu et al. (Reference Hu, Booth and Reid2015) provided psychophysiological evidence for the role of warm-ups activities reducing inhibition during concept generation based on their analysis of EEG and galvanic skin response. In (Liang et al., Reference Liang, Lin, Yao, Chang, Liu and Chen2017), EEG signals were analysed to investigate the difference between expert designers’ visual attention and association processes. By comparing the time-related neural responses, the EEG results show differences of the mechanical engineers’ neurocognition in designing and problem-solving (Vieira et al., Reference Vieira, Gero, Delmoral, Gattol, Fernandes, Parente and Fernandes2019). The use of EEG and other biometric measures in experimental design research were reviewed and discussed in Borgianni & Maccioni (Reference Borgianni and Maccioni2020).
Currently, protocol analysis is widely used by scholars to segment a complex design process into simpler processes (Dorst & Dijkhuis, Reference Dorst and Dijkhuis1995; Neill, Gero, & Warren, Reference Neill, Gero and Warren1998; Gero & Tang, Reference Gero and Tang2001). Protocol analysis can be understood as a series of means to extract ‘reliable information about what people are thinking while they work on a task (Austin & Delaney, Reference Austin and Delaney1998)’. Verbal protocol analysis has been used as a tool for different objectives (Van Someren, Barnard, & Sandberg, Reference Van Someren, Barnard and Sandberg1994). In design domain, it has been used to study the designer’s perception. Verbal protocol analysis has been used to compare the architects’ perception and students’ perception based on their own freehand sketches (Suwa & Tversky, Reference Suwa and Tversky1997). The authors found that the architects think more deeply than students about the topic. Meanwhile, Suwa et al. (Reference Suwa, Purcell and Gero1998) used design protocol to code designer’s cognitive actions in order to learn human design process. In educational domain, researchers have used verbal protocol analysis to study human writing and reading process (Hayes & Flower, Reference Hayes and Flower1981; Afflerbach & Johnston, Reference Afflerbach and Johnston1984).
However, scholars have challenged the effectiveness of verbal protocol analysis (Russo, Johnson, & Stephens, Reference Russo, Johnson and Stephens1989; Smagorinsky, Reference Smagorinsky1989). One frequently asked question is ‘do subjects really have the ability to describe the processes they perform?’ (Ericsson & Simon, Reference Ericsson and Simon1980). Concerns have been raised in terms of two different ways of collecting verbal protocol, namely concurrent verbal protocol and retrospective protocol. Chiu & Shu (Reference Chiu and Shu2010) pointed out the limitation of verbal protocols with design experiments in which they mainly concerned about the data validity from several aspects. For example, the application of concurrent verbal protocol may alter the design process because of changes in design environment and emergent subtasks. Meanwhile, Gero and Tang compared the concurrent verbal protocol and retrospective verbal protocol in Gero & Tang (Reference Gero and Tang2001). Moreover, protocol segmentation and coding are usually done manually by domain experts and the results can be influenced by the experts’ subjective opinions. The results of protocol analysis can be wrong as ‘even experts may make errors or are unable to correctly recall all of their behaviours and reasoning steps (Pfeifer et al., Reference Pfeifer, Rothenfluh, Stolze and Steiner1992)’. Hence, concerns about verbal protocol analysis can be summarized as follows: (i) it is sensitive to subjective factors; (ii) there is no common standard to follow and (iii) such knowledge-based analysis is incomplete in most cases due to the limited knowledge of human beings.
EEG-based analysis is therefore introduced to design studies to address the mentioned problems. EEG is the record of the fluctuation of brain waves generated by the neurons circuit. EEG signals are measured in voltage and can be seen as a result of ‘the process of current flow through the tissues between the electrical generator and the recording electrode, which is called volume conduction’ (Olejniczak, Reference Olejniczak2006). EEG signals are naturally not as vulnerable to subjective factors as protocol analysis. Meanwhile, we propose a clustering-based segmentation method in Section 3.2 to standardize the segmentation of design process and EEG data can be applied for clustering analysis. In addition, EEG-based analysis has less dependency on knowledge and experience compared to protocol analysis as it deals with unlabeled data.
In order to take full advantage of EEG techniques, the characteristics of design activities need to be carefully considered when conducting EEG-based design studies. Design research differs from current EEG studies in that (i) design is a complex activity that consists of numerous basic cognitive activities; (ii) complex relationships between designer, product and environment contribute to the increase of difficulty in experiment design and control and (iii) design process is continuous and unrepeatable. As a result, EEG-based design research is embedded with difficulties summarized in the following:
-
(i) Task driven and delayed responses: The initial design task will drive the reformulation of the design problem, which is the stimulus for a design, throughout the entire design process; thus, the stimuli for design activities keep changing and are not always observable. behavioural responses to a stimulus may be delayed in that a designer may not show what comes in his/her mind right away. For example, a solution that a designer brought forth at certain moment may have been generated any time before that moment. Therefore, finding a causal stimulus–response relationship under such circumstance is not a straightforward effort.
-
(ii) Complex relationships: Design activities are so complex that there may not be direct causal relation between a stimulus and its responses, particularly if one intends to look into primitive cognitive activities. For example, if one needs to investigate the influence of designer’s knowledge on design performance, then it is expected that his/her perceived workload, skills and affect should remain stable, according to the mentioned mental stress-performance model. This ideal condition is unrealistic according to the discussions above as artificial controls will change how a real design would proceed even if the control could be possible.
-
(iii) Continuousness and nonrepetitiveness of design activity: Design activities cannot be repeated because of its intrinsic recursive logic according to the earlier discussion in the paper regarding the evolution of a design process. The impossibility of repetition makes ERP analysis unsuitable for full scale design studies. Design activities, in whole and in part, are not time-locked and thus cannot be reduced to ERP analysis.
2.3. Summary: identifying hidden patterns behind the unstructured design activities
The difficulties identified in Section 2.2 can be described as to find the hidden stimulus–response relationships during the design process. If we describe the design process as the entire process from a design problem to the generation of a final design solution, it inputs the initial design problem and outputs the design solution. Such a process consists of a series of subprocesses resulting from the dynamic evolving characteristic of design process (Zeng & Gu, Reference Zeng and Gu1999b) as illustrated in Figure 3. Each synthesis process describes the process in which a designer tries to conceive a solution to the current design problem. Once a design solution is produced, the designer is able to redefine the design problem and to retrieve the related design evaluation knowledge. This process is denoted as evaluation (Figure 3) and the new design problem becomes the input for another synthesis process with more detailed product descriptions (solution) and designer’s updated design knowledge. Therefore, a design process is constantly fed with evolving input, which is a design problem formulation, resulting in evolving design solutions as the output (Figure 3). The input and output variables of a design process belong respectively to sets ‘X’ and ‘Y’ where each $ {x}_i $
represents a certain design problem whose corresponding design solution (selected from multiple candidates) is denoted as
$ {x}_i $
represents a certain design problem whose corresponding design solution (selected from multiple candidates) is denoted as $ {y}_i $
. Besides, control variables belong to the set ‘C’ while designer’s behavioural and biometric performances are denoted as ‘Z’.
$ {y}_i $
. Besides, control variables belong to the set ‘C’ while designer’s behavioural and biometric performances are denoted as ‘Z’.
Design process representation.

The equations below show how such a complex process is mathematically formulated:
 $$ \overrightarrow{\mathsf{y}} = {f}_1\left(\overrightarrow{\mathsf{x}\ }\right),\overrightarrow{\mathsf{z}} = {f}_2\left({f}_1,\overrightarrow{\mathsf{c}\ }\right), $$
 $$ {\mathit{\mathsf{y}}}_{\mathit{\mathsf{j}}}={g}_1\left(\ {\mathit{\mathsf{y}}}_{\mathit{\mathsf{q}}}\right),\mathrm{where}\ \mathit{\mathsf{j}}\ne \mathit{\mathsf{q}},\mathsf{1}\le \mathit{\mathsf{j}}\le\mathit{\mathsf{m}},\mathsf{1}\le\mathit{\mathsf{q}}\le\mathit{\mathsf{m}}, $$
where $ \overrightarrow{\mathrm{x}} = \left\{{x}_1,{x}_2,\dots {x}_n\right\} $
represents input variables,
$ \overrightarrow{\mathrm{x}} = \left\{{x}_1,{x}_2,\dots {x}_n\right\} $
represents input variables, $ \overrightarrow{\mathrm{y}} = \left\{{y}_1,{y}_2,\dots {y}_m\right\} $
represents output variables,
$ \overrightarrow{\mathrm{y}} = \left\{{y}_1,{y}_2,\dots {y}_m\right\} $
represents output variables, $ \overrightarrow{\mathrm{c}} = \left\{{c}_1,{c}_2,\dots {c}_k\right\} $
represents control variables,
$ \overrightarrow{\mathrm{c}} = \left\{{c}_1,{c}_2,\dots {c}_k\right\} $
represents control variables, $ \overrightarrow{\mathrm{z}} = \left\{{z}_1,{z}_2,\dots {z}_p\right\} $
represents behavioural and biometric data,
$ \overrightarrow{\mathrm{z}} = \left\{{z}_1,{z}_2,\dots {z}_p\right\} $
represents behavioural and biometric data, $ {f}_1 $
describes the mapping from input (
$ {f}_1 $
describes the mapping from input ( $ \overrightarrow{\mathrm{x}\ } $
) to output variables (
$ \overrightarrow{\mathrm{x}\ } $
) to output variables ( $ \overrightarrow{\mathrm{y}\ } $
), which is a design process. Meanwhile, the design process
$ \overrightarrow{\mathrm{y}\ } $
), which is a design process. Meanwhile, the design process $ {f}_1 $
together with other factors (
$ {f}_1 $
together with other factors ( $ \overrightarrow{\mathrm{c}\ } $
) may cause changes in designer’s behaviours and biometric data (
$ \overrightarrow{\mathrm{c}\ } $
) may cause changes in designer’s behaviours and biometric data ( $ \overrightarrow{\mathrm{z}\ } $
), which is represented by
$ \overrightarrow{\mathrm{z}\ } $
), which is represented by $ {f}_2 $
. Certain relationships between different output variables may be related to each other by relations represented by
$ {f}_2 $
. Certain relationships between different output variables may be related to each other by relations represented by $ {g}_1 $
. The numbers of variables of input, output, control variables and other changes are denoted as n, m, p, and k respectively, which are independent from each other.
$ {g}_1 $
. The numbers of variables of input, output, control variables and other changes are denoted as n, m, p, and k respectively, which are independent from each other.
Eqs. (3) and (4) present a general experimental design research framework that structures unstructured data from design activities, which aims to identify the hidden stimulus–response relationships. This calls for a new experimental paradigm for EEG studies of design cognition.
3. A tEEG framework for EEG-based design studies
A task-related framework, denoted as tEEG, is proposed to investigate the cognitive and affective activities during design processes with the mentioned challenges in Section 2. The proposed tEEG framework composes of three main parts, namely data collection from loosely controlled experiments, clustering-based segmentation of unstructured design protocol and EEG-based segment analysis. Figure 4 presents the methodology of the proposed framework for EEG-based cognitive and affective studies under the context of design.
Methodology description of tEEG framework.
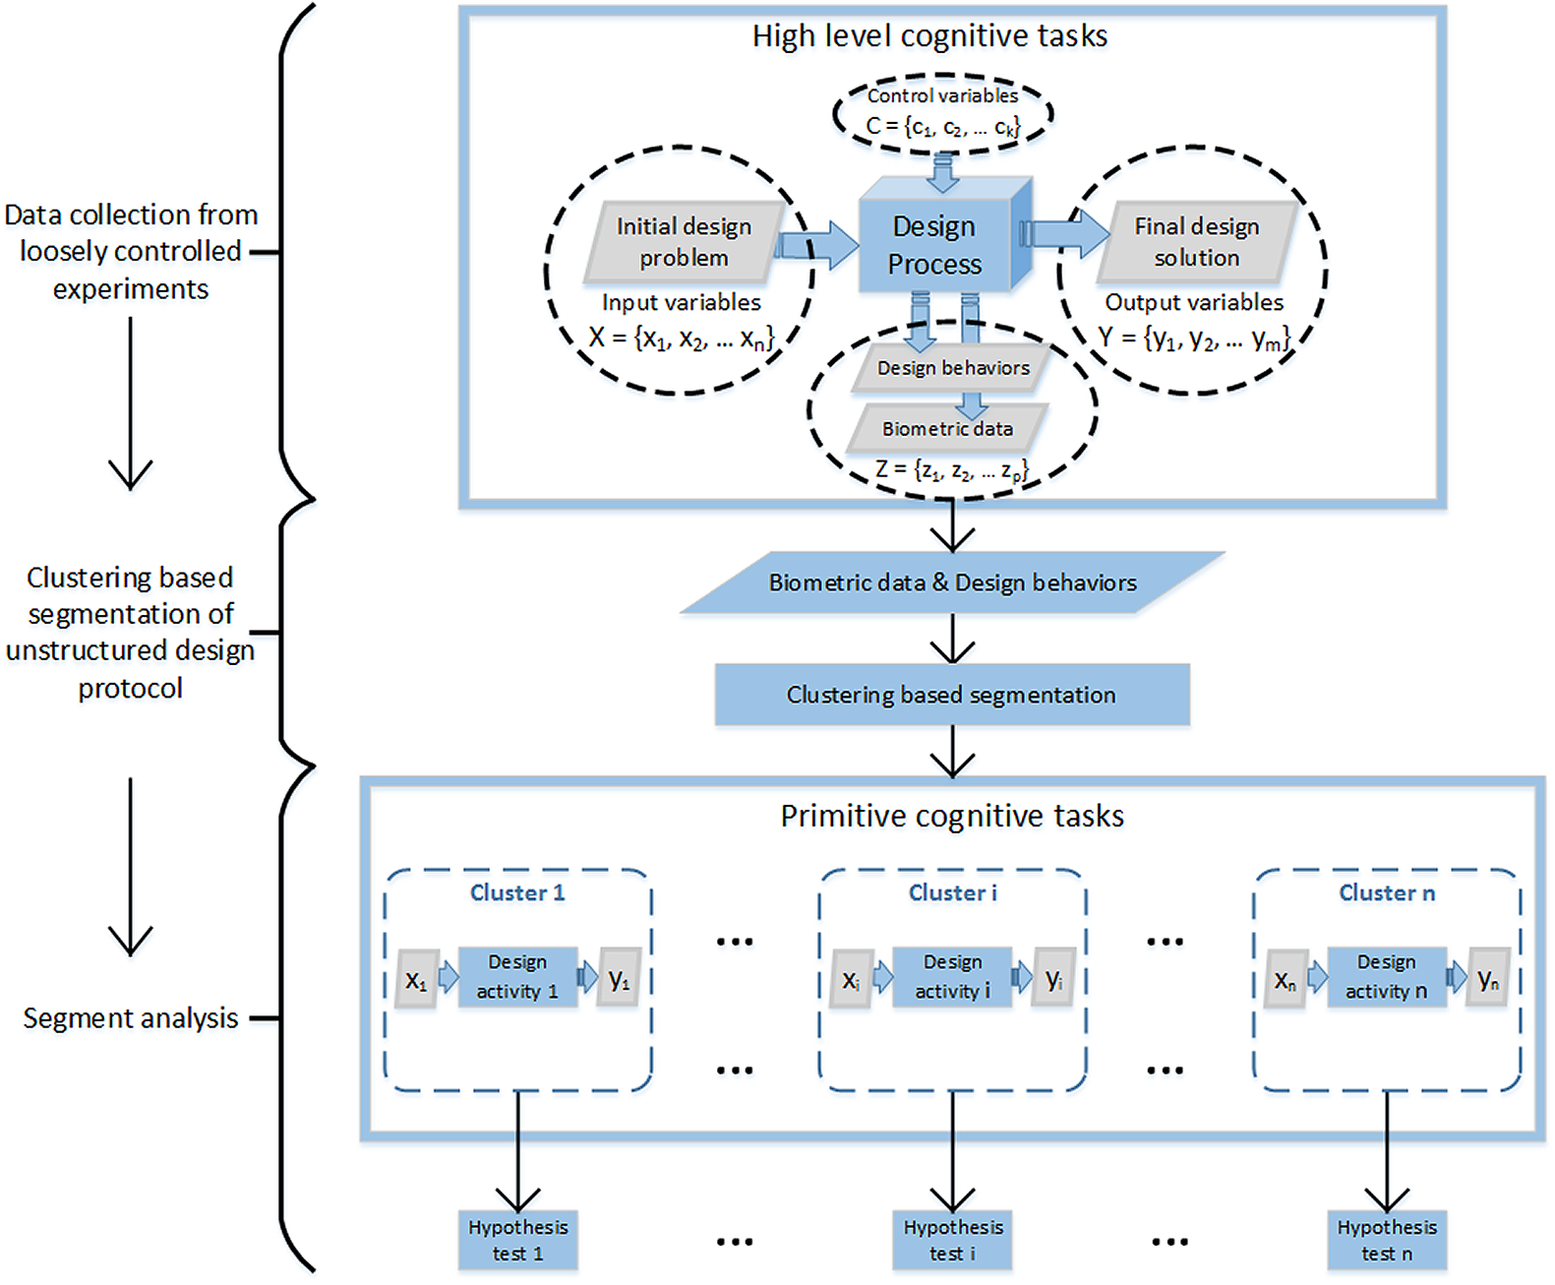
As depicted in Figure 4, the overall design process inputs the initial design problem and outputs the final design solutions if viewed from a high-level perspective. The data collected during loosely controlled experiments include designer’s behaviours, biometric data and design solutions based on the target design problem. Loosely controlled experiments are designed and conducted regarding the studied research topic where participants’ design activities happen. Second, clustering-based segmentation can be conducted to find the structured hidden stimulus–response data pairs from the unstructured data. Several subprocesses can be extracted from a complex design after this step. Last but not least, each individually extracted segment can be analysed following traditional hypothesis test method. It is during this step that some of the existing results and techniques on EEG-based cognitive and affective states may be adopted and integrated.
3.1. Data collection from loosely controlled experiments
3.1.1. EEG and data collection
EEG is the record of the fluctuation of brain waves generated by the neurons circuit. EEG signals directly measure ‘the dynamic, synchronous polarization of spatially aligned neurons in extended grey matter networks, with postsynaptic excitatory or inhibitory potentials being the main sources of the signal’ (Michel & Koenig, Reference Michel and Koenig2018). The signals measured in voltage can be seen as a result of ‘the process of current flow through the tissues between the electrical generator and the recording electrode, which is called volume conduction’ (Olejniczak, Reference Olejniczak2006). The two most important effects of volume conduction imply that: (i) an electrode at a given scalp location detects neuronal activity in simultaneously activated areas that far or near the electrode and (ii) a single source activity affects all scalp electrodes simultaneously leading to high correlation among multichannel EEG signals. This implication gives rise to an inverse problem in the EEG source localization that localizes the electrical activity in the brain according to EEG topographies. The inverse problem is that an EEG topography can be explained by different distributions of neuronal generators. However, the differences in EEG topographies might result from different distributions of activated neuronal generators.
As for the collection of EEG signals, EEG data can be collected through electrodes distributed on the scalp and the scalp EEG is an important tool for clinical usage (Niedermeyer & Lopes da Silva, Reference Niedermeyer and Lopes da Silva2005). The human cerebral cortex, that is the outermost layer of the brain, is divided into four lobes: frontal lobe, temporal lobe, occipital lobe and parietal lobe. Parietal lobe and frontal lobe are separated by the central sulcus. EEG signals are recorded by electrodes which are positioned at specific locations following international standards such as 10/20, 10/10 and 10/5 placement systems (Jasper, Reference Jasper1958; Chatrian, Lettich, & Nelson, Reference Chatrian, Lettich and Nelson1985; Oostenveld & Praamstra, Reference Oostenveld and Praamstra2001). EEG is collected at sampling rate between 250 and 500 Hz, even up to several kHz by the nowadays human EEG recording system (Weiergraeber et al., Reference Weiergraeber, Papazoglou, Broich and Mueller2016). Due to its high temporal resolution, time-based and frequency-based EEG features have been applied to detect mental and functional abnormalities, as well as cognitive and affective states under external or internal stimuli (Acharya et al., Reference Acharya, Sree, Swapna, Martis and Suri2013; Pidgeon et al., Reference Pidgeon, Grealy, Duffy, Hay, McTeague, Vuletic, Coyle and Gilbert2016). The time-based EEG features reflect the scalp potential of neuronal generators at a given moment in time. This information provides a possibility to study the temporal dynamics of whole-brain neuronal networks. The frequency-based EEG features reflect the rhythmic oscillations of neuronal generators in specific frequency bands. This information offers a possibility to investigate the characteristics of brain waves.
The collected EEG data imply information of designers’ cognitive and affective states as EEG signals relate regional brain activities to different cognitive and affective states (Delplanque et al., Reference Delplanque, Silvert, Hot, Rigoulot and Sequeira2006). Some EEG research was conducted based on the assumption that the frontal area plays an important role in the reflection of the valence level (Harmon-Jones & Allen, Reference Harmon-Jones and Allen1998; Schmidt & Trainor, Reference Schmidt and Trainor2001). The human parietal lobe was believed to be closely related to human perception, decision-making and speech comprehension (Bisley & Goldberg, Reference Bisley and Goldberg2010). The occipital lobe is known to process visual information, which is related to object detection and recognition (Malach et al., Reference Malach, Reppas, Benson, Kwong, Jiang, Kennedy, Ledden, Brady, Rosen and Tootell1995; Dijkerman & Haan, Reference Dijkerman and Haan2007). Studies also indicated that the two hemispheres of a brain are specialized for different tasks (Sergent & Bindra, Reference Sergent and Bindra1981; Rhodes, Reference Rhodes1985). ‘The right hemisphere mediates tasks requiring global, holistic processing such as facial effect recognition’, whereas the left hemisphere is specified for detailed analysis (Holt et al., Reference Holt, Kunkel, Weiss, Goff, Wright, Shin, Rauch, Hootnick and Heckers2006). Nie et al. (Reference Nie, Wang, Shi and Lu2011) concluded from their experimental analysis that the EEG features related to emotional states ‘are mainly on the right occipital lobe and parietal lobe in alpha band, central site in beta band, left frontal lobe and right temporal lobe in gamma band’. As a result, there are researchers trying to look at what is happening inside designer’s brain during the design process.
3.1.2. Loosely controlled experiments
Loosely controlled experiments are proposed for design studies which should be less controlled compared to traditional ERP experiments based on our previous discussions of design process. The surrounding environment of a product consists of everything other than the product itself and the designer. Additional controls will bring changes to the environment resulting in different design solutions as those controls change the environment in which the product is to be designed (Zeng & Cheng, Reference Zeng and Cheng1991; Roozenburg, Reference Roozenburg1993; Dorst & Cross, Reference Dorst and Cross2001; Maher & Tang, Reference Maher and Tang2003; Gero & Kannengiesser, Reference Gero and Kannengiesser2004; Dong, Reference Dong2005, Reference Dong2007; Hatchuel & Weil, Reference Hatchuel and Weil2008; Nguyen & Zeng, Reference Nguyen and Zeng2012). This means that loosely controlled experiments will be conducted without control of certain extraneous variables. A noticeable characteristic of such experiments is that the experiment could last much longer than traditional ERP experiment, during which various cognitive activities may happen. Meanwhile, loosely controlled experiments are proposed to target the uncontrollable part of design activities while current EEG-based design studies mainly investigate basic and clear stimulus–response relationships under experiments with better controls. The consistency of the nature of loosely controlled experiments and that of complex design scenarios indicates more possibilities and new directions for design studies. Finally, different loosely controlled experiments can be designed depending on the complexity of the studied scenario and the cognitive/affective aspect of interest. That is to say, designers need to have an overall understanding of the research topic and be aware of the characteristics of this kind of experiment when designing a loosely controlled experiment. A basic principle of experiment design for studying design activities is to ensure the emergence of regularities related to the phenomena under observation while applying minimum controls.
Despite the difference in experiment design, EEG data collection under loosely controlled design experiments will be the same as that under experiments of current EEG studies. EEG data will be collected throughout the experiment while subjects are asked to solve a design problem. Moreover, behavioural data will also be collected which will be used in clustering-based segmentation as illustrated in Figure 4. In the meantime, only ambient noises will be filtered from EEG data and artifacts are kept for further analysis, which is different from the data filtering step in current EEG studies. Those artifacts can be used for clustering-based segmentation given that the so-called artifacts may be an indirect reflection of participant’s cognitive/affective activities.
3.2. Clustering-based segmentation of unstructured design protocol
The purpose of data segmentation is to divide a complex design process into several primitive cognitive subprocesses that can be studied using conventional hypothesis test methods, as is specified in Figure 4. This step is essential and necessary in the proposed framework because of the unstructured data collected from loosely controlled experiments. The reason for not applying existing EEG techniques directly to the unstructured data can be explained from the critiques and concerns with ‘reverse inference’ (Poldrack, Reference Poldrack2006, Reference Poldrack2011). An inherent limitation of reverse inference is that an activated region or an observable pattern is necessary but not sufficient to a certain mental state. As suggested in Poldrack (Reference Poldrack2006, Reference Poldrack2011), a probabilistic expression could be a better way to explain the information provided by reverse inference. Following this point of view, it is very important to increase the posterior probability, which indicates how confident we are with the result obtained from reverse inference, when interpreting neuroimaging data. The proposed clustering-based segmentation intends to extract the underlying structured groups from the unstructured data, which is consistent with one of the possible ways to improve the confidence in reverse inference by ‘increasing the prior probability of the cognitive process in question’ (Poldrack, Reference Poldrack2011).
Since a design experiment consists of numerous stages and processes of solving different subtasks and evolves over time, designer’s cognitive and affective states should also vary from time to time. Different cognitive, affective and behavioural states may be dominant at different stages so that the recognition results should reflect the designer’s cognitive and affective states in a basic design activity. Therefore, the recognition of cognitive and affective states can be done for each individual subprocess instead of the entire process by segmenting either the object of study into primitive ones or the time duration into shorter ones or into the both. Each segment will have a clear stimulus–response relationship that can be effectively tested by using existing hypothesis test methods. Afterwards, appropriate analysis methods should be applied to different subtasks and/or at a shorter duration for their corresponding hypothesis tests.
Clustering algorithms could be integrated to find the relative ‘structured’ groups from the unstructured data. Clustering aims to separate an unlabelled dataset into several clusters by capturing the hidden similarity and dissimilarity within the data (Jain, Murty, & Flynn, Reference Jain, Murty and Flynn1999; Xu & Wunsch, Reference Xu and Wunsch2005; Jain, Reference Jain2010). In terms of the aforementioned concerns, the influence of subjective factors can be attenuated by taking into consideration the data-driven analysis results that are obtained by applying clustering algorithms to the collected data. Besides, a common standard could be developed to apply clustering algorithms for segmenting unstructured data. Clustering, as an unsupervised classification method, has less dependency on knowledge and experience compared to protocol analysis as it deals with unlabelled data. Within the proposed tEEG framework, EEG data are the main source of the unstructured data on which clustering algorithms are applied.
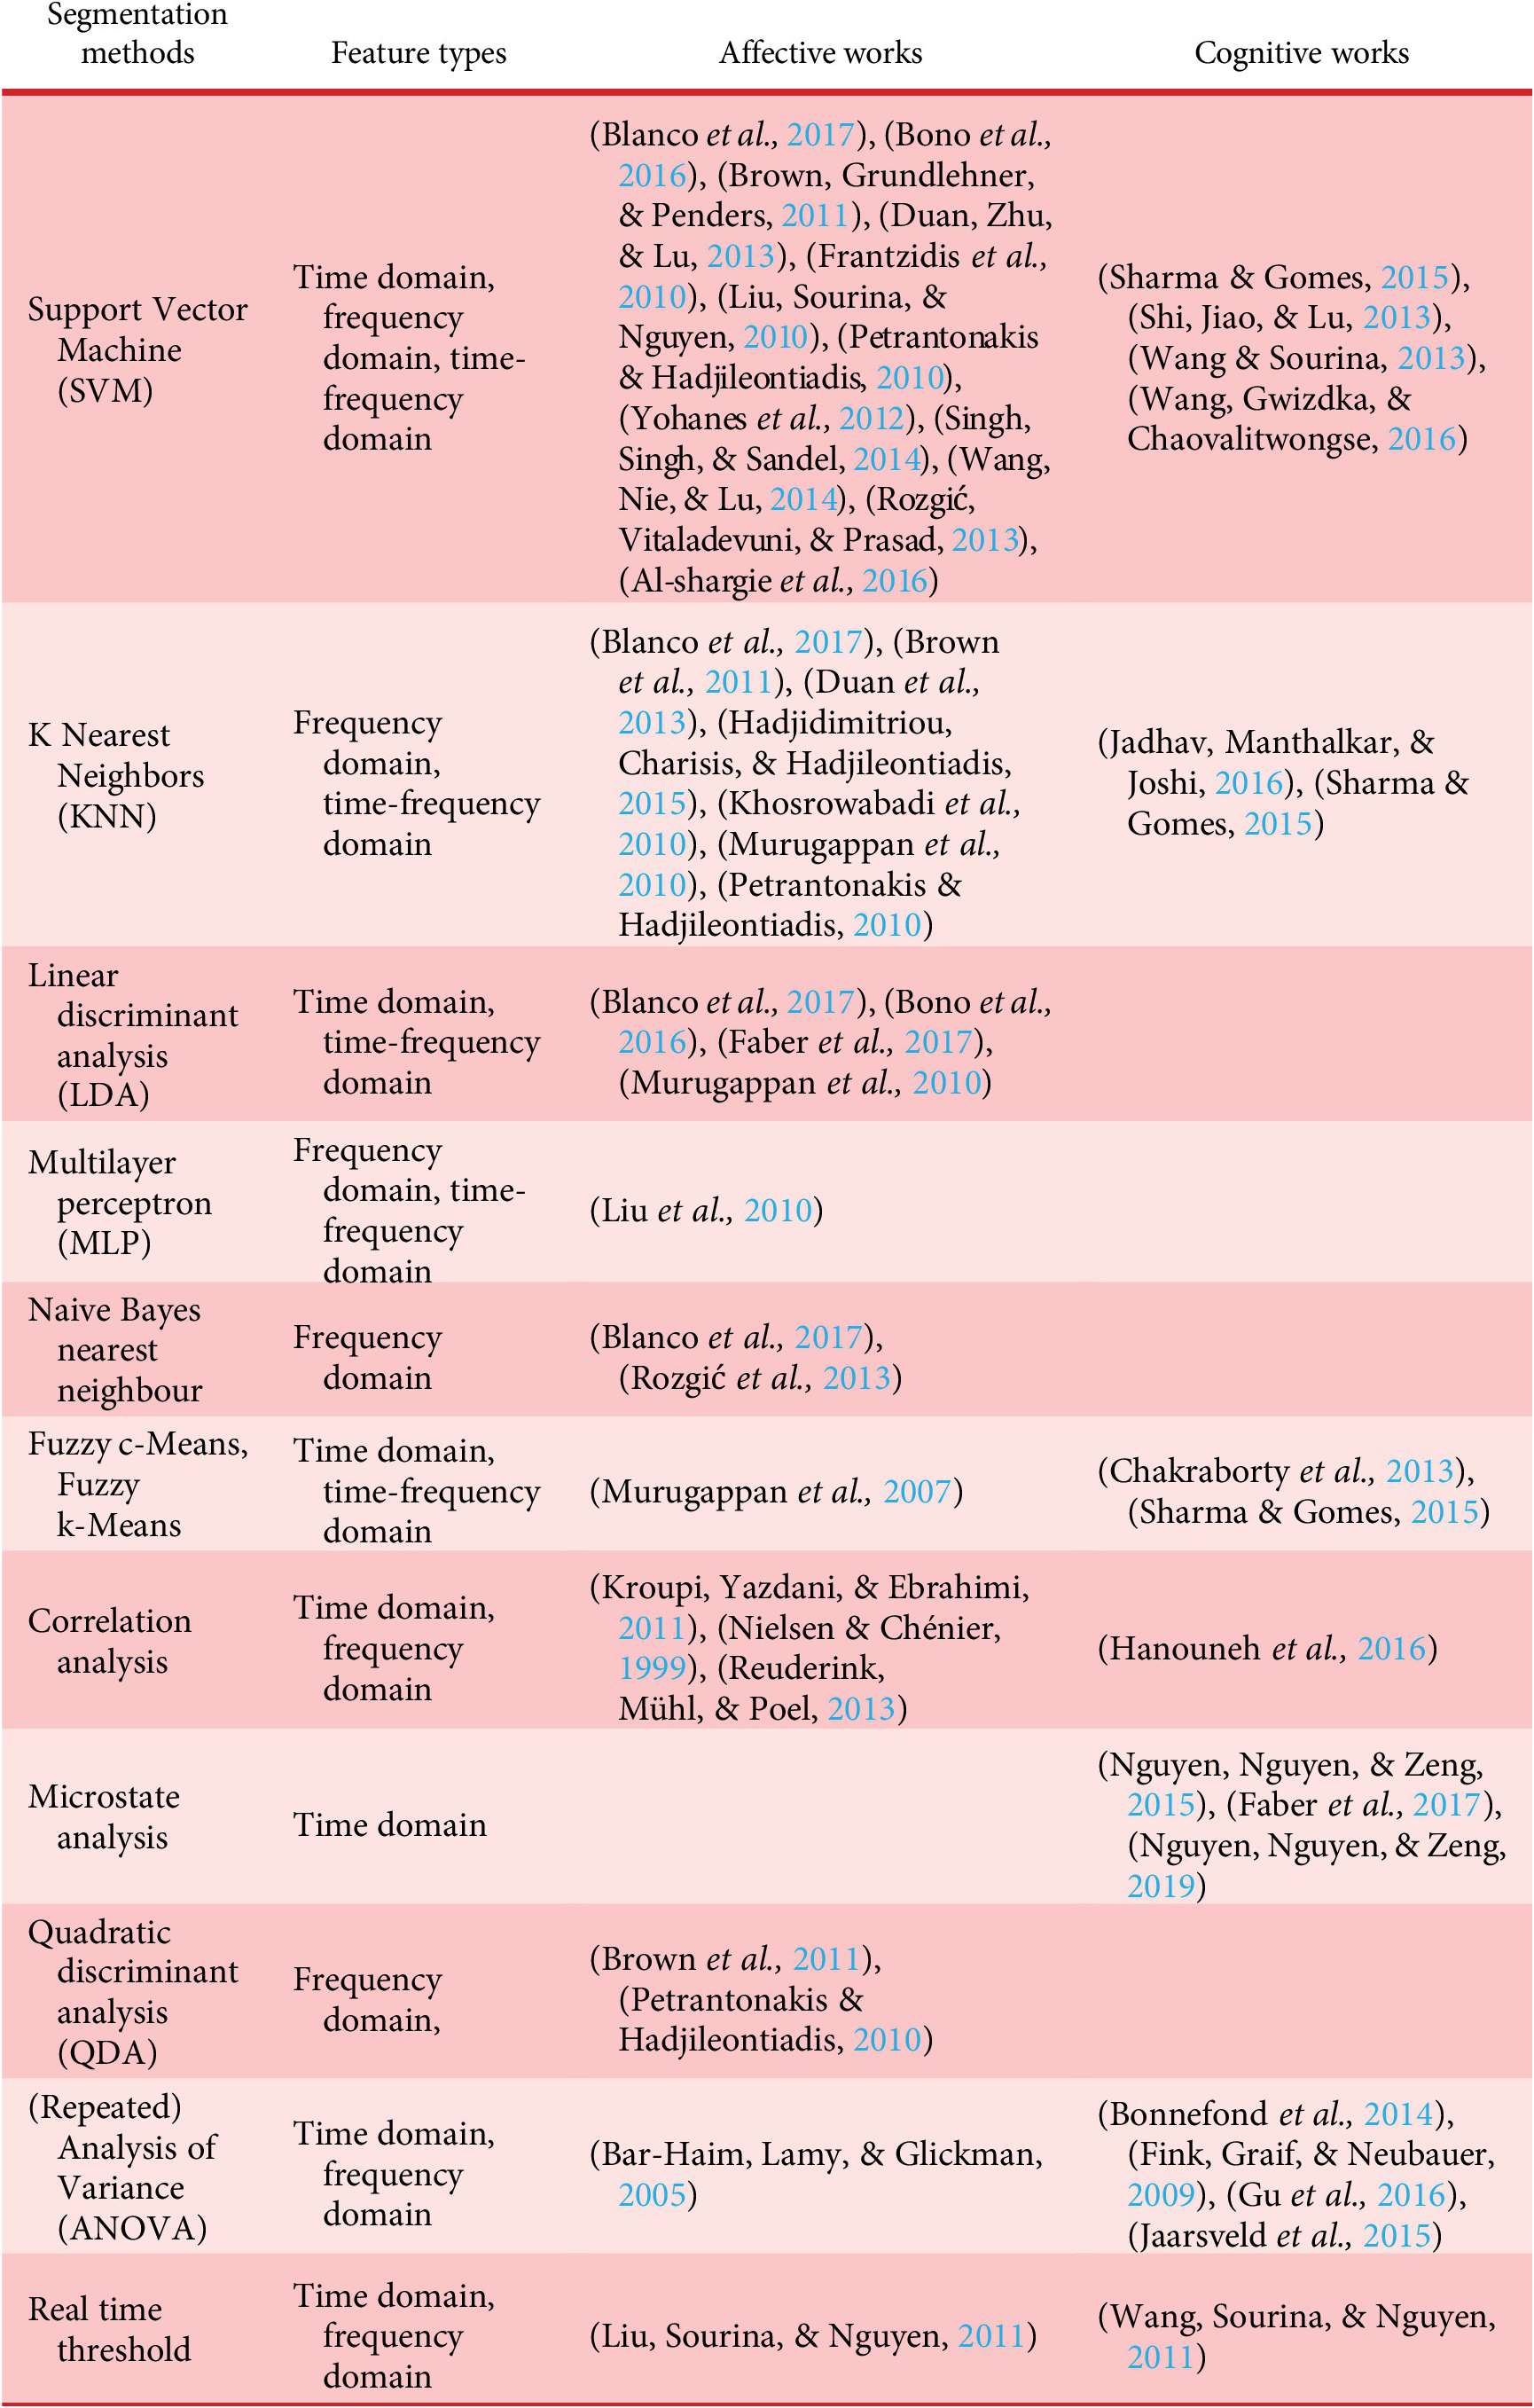
Current EEG-based segmentation methods can be adopted and integrated for segmenting the data collected from loosely controlled experiments. The purpose of EEG-based segment techniques is to structure the unstructured data into pairs of stimulus and response and Table 3 summarizes the EEG-based segmentation methods applied in existing cognitive and affective studies based on our survey. The EEG signals collected from loosely controlled design experiments seem to convey plentiful information related to different cognitive states, affective states and other hidden factors. Each individual segment is supposed to be sampled from the same data population. In this way, it is possible to capture the repeatable and reproducible causal relations underlying the EEG data collected from loosely controlled design experiment, which produces uncontrolled, unpredictable and unstructured data belonging to different data populations. Aligning segments to the parts with high confidence from the protocol analysis results, it is possible to validate the reliability of the applied EEG-based segment techniques.
Classification methods in recognizing cognitive/affective states from EEG
Different methods have been applied to segment EEG data in time, frequency and time-frequency domains. In time-frequency domain, nonstationary EEG signals are broken down into pseudo-stationary segments during which statistical properties do not vary with time. First, EEG signals need to be transformed from the time domain to time-frequency domain. Short-term fast Fourier transform and wavelet transform are widely used to transform signals from the time to time-frequency domain. Second, several EEG features can be extracted in frequency domain, such as power, nonlinear energy operator (Agarwal & Gotman, Reference Agarwal and Gotman1999) and generalized likelihood ratio (Appel & Brandt, Reference Appel and Brandt1983). Third, segmentation boundaries can be detected by comparing differences in EEG features between reference and sliding test window. If the sliding test window passes over a segment boundary, the differences would increase significantly leading to greater than a predefined threshold. If the sliding test window passes within a segment boundary, the sliding test and reference window would continually move based on different strategies (Wong & Abdulla, Reference Wong and Abdulla2006). Alternatively, segmentation boundaries can be detected by clustering EEG features in overlap reference windows (Barlow et al., Reference Barlow, Creutzfeldt, Michael, Houchin and Epelbaum1981; Nguyen et al., Reference Nguyen, Nguyen and Zeng2019).
In time domain, microstate analysis is used to identify successive short time periods during which the distribution of the scalp potential filed remains semi-stable. The changes of distribution of the scalp potential filed imply different activation of global network activity in the brain. Pascual-Marqui, Michel, & Lehmann (Reference Pascual-Marqui, Michel and Lehmann1995) proposed a clustering-based method to identify the most dominant spatial components in the EEG topography series. This method was based on the k-means approach that clusters the scalp potential filed topographies into representative cluster centroids in terms of spatial correlations. The optimal number of cluster centroids is determined by cross-validation criterion, which optimally explains the variance in each cluster. Murray, Brunet, & Michel (Reference Murray, Brunet and Michel2008) proposed an Atomize and Agglomerate Hierarchical Clustering (AAHC) to identify representative cluster centroids in a bottom-up manner. In contrast with the k-means approach that its results vary across runs due to a random selection of data points as seed clusters, the AAHC is a deterministic approach that its results are independent with the repetition of runs. Alternatively, other methods in factor analysis were applied to determine representative cluster centroids, including principal component analysis (Pourtois et al., Reference Pourtois, Delplanque, Michel and Vuilleumier2008) and independent component analysis (Makeig et al., Reference Makeig, Debener, Onton and Delorme2004).
Afterwards, representative cluster centroids are used to label original EEG topography based on topographical similarity. It is important to note that a frame of original EEG topography can only be assigned to a single representative cluster centroid. The assumption behind the restriction is that only one dominant spatial component entirely reflects global brain activity at each moment in time. Polarity of these spatial maps is ignored, since oscillations of the same neuronal generators lead to inversion of the scalp potential field.
Thereafter, a set of successive short time periods labeled with the same centroid is generated to form a microstate. Each microstate lasts from 60 to 120 ms. In the field of design, microstates need to be merged to form segments with longer duration. The accuracy and precision of segments can be tested by comparing with parts that have high confidence from the protocol analysis. Attempts have been made to realize data segmentation with an EEG-based algorithm which does not involve a manual step as in traditional protocol analysis (Nguyen et al., Reference Nguyen, Nguyen and Zeng2019). The authors used transient microstate percentage of EEG signals to merge microstates to form segments with longer duration during the complex design process (Nguyen, Nguyen, & Zeng, Reference Nguyen, Nguyen and Zeng2018; Nguyen et al., Reference Nguyen, Nguyen and Zeng2019). More details of the mentioned analysis can be found in Section 4.3 where the study is discussed as an example of research guided by tEEG framework.
Therefore, a clustering-based segmentation is proposed to process the unstructured data collected during loosely controlled experiments. Apart from the improvements regarding the three concerns of traditional protocol analysis, another advantage of this clustering-based segmentation lies in the involvement of EEG data during data segmentation may improve the completeness of the (protocol analysis based) segmentation results. From the discussions above and previous attempts, the procedure of the proposed clustering-based segmentation can be explained as follows:
-
(i) Conduct protocol analysis and apply clustering algorithms on EEG data simultaneously.
-
(ii) Use the part with high confidence from the protocol analysis results as the criteria to assess the reliability of the applied clustering algorithm. If the reliability is not satisfying, a different clustering algorithm can be applied until the clustering analysis results can be accepted.
-
(iii) The segments obtained based on clustering analysis are labelled by the protocol analysis results.
3.3. EEG-based segment analysis
This subsection discusses the critical issues related to segment analysis. As illustrated in Figure 4, the extracted primitive tasks will thereafter be tested by a series of corresponding hypotheses. Each individually extracted segment is analysed following the traditional hypothesis test method considering that each segmented subprocess may be dominated by a stimulus–response relationship. The purpose of EEG-based segment analysis is to identify causal relations in the segmented design process. The captured causal relations can be used to infer cognitive and affective states that have been widely tested in the field of cognition and psychology during the design process.
It is during this step that some of the existing results and techniques on EEG-based cognitive and affective states may be adopted and integrated. In time-frequency domain, each individual segment can be analysed using event-related (de)synchronization (ERD/ERS) and task-related power changes (TRP) (Gerloff et al., Reference Gerloff, Richard, Hadley, Schulman, Honda and Hallett1998; Pfurtscheller & Da Silva, Reference Pfurtscheller and Da Silva1999). These methods reflect the rhythmic oscillations of neuronal generators in specific frequency bands due to external or internal stimuli. TRP can be quantified by subtracting the log-transformed power of the reference segment from the activation segment at each electrode. Negative values indicate the decreases of task-related power from the reference to activation segment, while positive values indicate the increases of task-related power from the reference to activation segment (Pfurtscheller & Da Silva, Reference Pfurtscheller and Da Silva1999). The degree of increase and decrease can be tested by ANOVA or repeated measures ANOVA to reveal causal relations for each segment at each electrode. Task-related power in the alpha band has been consistently reported in creative ideation in the verbal domain. Alpha power has been considered as an index to reflect creativity-related task-demands, originality of ideas and individual’s creativity levels (Fink & Benedek, Reference Fink and Benedek2014). Specifically, alpha synchronization was widely associated with idea evaluation (Hao et al., Reference Hao, Ku, Liu, Hu, Bodner, Grabner and Fink2016), divergent thinking (Fink et al., Reference Fink, Grabner, Benedek and Neubauer2006) and fixation overcoming (Camarda et al., Reference Camarda, Salvia, Vidal, Weil, Poirel, Houde, Borst and Cassotti2018). The time-course research indicated that alpha power increases at the later stages of the creative ideation (Schwab et al., Reference Schwab, Benedek, Papousek, Weiss and Fink2014; Rominger et al., Reference Rominger, Papousek, Perchtold, Benedek, Weiss, Schwerdtfeger and Fink2019), which seems like a U-shaped pattern. However, alpha synchronization is in contradiction with visual creativity. Serval studies reported a consistent pattern of alpha synchronization during visual creativity compared to baseline fixation (Pidgeon et al., Reference Pidgeon, Grealy, Duffy, Hay, McTeague, Vuletic, Coyle and Gilbert2016). Indeed, alpha synchronization was associated with enhanced internally-directed attention and top-down control of external stimulus (Klimesch, Reference Klimesch1999; Klimesch, Sauseng, & Hanslmayr, Reference Klimesch, Sauseng and Hanslmayr2007). Alpha desynchronization was associated with cortical activation (Klimesch, Reference Klimesch2012).
In time domain, each individual segment can be analysed using microstate parameters, such as duration, occurrence, coverage and transition probability (Michel & Koenig, Reference Michel and Koenig2018). The duration is calculated as the average lifespan of each microstate when a microstate remains stable, interpreting as the degree of stability of its underlying neural assemblies (Zappasodi et al., Reference Zappasodi, Perrucci, Saggino, Croce, Mercuri, Romanelli, Colom and Ebisch2019). The occurrence is calculated as the average number of times per second that a microstate remains stable, interpreting as the degree of activation of its underlying neural generators (Zappasodi et al., Reference Zappasodi, Perrucci, Saggino, Croce, Mercuri, Romanelli, Colom and Ebisch2019). The coverage is calculated as the fraction of total segment time that a microstate remains stable, interpreting as the variation of dependence between stimuli and responses (Zappasodi et al., Reference Zappasodi, Perrucci, Saggino, Croce, Mercuri, Romanelli, Colom and Ebisch2019). The transition probability is calculated as the percent of transitions from one microstate to another (Seitzman et al., Reference Seitzman, Abell, Bartley, Erickson, Bolbecker and Hetrick2017). Recently, Hurst Exponent, Autoinformation Function (AIF), and Partial AIF have been used to reveal the temporal dynamics of microstate sequences (Van de Ville, Britz, & Michel, Reference Van de Ville, Britz and Michel2010; Von Wegner et al., Reference Von Wegner, Tagliazucchi, Brodbeck and Laufs2016; Von Wegner, Tagliazucchi, & Laufs, Reference Von Wegner, Tagliazucchi and Laufs2017; Von Wegner, Reference Von Wegner2018). These parameters provide us significant metrics to understand flows of human thoughts in a segment since microstates are believed to represent basic building blocks of human thoughts.
Beyond analysing the microstate parameters within segments, the microstate parameters can be analysed between segments. On the one hand, combined EEG-fMRI and EEG source localization studies revealed that microstates are closely associated with resting-state network as identified using fMRI (Michel & Koenig, Reference Michel and Koenig2018). For instance, microstate A reflects auditory network activity; microstate B reflects visual network activity; microstate C reflects control network activity and microstate D reflects dorsal attention network activity (Britz, Van De Ville, & Michel, Reference Britz, Van De Ville and Michel2010). On the other hand, several studies compared the microstate parameters between different cognitive tasks (Milz et al., Reference Milz, Faber, Lehmann, Koenig, Kochi and Pascual-Marqui2016; Pirondini et al., Reference Pirondini, Coscia, Minguillon, Millán, Van De Ville and Micera2017; Murphy et al., Reference Murphy, Stickgold, Parr, Callahan and Wamsley2018; Ruggeri et al., Reference Ruggeri, Meziane, Koenig and Brandner2019; Zappasodi et al., Reference Zappasodi, Perrucci, Saggino, Croce, Mercuri, Romanelli, Colom and Ebisch2019). (Milz et al., Reference Milz, Faber, Lehmann, Koenig, Kochi and Pascual-Marqui2016) compared duration, occurrence and coverage of microstates between four conditions: resting, object-visualization, spatial-visualization and verbalization. It was found that the duration, occurrence and coverage of microstate B increased from the resting to verbalization while they increased from the object-visualization to verbalization. It seems that microstate B could reflect verbalization instead of visualization activity. These inconsistent findings suggest that the microstate parameters should be compared not only within segments but also between segments or conditions.
Furthermore, a reference segment must be comparable with an activation segment in every aspect except the one being studied (Luo & Knoblich, Reference Luo and Knoblich2007). In the field of neurocognition, a resting segment has been considered as a reference segment in most cases. Stark and Squire (Reference Stark and Squire2001) indicated that the rest condition is an ambiguous reference for memory tasks since the rest condition seems to activate many brain areas, which might be activated in the memory tasks (Stark & Squire, Reference Stark and Squire2001). To avoid this ambiguity, the parameters of a microstate should be compared multiple times between different segments or conditions. Therefore, the reference segment needs to be established carefully and properly.
To sum up, every extracted feature has its specific aspect of information for which some information will be lost. For example, frequency domain features can hardly describe temporal (time) information. Furthermore, information is organized through different ways and representation forms differ from one feature to another. As a result, a comprehensive understanding of various features is essential as each feature represents a different way of information selection and organization. Table 4 and Table 5 list the applied EEG features and their corresponding affective and cognitive findings within the surveyed research papers.
Mapping between EEG features and affective findings

Mapping between EEG features and cognitive findings
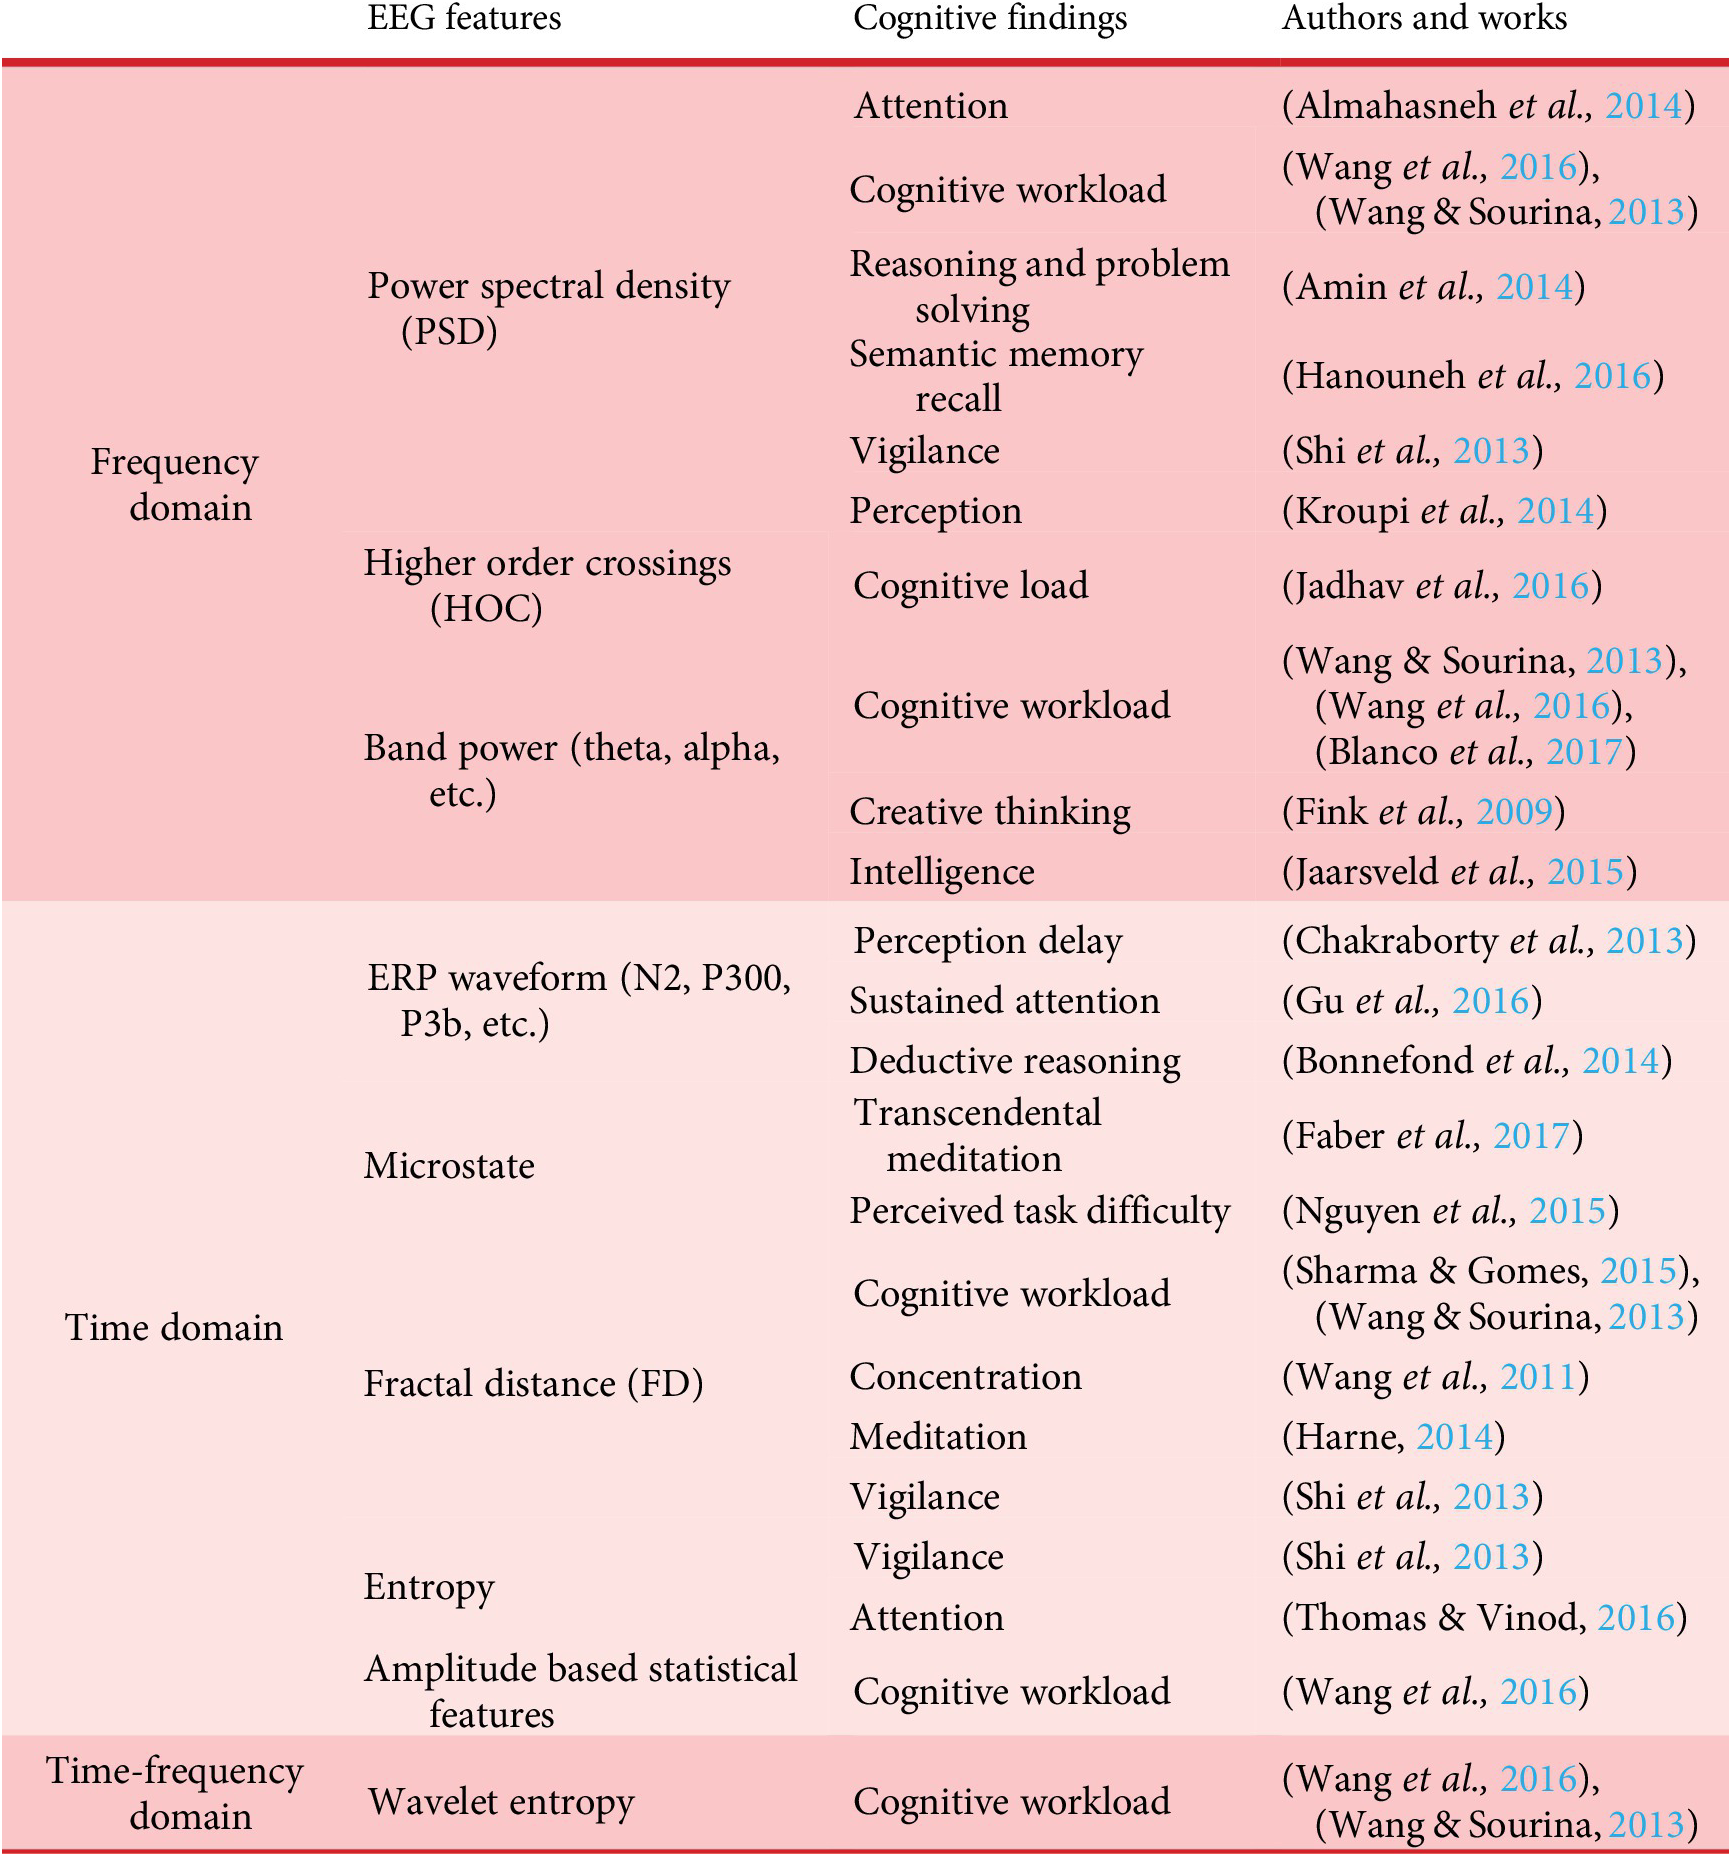
The applied EEG features vary from time domain to (time-) frequency domain, from scalar to matrix (like microstate). It can be seen from the above tables that scholars usually extract one or several features in order to recognize certain cognitive/affective states or to compare the performance of different features regarding a specific research problem. The two tables also indicate that the applied EEG features for affective states recognition are similar to that for cognitive recognition. However, it appears that EEG-based cognitive research falls behind affective research by comparing Table 4 and Table 5. Table 4 shows that scholars are now able to recognize or quantify some emotional states from EEG signals, even though the number and taxonomy of the EEG-based emotional state recognition are still diversified. The listed affective recognition results are represented either in a two-dimensional (2D) (valence-arousal) model (Frantzidis et al., Reference Frantzidis, Bratsas, Papadelis, Konstantinidis, Pappas and Bamidis2010; Rozgić et al., Reference Rozgić, Vitaladevuni and Prasad2013; Hadjidimitriou et al., Reference Hadjidimitriou, Charisis and Hadjileontiadis2015) or as discrete emotional states (Bar-Haim et al., Reference Bar-Haim, Lamy and Glickman2005; Murugappan et al., Reference Murugappan, Ramachandran and Sazali2010; Liu et al., Reference Liu, Sourina, Nguyen, Gavrilova and Tan2011), whereas in most of the surveyed cognitive studies (Table 5), scholars try to identify patterns of the extracted features regarding to a certain level of their studied cognitive problem (Fink et al., Reference Fink, Graif and Neubauer2009; Bashiri et al., Reference Bashiri, Mumtaz, Malik and Waqar2015; Hanouneh et al., Reference Hanouneh, Amin, Saad and Malik2016). It may be concluded that EEG-based cognitive findings are somehow still at the early stage as specific cognitive states are neither recognized nor quantified in the surveyed studies.
Various classification and analysis algorithms are applied to recognize cognitive and affective states from EEG signals, which directly contributes to the recognition result. Popular classifiers include support vector machine (SVM), K-Nearest Neighbours algorithm (K-NN), linear discriminant analysis (LDA), as well as their derived algorithms and other classification algorithms (Altman, Reference Altman1992; Cortes & Vapnik, Reference Cortes and Vapnik1995). Numerous analysis methods have been applied to recognize cognitive and affective states from features in time domain, frequency domain and time-frequency domain. According to our survey, SVM seems to be the most applied classifier for affective states recognition. However, the differences between classifiers are not obvious for cognitive studies. Some scholars tried to compare the performance of different classifiers on one or several chosen EEG features regarding a certain cognitive/affective state recognition problem and their conclusions differ from one to another (Petrantonakis & Hadjileontiadis, Reference Petrantonakis and Hadjileontiadis2010; Duan et al., Reference Duan, Zhu and Lu2013; Singh et al., Reference Singh, Singh and Sandel2014; Sharma & Gomes, Reference Sharma and Gomes2015; Bono et al., Reference Bono, Biswas, Das and Maharatna2016; Blanco et al., Reference Blanco, Johnson, Jaquess, Oh, Lo, Gentili and Hatfield2017). Therefore, there is in general no best classifier that can outperform other classifiers in recognition of any cognitive/affective state because of the limited number of features applicable to a certain cognitive/affective problem and the lack of formal representation of the recognition results which also contributes to the missing generic criteria for performance comparison among different cognitive/affective studies.
4. Experimental applications
The proposed tEEG framework for design activities has been experimentally implemented in Design Lab at Concordia University, Montreal. In this section, we will present three studies (Nguyen & Zeng, Reference Nguyen and Zeng2014b; Nguyen & Zeng, Reference Nguyen and Zeng2017a, Reference Nguyen and Zeng2017b; Nguyen et al., Reference Nguyen, Nguyen and Zeng2018) to demonstrate how tEEG framework can be applied to design research. Not only were those studies guided by the idea of tEEG framework, but they also helped improve the framework and contributed to the framework presented in this paper. The presented experimental protocols were approved by the Human Research Ethics and Compliance Department of Concordia University. Informed consent has been obtained from each participant.
4.1. Application 1
The study (Nguyen & Zeng, Reference Nguyen and Zeng2014b), published on Computer-Aided Design is presented as the first example of tEEG framework application. This study aims to investigate the relationship between designer’s mental effort (cognitive aspect) and mental stress (affective aspect). One potential application of this study lies in the development of the next generation of CAD systems where the interactions between designers and design tools should be well considered. The results show that designer’s mental effort decrease at high stress level (among the studied three stress levels), which means that ‘the workflow and interfaces of computer aided conceptual design tools should be built in a way that they do not add unnecessary mental stress’.
-
(i) Data collection from loosely controlled experiments
During the experiments, each subject was given unlimited time to solve an open-ended design problem and was free to search online. Subjects were assigned with three design problems as listed in Table 6. Those design tasks served as the input of a design process, one of which was designing a house that could fly from one place to another. In the meantime, the expected output should be a design solution to the given problem which was collected by screen recording.
Design problems used in the experiment

Eleven subjects aged 25–35 years from Concordia University participated in the experiment. EEG and heart rate variability (HRV) were recorded during the entire design process besides several recording cameras: EEG data were recorded from 14 EEG channels (Fpz, Fz, F4, F3, C4, C3, T4, T3, P4, P3, T6, T5, O2 and O1); HRV was recorded using Polar RS800G3; body movements were recorded by cameras; and sketches/writings were recorded from the tablet screen as well. To sum up, this physiological study conducted EEG-based analysis to investigate the designer’s cognitive and affective states during a complex design process.
-
(ii) Clustering-based segmentation
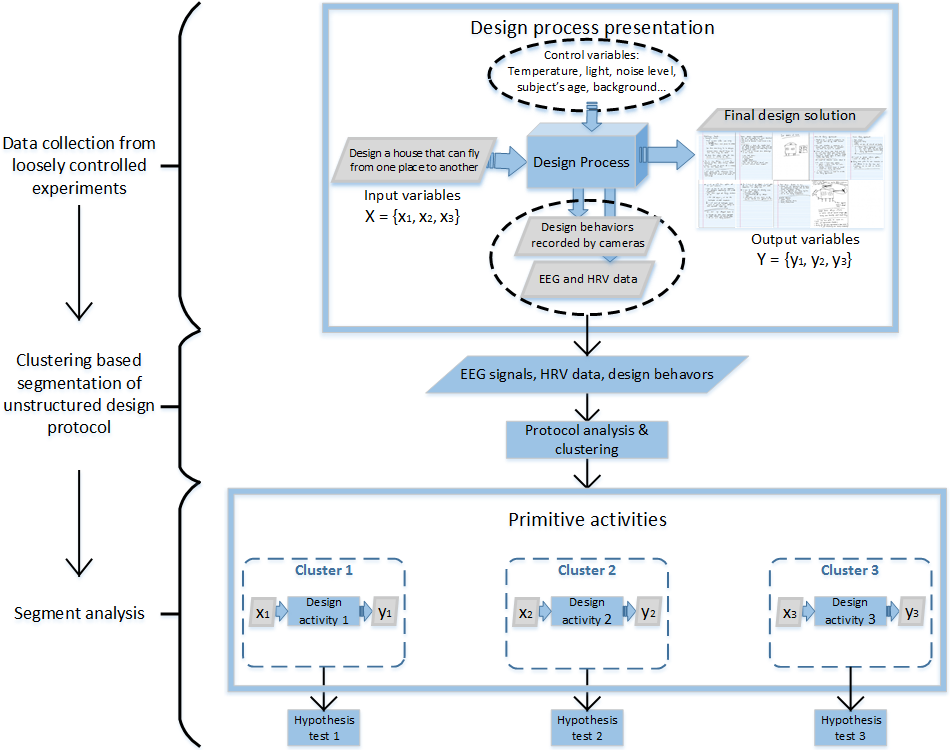
The idea of clustering-based segmentation was tested in this example and biometric data have been integrated with protocol analysis for segmentation in this case. (i) Protocol analysis was applied for segmentation based on the collected videos. The data were first segmented based on changes of the subject’s observable actions from the recorded tablet screen. Further information about the subject’s movements was then added by analysing videos recorded from different cameras so that ‘annotations can be added for each segment and small segments can be merged into larger ones’. Besides, some segments were eliminated for further analysis based on a preliminary clustering analysis on EEG data and only the data collected from seven subjects were processed due to device failure. (ii) Since direct causal stress–effort relationship could not be observed along the temporal dimension, k-means (MacQueen, Reference MacQueen1967) was applied to cluster the computed LF/HF ratios that were used to quantify mental stress. After the clustering, the experimental data were segmented into low-, medium- and high-stress segments. (iii) Finally, three primitive tasks corresponding to three hypotheses were extracted which allowed us to investigate the stress–effort relationship within each segment.
By referring to Eqs. (3) and (4), Figure 5 depicts the above-mentioned process where $ {x}_1\sim {x}_3 $
represent low stress level, medium stress level, and high stress level, respectively;
$ {x}_1\sim {x}_3 $
represent low stress level, medium stress level, and high stress level, respectively; $ {y}_1\sim {y}_3 $
represent low mental effort, high mental effort, and low mental effort, respectively. The presented three tests correspond to the following three hypotheses:
$ {y}_1\sim {y}_3 $
represent low mental effort, high mental effort, and low mental effort, respectively. The presented three tests correspond to the following three hypotheses:
-
• Hypothesis 1: Mental effort is low at low stress level.
-
• Hypothesis 2: Mental effort is high at medium stress level.
-
• Hypothesis 3: Mental effort is low at high stress level.
-
(iii) Segment analysis
Extraction of primitive tasks for flying house design problem.
The stress levels corresponding to each segment were calculated first using the LF/HF ratio of HRV, followed by a clustering of segments by classifying their stresses into three levels. Then the mental effort, which was quantified by the power spectral densities (PSD) from EEG signals, for each cluster was statistically analysed, which shows a correlation between designers’ mental effort and mental stresses in conceptual design.
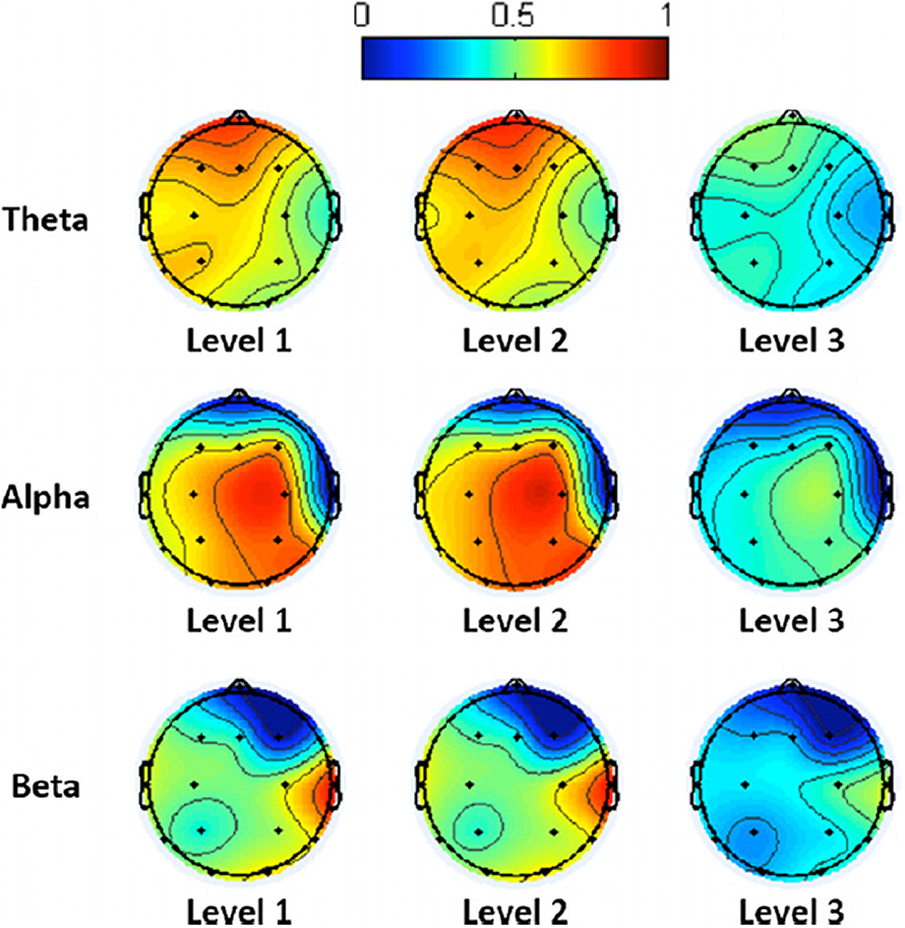
Friedman tests were conducted for each individual band at different channels and Figure 6 shows the results of alpha band analysis. Level 3 seemed to have the least energy although the results varied from one subject to another. Afterwards, the averaging results across subjects and channels were calculated as illustrated in Figure 7. As a result, it was concluded that ‘mental effort at low and medium stress levels was stronger than the mental effort at high stress level (because theta and beta energy were significantly higher at stress levels 1 and 2 than at stress level 3)’. Other findings included that beta power at P4 and F4 was greater in the second half of the design process whereas there was no significant difference for theta and alpha power in the two half parts. The observed difference in beta implied that ‘the subjects were more active and attentive in the second half of the process’. In terms of the time spent at different stress levels, it was found that designers were mostly under low and medium stress during the design process ‘because there are a large number of segments associated with low/medium stress and the time spent at stress level 3 is significantly lower than the time spent at stress level 1 and stress level 2’. Readers may refer to (Nguyen & Zeng, Reference Nguyen and Zeng2014b) for details and further information.
Alpha at channels (Fz, F3, F4, C3, C4, T3, P3, P4, T5, T6, O1 and O2) having significant differences between stress levels (Nguyen & Zeng, Reference Nguyen and Zeng2014b).

Grand average of energy per segment at theta, alpha and beta (Nguyen & Zeng, Reference Nguyen and Zeng2014b).
4.2. Application 2
The second application example is the study entitled Modal Shifts in Concentration Indicate Creativity (Nguyen & Zeng, Reference Nguyen and Zeng2017a, Reference Nguyen and Zeng2017b). The presented technique could ‘offer a complementary alternative to concurrent verbal protocol techniques’ in creativity related research. This study is based on a subset of eight datasets recorded on eight subjects aged from 25 to 35 years.
-
(i) Data collection from loosely controlled experiment
During the experiment, subjects were asked to solve six design problems of variable difficulty, ranging from trivial tasks to more complex tasks. Only one design problem was presented at a time, for which subjects were asked to sketch a solution. Once the sketch was finished, subjects were asked to rate their own workload during the problem-solving process. Afterwards, subjects were given two design solutions to evaluate for the same design problem as their sketch. Subjects were asked to rate their workload during the evaluation stage. Once the second rating is finished, another problem was presented and subjects needed to repeat the above stages (sketching, self-rating, evaluation and self-rating).
The NASA-TLX (Task Load Index) (Hart & Staveland, Reference Hart, Staveland, Hancock and Meshkati1988) was used during the self-rating stages. And the six design problems were:
-
• Problem 1: Make a birthday cake for a 5-year-old kid. How should it look like?
-
• Problem 2: Sometimes, we do not know which items should be recycled. Create a recycle bin that helps people recycle correctly.
-
• Problem 3: Create a toothbrush that incorporates toothpaste.
-
• Problem 4: In many cities, people on wheelchair cannot use the metro safely because most metros only have stairs or escalators. Elevators are not an option because they are costly. You are asked to create an efficient solution to solve this problem.
-
• Problem 5: Employees in IT companies sit too much. The company wants their employees to stay healthy and work efficiently at the same time. You are asked to create a workspace that can help employees to work and exercise at the same time.
-
• Problem 6: There are two problems with standard drinking fountains: (i) filling up water bottles is not easy and (ii) people too short cannot use the fountain and people too tall have to bend over. Create a new drinking fountain that solves these problems.
Subjects completed all the tasks at their own pace with no time limit imposed and they could have one or more than one solutions. During the experiment, subjects’ EEGs were monitored and their actions on a touchpad were recorded. As a result, the dataset consisted of the recordings on the eight subjects ranging from 30 min to 2 h. The listed six design problems correspond to the input ( $ \overrightarrow{\mathrm{x}\ } $
) in Eq. (3) and the output (
$ \overrightarrow{\mathrm{x}\ } $
) in Eq. (3) and the output ( $ \overrightarrow{\mathrm{y}\ } $
) included designer’s sketches (solutions), evaluation results and self-rating results in this case.
$ \overrightarrow{\mathrm{y}\ } $
) included designer’s sketches (solutions), evaluation results and self-rating results in this case.
-
(ii) Clustering-based segmentation
After pointing out the limitations of verbal protocol analysis, the authors integrated EEG-based analysis into the segmentation process. The PSD of beta bands (12.5–30 Hz) were computed given that concentration is associated to the beta band (Baumeister et al., Reference Baumeister, Barthel, Geiss and Weiss2008). Afterwards, the beta band power curves were clustered into five clusters since the computed ‘beta power curves are often too high frequency to analyse’ directly (Nguyen & Zeng, Reference Nguyen and Zeng2017a, Reference Nguyen and Zeng2017b). The authors then extracted time segments from the clustering results by regrouping the samples with similar beta power.
In their analysis, the identification of modal shifts in concentration was realized by finding the periods where modal shifts in the beta feature curves occurred. Modal shifts are believed to be episodes where ‘especially during creative periods of conceptual design, designers alternate rapidly in shifts of attention between different aspects of their task, or between different modes of activity’ (Cross, Reference Cross2001). Therefore, the design protocol data were segmented based on the computed beta band powers and determined that a modal shift in concentration occurred when many time segments were generated during a short time.
Figure 8 presents an example of integrating EEG (beta power) based analysis in design protocol segmentation. There are six screenshots in the figure each of which represents a short time period with the corresponding EEG-based segmentation information below. It can be noticed that the number of time segments (obtained from EEG-based segmentation) varies from one period to another and that ‘a large quantity of timestamps is generated’ at the sixth period (screenshot 6) indicating the appearance of a modal shift in concentration. In this example, modal shift occurred while the subject was erasing his/her previous design solution and started to draw a new one.
Excerpt from the design protocol data of a subject solving Problem 4. Below are timestamps generated by the segmentation algorithm (Nguyen & Zeng, Reference Nguyen and Zeng2017a, Reference Nguyen and Zeng2017b).

As a result, the authors were able to extract the available sequences where a modal shift in concentration occurred. Those sequences would be used in the segment analysis step to test the hypothesis – modal shifts in concentration are indicative of creativity.
-
(iii) Segment analysis
In order to determine whether the extracted sequences were indicative of high creativity, the authors crosschecked the physiology literature on creativity and performed source localization (LORETA) on the high concentration samples identified from the previous step. According to their literature review, there are two types of creativity, namely insight creativity (e.g., Aha! experience and gestalt) and verbalizable creativity (e.g., logic and language). Insight creativity occurs when ‘the right prefrontal lobe or the right anterior superior temporal gyrus (right upper temporal lobe) are activated’ whereas verbalizable creativity occurs when ‘the left prefrontal lobe is activated’ (Nguyen & Zeng, Reference Nguyen and Zeng2017a, Reference Nguyen and Zeng2017b). Figure 9 presents a sequence of samples followed by a summary of the activation patterns of each corresponding source localized sample (Table 7). It can be found from Table 7 that the activation regions include left and right prefrontal and frontal lobes, right temporal lobe and other regions associated with creativity.
Slices of the spherical 3D model of the brain we used at different z values (−0.79, −0.58, −0.37, −0.16, 0.05, 0.26, 0.47, 0.68, 0.89) which also corresponded to the location of the voxel slices. White denotes high density magnitudes while black denotes low density magnitudes (Nguyen & Zeng, Reference Nguyen and Zeng2017a, Reference Nguyen and Zeng2017b).

Approximate regions of the brain activated in relation to creativity (Nguyen & Zeng, Reference Nguyen and Zeng2017a, Reference Nguyen and Zeng2017b)

Furthermore, the activation patterns in the left-frontal-upper and the right-frontal-upper quadrants of human brain model were compared on the number of times the average magnitude per voxel in any of the eight quadrants of our three-dimensional (3D) model. The comparison results showed that the left-frontal-upper quadrant (which contains the left frontal and prefrontal lobes) dominated in 23.68% of the samples whereas the right-frontal-upper quadrant (which contains the right frontal and prefrontal lobes) dominated in 26.66% of the samples. The mentioned two values are so similar that it may indicate that ‘insight and intuitive solutions were at par with logical and verbalizable solutions, insight solutions can be seen to have a slight edge in the design protocol excerpt we used, emphasizing the importance of nonconscious processing’ (Nguyen & Zeng, Reference Nguyen and Zeng2017a, Reference Nguyen and Zeng2017b).
The results showed the existence of an alternation between left frontal and prefrontal activation and right frontal and prefrontal activation when modal shifts in concentration occurred. The activated regions were in agreement with the creativity related activations reported in neurology literature. Therefore, the hypothesis cannot be rejected, suggesting that modal shifts in concentration may indicate creativity.
4.3. Application 3
The third application example is a study published in 2018 (Nguyen et al., Reference Nguyen, Nguyen and Zeng2018) using EEG signals to test different hypotheses on the cognitive and quantitative aspects of design process. There is a loose connection between cognitive states and the design process as undertaken by a subject that can be interpreted from a physiological perspective using for example EEG signals. EEG signals can measure cognitive states although these cognitive states labelled as fatigue, stress or creativity may no longer retain the same semilogical content as their natural language counterparts and take a more operational and experimental meaning. At the Design Lab, experiments were undertaken to measure cognitive states using EEG signals of subjects asked to solve design tasks of varying difficulty. In this study, the following four hypotheses were tackled:
-
• Hypothesis 1: Effort (and by extension fatigue) is subject to an ice-breaking and end of task phenomena during the conceptual design process.
-
• Hypothesis 2: Fatigue and effort follow a capacity model during the conceptual design process.
-
• Hypothesis 3: Fatigue is multidimensional.
-
• Hypothesis 4: Concentration follows a modal shift model during the conceptual design process.
We will focus on the hypotheses related to fatigue (Hypothesis 1, Hypothesis 2 and Hypothesis 3) as concentration has already been discussed in Section 4.2.
-
(i) Data collection from loosely controlled experiment
The dataset used in this study is the same as the one used in the second application example. Subjects were asked to solve the six design problems listed in Section 4.2 and for each given problem they performed reading, sketching, self-rating, evaluation and another self-rating. The design protocol is presented in Figure 10 which displays the screenshots taken from a video recorded from a sketchpad while a subject was having its EEG monitored.
Screenshots of various stages in the experimental protocol: (a) read question, (b) sketch a solution, (c) rate the hardness of the question (cf. NASA-TLX), (d) evaluate the presented design solutions and (e) rate the hardness of the question.

However, the number of subjects was relatively low (i.e., eight subjects) due to the significant complexity of the analysis methods used on the dataset and the size of the resulting databases.
-
(ii) Clustering-based segmentation
The objective of the analysis of design protocols using EEG signals is to associate EEG features and patterns to the video sequences presented in the design protocol. In this study, clustering-based segmentation was applied on the computed transient microstates for analysing mental effort.
Transient microstates are short duration microstates that rapidly change to other microstates. The microstate transitions assumedly reflect the degree of mental effort during the different design tasks. First, EEG signals were assigned to a few representative clusters to form microstates and smooth microstates, respectively. Second, the transient microstate percentage was calculated within each 2.5 s epochs according to the following equation:
 $$ \mathrm{TM}\%=\frac{\mathrm{Segments}-\mathrm{Smooth}\ \mathrm{Segments}}{N}, $$
where N represents the number of samples. For example, a period of time can be either labelled by microstate sequences (1,1,1, 2, 2, 3, 2,1) that have five discontinuous segments, or labelled by smooth microstate sequences (1,1,1, 2, 2, 2, 2,1) that have three discontinuous segments. The difference between both values is a transient microstate valuation of two. Since the number of samples is eight during the period of time, the transient microstate percentage is 0.25. This number is always positive and smaller than 1. Third, the transient microstate percentage was submitted to a clustering method to form four clusters corresponding to low, medium, high and very high effort segments (Figure 11). This kind of approach provides a possibility to segment complex design activities into a set of primitive design activities.
-
(iii) Segment analysis
Transient microstate percentage curve clustered into four clusters. Clustering the feature curve allows a reduction in the number of valid segments (Nguyen et al., Reference Nguyen, Nguyen and Zeng2018).

Different hypotheses were tested against different EEG metrics. Each hypothesis had background in the research literature from works such as (Arai, Reference Arai1912; Kurzban et al., Reference Kurzban, Duckworth, Kable and Myers2013) on prolonged and sustained effort, (Kahneman, Reference Kahneman1973) on the capacity theory of mental states, (DeLuca, Reference DeLuca2005) and (Hockey & Hockey, Reference Hockey and Hockey2013) on the polysemic nature of the fatigue concept or (Cross, Reference Cross2001) on the modal shift theory of creativity. Mental effort was measured using transient microstates of EEG signals (Nguyen & Zeng, Reference Nguyen and Zeng2014b) and concentration was as well measured using frequency domain features of EEG signals (Nguyen & Zeng, Reference Nguyen and Zeng2017a, Reference Nguyen and Zeng2017b). Fatigue was also measured using frequency domain features of EEG signals. The following discussion will only cover the quantification of fatigue.
There exist different types of fatigue (mental, drowsiness, and physical) and a few frequency domain features of EEG signals are commonly used for fatigue quantification (Baumeister et al., Reference Baumeister, Barthel, Geiss and Weiss2008; Jap et al., Reference Jap, Lal, Fischer and Bekiaris2009) based on the authors’ research. Thereafter, the fatigue quantified from different EEG features was labelled as TYPE-1, TYPE-2, TYPE-3, TYPE-4 and TYPE-5 to distinguish them (Table 8).
EEG frequency domain features and fatigue labels

Figure 12 depicts the feature curve of TYPE-2 fatigue where high peaks could be found at the beginning and the end of the process. In the meantime, the authors displayed the effort feature curve as well where low peaks were found both at the beginning and the end of the process. The peaks found at the beginning ‘leans towards the existence of an ice-breaking phenomenon’, whereas the peaks found as the end can be understood as a result of continuous work. From this viewpoint, the first hypothesis stating that effort and fatigue are subjective to and ice-breaking and end of task phenomena (Hypothesis 1) cannot be rejected.
Evolution of fatigue feature curves for TYPE-2 fatigue. On the x-axis is theme and on the y-axis is the power spectral density. Each session las lasted up to 2 h and contained seven problems to solve and three tasks per problem (sketching problem, multiple choice problem and subjective rating) for a total of 168 tasks. An average U-shape can be trended. Although problems were easy at the beginning, fatigue was high (Nguyen et al., Reference Nguyen, Nguyen and Zeng2018).

Thereafter, the correlation between different fatigue feature curves was computed. The results showed that ‘other than TYPE-1 and TYPE-2 fatigue scores, there was no general pattern for positive correlation between different fatigue metrics’. From this point of view, the hypothesis stating that fatigue is multidimensional (Hypothesis 3) cannot be rejected. Besides, the authors found that effort and some measures of fatigue were negatively related. The trended feature curves (red curves) in Figure 12 showed a noticeable negative correlation with the trended effort curves. The computed average value of the negative correlation was −0.847 for TYPE-2 fatigue and effort and −0.816 for TYPE-1 fatigue and effort. This ‘confirms the existence of a capacity model for effort and fatigue (Kahneman, Reference Kahneman1973)’ so that the hypothesis stating that fatigue and effort follow a capacity model cannot be rejected (Hypothesis 2).
5. Conclusion and future work
This paper intends to guide scholars’ research on EEG-based cognitive and affective studies in the context of design through proposing a tEEG framework. A theoretical analysis of design process is conducted in the first place to show that it is necessary and promising to look into designers’ cognitive and affective states for further investigation of the design process. Afterwards, we summarize several difficulties with EEG-based design studies through reviewing and analysing current EEG applications in design research. Therefore, tEEG framework is proposed to address the identified difficulties, which is derived from a series of analysis.
The proposed tEEG framework consists of three parts including data collection from loosely controlled experiments, clustering-based segmentation and EEG-based segment analysis. Those three parts are discussed one by one, for which related algorithms and techniques are summarized from the existing literature spread in a wide spectrum of fields and resources. Loosely controlled experiments are proposed to investigate the uncontrollable parts and complex relationships within a design process. Afterwards, clustering-based segmentation is proposed to find structured subdatasets from the unstructured dataset collected during loosely controlled experiments. As a result, a complex design process is segmented into different primitive activities that can be studied using traditional hypothesis tests. Finally, during segment analysis step the extracted segments are analysed one by one which can be seen as several hypothesis tests. In the meantime, tEEG framework makes existing EEG techniques and analysis methods applicable for EEG-based design studies. The information presented in Tables 3–5 could assist scholars in choosing appropriate EEG features and segmentation techniques when they apply tEEG framework to design research.
We will continue to improve and validate the proposed tEEG framework in our future work. Guided by the tEEG framework, a recent research analyses the EEG microstates while designers are conducting three modes of thinking: idea generation, idea evolution, and evaluation under a loosely controlled experiment. An ongoing research investigates the long-range temporal correlations of EEG microstate sequences extracted from three different design activities: problem understanding, idea generation and idea evaluation. Similar to the three experimental applications presented in Section 4, the mentioned future research will not only contribute to the validation of tEEG framework but also provide valuable feedback for further improvement of the framework.
Acknowledgements
This reported research is supported by NSERC CRD project (CRDPJ 514052-17), NSERC Discovery Grant (RGPIN-2019-07048) and NSERC Design Chairs Program (CDEPJ 485989-14).


 Open access