

INTRODUCTION
The long-term evolution of glacier velocities, which control the delivery of ice to warm, low elevation regions, is an important component of the future stability of ice masses in a warming climate. For a glacier in steady state, mass transfer through a cross section will equal the cumulative mass-balance conditions upstream. The transition to increasingly negative mass-balance conditions will reduce mass flux and, therefore, ice velocity. The mechanism for this deceleration can be linked to reduced ice deformation rates according to Glen's flow law (Glen, Reference Glen1955) as a result of thinning. Evidence of glacier deceleration in response to persistent negative mass-balance conditions has been shown for several land-terminating glaciers across the planet (Heid and Kääb, Reference Heid and Kääb2012; Schaffer and others, Reference Schaffer, Copland and Zdanowicz2017; Thomson and others, Reference Thomson, Zemp, Copland, Cogley and Ecclestone2017), and in occasional cases glacier acceleration has been observed when positive mass-balance conditions increase ice thickness (Nolan and others, Reference Nolan, Motkya, Echelmeyer and Trabant1995; Anderson and others, Reference Anderson2014). However, there is limited knowledge about changes to the nature of peak velocity events, defined here as speed-up events occurring over the period of days to weeks during the summer melt season. As the only glacier in the Canadian Arctic with high-temporal-resolution measurements of velocities dating back to the 1960s (Iken, Reference Iken1974), White Glacier provides a unique opportunity to assess multi-decadal changes to peak velocity events.
White Glacier was the focus of numerous glaciological studies based out of the McGill Arctic Research Station in the Expedition Fiord region of Axel Heiberg Island during the 1960s and 1970s (Müller, Reference Müller1963; Adams, Reference Adams2007). Observations of annual and seasonal glacier velocities were initiated in 1960 (Müller and Iken, Reference Müller and Iken1973) and continued at temporal resolutions spanning from 3 h to 10 days by Almut Iken during the summers of 1968–71 (Iken, Reference Iken1974). Earlier observations of ice velocities for high-Arctic glaciers showed evidence of a correlation between ablation and ice motion (Battle, Reference Battle1951; Friese-Greene and Pert, Reference Friese-Greene and Pert1965), which motivated higher frequency observations of ice motion at White Glacier in combination with measurements of surface melt and water pressure in moulins (Iken, Reference Iken1974). These observations indicated that, although White Glacier is a mostly-cold polythermal glacier, a temperate-ice zone at the glacier bed enabled sliding to occur in response to increased basal water pressure (Iken, Reference Iken1974). Contemporary observations at other high-latitude glaciers indicate that peak velocity events are closely linked to the input of surface meltwater, the structure of the subglacial hydrological system efficiency at which water leaves the subglacial system (Bartholomaus and others, Reference Bartholomaus, Anderson and Anderson2008; Cuffey and Paterson, Reference Cuffey and Paterson2010; Sundal and others, Reference Sundal2011). Furthermore, these processes appear to be effective not only in temperate glaciers, but also in mostly-cold polythermal glaciers (Bingham and others, Reference Bingham, Nienow and Sharp2003, Reference Bingham, Nienow, Sharp and Copland2006; Copland and others, Reference Copland, Sharp and Nienow2003; Hambrey and others, Reference Hambrey2005).
A recent assessment of annual and seasonal ice motion at White Glacier through comparison of temporally-coarse observations conducted between 1960–70 (Müller and Iken, Reference Müller and Iken1973) and 2012–16 (Thomson and Copland, Reference Thomson and Copland2017) suggests an increase in the contribution of summer displacement to annual displacement over the past half-century. This study aims to determine the role of peak velocity events in annual motion via the comparison of high-resolution velocity measurements available for 1968 (Iken, Reference Iken1974) and dual-frequency GPS data from 2013 to 2015. Specifically, we quantify changes to the magnitude and duration of peak velocity events at White Glacier and discuss the potential processes responsible for the increased contribution of these events to the annual motion.
Comparing velocity data between specific years must be conducted with consideration for the potential impacts of intraannual variability in meteorological conditions. In addition, while sub-daily GPS position measurements were collected for 2013–15, velocities for 1968 were calculated from observations collected over periods of 1–10 days. To address intraannual variability, an initial experiment in temporal down-sampling of the GPS data are presented in the Data re-sampling section using data from 1968 and 2014, for which the summer climate conditions are most similar (Table 1, Fig. 2). Thereafter, GPS-derived velocities from 2013 to 2015 down-sampled to a 5-day window are used for comparison with peak velocity events in 1968.
Comparison of Eureka temperatures in 1968 and the years of recent White Glacier observations (2013–15)

The duration of the summer period, s t, is defined as the number of days for which the 5-day running mean >0°C (Müller and Iken, Reference Müller and Iken1973). Positive degree days, PDD, refer to the cumulative of daily mean temperatures for all days >0°C. Mean dT and max dT provide the average and maximum of the residual between daily mean temperatures in 1968 and 2014 during summer conditions.
SITE DESCRIPTION
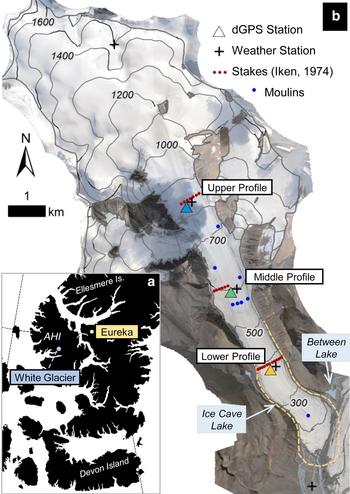
White Glacier (79.45°N, 90.67°W) is a 14 km long alpine glacier extending from 80 to 1782 m a.s.l. in the Expedition Fiord region of Axel Heiberg Island, Nunavut. The mean annual temperature of the region is ~−20°C and mean precipitation at the highest elevations is ~370 mm a−1, based upon a 41-year snow pit record of annual accumulation on Müller Ice Cap (Cogley and others, Reference Cogley, Adams, Ecclestone, Jung-Rothenhäusler and Ommanney1996). Since the onset of mass-balance observations in 1960, the mean decadal ELA has risen from 1000 m a.s.l. during the 1960s to 1270 m a.s.l. between 2006 and 2015, and the mean decadal accumulation area ratio has decreased from 0.61 to 0.32 over the same timeframe (Thomson and others, Reference Thomson, Zemp, Copland, Cogley and Ecclestone2017). White Glacier is one of 37 official reference glaciers within the Global Terrestrial Network for Glaciers through the United Nations Framework Convention on Climate Change, managed in part by the World Glacier Monitoring Service where the mass-balance measurements are submitted annually (WGMS, 2015). Englacial temperature measurements conducted between 1974 and 1981 in boreholes drilled to the glacier bed revealed a mostly-cold polythermal structure (<10°C for the majority of ice volume), where temperatures only approach pressure melting point at a 6.4 km long and 0.5 km wide portion of the glacier bed in the lower ablation area (Blatter, Reference Blatter1987).
Summer velocity observations in 1968 were made at three cross-sectional profiles: Moraine (870 m a.s.l.), Wind (580 m a.s.l.), and Anniversary (370 m a.s.l.) profile and a fourth site the Lower Ice Station (210 m a.s.l.), all of which are located in the ablation area (Fig. 1). This study focuses on Moraine, Wind and Anniversary profiles, which are hereafter referred to as the upper, middle and lower profiles, respectively. Throughout the 1960s, mean annual surface velocities (v a) along the glacier centreline at the upper, middle and lower stations were 10.2, 10.5 and 8.81 cm d−1, respectively (Müller and Iken, Reference Müller and Iken1973). Repeat observations of annual surface velocities over the period 2012–16 by Thomson and Copland (Reference Thomson and Copland2017) found no statistically significant change in velocity at the upper station, while surface velocities decreased at the middle station by 31% (10.53–7.31 cm d−1) and at the lower station by 38% (8.81–5.41 cm d−1). In accordance with Iken (Reference Iken1974), mean summer velocities (v s) were calculated from the displacement over the temperature-defined summer period (s t), defined as the span of time in which the 5-day mean temperature is above 0°C. Similar to v a, v s decreased at the middle and lower stations by 12 and 35%, respectively, while a 12% increase in summer motion was observed at the upper station. Comparison of topographic maps from 1960 (Haumann and Honegger, Reference Haumann and Honegger1964) and 2014 (Thomson and Copland, Reference Thomson and Copland2016) indicate ice thinning of 23 m, 19.5 m and 19 m at the upper, middle and lower profiles, respectively. Mean ablation over the past 10 years (2005–15) is higher than annual ablation in the 1960s by 287% (increasing from 305 mm w.e. to 876 mm w.e.) at the upper profile, 169% (863 mm w.e. to 1455 mm w.e.) at the middle profile and 143% (1286 mm w.e. to 1843 mm w.e.) at the lower profile. The marked increase in ablation at the upper station, relative to the middle and lower stations, could be due to shading from steep valley walls at lower elevations, and potentially to the strong temperature inversions that occur at high elevations on White Glacier through fall, winter and spring.
(a) Location of White Glacier on Axel Heiberg Island (AHI), and the Eureka weather station on Ellesmere Island. (b) Orthoimage of White Glacier (Thomson and Copland, Reference Thomson and Copland2016) indicating the cross-profiles where surface velocities were observed during the 1960s and 2013–15, and the location of moulins known to be seasonally active in both 1968 and since 2013. The colours of the dual-frequency GPS station triangles correlate with colours of the velocity plots in Figures 3, 4.
METHODS
Velocity observations
In 1968 surface velocities were calculated from repeat measurements of glacier stake positions (see Fig. 1 for stake locations) using a Wild T-2 theodolite and survey baselines first established in 1960 along the glacier margins (Iken, Reference Iken1974). Field surveys were initiated on 30 April 1968, with the intention of conducting observations at all stations as simultaneously as field conditions would allow. Early in the 1968 field season, however, it became apparent that velocity fluctuations at the lower profile were particularly evident. Consequently, the sampling frequency was adjusted to 2–3 days at the lower profile, while the upper and middle profiles were surveyed following every second set of observations at the lower profile. Stake velocities were derived from both angular velocities collected by theodolite measurements at survey locations along the ice margin, which provide the displacement magnitude but not direction, and from stake positions on successive dates that provide both magnitude and direction (Iken, Reference Iken1974). Measurement errors are not noted explicitly in Iken (Reference Iken1974), but Thomson and Copland (Reference Thomson and Copland2017) calculated the discrepancy between the two methods of velocity calculation to be ~0.2 cm d−1.
Contemporary velocity observations are based on position data from three Trimble R7 dual-frequency GPS units that were installed at the middle profile in April 2012, at the upper profile in April 2013 and at the lower profile in July 2013. The units were powered by 12 V batteries that are charged in the summer months by a solar panel mounted on a 4.5 m steel pole drilled ~ 3.5 m into the ice each spring field season (mid-April to mid-May). With the exception of 1 h daily positions collected at the middle profile during 2012, all stations were programmed to collect position data every 15 s continuously through the year. Due to loss of solar power, once polar night begins, observations generally stop in mid-fall and are manually restarted in April when the stations are downloaded and re-installed. Post-processing of the GPS data are described in detail in Thomson and Copland (Reference Thomson and Copland2017) and is based on the Precise Point Positioning (PPP) tool provided by Natural Resources Canada (http://webapp.geod.nrcan.gc.ca /geod/tools-outils/ppp.php), which provides 3-D (Easting, Northing, Elevation) accuracies of ~±2 cm for an observation period of 1 h. The calculation of daily velocity from GPS position measurements mimics the approach of Bartholomaus and others (Reference Bartholomaus, Anderson and Anderson2008), in which easting and northing data are subject to coordinate rotation, enabling the down-glacier component of ice displacement to be assessed. Daily velocities are derived from the slope of a linear fit through the GPS observations spanning 1 day, centred on noon local time. The mean R 2 of the linear fit for which the velocity calculations were based is 0.84 and >50% of R 2 values exceed 0.9. The mean RMSE of the polynomial fit data are 0.013 m d−1, which is used as an approximation of the error for the contemporary velocity calculations. For comparison with 1968 data in which velocities are derived from repeat stake measurements spanning multiple days (Iken, Reference Iken1974), the displacement between daily mean coordinate positions is used, as described in the Data re-sampling section.
Meteorological data
While weather observations were an important component to many studies at White Glacier during the 1960s and 1970s, temperature records spanning the 1968 observations are only available intermittently for the lower profile. It is, therefore, necessary to consider climate data from the Environment Canada Eureka weather station ~100 km east of White Glacier as a proxy (location in Fig. 1). Contemporary temperature data for White Glacier are available from three shielded Onset® HOBO U23 Pro v2 Temperature/Relative Humidity data loggers mounted on poles 1–3 m above the ice at the three profiles, although it should be noted that temperatures are not available for the upper and lower stations from 9 July 2014 to 20 April 2015 due to battery failures at both stations. However, continuous temperature data are available for the middle profile and from two off-ice automatic weather stations located on a nunatak in the accumulation area (1511 m a.s.l.) and on the glacier end moraine (35 m a.s.l.). Together, the temperature data from these stations are used to model temperatures where data gaps exist using known station elevations and the daily mean temperature-lapse rates. Comparison between temperatures at Eureka and: (1) the lower profile in 1968 and (2) the lower profile and on the glacier end moraine in 2014, demonstrate that Eureka provides a reasonable proxy for climate conditions in the Expedition Fiord region during summer months (Fig. 2). Differencing temperature data from Eureka and the lower profile on White Glacier during days with positive temperatures, results in a mean residual of 0.5°C in 1968 and −0.1°C in 2014. In the following analysis, velocity data from 2014 is compared with 1968 data because this is the year most similar to the 1968 summer conditions, both in terms of s t and the magnitude of positive degree days (Table 1).
Comparison of 1968 and 2014 daily (dotted) and 5-day mean (solid) surface air temperatures recorded at Eureka weather station, at the lower profile, and on the glacier end moraine (WG Terminus).

Ablation
Ablation measurements available from the 55-year mass-balance record provide the cumulative annual melt at each of the three cross-profiles from 1960 to 2015. In 1968 the progression and variability of ablation through the summer period was monitored at intervals of 4–22 days at the upper and middle profiles and 1–9 days at the lower profile. Since 2012, ultrasonic depth sounder measurements of ablation have been logged at the middle station, which provides a measure of melt variability and amount through the summer months in conjunction with recorded surface air temperatures.
RESULTS
Observed summer velocities and climate conditions: 1968
Records from Iken (Reference Iken1974) of velocity fluctuations observed at the upper, middle and lower profiles in 1968, mean ablation at a series of stakes at each profile and the formation and drainage of an ice-marginal lake (Ice cave Lake) are illustrated in Figure 3 and summarized with contemporary velocity observations in Table 2. As described in Iken (Reference Iken1974), the onset of melt conditions in 1968 began in early May and was followed by a mid-May storm that left the glacier snow-covered until 31 May when significant melt started and marginal streams were observed as high as the middle profile. During mid-May (~11–23) surface velocities were at their minimum, ~90–95% of the measured winter velocity. A period of cool weather extended from 6–11 June followed by strong winds. On 11 June, velocities at the lower profile underwent a rapid increase and exceeded mid-May velocities by 45% from 15 to 18 June and 55% from 18 to 21 June. At the middle and upper profiles, zero to minimal increases in velocity was observed from late-May to mid-June. Light snowfall during 18–19 June limited further ablation and cool temperatures persisted until 27 June.
(a) Climate data from Eureka weather station, summer of 1968. Velocity data based on Iken (Reference Iken1974) for the (b) upper, (c) middle and (d) lower profiles is plotted along the left-hand y-axis and the cumulative melt (in cm) observed at each profile is plotted on the right. The light-blue region in (d) indicates the period of time spanning the formation and drainage of an ice-marginal lake 1 km down-glacier of lower profile.

Summary of mean and maximum summer velocities, both absolute and relative to annual velocities, over the duration of the temperature-defined summer period for 1968 and 2013–15 where: s t = the summer period defined by the span of 5-day mean temperatures >0°C, a = ablation based on the interpolated ablation at the profile elevation using the mass balance gradient, v a = annual surface velocity (as reported in Müller and Iken (Reference Müller and Iken1973) and Thomson and Copland (Reference Thomson and Copland2017)), v s = average summer velocity calculated from the total displacement (d s) over the summer period (s t), (v s − v a)/v a = per cent increase of average summer velocity over annual velocity, d s/d a = contribution of summer displacement to total annual displacement (d a), v peak = peak summer velocity observed (from 5-day down-sampled set), and (v peak − v mw )/v mw = percent increase of peak velocity over minimum velocity of previous winter (v mw )

* Calculated using mean of 2014 and 2015 v a values.
† Calculated using 2014 v a value.
On 30 June high elevation supraglacial streams were established and peak temperatures occurred during 8–10 July, which led to high ablation rates and a peak in velocities at the lower profile of 25.6 cm d−1, close to 200% above the spring velocity minimum (Fig. 3). The majority of supraglacial streams end in moulins, and turbid water was observed leaving the glacier through marginal streams near Ice cave Lake and Between Lake (see Fig. 1). Maximum velocities at the middle profile of 13.8 cm d−1 occurred from 15 to 19 July ~1 week after the lower profile peak and at the upper profile peak velocities (13.9 cm d−1) lagged only 1 day behind the middle profile, with peak velocities from 16 to 20 July. Ice cave Lake, a marginal lake associated with an ice cave 700 m downstream of the lower profile, was observed to form from 30 May to 4 June, after which lake levels dropped at an increasing rate until it was fully drained on 21 June. Studies by Maag (Reference Maag1969) indicate that the maximum volume of water in the lake was ~19 000 m3, and that the subglacial channels that drain the lake exit the western glacier margin ~400 m downstream of the ice cave.
Observed summer velocities and climate conditions: 2013–15
Daily GPS-derived summer velocities and corresponding temperatures observed at the middle profile are presented in Figure 4. The variability in summer conditions over the period 2013–15 offers an interesting opportunity to observe the influence of melt on summer velocity events. At White Glacier, 2012 was the second most-negative mass-balance year on record (−961 mm w.e.), 2015 the 6th most negative year (−693 mm w.e.) and 2014 the 14th most negative year (−407 mm w.e.). In contrast, 2013 had the most positive mass balance recorded since 1988 (+57 mm w.e.). For comparison, the 1968 mass balance was −386 mm w.e. while the 1960s decadal mean balance was −108 mm w.e.
(a) Climate data an automatic weather station at the middle profile for the summer of 2013–15. Velocity data derived from daily dual-frequency GPS position measurements are plotted along the left-hand y-axis for all profiles in (b) 2013, (c) 2014 and (d) 2015. The cumulative melt (in cm) recorded at a sonic depth sounder at the middle profile is plotted in red on the right-hand axis. The light-blue region in (c) indicates the period of time spanning the formation and drainage of an ice-marginal lake 1 km down-glacier of lower profile. Power issues led to the failure of the middle profile GPS in 2014, explaining the absence of 2014 data from middle profile.

The cool summer temperatures in 2013 are evident in the low ablation levels recorded by the ultrasonic depth sounder at the middle profile and the correspondingly late onset of summer speed-up events in that year (Fig. 4). Compared with 2014/15, peak velocity events were of shorter duration in 2013, as indicated by the rapid (<2 days) return to velocities observed prior to the melt period, yet they resulted in the highest daily velocities observed at the three stations over the 2013–15 record (upper: 22.3 cm d−1, middle: 32.57 cm d−1, lower: 29.4 cm d−1). Warmer conditions in 2014 and 2015 resulted in higher melt and the earlier onset of glacier speed-up in comparison with 2013, and in both 2014 and 2015 ice velocities did not exceed 25 cm d−1. Increases in summer velocity occur earlier in 2015 than 2014, likely in concert with the earlier onset of melt conditions in 2015. Peak velocity events appear to be longer in duration in 2014 and 2015 compared with 2013, with velocities gradually dropping near to early-May velocities over the course of several days. This is particularly true in 2015, possibly as a response to high-melt conditions in comparison with 2014. The formation (7 June–25 June) and rapid drainage (26 June) at the ice-marginal Ice Lake was recorded in 2014 using time-lapse photographs. Camera failure inhibited lake observations in 2015, but in 2016 lake formation and drainage was observed once again, suggesting that this continues to be an annual hydrological event at White Glacier.
Data re-sampling
To ensure an accurate comparison between the Iken (Reference Iken1974) dataset (with multi-day temporal resolution) and contemporary velocity observations (with sub-daily resolution), temporal down-sampling of the GPS data are required. Daily to multi-day velocities were calculated by differencing the 24-h mean position between two dates, centred on local noon. Figure 5 illustrates the result of this post-processing on the duration and amplitude of peak velocity events in 1968 and 2014 when summer climate conditions were most similar (Fig. 2). Contemporary velocities calculated over a 5-day period best-preserved peak velocity events while allowing for sampling times comparable with Iken (Reference Iken1974). Hereafter, the Iken (Reference Iken1974) data are therefore only compared with down-sampled GPS velocities calculated over 5-day intervals.
Results of resampling dual-frequency GPS data at a range of temporal resolutions to allow for balanced comparison between contemporary and previous observations (Iken, Reference Iken1974) at (a) the upper profile and (b) the lower profile.

ANALYSIS AND DISCUSSION
Onset and duration of summer temperatures and velocities
Müller and Iken (Reference Müller and Iken1973) define the summer period as those days for which the 5-day mean temperature exceeds 0°C (s t). It is also possible to define the summer period by the span of time for which the glacier exceeds a given background velocity (e.g. Sundal and others, Reference Sundal2011), and in this study references to ‘background velocity’ are taken as the minimum observed velocity of the winter season (v mw ) preceding a given s t. Here, s v indicates the span of days that glacier speeds are >10% above the background velocity. Values of s t and s v are presented in Table 3, as well as the start and end date based on climate (for s t) and velocity (for s v). Comparing the starting dates of the two methods it is evident that in all cases the onset of summer velocities, defined as being >10% of the minimum winter velocity, always follows the onset of s t. The situation is more variable for the end of the summer; in some years surface velocities decrease before the end of s t, whereas for other years high-velocities persist beyond s t. It is likely that this variability is associated with the ability of the subglacial hydrological system to either: (1) maintain a distributed system that supports high basal water pressures, or (2) efficiently route water from the glacier bed.
Onset and duration of summer conditions defined by the span of temperatures for which the 5-day mean >0°C (s t, where s t1 and s t2 are the bounding dates), and the period of time between dates s v1 and s v2 for which velocities are >10% above the minimum observed winter velocity

‘*’ indicates dates estimated from plotted climate data in Iken (Reference Iken1974) and ‘–’ indicate data that were not available.
There is evidence that in 2013, when temperatures and melt were the lowest observed, limited water input into the system resulted in an inefficient subglacial drainage system that allowed high basal water pressures and peak velocities to persist 9 days after the end of the melt period at the upper station, for 44 days at the middle station and for 9 days at the lower station (Fig. 4). For 2014 and 2015 in which temperatures and melt were greater, peak velocities were halted before the end of the melt season, potentially due to an efficient subglacial hydrological system that would have allowed low subglacial water pressures (Fig. 4). However, this was not observed at the lower station where high-velocities persisted 14 days after the end of the melt period in 2014 and 19 days in 2015. The potential cause for this discrepancy is uncertain but may be related to the thinner ice (~200 m in 2014) and therefore lower overburden pressure at the lower profile, allowing the region to be more readily pressurized by volumes of water that would be unable to pressurize the system under thicker ice up-glacier.
Contribution of total summer motion to annual displacement and flux
Previous analysis by Iken (Reference Iken1974) for the upper and lower profiles, and by Thomson and Copland (Reference Thomson and Copland2017) for all three profiles, reported the average per cent increase of summer velocities over the mean of the preceding and following winter velocities. Here the per cent increase of summer velocity over annual velocity ((v s − v a)/v a × 100) and the per cent contribution of summer motion to total annual displacement (d s/d a × 100) is considered (Table 2) using the velocities (v s) and displacements (d s) over the entirety of the temperature-defined summer period (s t). Mean summer velocities (v s) have increased at the upper profile by 1.6 cm d−1 on average since 1968, and decreased by 3.3 cm d−1 at the lower profile (Table 2). However, at both the upper and lower profiles v s becomes proportionately greater with respect to the mean annual velocity (v a). At the lower profile, this is in large part related to the long-term slowdown of v a since the 1960s and the resultant increase in the relative magnitude of v s. For the warm, high melt years of 2014 and 2015, this relative increase in v s has resulted in the marked increase in the contribution of d s to the total annual displacement (d a) (Table 2). For example, at the upper profile in 1968 d s was responsible for 15% of d a, whereas in 2014 and 2015 this per cent contribution increased to 22 and 30%, respectively. Similarly, at the lower profile in 1968 d s explained 32% of d a, whereas in 2014 and 2015 its contribution increased to 47% and 50% of d a, respectively. In the cool summer of 2013, in contrast, there was a slight decrease in the per cent contribution of d s to d a from 15 to 13% at the upper profile (Table 1). In all cases, longer summer periods (s t) were found to correspond with increases in the per cent contribution of d s to d a (Table 2), suggesting that the duration of the melt period is an important control on summer velocities and net summer displacement at White Glacier.
If the average annual velocities from 2013 to 2015 offer a general indication of contemporary mass flux rates into the main glacier trunk it can estimated, based on annual flux calculations in Thomson and Copland (Reference Thomson and Copland2017), that summer motion is currently responsible for delivering 2.6 Mt of ice through the middle profile and 2.0 Mt of ice through the lower profile each year. At the upper profile, the only site where the mean summer velocities have increased in absolute values (by 12%, Thomson and Copland, Reference Thomson and Copland2017), this has resulted in an increased total annual flux through the upper profile from 1.46 Mt a−1 on average during the 1960s, to 1.99 Mt a−1 at present (2012–16). Considering that the ELA has risen 270 m above the upper profile since the 1960s, coincident with a reduction in mass in the accumulation area, this increase in mass flux at higher elevations is particularly unsustainable and will in effect act to dynamically drain the accumulation area if this velocity pattern continues into the future.
Magnitude and duration of peak velocity events
The inferred magnitude of peak velocity events (occurring over s t) is sensitive to the temporal interval at which ice velocities are calculated, with larger time steps having a dampening effect on peak amplitudes. For homologous comparison of peak velocity events, the following section therefore only considers the 5-day down-sampled subset of the 2013–15 velocities introduced in the Data re-sampling section for comparison with the velocity records from Iken (Reference Iken1974).
The comparison of these 1968 and 2013–15 velocities at the upper, middle and lower profiles in Figure 6 illustrates two distinct spatial patterns in changes to the magnitude of peak velocities. At the upper and middle profiles, peak velocities have increased in magnitude by ~5 cm d−1 in comparison with those observed during 1968. In contrast, at the lower profile peak velocities have decreased by ~10 cm d−1. While the lower profile exhibited the highest peak velocities during the 1960s (Müller, Reference Müller1963; Iken, Reference Iken1974), reaching 25.6 cm d−1 in 1968, peak events in recent years do not exceed 20 cm d−1. The location exhibiting the highest peak velocities has now shifted from the lower to the middle profile, which reached 19.1 cm d−1 in 2013. Approximately 5 cm d−1 of the decrease in peak velocities at the lower station can be explained by the overall reduction in background velocities as a result of ice thinning and declining deformation rates over the past half-century (Thomson and Copland, Reference Thomson and Copland2017). To understand how peak velocities have changed relative to their background velocities, the historic and contemporary records of summer velocities have been normalized to v mw , the minimum velocity observed in their previous winter. Comparison of the relative magnitude of peak velocities indicates that peak velocities have increased from 32 to >80% over v mw at the upper profile, 53 to >160% over v mw at the middle profile and 200 to >245% over v mw at the lower profile (Fig. 7).
Summer velocities observed between 1968 and 2013–15 at the (a) upper, (b) middle and (c) lower profiles. The 2013–15 data are down-sampled to 5-day intervals, which was the approximate temporal spacing of the 1968 observations. Power issues led to the failure of the middle profile GPS in 2014, explaining the absence of 2014 data from middle profile.

Summer velocities normalized to the minimum velocity of the previous winter (v mw ) between 1968 and 2013–15 at the (a) upper, (b) middle and (c) lower profiles. The 2013–15 data are down-sampled to 5-day intervals, the approximate temporal spacing of the 1968 observations. Power issues led to the failure of the middle profile GPS in 2014, explaining the absence of 2014 data from middle profile.

The down-sampled velocity records dampen the magnitude of individual peak velocity events, thus inhibiting meaningful comparison between maximum velocities between 1968 and contemporary records. In 1968, the upper and middle profiles are characterized by a single peak that rises rapidly early in the summer period and gradually declines through the rest of the summer (Fig. 6). However, the temporal sampling at these stations also decreased to periods of >10 days towards the end of summer 1968, possibly leading to low magnitude peak events being missed. From 2013 to 2015 the upper and middle profiles exhibit anywhere from one to three annual peaks, but again this is highly sensitive to the temporal sampling. Rather than attempting to comment on the frequency of individual peak events, the total duration of time (i.e. total number of days) for which velocities exceed a given velocity threshold is instead considered. In a study of velocity fluctuations in a region of southwest Greenland, Sundal and others (Reference Sundal2011) categorize ice speeds >100% above the winter velocity as peak events. For comparison, in 1968 only the lower profile at White Glacier exhibited speed-up events >100% above the minimum winter velocity (v mw ), while velocities at the middle station narrowly exceeded 50% above the winter velocity and the upper station did not exceed 40% (Fig. 7). Comparison of summer velocities and v mw in recent years, however, shows significant increases in the relative magnitude of summer speed-up events. To determine the total duration and contribution of peak velocity events to annual displacement, a series of threshold experiments were conducted in which peak events were defined as those events exceeding 25, 50, 100 and 200% above v mw . Here, total duration is defined as the number of days in which velocities exceeded a given threshold.
The total duration of peak events >25% v mw has increased at all stations since 1968, with the one exception being the lower profile in 2013 (Table 4). With increasing % v mw thresholds, a spatial pattern emerges where the higher relative magnitude events occur more often at lower elevations:
-
• >25% v mw events occur at all profiles in all years (1968 and 2013–15)
-
• >50% v mw events occur at all profiles between 2013 and 2015
-
• >100% v mw events occur at the lower profile in all years including 1968, but only at the middle profile in recent years (2013–15)
-
• >200% v mw events occur only at the lower profile in 2013–15
Number of days on which summer velocities exceed a given percentage (25, 50, 100, or 200%) of the mean annual velocity (v a), and the corresponding percentage that displacement during those dates (d peak ) has contributed to total annual displacement (d a)

For 2013–2015, # days are multiples of 5 as a result of the temporal resampling post-processing.
Peak events at any given threshold also, in general, have a greater total duration in 2013–15 compared with 1968. This analysis indicates that despite the greatest decrease in annual velocities since the 1960s, the lower profile continues to exhibit the longest duration and highest relative magnitude (Fig. 7) of peak velocity events since the observations of Iken (Reference Iken1974). In concert with the pattern of increased total duration of peak velocity events in recent years, the displacement associated with peak velocity events (d peak ) is increasing relative to annual displacement (d a) at each station (Table 4).
Speed-up associated with lake formation and drainage
Records of the formation and drainage of the ice-dammed Ice cave Lake along the western margin of White Glacier are available for 1968 and 2014. In 1968, the lake formed over a period of 5 days (30 May to 4 June) and slowly drained into an ice cave over a period of 17 days until 21 June when the lake was fully emptied. The initiation of spring speed-up preceded the lake drainage; velocities were observed to exceed v mw by 23% on 11 June, by 41% on 15 June and reached a maximum of 60% (13.65 cm d−1) on 18 June, after which they dropped to 34% above v mw on 21 June, the next date of observation. The timing of these observations could be explained by a constant supply of water to the subglacial system over the 17 days that the lake drained. This would support the steady increase in velocity at the lower profile until the reservoir was depleted on 21 June, leading to a drop in the subglacial water pressure.
The formation of a lake at the same location in 2014 began on 12 June, and water levels steadily rose until 15 June when the lake reached maximum capacity. Small fluctuations in the lake level (<1 m) were observed over the following 10 days until 25 June. On 26 June the lake level had dropped to an estimated 15% of the 25 June level, and the lake was fully emptied by 30 June. Unlike in 1968, ice velocities at the lower profile in 2014 did not show an increase over v mw prior to the formation of the marginal lake and remained relatively constant until 26 June when the majority of the lake drained into the ice cave, upon which ice velocities rose from v mw to 215% above v mw over the course of 1 day.
The dynamic behaviour occurring in concert with the lake formation and drainage differs between the 2 years; whereas ice velocities at the lower profile increased incrementally from ~ v mw to >60% above v mw over the period of one week in 1968, the 2014 speed-up event exceeded >200% above v mw and occurred near-simultaneously with the rapid lake drainage over the period of 1–2 days. The discrepancy in dynamic behaviour is potentially associated with the ability of the ice cave channel to connect with the broader subglacial network through en- or sub-glacial melt and subsequent channel formation, thus allowing a large volume of water to enter the subglacial network, increase water pressures and reduce basal friction. However, there is also the possibility that a dynamic event unrelated to the lake drainage caused speed-up of the glacier on 26 June 2014, which could have induced basal ice fracturing in the subglacial environment and provided a new route through which the lake could drain. The daily photographs from 2014 do not provide the temporal resolution to distinguish what came first, the lake drainage or the speed-up, but the new instrumentation is in place to investigate this site in the future.
CONCLUSIONS
Several changes have occurred to the magnitude and duration of peak velocity events (observed over 5-day periods) at White Glacier since the 1960s, which have altered the overall contribution of summer motion to annual motion:
-
(1) The absolute magnitude of peak velocities have increased by ~5 cm d−1 at the upper and middle profiles (from 13.5 to ~18 cm d−1 and 13.7 to ~19 cm d−1, respectively) since 1968, while peak velocities have decreased by ~10 cm d−1 at the lower profile (from 25.6 to ~16 cm d−1);
-
(2) The relative magnitude of peak velocities (normalized by the minimum velocity observed in the previous winter) has increased significantly at all profiles, with the greatest increase occurring at the lower profile. At this location peak velocities now exceed previous winter minimum velocities by >250% (Fig. 7), compared with peaks of ~200% in 1968;
-
(3) As a result of the increasing relative magnitude and number of days exhibiting peak velocities, the contribution of summer motion to annual displacement has increased from 15% to up to 30% at the upper profile, and from 32% to up to 50% at the middle and lower profiles (Table 2).
In contrast, features of summer dynamics that remain unchanged at White Glacier since observations in the 1960s by Iken (Reference Iken1974) include continuation of the lower profile exhibiting the largest range of velocity fluctuations, both absolute and relative to mean annual velocities, and the formation and drainage of an ice-marginal lake in conjunction with the first summer speed-up event. The increased contribution of summer motion to annual displacement likely explains, in part, why observed mass flux through the cross-sectional area of all three profiles is significantly out of balance with modelled balance fluxes derived from the 55-year mass-balance record (Thomson and Copland, Reference Thomson and Copland2017).
The peak velocity events described here are expected to be primarily associated with basal motion, likely in the form of basal sliding, in response to high basal water pressures during the summer melt period. With the continuation of negative surface mass-balance conditions, ice thinning and corresponding reductions in ice deformation rates, it appears likely that summer dynamics driven by basal motion will play an increased role in total glacier motion in the future. However, as ice deformation rates decline to stagnation as the ice thins there is an increased likelihood of subglacial channels persisting through the winter, which could efficiently route water from the glacier bed at the onset of melt the following summer and result in lower basal sliding. Evidence of this latter-phase of subglacial hydrological evolution may have already been observed at White Glacier where, in 2010, a large (~0.5 km2) collapse feature formed near the terminus, exposing well developed, multi-year subglacial and englacial channels. The dominance of cold (<−10°C) ice in Canadian high-Arctic glaciers, resulting in slower creep and channel closure rates, will make these ice masses particularly prone to early stagnation and collapse under future negative mass-balance conditions.
ACKNOWLEDGEMENTS
This research was supported by the Natural Sciences and Engineering Research Council of Canada, Canada Foundation for Innovation, Ontario Research Fund, ArcticNet, University of Ottawa, the W. Garfield Weston Foundation, and the Northern Scientific Training Program. We acknowledge the continued support of the Canadian Polar Continental Shelf Program for providing field logistics at Expedition Fiord, and Wayne Pollard who manages the McGill Arctic Research Station where this study was based. We sincerely thank Miles Ecclestone and the many others who assisted in carrying out fieldwork at White Glacier. The comments and suggestions provided by the reviewers and Annals of Glaciology editorial team are greatly appreciated.


 Open access