


Introduction and state of the art
Ancient literary sources (e.g. Cic. Att. 2.3.2; Cic. De Or. 1.39.179; Plin. Ep. 2.17; Plin. Ep. 5.6; Sen. Cont. 5.5; Stat. Silv. 1.3; Stat. Silv. 2.2; Vitr. 6.3.10) highlight the importance of the view and the act of viewing within Roman domestic architecture. Consequently, scholars have studied such sources in the context of the material remains of Pompeii and Herculaneum. The results suggest that optical axiality played a key role in the apperception of the Roman house and its socio-political significance (Drerup Reference Drerup1959; Bek Reference Bek1980; see also Hales Reference Hales2003: 107–22; Trentin Reference Trentin2019), ultimately envisaging a type of “vision mania” (Clarke Reference Clarke1991: 21). Questions such as which spaces within Roman houses were visible to visitors and how house design and visual space contributed to the social atmosphere, however, are still far from being fully answered.
Archaeologists have long been interested in visibility studies (e.g. Wheatley Reference Wheatley, Lock and Stancic1995; Llobera Reference Llobera1996). Initially divided between quantitative or experiential approaches, over the last 15 years, scholars have begun to combine different techniques, such as Geographical Information Systems (GIS), 3D modelling and virtual reality (e.g. Paliou Reference Paliou, Bevan and Lake2013; Landeschi et al. Reference Landeschi2016; Opitz Reference Opitz2017; Richards-Rissetto Reference Richards-Rissetto2017). Drawing on this tradition, the present study examines the possibility of integrating in 3D GIS data related to human visual attention (i.e. a series of cognitive operations that allow the selection of relevant information from a visual scene). These data, measured with an eye tracker, allow assessment of which parts of a complete reconstruction of a Pompeian house draw the attention of the user while moving in the virtual space.
Virtual reality-based eye tracking is an emerging technology. There are, so far, no published examples investigating the possibility of integrating the data generated by an eye-tracker embedded in a virtual reality headset into a GIS environment.
Methodology
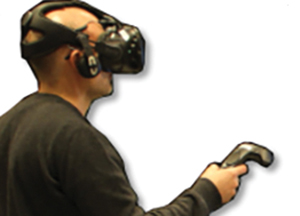
We developed the work pipeline by integrating different products in order to: measure the visual attention of the user in a virtual reality environment; generate a data output for export into third-party software; and import the output data into a 3D GIS environment. The apparatus used in the trial was the Vive Pro Eye headset with integrated eye tracker.
A 3D reconstruction of the House of the Greek Epigrams in Pompeii (V 1,18) was built using 3D modelling software (3D Studio Max) (Campanaro Reference Campanaro2021) and successively imported into Unity, a cross-platform game engine for virtual reality experiences (Figures 1 & 2a). This software enabled a physically based lighting simulation. For the specific scope of this research, two very different scenarios were chosen: dawn on the winter solstice and noon on the summer solstice. The system recorded the visual experience of the participants in the trial (five age-diverse, Caucasian females). Output data, analytical insights and direct measurements were obtained using the software Cognitive3D (Figure 2b).
The 3D model of the House of the Greek Epigrams, imported in Unity (figure by the authors).

Workflow for the integration of eye-tracking data into a GIS environment (figure by the authors).

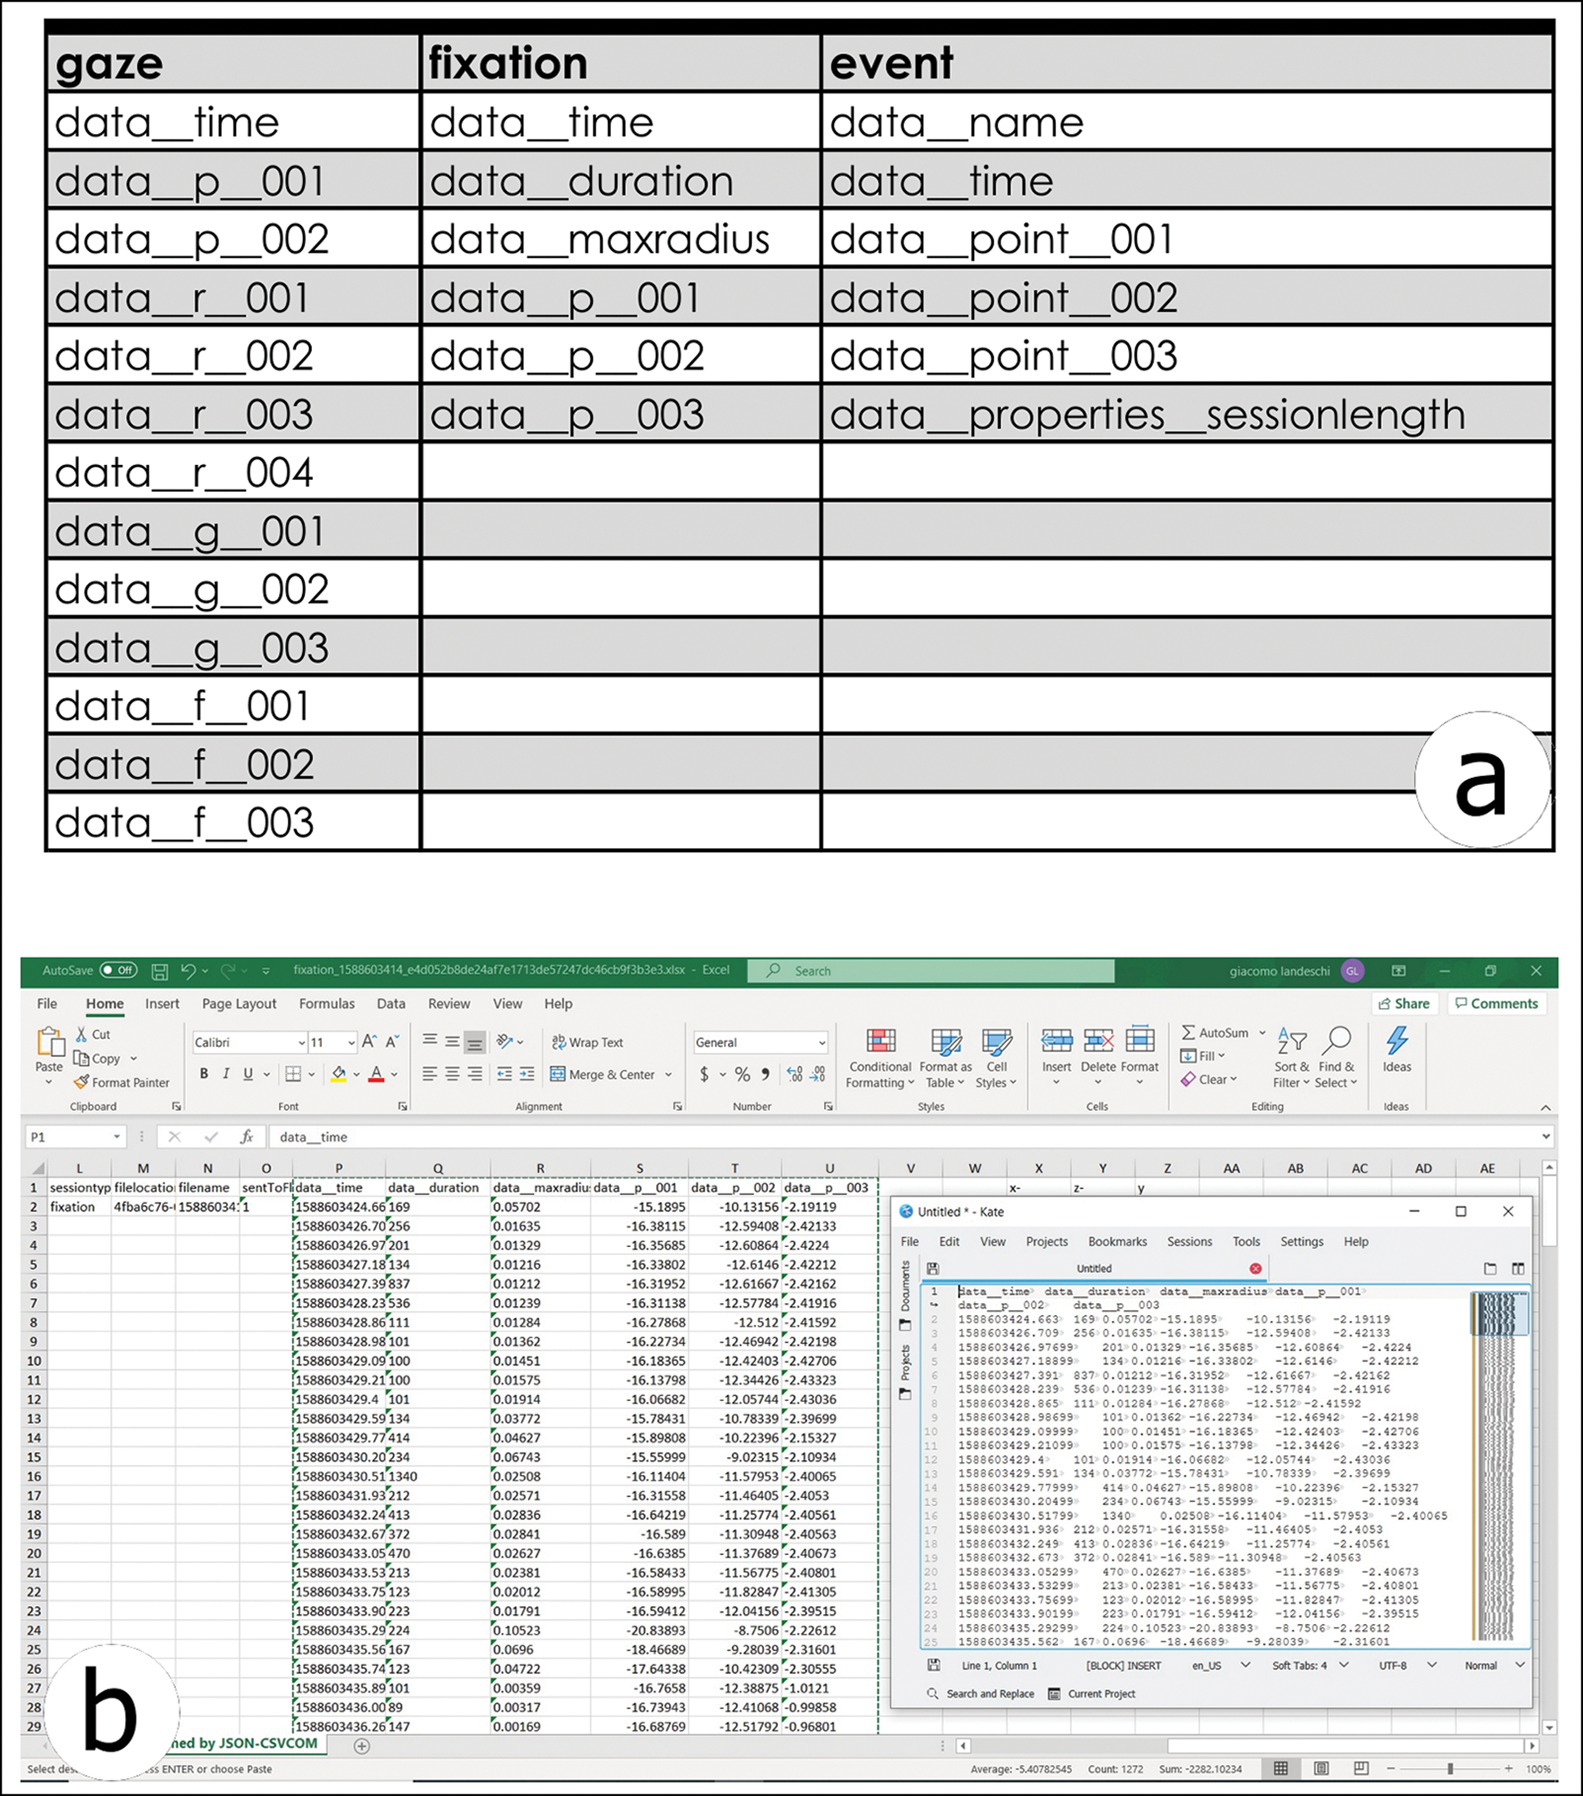
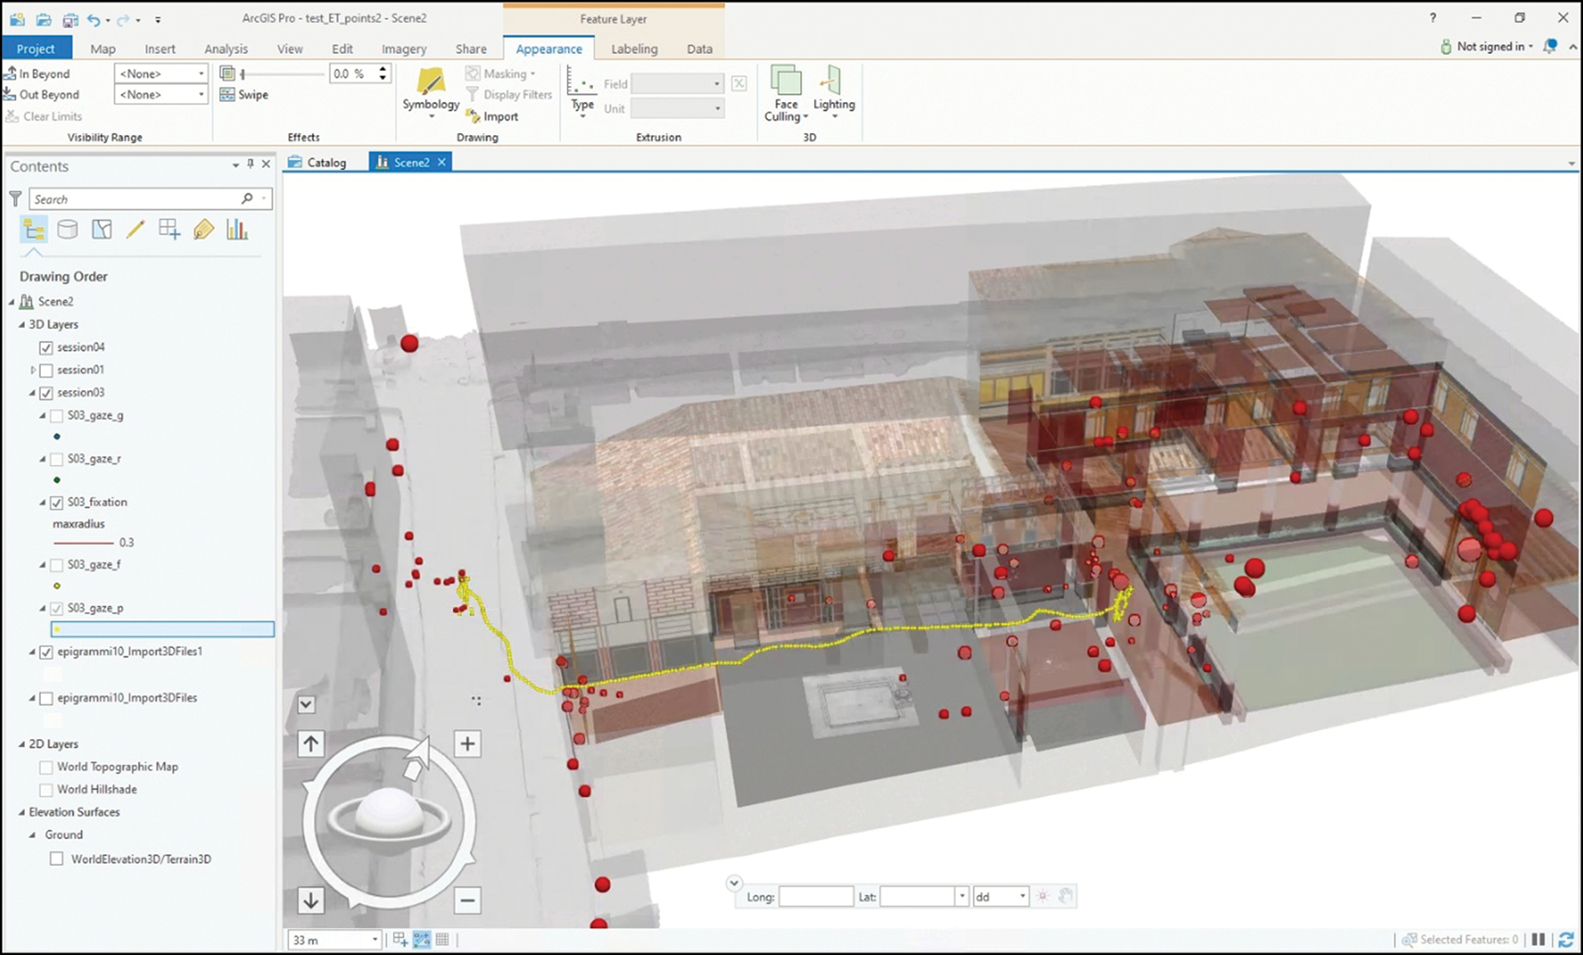
It is of paramount importance to geolocate the visual behaviour of a user by integrating the collected 3D data into a GIS environment. Specifically, this process may allow specialists to take advantage of the analytical power offered by this system (e.g. statistical analysis, 3D density maps, line-of-sight, distribution maps, multi-layered analysis) and to investigate data critically against other important layers of information (e.g. light metrics calculated using a lighting simulation tool [Figure 3], audio metrics, graffiti, household artefacts). Information derived from Cognitive3D was imported into a GIS environment (ArcGIS Pro) (Figure 2c) as JSON files—a standard human-readable exchange data format—comprising three datasets: gaze (accurate tracking of the head position of the user); fixation (detailed understanding of what users are focusing on when their eyes are relatively stable, where the stable point is called ‘fixation’); and event (duration, beginning and end of a single session) (Figure 4a). Each point in a dataset is identified by a triplet representing the (x, y, z) values according to the Unity coordinate system. Due to differences in the Unity and ArcGIS coordinate systems, transformation of the Unity coordinates to ArcGIS coordinates was required (Figure 4b). Once created, the datasets were imported as an ASCII file, along with the 3D model used for the simulation in Unity3D. The relative position of the eye tracker-measured points perfectly matched the space in which the users moved virtually while wearing the VR headset (Figures 5 & 6).
Example of light metrics. Level of illumination (LUX) in the reconstructed house of the Greek Epigrams, calculated for four different hours of the winter solstice (unpublished data) (figure by the authors).

JSON datasets exported from Cognitive3D, containing results of a single user's visual experience (a). Eye-tracking-derived datasets are edited with a text editor in order to adjust x,y,z column placements, according to the ArcGIS PRO combination scheme (b).
Exported data are visualised in ArcGIS PRO as point shapefiles. The path of the user exploring the virtual environment of the reconstructed Pompeian house is displayed in the right spatial relation with the original building (figure by the authors).
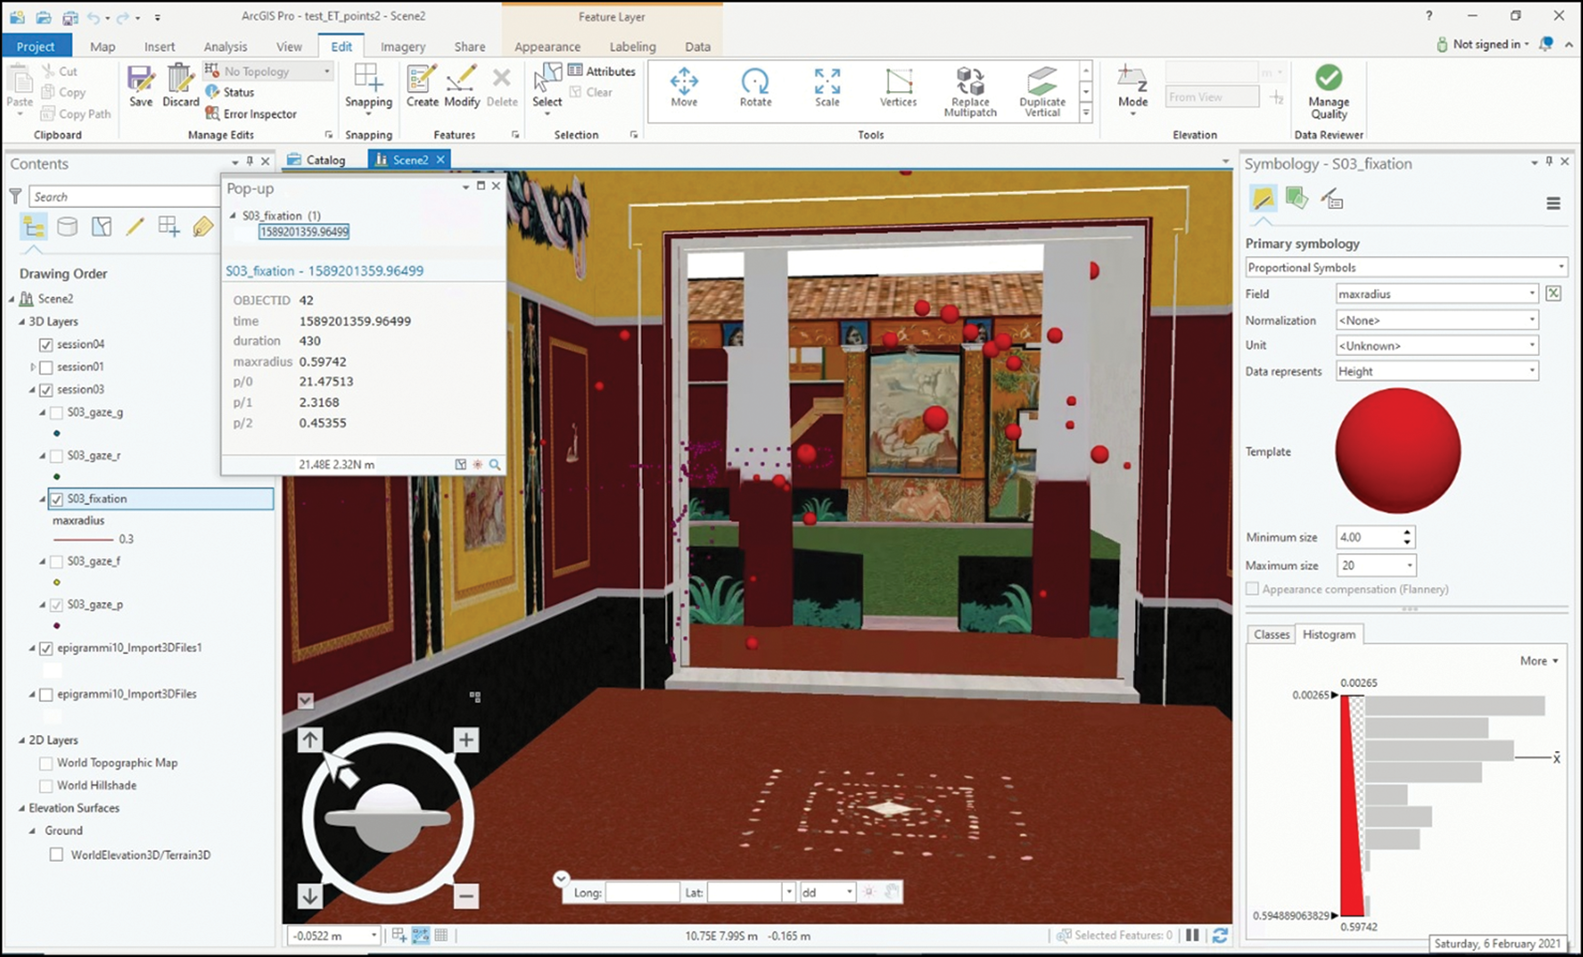
Gaze and fixation is shown with respect to the surrounding space. Max fixation radius is displayed with graduated symbols based on the size of the radius (figure by the authors).
Results and future prospects
In this trial, users’ visual experiences (gaze, fixation and movement) within a virtually reconstructed Pompeian house have been collected and imported into a GIS environment. Handling virtual reality eye tracker-derived data in a GIS space may present interesting new scenarios for research and analysis of human/environment interaction (e.g. to investigate how illumination influenced the social experience of elements such as graffiti and wall paintings). It is possible to query the geodatabase and automatically select areas with higher levels of visual attention, and to understand in which order objects are seen and the positions taken in the space by the user. Multiple human sessions can be integrated, and a large quantity of data can be managed in order to detect patterns that may relate to particular features of the examined virtual space. Furthermore, by managing these data in 3D GIS, an individual user's experience can be associated with a descriptive record entry (attribute table) and linked to a specific visual attention point, making it easier to combine a quantitative assessment of the visual experience with specific factors such as, for example, user age and lighting conditions.
Despite the important results achieved by visibility studies in the emerging literature mentioned above, a human-centred form of analysis has never been fully accomplished. This workflow introduces a more dynamic approach to overcoming the significant limitations posed by most traditional GIS-based studies.
Conclusions
This research has shown that it is possible to collect, quantify and analyse data concerning the visual experience within a virtually reconstructed Pompeian house. Findings from this newly developed work pipeline may greatly benefit future studies on views and viewing in the Roman house, and the socio-political conditioning of senses as a mode of display for status and power in the ancient domestic realm. Furthermore, it may, optimistically, reach beyond the boundary of the specific area of interest to involve all archaeological contexts in which visual properties and people intertwine, or in which visual properties are manipulated to prompt behaviour.
Acknowledgements
This work is a joint collaboration between the Laboratoriet för Digital Arkeologi (DARKlab, https://www.darklab.lu.se) and the Humanities laboratory (https://www.humlab.lu.se), Lund University, Sweden. The authors sincerely thank the anonymous reviewers. Special gratitude goes to Henrik Gerding for his constructive comments.
Funding statement
This work was supported by Fil dr Uno Otterstedts fond and Bokelunds resestipendiefond.


 Open access