


1. Introduction
Since the spread of the novel Corona Virus Pneumonia (COVID-19) epidemic in December 2019, the epidemic has triggered a serious health and economic crisis worldwide. COVID-19 exhibits high transmissibility, high mutation rates, and immune evasion properties [Reference Viana, Moyo and Amoako1]. The re-infection, recurrence, or seasonal epidemic of COVID-19 or new variant remains a substantial global public health threat. Accordingly, for the present situation, to carry out an effective prevention and control strategy, using mathematical or data-driven artificial intelligence (AI) models to analyse and predict disease spread will be of great help. Nowadays, there are many studies to make progress in COVID-19 spread analysis and prediction using mathematical or AI-based models [Reference Adrielle Dos Santos, Filho and Silva2].
In modelling the pandemic mathematically, the COVID-19 spread can be modelled using differential equations. Typical methods have the susceptible-infectious-recovered (SIR), the susceptible-exposed infectious recovered, and the relational improved model. In mathematical epidemic models, there are also many other types of research to forecast the temporal evolutions of COVID-19, including the non-central beta probability distribution approach, reduced-space Gaussian process regression, fractional nonlinear grey Bernoulli model, the Bayesian structural time series models, and so forth [Reference Leung, Wu and Leung3].
AI techniques are applied extensively in predictions of the COVID-19 epidemic due to their accuracy. In machine learning-based prediction methods, the authors used active learning models to predict the multimodal data. For predicting the COVID-19 epidemic, there are other machine learning methods, including the logistic, support vector regression (SVR), spatiotemporal autoregressive models, and so forth [Reference Hussain, Ozair and Ali4]. Furthermore, the research related to deep learning for predicting the COVID-19 time evolution has also been widely concerned. Some studies used multiple deep-learning approaches for predicting the COVID-19 epidemiological data and compared the prediction accuracy of these different methods. In addition, some studies estimate the effect of weather parameters on transmissions of COVID-19, such as temperature, rainfall, humidity, and solar irradiation, and could reflect a seasonal outbreak profile. There are some related research reviews about the forecast of the COVID-19 pandemic [Reference Firmino, de Sales and Goncalves Junior5].
However, the uncertainness of COVID-19 time series evolution could lead to difficulties in mathematical modelling, and the limited availability of temporal data restricts the accuracy of prediction by using AI methods. The temporal evolution prediction of COVID-19 belongs to a sort of nonlinear time series prediction. Many researchers have shown that recurrent neural networks (RNNs) exhibit significant performances in nonlinear time series forecasts. However, the computational cost of the RNN training process is expensive owing to the back propagation through time algorithm in the training process, and gradient vanishing or explosion problems easily happen [Reference Arias Velasquez and Mejia Lara6]. To address these issues, some variants of RNN, such as long short-term memory (LSTM) and gated recurrent units (GRU), have been proposed and widely used to tackle the tasks of nonlinear time series forecasts. However, these models still have relatively high computational complexity. The simple methods are used to predict the evolutions of complex nonlinear time series.
Echo state network (ESN) is a highly efficient computational framework based on RNN, also known as reservoir computing, and thus it is suitable for nonlinear time series forecast. The reason why ESN is efficient is that only the output weight matrix needs to be trained by a simple linear regression algorithm, whereas other connection matrices do not need to be trained, but are assigned randomly. This simple and fast learning process can enormously reduce the computational expenses of training compared to standard RNN, LSTM, and GRU. ESN can be successful in performing computationally hard tasks and has been proven to be very effective in solving problems in many application fields, including dynamical systems modelling, chaotic time series prediction, equalizing communication channels, speech recognition and polyphonic music processing, classification tasks, meteorological forecasting, industrial plants monitoring, energy consumption and wind power generation prediction, turbofan engine multi-regime time series prediction, electricity price prediction, and intelligent stock trading system [Reference Sahin and Sahin7]. The classical SIR model is adopted to produce a set of independent synthetic time series data. These generated data to train and test a classical ESN, and then the authors use the trained ESN to forecast the spread of COVID-19. ESN based on the RNN framework which has the advantage of low computational costs is very suitable for dealing with problems of complex nonlinear time series forecasting [Reference Feroze8].
In this study, a data self-driven ESN-based COVID-19 time series prediction model is designed [Reference Santosh9]. Specifically, the feedback loop is closed by replacing the input with the output. In simulation experiments, we forecast the number of daily cumulative confirmed cases in nine countries. Some existing deep-learning approaches in prediction at time scale, where the results indicate that our methods can achieve better prediction performance. In addition, we analyse the effect of the data self-driven ESN model parameters on predictive accuracy [Reference Gomez-Cravioto, Diaz-Ramos and Cantu-Ortiz10]. By selecting the appropriate data scaling ratio, the number of neurons, the leakage rate, and the spectral radius of the connection matrix of neurons, these parameters are adaptively adjusted to improve prediction performances [Reference Hu, Wang and Lv11, Reference Ghosh, Senapati and Mishra12]. The key contribution of the given model is given below.
Novel method
This ESN-Dove Swarm Search (DSS) approach ensembles the self-driven forecasting phase that maximizes the performances in terms of forecasting the epidemics. The self-driven ESN sustains complex temporal information through the learning of training samples to autonomously evolve.
Decision-making
Forecasting the epidemic as possible as earlier without any significant delay or any other difficulties which affects the forecasting performance when compared to several AI prediction approaches which includes the RNN, GRU’s, LSTM, and variational auto encoder (VAE).
Hyperparameter tuning
The hyperparameters of the ESN algorithm are updated and optimized with the use of the DSS algorithm and thus the forecasting of COVID-19 is achieved effectively.
The paper organization of this research work is listed in Section 2 as a literature review on the forecasting of epidemics, including various existing approaches that are related to forecasting the epidemics by utilizing AI, regression, and ARIMA models, the challenges and disadvantages of the existing work and the research gap of this work. The proposed methodology of this work is explained in Section 3 including several approaches to attain effective performance. Section 4 shows the result section and the experimental analysis is analysed and determined by applying the performance evaluation, graphical representation, and comparative analysis whereas the conclusion and future work are comprised in Section 5.
2. Literature survey
MacIntyre et al. [Reference MacIntyre, Chen, Kunasekaran, Quigley, Lim, Stone, Paik, Yao, Heslop, Wei and Sarmiento13] implemented AI in public health to warn the epidemics at an early stage. This article concentrated on the role of AI in terms of monitoring the epidemics and the various epidemics intelligence systems that include the Health Map, Met biota Epidemics intelligence from the Open source, Epitweetr, ProMED-mail, EPIWATCH, Blue Dot, and Global Bio surveillance Portal were demonstrated. The epidemic warnings could be generated by AI technology without any human involvement. After a thorough investigation, EPIWATCH had a significant value in collecting epidemic intelligence, and the epidemic was detected and alerted at an early stage. However, AI-based epidemic warning systems were not widely used.
Uzun Ozsahin et al. [Reference Uzun Ozsahin, Precious Onakpojeruo, Bartholomew Duwa, Usman, Isah Abba and Uzun14] developed Black-Box-based Pearson Correlation approach in prediction process. The objectives of this article include the comparison of the COVID-19 cases between Greece and Israel on a weekly, a comparison of the morality rate between Greece and Israel per month, an analysis and determine the influence of vaccination and forecasting the total number of individuals who are affected by COVID-19 in Israel. The correlation analysis was utilized to achieve these objectives. After the experimental analysis, the results revealed that the accuracy of the MLR was 98.2%, which is better than ANN in terms of predicting COVID-19. Meanwhile, this study failed to investigate the regression, ensemble, and optimization models that were necessary to improve the overall performance.
Arora et al. [Reference Arora, Agrawal, Arora, Poonia and Madaan15] evolved a concept to predict and forecast COVID-19 using the Regression as well as ARIMA models. The data were taken from Johns Hopkins University for 5 months in 2020. The Root Mean Squared Logarithmic Error (RMSLE) was employed to estimate the errors of a proposed model. After the experimental analysis, it was revealed that the RMSLE of the S-ARIMA model was 1.83, and the result of the S-ARIMA approach was superior when compared to the regression models. On the other hand, the computational process was complex.
Hasan et al. [Reference Hasan, Putri, Susanto and Nuraini16] presented data-driven modelling as well as predicting the COVID-19 outbreak for the policymaking of the public. In this article, the data-driven method was proposed for modelling and predicting COVID-19 and it was used by the decision-makers in handling and controlling the outbreak via non-pharmaceutical interventions. For the discrete-time stochastic augmented compartmental approach, an extended Kalman filter was employed in which the change in time of the reproduction number was determined. The active recovered, and the confirmed cases were considered as the input. After a thorough analysis, it was revealed that the proposed approach could be utilized to develop a short to medium forecast in which COVID-19 was predicted. Meanwhile, the forecasting results were not accurate.
Saqib et al. [Reference Saqib17] developed a concept to forecast the spread of COVID-19 progression using the hybrid polynomial Bayesian ridge regression model. The hybrid polynomial Bayesian ridge regression was utilized to formulate the model with n-degree polynomial. After the experimental analysis, it was revealed that the proposed model was better than all other approaches in terms of root mean square error (RMSE). Meanwhile, the significant factors, such as social distancing, stability of the healthcare systems, and awareness of the people were not analysed in this article.
Dash et al. [Reference Dash, Chakravarty, Mohanty, Pattanaik and Jain18] implemented a concept to forecast the COVID-19 outbreak using the deep learning method as SVR. The principles of the support vector machine were utilized by the SVR. Here, the LSTM and SVR approaches were utilized to determine the pandemic behaviours. The simulation outcome revealed that the rate of forecasting the pandemic behaviour by the LSTM approach was 95.5%, which was superior when compared to all other existing approaches. Meanwhile, a large number of training data were required for effective performance.
Namasudra et al. [Reference Namasudra, Dhamodharavadhani and Rathipriya19] demonstrated a concept to predict COVID-19 cases using the nonlinear neural network-based forecasting model. A novel nonlinear autoregressive (NAR) neural network time series (NAR-NNTS) was proposed to forecast the COVID-19 cases. The training methods which include the Levenberg–Marquardt, scaled conjugate gradient, and Bayesian regularization were employed to train the NAR-NNTS model. After the experimental analysis, it was revealed that proposed NAR-NNTS model was superior to all other approaches in predicting the data of COVID-19. Meanwhile, a large time was taken to detect COVID-19 cases.
Ketu et al. [Reference Ketu and Mishra20] implemented an enhanced Gaussian process regression-based forecasting model for COVID-19 outbreak. The multi-task Gaussian process (MTGP) regression model with enhanced predictions of novel COVID-19 outbreak was proposed in this article. The MTGP regression model was employed to forecast the outbreak of COVID-19 all over the world and it helps to plan the preventive measures to minimize the spread of the disease. After the experimental analysis, the results of the proposed model were outperformed when compared to all other approaches in terms of detecting its correctness as well as suitability. Meanwhile, this article failed to investigate the significant parameters, such as the distribution of age, population density, and the virulence of the virus which were used to improve the prediction accuracy.
Research gap
Despite the various advantages obtained from the above-mentioned literature in terms of forecasting epidemics, there are some gaps in the existing literature, which are listed below.
Absence of AI-based epidemic warning systems: The existing literature does not include the warning systems that integrate with AI, which is necessary to early warning of the epidemics. This gap is addressed in the proposed model by developing an AI-based epidemic warning system to forecast the infectious disease earlier.
Complexity in the computational process: Due to the high processing time and the availability of computational resources, the computational process is complex. This gap is addressed in the proposed model by providing efficient resources and lowering the processing time.
A large number of training data are required: The existing literature requires a large number of training data to forecast epidemics like COVID-19. The proposed model addresses this gap by predicting the epidemics with a limited number of training data.
3. Proposed methodology
The workflow of the proposed method is illustrated in Figure 1. First, the figure depicts that the data of COVID-19 affected cases. The collected datasets are subjected to a data preprocessing phase and the unwanted data are eliminated by using the minimum–maximum approach. The data self-driven ESN model is constructed for forecasting the evolution of the COVID-19 time series and then the DSS algorithm is integrated with the ESN to optimize the weight. Hence, the predicted output is determined. Finally, the performance evaluation is carried out to evaluate the accuracy of the proposed model in terms of forecasting COVID-19. Basically, the ESN-DSS model is proposed to perform the prediction of COVID-19 based on the extracted relevant factors. The input data are generated in COVID-19 time series based on the current internal state and weight. A closed feedback loop is generated that replaced the original input in the prediction process, the output of the ESN is employed with future values, and the variables are determined as input. In the feedback loop, the proposed method iteratively makes predictions for successive time steps by using its own previous predictions as input. The feedback loop frequently updated the prediction outcome based on the output that generated self-contained and self-adaptive system. The complex temporal dependencies are formed in the closed-loop architecture leads to form more accurate and better COVID-19 prediction.
Workflow of the proposed method.

In COVID-19 prediction, the ESN is used to validate the initial factors of different signs regarding infection rate, vaccination details, and so forth. However, in DSS algorithm, it extracts the behaviour regarding the severity level that finds an effective optimal solution based on the exploration and exploitation phases. While integrating with the ESN, the DSS optimizes the weights by validating the interior issues, and the aim is achieved by identifying the optimal configuration weight by diminishing the prediction error. Initially, the weight functions are randomly assigned in the ESN, and in training process, the DSS is employed that explores the search space of possible weight configurations. The DSS model is very efficient in the process of weight updation and by integrating with ESN the performance is evaluated.
3.1. Data collection phase
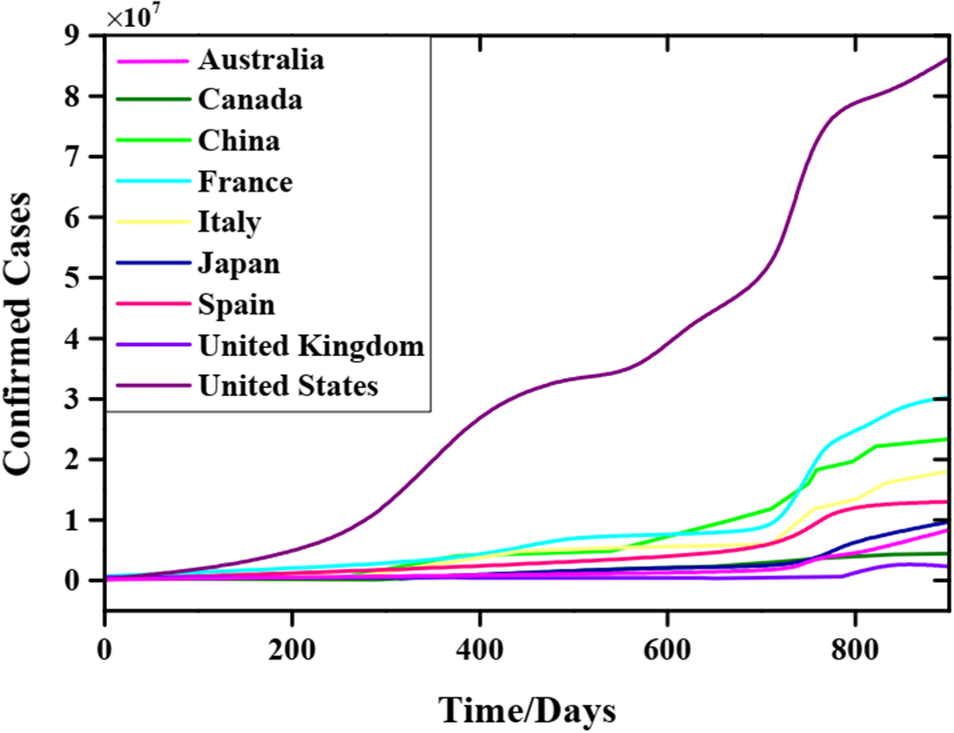
On a global scale, some institutions and research teams provide many significant open-data resources against COVID-19. In our study, COVID-19 dataset comes from the Center for Systems Science and Engineering (CSSE) at Johns Hopkins University [21]. Daily data of cumulative confirmed cases from nine considered countries are used for modelling and forecasting. These nine countries, respectively, are the United Kingdom, Canada, Australia, Italy, China, France, Japan, Spain, and the United States. Our sample dataset contains cumulative confirmed cases samples of 881 days from 22 January 2020 to 20 June 2022, and Figure 2 depicts these data samples where the number of American confirmed cases is the largest in every countries.
Actual COVID-19 time series of daily cumulative confirmed cases from 22 January 2020 to 20 June 2023, in nine different countries.
3.2. Data preprocessing phase
To maintain the echo states of the reservoir, inputs of the network need to be squashed into a range of $ \left[-1,1\right] $
[Reference Jaeger22]. Consequently, the transformed time series based on the min–max normalization method is described as follows:
$ \left[-1,1\right] $
[Reference Jaeger22]. Consequently, the transformed time series based on the min–max normalization method is described as follows:
 $$ {y}_{scale}(t)=\frac{y(t)-\underset{i=1,2,\cdots, {T}_{train}}{\min }y(i)}{\left(\underset{i=1,2,\cdots, {T}_{train}}{\max }y(i)-\underset{i=1,2,\cdots, {T}_{train}}{\min }y(i)\right)\times scale}, $$
where $ scale $
is the scaling factor, and needs to be satisfied
$ scale $
is the scaling factor, and needs to be satisfied $ scale\ge 1 $
? It is worth noting that data squashing is determined based on the training data, while the test data are assumed to be unknown. If
$ scale\ge 1 $
? It is worth noting that data squashing is determined based on the training data, while the test data are assumed to be unknown. If $ scale $
is set as
$ scale $
is set as $ scale=1 $
, because what we predict is the number of daily cumulative cases, namely
$ scale=1 $
, because what we predict is the number of daily cumulative cases, namely $ y\left(t+1\right)\ge y(t) $
for any time step
$ y\left(t+1\right)\ge y(t) $
for any time step $ t $
, this means that outputs of the network (namely inputs) must be greater than one in the test period. This situation may affect the prediction accuracy. Therefore, in principle, it can be inferred that
$ t $
, this means that outputs of the network (namely inputs) must be greater than one in the test period. This situation may affect the prediction accuracy. Therefore, in principle, it can be inferred that $ scale $
cannot be less than the growth rate of the interval of the number of forecast days to ensure that the input and output of the self-driven ESN are both
$ scale $
cannot be less than the growth rate of the interval of the number of forecast days to ensure that the input and output of the self-driven ESN are both $ \left[-1,1\right] $
during the training and test period. If what we predict is just at an inflection point or in a period of dramatic changes, the growth rate of future time series will be much larger than that of training data. Therefore, it is difficult to determine the value of the
$ \left[-1,1\right] $
during the training and test period. If what we predict is just at an inflection point or in a period of dramatic changes, the growth rate of future time series will be much larger than that of training data. Therefore, it is difficult to determine the value of the $ scale $
.
$ scale $
.
In our simulation experiments, the data scaling factor $ scale $
is set as
$ scale $
is set as $ scale=20 $
for the cumulative confirmed cases forecasting.
$ scale=20 $
for the cumulative confirmed cases forecasting.
3.3. Self-driven forecasting phase
The objective is to provide simple deep-learning approach for modelling, predicting, and evaluating COVID-19 epidemic. The data self-driven ESN model is constructed for forecasting the evolution of the COVID-19 time series. Based on the standard ESN, the data self-driven forecast model is developed to forecast the temporal evolution of COVID-19 epidemic.
The proposed ESN-DSS model is used to predict the diseases that are influenced in covid-19 by training the insights and inform the health conditions. The time series forecasting extract the non-linear data by associating the approaches. The weight functions are optimized that accurately identified COVID-19 time series forecasting prediction process. The parameters are tuned to enhance the flexibility of prediction process and optimized the algorithm effectively.
3.3.1. The ESN model
ESN is a highly efficient computational framework based on RNN and has a significant ability for nonlinear time series forecasting. A standard ESN architecture consists of three distinct parts, namely the input layer, dynamical reservoir, and output layer, as shown in Figure 3, where dashed arrows indicate optional connections. The input layer includes $ K $
input units, the dynamical reservoir includes
$ K $
input units, the dynamical reservoir includes $ N $
internal network units (namely reservoir neurons) and the output layer includes
$ N $
internal network units (namely reservoir neurons) and the output layer includes $ L $
output units.
$ L $
output units.
A standard ESN architecture.

For the standard ESN with leaky-integrator [Reference Jaeger, Lukosevicius and Popovici23], reservoir neuron states are updated according to:
 $$ r\left(t+1\right)=\left(1-\alpha \right)r(t)+\alpha \mathbf{f}\left({\mathbf{W}}_{\mathbf{in}}u\left(t+1\right)+\mathbf{W}r(t)+{\mathbf{W}}_{\mathbf{back}}y(t)\right), $$
where $ f=\left({f}_1,{f}_2,\dots, {f}_N\right) $
is the activation function of the reservoir neuronal vector comprising scalar functions
$ f=\left({f}_1,{f}_2,\dots, {f}_N\right) $
is the activation function of the reservoir neuronal vector comprising scalar functions $ {f}_1,{f}_2,\dots, {f}_N $
typically hyperbolic tangent function
$ {f}_1,{f}_2,\dots, {f}_N $
typically hyperbolic tangent function $ \left(\tanh \right) $
.
$ \left(\tanh \right) $
. $ r(t)=\left({r}_1(t),{r}_2(t),\dots, {r}_N(t)\right) $
is a real-valued vector of reservoir neuron states at a time step
$ r(t)=\left({r}_1(t),{r}_2(t),\dots, {r}_N(t)\right) $
is a real-valued vector of reservoir neuron states at a time step $ t $
. Input units at the time step
$ t $
. Input units at the time step $ t $
are
$ t $
are $ u(t)=\left({u}_1(t),{u}_2(t),.\dots, {u}_K(t)\right) $
output units are
$ u(t)=\left({u}_1(t),{u}_2(t),.\dots, {u}_K(t)\right) $
output units are $ y(t)=\left({y}_1(t),{y}_2(t),.\dots, {y}_K(t)\right) $
.
$ y(t)=\left({y}_1(t),{y}_2(t),.\dots, {y}_K(t)\right) $
. $ \alpha $
is the leakage rate to control the update speed of reservoir neuron states, and satisfies
$ \alpha $
is the leakage rate to control the update speed of reservoir neuron states, and satisfies $ 0\le \alpha \le 1 $
.
$ 0\le \alpha \le 1 $
. $ {W}_{in},W,{W}_{back} $
are the real-valued connection weight matrices whose values are randomly generated during ESN initialization.
$ {W}_{in},W,{W}_{back} $
are the real-valued connection weight matrices whose values are randomly generated during ESN initialization. $ {W}_{in} $
is a
$ {W}_{in} $
is a $ N\times K $
connection matrix that connects
$ N\times K $
connection matrix that connects $ K $
inputs to
$ K $
inputs to $ N $
reservoir neurons,
$ N $
reservoir neurons, $ W $
is a
$ W $
is a $ N\times N $
connection matrix that connects
$ N\times N $
connection matrix that connects $ N $
reservoir neurons, and
$ N $
reservoir neurons, and $ {W}_{back} $
is an
$ {W}_{back} $
is an $ N\times L $
feedback connection matrix that projects back
$ N\times L $
feedback connection matrix that projects back $ N $
reservoir neurons from
$ N $
reservoir neurons from $ L $
outputs, where the feedback connection is optional but not necessary as displayed by the yellow dashed arrow in Figure 3.
$ L $
outputs, where the feedback connection is optional but not necessary as displayed by the yellow dashed arrow in Figure 3.
Different from general RNNs, ESNs, $ {W}_{in} $
,
$ {W}_{in} $
, $ W $
,
$ W $
, $ {W}_{back} $
do not need to be trained, but are randomly determined during ESN initialization. In the subsequent training and testing process, their values remain invariant. For ESN to possess an echo state, the spectral radius of the matrix
$ {W}_{back} $
do not need to be trained, but are randomly determined during ESN initialization. In the subsequent training and testing process, their values remain invariant. For ESN to possess an echo state, the spectral radius of the matrix $ W $
generally needs to be satisfied
$ W $
generally needs to be satisfied $ \rho (W)<1 $
. However, if ESN has the weight matrix
$ \rho (W)<1 $
. However, if ESN has the weight matrix $ W\rho (W)\ge 1 $
, the echo state characteristic may also hold [Reference Dash, Chakravarty, Mohanty, Pattanaik and Jain18].
$ W\rho (W)\ge 1 $
, the echo state characteristic may also hold [Reference Dash, Chakravarty, Mohanty, Pattanaik and Jain18].
The key to the ESN model is the computation of the output weight matrix $ {W}_{out} $
. In the training period, the dynamical reservoir starts with an arbitrary network state
r
(0) and then is updated according to Equation (2). If the length of the training samples is expressed
$ {W}_{out} $
. In the training period, the dynamical reservoir starts with an arbitrary network state
r
(0) and then is updated according to Equation (2). If the length of the training samples is expressed $ {T}_{train} $
we will collect the reservoir state vectors
$ {T}_{train} $
we will collect the reservoir state vectors $ r(t)t=1,2,.\dots, {T}_{train} $
. To dismiss the influences of the initial reservoir state, the state vectors of the initial
$ r(t)t=1,2,.\dots, {T}_{train} $
. To dismiss the influences of the initial reservoir state, the state vectors of the initial $ {T}_{initial} $
steps are discarded owing to the state forgetting the property of the ESN. We will obtain a
$ {T}_{initial} $
steps are discarded owing to the state forgetting the property of the ESN. We will obtain a $ \left(K+N+L\right)\times \left({T}_{train}-{T}_{initial}\right) $
reservoir state matrix
$ \left(K+N+L\right)\times \left({T}_{train}-{T}_{initial}\right) $
reservoir state matrix $ R $
by concatenating the input, neuron state, and output vector.
$ R $
by concatenating the input, neuron state, and output vector.
 $$ \mathbf{R}=\left[\begin{array}{cccc}u\left({T}_{initial}+1\right)& u\left({T}_{initial}+2\right)& \cdots & u\left({T}_{train}\right)\\ {}r\left({T}_{initial}+1\right)& r\left({T}_{initial}+2\right)& \cdots & r\left({T}_{train}\right)\\ {}y\left({T}_{initial}\right)& y\left({T}_{initial}+1\right)& \cdots & y\left({T}_{train}-1\right)\end{array}\right]. $$
Minimizing the mean square error (MSE) between the predicted output and the actual output $ {W}_{out} $
will be solved as described in Equations (4) and (5).
$ {W}_{out} $
will be solved as described in Equations (4) and (5).
 $$ {\displaystyle \begin{array}{rcl}{MSE}_{train}& =& \left(\frac{1}{T_{train}-{T}_{initial}}\right)\sum \limits_{t={T}_{initial}+1}^{T_{train}}{\left(\hat{y}(t)-y(t)\right)}^2\\ {}& =& \left(\frac{1}{T_{train}-{T}_{initial}}\right)\sum \limits_{t={T}_{initial}+1}^{T_{train}}\Big({\mathbf{W}}_{\mathbf{out}}\left(u(t),r(t),y\left(t-1\right)\right)\\ {}& & {-\hskip2px y(t)\Big)}^2,\end{array}} $$
 $$ {\mathbf{W}}_{\mathbf{out}}=\arg \min \left({MSE}_{train}\right). $$
The way of minimizing MSE uses only the linear regression algorithms for the training, therefore, the matrix for solving $ {W}_{out} $
is expressed as follows:
$ {W}_{out} $
is expressed as follows:
 $$ {\mathbf{W}}_{\mathbf{out}}={\mathbf{YR}}^{\mathrm{T}}{\left({\mathbf{RR}}^{\mathrm{T}}+\beta \mathbf{I}\right)}^{-1}. $$ $ Y=\left[y\left({T}_{initial}+1\right)y\left({T}_{initial}+2\right)..\dots y\left({T}_{train}\right)\right] $
is
$ Y=\left[y\left({T}_{initial}+1\right)y\left({T}_{initial}+2\right)..\dots y\left({T}_{train}\right)\right] $
is $ L\times \left({T}_{train}-{T}_{initial}\right) $
the actual output matrix in the training period.
$ L\times \left({T}_{train}-{T}_{initial}\right) $
the actual output matrix in the training period. $ {R}^T $
is the transpose of
$ {R}^T $
is the transpose of $ R $
.
$ R $
. $ \beta $
is the ridge regression coefficient to solve over-fitting problems that may occur during training.
$ \beta $
is the ridge regression coefficient to solve over-fitting problems that may occur during training. $ I $
is
$ I $
is $ K+N+L $
the order identity matrix. The output weight matrix
$ K+N+L $
the order identity matrix. The output weight matrix $ {W}_{out} $
can be calculated according to Equation (6).
$ {W}_{out} $
can be calculated according to Equation (6).
3.3.2. DSS optimization
For various crumbs, the unsatisfied doves are shifted to the spots whereas the spots with the highest crumbs are occupied by the fed doves. To accelerate the training mechanism, two effective weight initialization approaches are employed for initializing the weight vector and constructing the feature maps [Reference Su, Chen and Utami24].
Initial search strategy
In this article, to simplify the arithmetic evaluation and to avoid the boundaries of the velocity, an initial search strategy is integrated and it is given as follows:
 $$ {c}_{kl}\left(s+1\right)={c}_{kl}(s)+\left|\;{h}_1\right|\;\left(\;{c}_{kl}^q(s)\;\right)+\left|{h}_2\right|\;\left({z}_l^h(s)-{c}_{kl}(s)\right) $$
The valid values with every metric are in the minimal hyper-rectangle and it is represented by $ \left[{n}_1,{v}_1\right],..\dots, \left[{n}_m,{v}_M\right] $
. The upper and lower bounds are denoted by
$ \left[{n}_1,{v}_1\right],..\dots, \left[{n}_m,{v}_M\right] $
. The upper and lower bounds are denoted by $ {v}_a,{n}_a $
. To squeeze the two-dimensional hyper-rectangles into the two-dimensional planes, the basic concept of initialization is employed. Hence, the two-dimensional net is used to cover the solution spaces. The weight vectors with the four neurons of the network are evaluated and it is given as follows:
$ {v}_a,{n}_a $
. To squeeze the two-dimensional hyper-rectangles into the two-dimensional planes, the basic concept of initialization is employed. Hence, the two-dimensional net is used to cover the solution spaces. The weight vectors with the four neurons of the network are evaluated and it is given as follows:
 $$ {\underline{y}}_{1,1}={\left({n}_1,{n}_2,.\dots, {n}_M\right)}^R $$
 $$ {y}_{A,Z}={\left({v}_1,{v}_2.\dots, {v}_M\right)}^R $$
 $$ \underline {y_{1,Z}}={\left({n}_1,{n}_2,.\dots, {n}_{\left\lfloor M/2\right\rfloor },{v}_{\left\lfloor M/2\right\rfloor +1},..\dots, {v}_M\right)}^R $$
 $$ \underline {y_{A,1}}={\left({v}_1,{v}_2,..\dots, {v}_{\left\lfloor M/2\right\rfloor },{m}_{\left\lfloor M/2\right\rfloor +1},..\dots, {n}_M\right)}^R $$
A large number of crumbs with the use of the maximal criterion at the epoch $ e $
is evaluated and expressed as follows:
$ e $
is evaluated and expressed as follows:
 $$ {f}_i^e=\mathrm{A} RG\;\mathit{\operatorname{MAX}}\;\left\{h\;\left({y}_i^e\right)\right\},\hskip0.96em for\;i=1,.\dots, 0 $$
The updated satiety degree of the dove is expressed as follows:
 $$ {S}_i^e=\beta\;{S}_l^{e-1}+{f}^{\left(h\;\left({y}_i\right)-h\;\left({y}_{f_h}\right)\right)}\hskip1.08em , for\;i=1,.\dots, 0 $$
Most satisfying doves are selected by the high satiety degree with the use of maximal criterion
 $$ {f}_s^e= ARG\;\underset{1\le i\le O}{\mathit{\operatorname{MAX}}}\left\{\;{S}_i^e\right\},\hskip1.68em for\;i=1,\dots, 0 $$
The updated position vectors of every dove are obtained by employing the maximum criteria
 $$ {\underline{y}}_i^{e+1}={\underline{y}}_i^e+{\eta \alpha}_i^e\left({y}_{f_s}^e-{\underline{y}}_i^e\right) $$
where
 $$ {\alpha}_i^e=\left(\frac{S_{z_s}^e-{S}_i^e}{S_{z_s}^e}\right)\left(1-\frac{\left\Vert {\underline{\;y}}_i^e-{\underline{x}}_{f_s}^e\right\Vert }{\mathit{\operatorname{MAX}}\; DISTANCE}\right) $$
 $$ \mathit{\operatorname{MAX}}\; DISTANCE:\underset{1\le i\le O}{\mathit{\operatorname{MAX}}}\left\Vert {\underline{y}}_i-{\underline{y}}_l\right\Vert $$
From the above equation, the learning rate is denoted by $ \eta $
which is used in updating the position vector of the dove. The termination conditions are given as follows:
$ \eta $
which is used in updating the position vector of the dove. The termination conditions are given as follows:
 $$ \left|{g}_{e_t}^f-U(f)\;\right|\le {\tau}_{ore}\le SET\;\mathit{\operatorname{MAX}}\; EPOCH $$
The DSO algorithm had the complexity order and it is expressed as follows:
 $$ Q\left({MM}_fE\right) $$
From the above equation, $ \left({M}_f\right) $
denotes the total number of data points in the dataset, the number of data points in the dataset is denoted by
$ \left({M}_f\right) $
denotes the total number of data points in the dataset, the number of data points in the dataset is denoted by $ Q\left({MM}_fE\right) $
,
$ Q\left({MM}_fE\right) $
, $ e $
denotes the total number of epochs and the total number of doves is indicated by
$ e $
denotes the total number of epochs and the total number of doves is indicated by $ M $
.
$ M $
.
 $$ {f}_l^e= ARG\;\mathit{\operatorname{MIN}}\left\{\;h\;\left({y}_i^e\right)\right\},\hskip1.44em for\;i=1,..\dots, O $$
 $$ {\displaystyle \begin{array}{l}{S}_l^e=\left\{\begin{array}{l}\beta\;{S}_i^{e-1}+{f}^{\left(h\;\left({y}_i\right)-h\;\left({y}_{f_h}\right)\right),\hskip0.6em }\hskip0.24em if\;h\left({y}_{f_h}\right)\ne 0\\ {}\beta\;{S}_i^{g-1}+1,\hskip3.599998em if\;h\left({y}_{f_h}\right)=0\end{array}\right.\\ {}\hskip2.4em for\hskip0.24em i=1,\dots \dots, O\end{array}} $$
To find more food, the doves are moving with a high satiety degree. Social learning is simulated for updating the position vectors $ {y}_{f_s}^e $
through a high degree of satiety.
$ {y}_{f_s}^e $
through a high degree of satiety.
3.3.3. ESN-DSS-based self-driven forecast model for COVID-19
In this model, the outputs mimic the inputs. During the training period, actual training samples as teacher outputs are written back the input unit to teach the autonomous evolution of complex COVID-19 temporal information to the dynamical reservoir. In the test phase, the predictive output result feeds back the input unit in place of inputs. By replacing the input with the output, the feedback loop is closed in Figure 4.
Flowchart representation of the proposed ESN-DSS-based self-driven forecast model for COVID-19.

For the self-driven ESN, outputs of the network also need to be kept in $ \left[-1,1\right] $
owing to replacing inputs with outputs. COVID-19 time series data are one-dimensional univariate.
$ \left[-1,1\right] $
owing to replacing inputs with outputs. COVID-19 time series data are one-dimensional univariate.
The predicting output of ESN is described as follows:
 $$ \hat{y}\left(t+1\right)={\mathbf{W}}_{\mathbf{out}}\left(u\left(t+1\right),r\left(t+1\right),y(t)\right), $$
where $ \left(u\left(t+1\right),r\left(t+1\right),y(t)\right) $
is a concatenation vector composed of the input and neuron state vectors.
$ \left(u\left(t+1\right),r\left(t+1\right),y(t)\right) $
is a concatenation vector composed of the input and neuron state vectors. $ {W}_{out} $
is a
$ {W}_{out} $
is a $ L\times \left(K+N+L\right) $
matrix of connections from the inputs, neurons, and previous outputs to the current outputs, where the inputs and previous outputs are optional but not required, as shown by the red dashed arrows in Figure 3. If the red dashed arrows do not exist,
$ L\times \left(K+N+L\right) $
matrix of connections from the inputs, neurons, and previous outputs to the current outputs, where the inputs and previous outputs are optional but not required, as shown by the red dashed arrows in Figure 3. If the red dashed arrows do not exist, $ {W}_{out} $
there is a
$ {W}_{out} $
there is a $ L\times N $
matrix connecting the reservoir to the outputs.
$ L\times N $
matrix connecting the reservoir to the outputs.
The initial population of each element is formed by
 $$ {c}_{k\;l}(0)={c}_{\min, l}+{u}_{k\;l}\left({c}_{m\; zx,k}-{c}_{\min, k}\right) $$
From the above equation, $ {c}_{m\;z\;x,k} $
denotes the upper bound, whereas
$ {c}_{m\;z\;x,k} $
denotes the upper bound, whereas $ {c}_{\min, k} $
denotes the lower bound of the variable
$ {c}_{\min, k} $
denotes the lower bound of the variable $ {c}_k $
. The random number that is uniformly distributed at a range of
$ {c}_k $
. The random number that is uniformly distributed at a range of $ \left[0,1\right] $
is represented by
$ \left[0,1\right] $
is represented by $ {u}_{kl} $
. It is regenerated by the above equation when the element is over the domain which is allowed.
$ {u}_{kl} $
. It is regenerated by the above equation when the element is over the domain which is allowed.
The initial rate of the learning value is fixed at 0.1, whereas the decrease rate of the learning value is evaluated and given as follows.
 $$ \eta\;(d)={\eta}_0\times \left(1-\frac{r}{R}\right)=0.1\;\left(1-\frac{r}{100}\right) $$
From the above equation, denotes the initial learning value, the iterative number is represented as r.
For the data self-driven ESN-DSS, a modified framework is utilized [Reference Kim, Lu and Nozari25] to update reservoir neuronal states.
$$ {\displaystyle \begin{array}{c}r\left(t+1\right)=\left(1-\alpha \right)r(t)+\alpha \tanh \left({\mathbf{W}}_{\mathbf{in}}u\left(t+1\right)+\mathbf{W}r(t)+v(t)+d\right),\end{array}} $$
where activation functions of reservoir states uniformly adopt hyperbolic tangent functions $ \left(\tanh \right) $
for
$ \left(\tanh \right) $
for $ N $
neurons. In the training phase, the input of the network
$ N $
neurons. In the training phase, the input of the network $ u\left(t+1\right) $
is the actual training sample output at time step t, not the predicted output, namely
$ u\left(t+1\right) $
is the actual training sample output at time step t, not the predicted output, namely $ u\left(t+1\right)=y(t) $
. In the test process, the input
$ u\left(t+1\right)=y(t) $
. In the test process, the input $ u\left(t+1\right) $
is the predicted output of self-driven ESN with respect to the time step
$ u\left(t+1\right) $
is the predicted output of self-driven ESN with respect to the time step $ t $
, namely
$ t $
, namely $ u\left(t+1\right)=\hat{y}(t) $
. The weight matrix of input connections
$ u\left(t+1\right)=\hat{y}(t) $
. The weight matrix of input connections $ {W}_{in} $
is randomly assigned values based on a uniform distribution, with a value range of
$ {W}_{in} $
is randomly assigned values based on a uniform distribution, with a value range of $ \left[-1,1\right] $
. The weight matrix of neuronal internal connections
$ \left[-1,1\right] $
. The weight matrix of neuronal internal connections $ W $
is a random sparse matrix with sparse connectivity of
$ W $
is a random sparse matrix with sparse connectivity of $ 10\% $
from a uniform distribution. The value range for
$ 10\% $
from a uniform distribution. The value range for $ W $
is
$ W $
is $ \left[-1,1\right] $
, and the spectral radius of
$ \left[-1,1\right] $
, and the spectral radius of $ W $
generally satisfies
$ W $
generally satisfies $ \rho\;(W)\le 1 $
.
$ \rho\;(W)\le 1 $
. $ v(t) $
is an
$ v(t) $
is an $ N\times 1 $
random noise vector from a uniform distribution over
$ N\times 1 $
random noise vector from a uniform distribution over $ \left[-1\times {10}^{-7},1\times {10}^{-7}\right] $
.
$ \left[-1\times {10}^{-7},1\times {10}^{-7}\right] $
. $ d $
is an
$ d $
is an $ N\times 1 $
bias vector,
$ N\times 1 $
bias vector,
 $$ d=\operatorname{arctanh}\left({r}^{\ast}\right)-\mathbf{W}{r}^{\ast}, $$
where $ {r}^{\ast } $
is an
$ {r}^{\ast } $
is an $ N\times 1 $
random vector from a uniform distribution over
$ N\times 1 $
random vector from a uniform distribution over $ \left(-1,-0.8\right] $
and
$ \left(-1,-0.8\right] $
and $ \left[0.8,1\right) $
. The predicting output is modified as
$ \left[0.8,1\right) $
. The predicting output is modified as
 $$ \hat{y}\left(t+1\right)={\mathbf{W}}_{\mathbf{out}}\left(u\left(t+1\right),r\left(t+1\right)\right). $$
It is worth noting that $ u\left(t+1\right)=y(t) $
during the training period, while
$ u\left(t+1\right)=y(t) $
during the training period, while $ u\left(t+1\right)=\hat{y}(t) $
) in the test phase. The reservoir state matrix
$ u\left(t+1\right)=\hat{y}(t) $
) in the test phase. The reservoir state matrix $ R $
in the training process is
$ R $
in the training process is
 $$ \mathbf{R}=\left[\begin{array}{cccc}y\left({T}_{initial}\right)& y\left({T}_{initial}+1\right)& \cdots & y\left({T}_{train}-1\right)\\ {}r\left({T}_{initial}+1\right)& r\left({T}_{initial}+2\right)& \cdots & r\left({T}_{train}\right)\end{array}\right]. $$
After the output weight matrix $ {W}_{out} $
is obtained according to Equation (6), the self-driven network is ready for use.
$ {W}_{out} $
is obtained according to Equation (6), the self-driven network is ready for use.
4. Experimental results
This section shows the performance evaluation of forecasting epidemics using the proposed model. Further, the method is analysed by several metrics which include the mean absolute error (MAE), RMSE, explained variance (EV), RMSLE, and mean absolute percentage error (MAPE). Then, the output of the proposed model is compared with all other methods. The outputs are analysed in the following sections.
4.1. Evaluation indices
In this article, to evaluate the effectiveness and accuracy of the forecast model based on the data self-driven ESN, five performance indicators are analysed. The MAE, RMSE, EV, RMSLE, and MAPE are expressed mathematically as follows, respectively.
RMSE: This is used to evaluate the prediction performance based on the Euclidean distance that extracted the true values. The average variations are estimated based on predicted and actual values.
 $$ RMSE=\sqrt{\frac{1}{n}\sum \limits_{i=1}^n{\left(y(i)-\hat{y}(i)\right)}^2}, $$
MAE: It determined the total error arised among different directions, and the predicted values showed the alternate measurement in prediction process.
 $$ MAE=\frac{1}{n}\sum \limits_{i=1}^n\left|y(i)-\hat{y}(i)\right|, $$
MAPE: It is used to validate the average range of the absolute function among varied prediction process that extracted the error and obtained an absolute prediction.
 $$ MAPE=\left(\frac{100}{n}\times \sum \limits_{i=1}^n\left|\frac{y(i)-\hat{y}(i)}{y(i)}\right|\right)\%, $$
EV: It measures the total variance range of each independent variable, and the ratio is validated from the overall gathered data variables.
 $$ EV=1-\frac{\operatorname{var}\left(\hat{Y}-Y\right)}{\operatorname{var}(Y)}, $$
RMSLE: It compared the predicted and actual values for evaluating the less penalized function based on real range.
 $$ RMSLE=\sqrt{\frac{1}{n}\sum \limits_{i=1}^n{\left(\ln \left(y(i)\right)-\ln \left(\hat{y}(i)\right)\right)}^2}. $$
From the above equations, $ n $
is the number of samples (days),
$ n $
is the number of samples (days), $ y(i) $
is the
$ y(i) $
is the $ i\; th $
actual values, and
$ i\; th $
actual values, and $ \hat{y}(i) $
is the corresponding predicted values, and
$ \hat{y}(i) $
is the corresponding predicted values, and $ \operatorname{var} $
is the variance of the time series computed by the function
$ \operatorname{var} $
is the variance of the time series computed by the function $ \operatorname{var}\;\left(\;\right) $
of MATLAB. RMSE and MAE are absolute error, while MAPE and RMSLE are relative error. RMSLE and RMSE are similar, except that RMSLE is computed at the logarithmic scale, and thus the data size is ignored. For the best model, the expected values of RMSE, MAE, MAPE, and RMSLE are zero, and an EV closer to one indicates more accurate prediction performance.
$ \operatorname{var}\;\left(\;\right) $
of MATLAB. RMSE and MAE are absolute error, while MAPE and RMSLE are relative error. RMSLE and RMSE are similar, except that RMSLE is computed at the logarithmic scale, and thus the data size is ignored. For the best model, the expected values of RMSE, MAE, MAPE, and RMSLE are zero, and an EV closer to one indicates more accurate prediction performance.
4.2. Parameter settings
In this study, the sample data that come from the CSSE at Johns Hopkins University is the number of daily cumulative confirmed cases of 881 days from 22 January 2020 to 20 June 2022, where the samples of 861 days from 22 January 2020 to 31 May 2022, are used to train the model to compute the output weight matrix $ {W}_{out} $
, and then forecasting the total number of cumulative cases that are confirmed for the next 20 days from 1 to 20 June 2022, that is, the number of training and test samples are
$ {W}_{out} $
, and then forecasting the total number of cumulative cases that are confirmed for the next 20 days from 1 to 20 June 2022, that is, the number of training and test samples are $ {T}_{train}=861 $
and
$ {T}_{train}=861 $
and $ {T}_{test}=20 $
respectively.
$ {T}_{test}=20 $
respectively.
COVID-19 time series of daily cumulative confirmed cases is one-dimensional univariate. Therefore, for our model, the number of the input and output units is $ K=L=1 $
. The number of reservoir neurons is set as
$ K=L=1 $
. The number of reservoir neurons is set as $ N=800 $
. The reservoir starts with all zero network states, namely
$ N=800 $
. The reservoir starts with all zero network states, namely $ R\;(0)=\left(0,0,.\dots, 0\right) $
. According to the state forgetting property of the reservoir, the effects of the initial reservoir state have died out after
$ R\;(0)=\left(0,0,.\dots, 0\right) $
. According to the state forgetting property of the reservoir, the effects of the initial reservoir state have died out after $ {T}_{initial} $
steps so that an initial transient of
$ {T}_{initial} $
steps so that an initial transient of $ 100 $
steps, namely
$ 100 $
steps, namely $ {T}_{initial}=100 $
, is discarded. Table 1 shows the assigned parameters.
$ {T}_{initial}=100 $
, is discarded. Table 1 shows the assigned parameters.
Parameter settings

4.3. Forecast results
In this study, the temporal evolution of daily cumulative confirmed cases from nine considered countries is predicted, including the United Kingdom, Canada, Italy, France, Australia, China, the United States, Spain, and Japan. In the following simulations, without special mention, all data of testing results are restored original scale according to the inverse function.
The training and test results of prediction confirmed cases in the nine countries are given in Figure 5. To observe the test results more clearly, the sub-graphs of Figure 5 illustrate the magnifying test results of forecasted confirmed cases based on the testing data of 20 days. Figure 6 represents the evolutions of the absolute percentage error (APE) of prediction confirmed cases with time during the testing period for nine countries. The errors APEs gradually increase with the increase of forecast days in most countries can be observed, while there are exceptions, such as Japan and the United Kingdom whose errors APEs fluctuate, as shown in Figure 6(f, h). This is because our research belongs to short-term forecasts. If the number of prediction days increases, the forecast errors will also increase. Overall, the prediction errors in APEs do not exceed 2% for all considered countries. The results exhibit good forecasting performance during the testing period.
The comparison results of actual and predicted confirmed cases during the training and testing period for nine countries.

The changes of APE of prediction confirmed cases with time during the testing period for nine countries.

Figure 7 illustrates the error histograms of forecasted confirmed cases for nine countries based on the testing data of 5, 10, and 20 days. The blue bar is the mean error of forecasted 20 days, namely predicting the mean error from 1 to 20 June 2022. The orange-red bar is the mean error of forecasted 10 days from 1 to 10 June 2022. The mean error of forecasted 5 days is expressed by the yellow bar, namely, testing means error from 1 to 5 June 2022. The results indicate that the United States has the largest absolute error on RMSE and MAE, as shown in Figure 7(a, b) because its basic real data are the largest, as shown in Figure 1. Australia has a relatively large relative error on MAPE and RMLSE, as shown in Figure 7(c, d). Although Australian relative error is the largest, the largest MAPE does not exceed 1%, as shown in Figure 7(c). The detailed evaluation indices of error for confirmed cases forecasting during the testing period are shown in Table 2.
The four testing error histograms of forecasted confirmed cases for nine countries for nine countries.

The evaluation indices of testing error for confirmed cases forecasting

So far, many methods of deep learning are used in forecasting the time series evolution of the COVID-19 epidemic. For the forecast results and errors, the comparison of the self-driven ESN model is carried out with the other deep learning prediction models which include standard RNN, bidirectional LSTM (BiLSTM), GRU, LSTM, and VAE [Reference Arora, Agrawal, Arora, Poonia and Madaan15]. Table 3 depicts the comparison results.
Comparative results for confirmed cases forecasting at the same time scale: our self-driven ESN model versus five other prediction models of deep learning
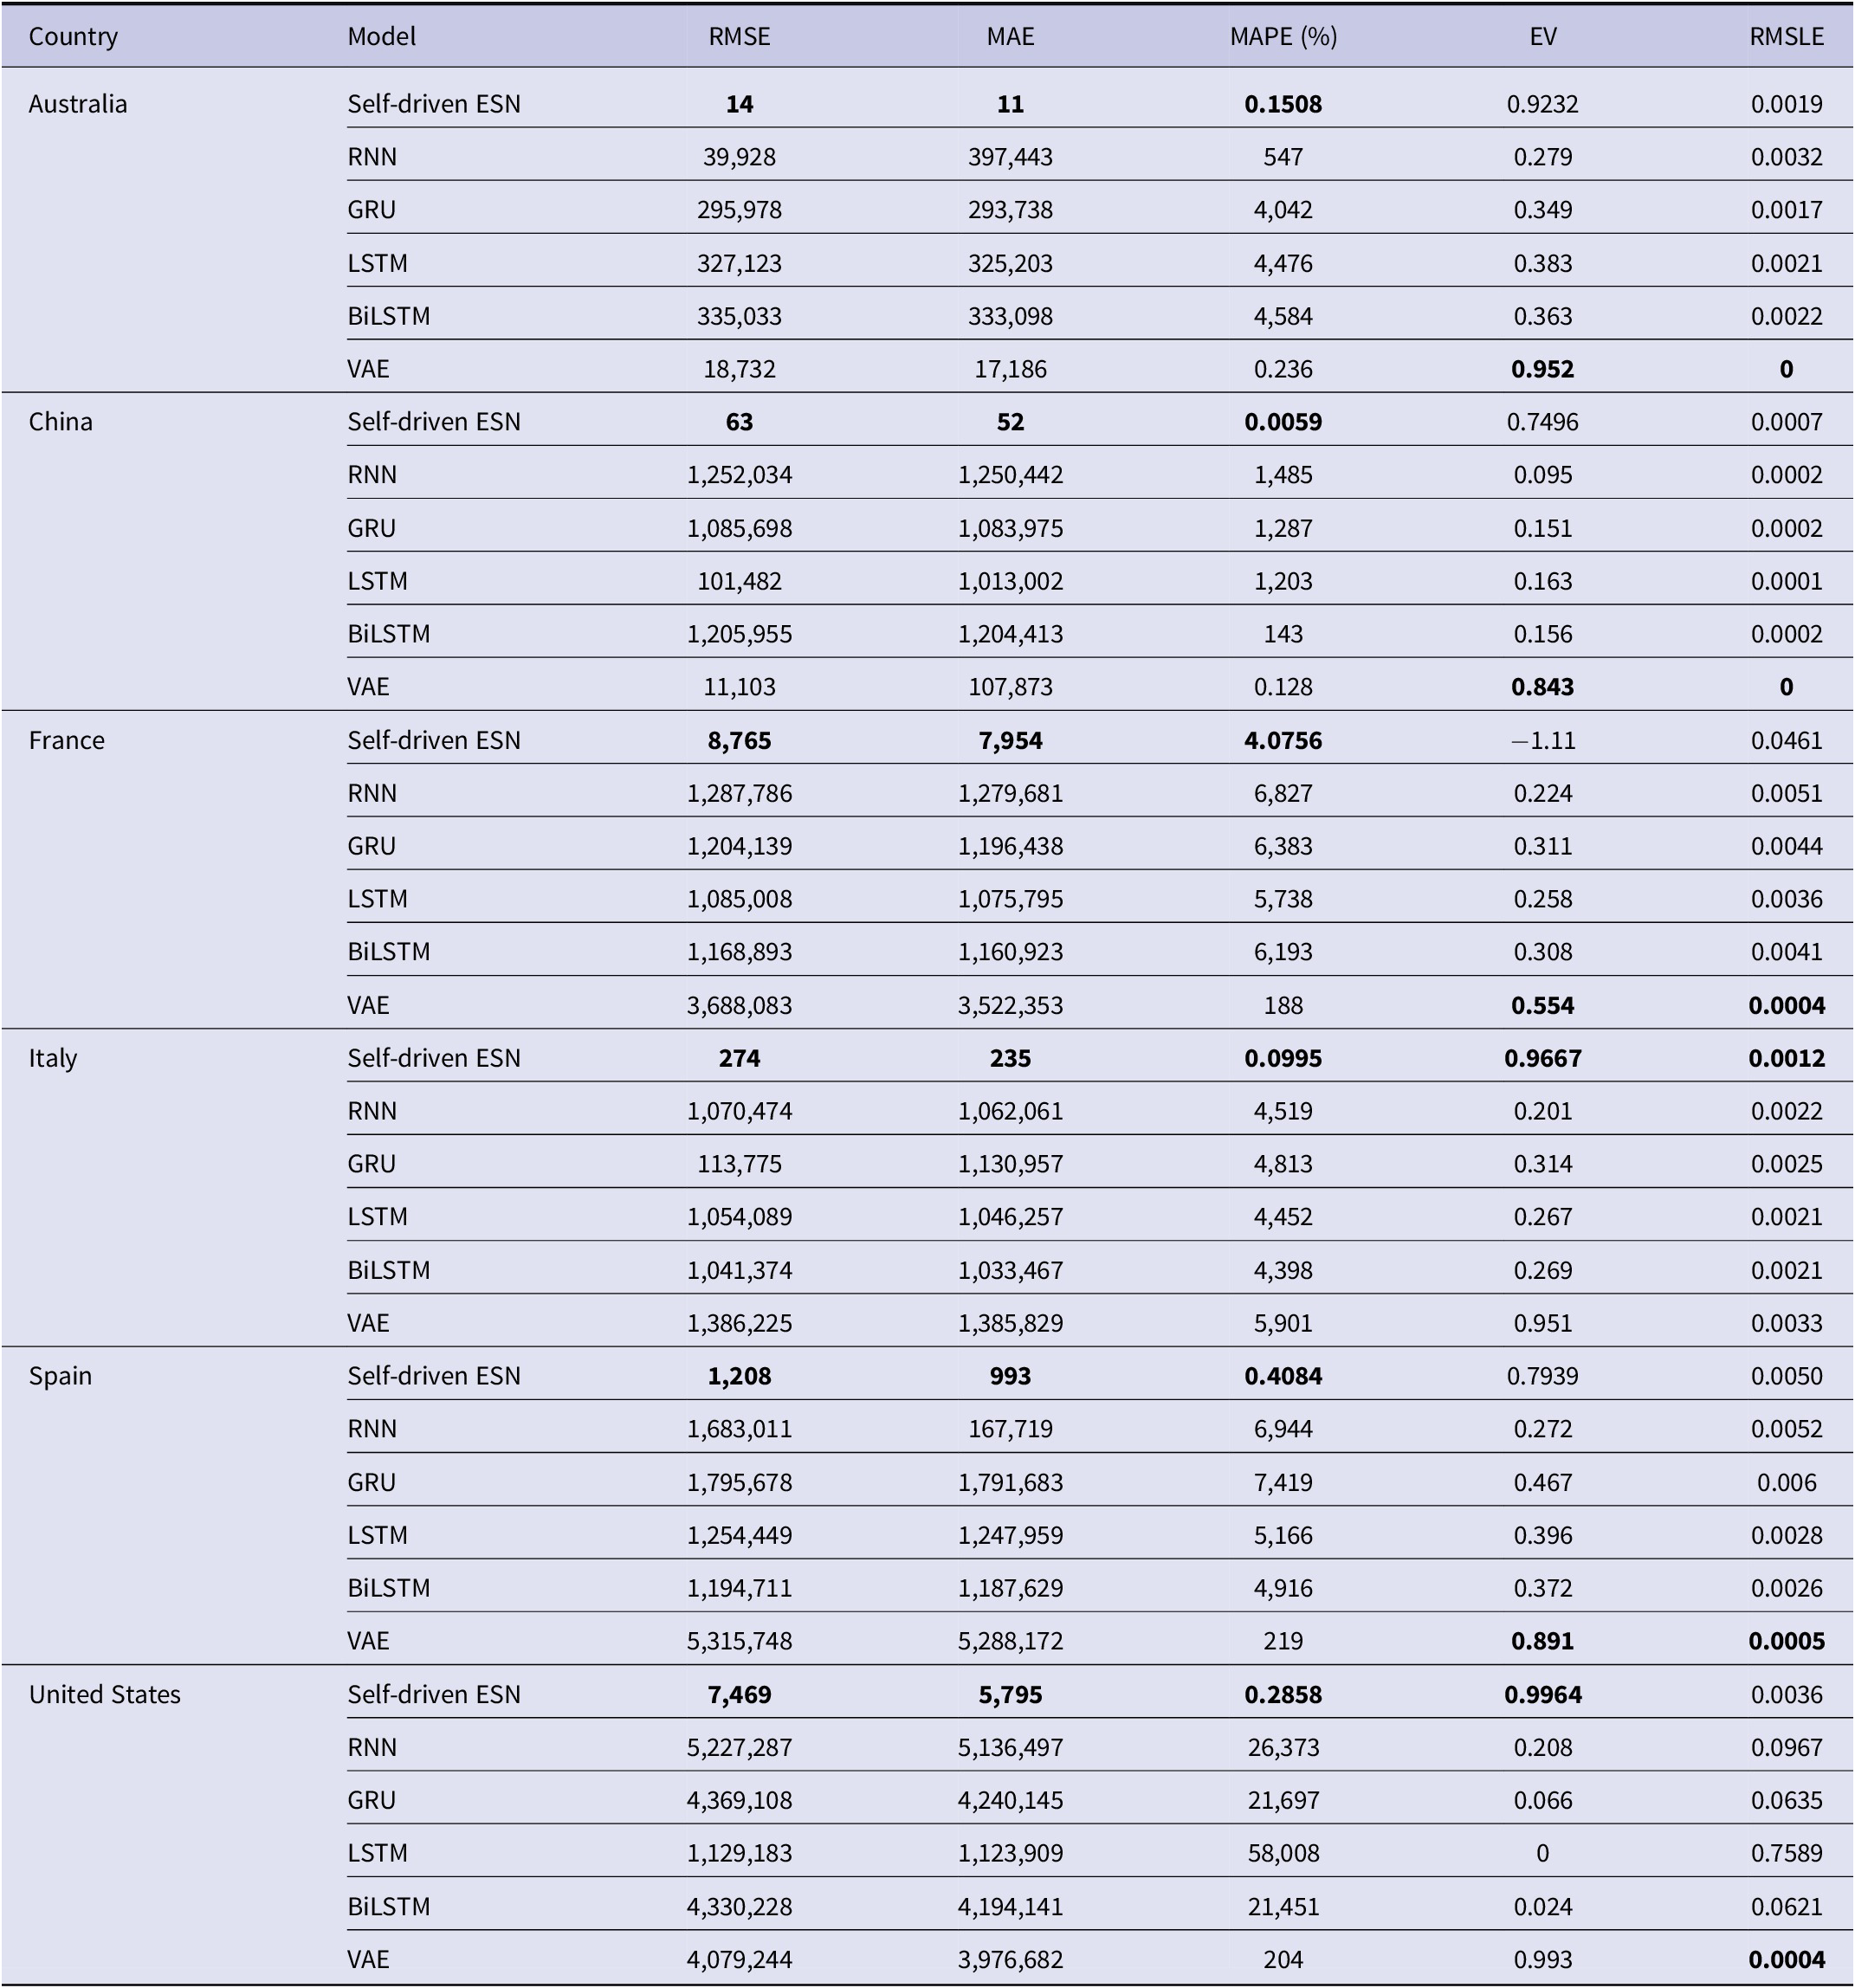
In the comparative simulation experiment, the model is trained and tested to forecast the time evolution of the cases which are confirmed at the time scale that is the same as the contrastive five methods. Training samples are the time series of 131 days from 22 January 2020 to 31 May 2020. Then, the number of cumulative confirmed cases is forecasted for the next 17 days from 1 to 17 June 2020, for six countries, including Australia, China, France, Italy, Spain, and the United States. Due to few training samples, in our model, the initial transient is set as $ {T}_{initial}=40 $
, namely the first 40 steps of the reservoir state are discarded. Other parameters remain unchanged. In Table 3, the best prediction results of the different evaluation indices are marked in bold among the six methods compared. It is obvious from the comparison results that our model has better predictive performance compared with other models in aspect of some performances, including MAE, MAPE, and RMSE, whereas the prediction accuracy of our model is even five orders of magnitude better than some models. However, in the aspect of EV and RMSLE, the performances of our model are sometimes slightly inferior to those of VAE.
$ {T}_{initial}=40 $
, namely the first 40 steps of the reservoir state are discarded. Other parameters remain unchanged. In Table 3, the best prediction results of the different evaluation indices are marked in bold among the six methods compared. It is obvious from the comparison results that our model has better predictive performance compared with other models in aspect of some performances, including MAE, MAPE, and RMSE, whereas the prediction accuracy of our model is even five orders of magnitude better than some models. However, in the aspect of EV and RMSLE, the performances of our model are sometimes slightly inferior to those of VAE.
4.4. Influences of model parameters
In this section, the impact of the parameters of the model on prediction performance is analysed. These parameters include the data scaling ratio, number of reservoir neurons, leakage rate, and spectral radius of the connection matrix, W.
To maintain the echo states of the network, the COVID-19 time series need to be squashed into a range $ \left[-1,1\right] $
. By training the model using training data, the time series evolution of the next 20 days is forecasted. In principle, the scaling factor
$ \left[-1,1\right] $
. By training the model using training data, the time series evolution of the next 20 days is forecasted. In principle, the scaling factor $ scale $
cannot be less than the growth rate of the predictive 20-day interval. However, the test data for the next 20 days are assumed to be unknown. Therefore, it is not easy to evaluate the value of
$ scale $
cannot be less than the growth rate of the predictive 20-day interval. However, the test data for the next 20 days are assumed to be unknown. Therefore, it is not easy to evaluate the value of $ scale $
.
$ scale $
.
The value range $ scale $
is kept from 1 to 60, and the other parameters remain unchanged. MAPE of forecast results of the number of confirmed cases based on the testing data of 5 days (pink line), 10 days (green line), and 20 days (blue line) are shown in Figure 8. We can observe that the prediction performance is very unstable when the value
$ scale $
is kept from 1 to 60, and the other parameters remain unchanged. MAPE of forecast results of the number of confirmed cases based on the testing data of 5 days (pink line), 10 days (green line), and 20 days (blue line) are shown in Figure 8. We can observe that the prediction performance is very unstable when the value $ scale $
is relatively small. This is because the training data are squashed into a range of
$ \left[-1,1\right] $
, while relatively small
$ scale $
is relatively small. This is because the training data are squashed into a range of
$ \left[-1,1\right] $
, while relatively small $ scale $
may induce that the inputs and outputs of self-driven ESN are greater than one during the test phase. This may affect the echo state of the network to lead to unstable prediction performance. When the value
$ scale $
may induce that the inputs and outputs of self-driven ESN are greater than one during the test phase. This may affect the echo state of the network to lead to unstable prediction performance. When the value $ scale $
is slightly larger, the optimal or suboptimal
$ scale $
is slightly larger, the optimal or suboptimal $ scale $
exists to optimize predictive performance. For the different countries, the optimal
$ scale $
exists to optimize predictive performance. For the different countries, the optimal $ scale $
is different, as shown in Figure 12(a).
$ scale $
is different, as shown in Figure 12(a).
The variation of predictive performance MAPE with increasing $ scale $
for confirmed cases forecasting for nine countries.
$ scale $
for confirmed cases forecasting for nine countries.

The impact of network size $ N $
is analysed, namely the number of reservoir neurons, on the testing error. The forecast results are displayed in Figure 9. We can see that a bigger network size does not always bring better results. Smaller or bigger network sizes may lead to under-fitting or over-fitting. For some cases, there is an optimal network size to improve prediction performance. However, for the different countries, the optimal network size is different. For example, the predicted performance does not change much when the network size continues to increase from 500 for China, as shown in Figure 9(c), and similar situations are also shown in Figure 9(g, i). The optimal network size for the different countries is collected in Figure 12(b).
$ N $
is analysed, namely the number of reservoir neurons, on the testing error. The forecast results are displayed in Figure 9. We can see that a bigger network size does not always bring better results. Smaller or bigger network sizes may lead to under-fitting or over-fitting. For some cases, there is an optimal network size to improve prediction performance. However, for the different countries, the optimal network size is different. For example, the predicted performance does not change much when the network size continues to increase from 500 for China, as shown in Figure 9(c), and similar situations are also shown in Figure 9(g, i). The optimal network size for the different countries is collected in Figure 12(b).
The change of MAPE with increasing the number of reservoir neurons $ N $
for confirmed cases forecasting for nine countries.
$ N $
for confirmed cases forecasting for nine countries.

The leakage rate $ \alpha $
is to control the update speed of the reservoir neuron states and satisfies
$ \alpha $
is to control the update speed of the reservoir neuron states and satisfies $ 0\le \alpha \le 1 $
. The larger the leakage rate is, the faster the update speed is. The smaller leakage rate means that the reservoir states at the previous time step have a greater influence on reservoir status updates at this moment. The influence of the leakage rate on forecast accuracy is studied, as shown in Figure 10. The optimal leakage rate is determined, which promotes predictive performance almost distributes between 0.2 and 0.4 for confirmed cases forecasting in nine countries, as shown in Figure 12(c). For the United States, in Figure 10(i), there is an optimal and a suboptimal value of the leakage rate, and the suboptimal value is close to 0.2.
$ 0\le \alpha \le 1 $
. The larger the leakage rate is, the faster the update speed is. The smaller leakage rate means that the reservoir states at the previous time step have a greater influence on reservoir status updates at this moment. The influence of the leakage rate on forecast accuracy is studied, as shown in Figure 10. The optimal leakage rate is determined, which promotes predictive performance almost distributes between 0.2 and 0.4 for confirmed cases forecasting in nine countries, as shown in Figure 12(c). For the United States, in Figure 10(i), there is an optimal and a suboptimal value of the leakage rate, and the suboptimal value is close to 0.2.
The change of MAPE with increasing leakage rate $ \alpha $
for confirmed cases forecasting for nine countries.
$ \alpha $
for confirmed cases forecasting for nine countries.

The influence of the spectral radius of the reservoir neurons connection matrix $ W $
on forecast accuracy is analysed. In principle, the spectral radius satisfies
$ W $
on forecast accuracy is analysed. In principle, the spectral radius satisfies $ \rho (W)<1 $
to hold the echo state of networks, but this condition is excessively restrictive. If a network has a weight matrix
$ \rho (W)<1 $
to hold the echo state of networks, but this condition is excessively restrictive. If a network has a weight matrix $ W\rho (W)\ge 1 $
, the echo state property can hold nonetheless if the input not containing the null input [Reference Dash, Chakravarty, Mohanty, Pattanaik and Jain18]. Therefore, in the simulation experiment, the spectral radius is set over
$ W\rho (W)\ge 1 $
, the echo state property can hold nonetheless if the input not containing the null input [Reference Dash, Chakravarty, Mohanty, Pattanaik and Jain18]. Therefore, in the simulation experiment, the spectral radius is set over $ \left(0,2\right) $
. Figure 11 illustrates the change of the test error MAPE with the enlargement of the spectral radius. In Figure 11, for most countries, the optimal spectral radius is closer to one, while prediction performances decrease with increasing the spectral radius when the spectral radius is greater than one. However, there are exceptions, as shown in Figure 11(g, i), and the larger the spectral radius, the better the forecast accuracy. The values of the optimal spectral radius to optimize prediction performance are shown in Figure 12(d).
$ \left(0,2\right) $
. Figure 11 illustrates the change of the test error MAPE with the enlargement of the spectral radius. In Figure 11, for most countries, the optimal spectral radius is closer to one, while prediction performances decrease with increasing the spectral radius when the spectral radius is greater than one. However, there are exceptions, as shown in Figure 11(g, i), and the larger the spectral radius, the better the forecast accuracy. The values of the optimal spectral radius to optimize prediction performance are shown in Figure 12(d).
The variation of MAPE with increasing spectral radius $ \rho (W) $
for confirmed cases forecasting for nine countries.
$ \rho (W) $
for confirmed cases forecasting for nine countries.

The optimal parameter to minimize the test error MAPE of confirmed cases forecasting for the next 20 days in nine countries.

The spectral radius reflects the short-term memory capacity of the network. The bigger spectral radius means that the short-term memory capacity of the self-driven ESN is longer, and vice versa. Figure 11(g, i) illustrates that the LSTM (or more historical information) can help the self-driven ESN to better simulate and predict the future temporal information for Spain and the United State.
In a word, by analysing the impact of the model parameters (including the data scaling ratio, the number of reservoir neurons spectral radius of the connection matrix of reservoir neurons) on prediction performance and leakage rate, these parameters can be set adaptively as an appropriate value or in an appropriate range to reduce the prediction error of the self-driven ESN model.
5. Conclusion
The COVID-19 pandemic has negatively affected public health and economic development all over the world and brought heavy burdens to healthcare systems in many countries. In our study, the data self-driven ESN is established to predict the COVID-19 time series. The data self-driven ESN was created to form the closed feedback loop by replacing the input with the output. The nine different countries are selected to forecast the time evolution of daily cumulative confirmed cases. By comparison with other deep learning forecasting models at the same time scale, our model showed excellent prediction performances. Moreover, the influence of the model parameters on forecast accuracy is analysed, and found that the forecasting error can be reduced by selecting the appropriate data scaling ratio, the number of reservoir neurons, the leakage rate, and the spectral radius of the connection matrix of reservoir neurons.
To summarize, through the present study, appropriate parameters can be adaptively selected to improve the forecast accuracy of the self-driven ESN model. The results could help governments or medical institutions to monitor the current situation and to take opportune precautionary strategies to prevent further spread. Additionally, this study is not only limited to the prediction of the COVID-19 epidemic but also applicable to other nonlinear time series prediction problems. It failed to extract the actions taken by the government that prevent to analyse the total death and cured cases. It did not validate the result with non-parametric models that extract the uncertainty issue obtained in the prediction process. Even though, various achievements have been made, several enhancements will be made in the future for the betterment of this work, which includes the development of a novel technique to detect COVID-19 cases in a short time, thereby accessing the performance enhancement. Furthermore, it extended to consider the list of predicted and mortality cases from an individual country regarding COVID-19 pandemic.
Data availability statement
The data that support the findings of this study are available from the corresponding author upon reasonable request.
Author contribution
WW, QL and JW authors agreed on the content of the study. WW, QL and JW collected all the data for analysis. JW agreed on the methodology. WW, QL and JW completed the analysis based on agreed steps. Results and conclusions are discussed and written together. All authors read and approved the final manuscript.
Funding
Supported by the National Key Research and Development Program of China [grant number 2022YFF0607400]; the National Natural Science Foundation of China [grant numbers 61971048, 61876132, and 61473208]; R&D Program of Beijing Municipal Education Commission [grant number KM202011232005]; and Beijing Scholars Program.
Competing interest
The authors declare no conflict of interest.
Ethical standard
This article does not contain any studies with human or animal subjects performed by any of the authors. Informed consent was obtained from all individual participants included in the study.


 Open access