

Introduction
Breeds of animals indigenous to the arid and semi-arid regions are known for their capacity to endure several days of water deprivation. This ability offers the advantage to graze far away from watering sites and thus exploit the meagre desert pasture evenly and efficiently (Brosh et al., Reference Brosh, Chosniak, Tadmore and Shkolnik1986; Nicholson, Reference Nicholson1987), but it also involves a strain on the homeostatic mechanisms of the animals.
Desert-adapted goats seem to endure dehydration most efficiently among small ruminant species (Silanikove, Reference Silanikove1994) but the strategy varies among breeds. The black Bedouin goat, which withstands up to 4 days of water deprivation, can store water in the rumen and maintain a large extracellular volume when fully hydrated (Chosniak et al., Reference Chosniak, Wittenberg, Rosenfeld and Shkolnik1984). The black Moroccan goat, on the other hand, employs a low water turnover (Hossaini-Hilali et al., Reference Hossaini-Hilali, Benlamlih and Dahlborn1994). A third example is the indigenous Saudi Arabia goat, which reduces feed intake and increases rectal temperature as a mechanism to economise on water (Alamer, Reference Alamer2006).
Most previous studies have been conducted with some restriction of the animals’ space, pre-determined feeding conditions and repeated measurements during single periods of water deprivation (e.g. Ali and Mirghani, Reference Ali and Mirghani1983; Maltz and Shkolnik, Reference Maltz and Shkolnik1984; Misra and Singh, Reference Misra and Singh2002). In the husbandry practice of the arid and semi-arid regions of the tropics, however, animals go out to pasture daily and several days may pass between watering occasions with no apparent ill effects to the animals. The Ethiopian Somali pastoralists, for example, reported bringing their sheep and goats to water sources only every 5 to 8 days during the dry periods (Woldu, 1984; FARM-Africa, 1996). At pasture, animals can seek shade and rest during the hottest hours of the day to avoid the heat of the sun (Lewis, Reference Lewis1978), which may be one explanation why they endure long periods of dehydration. To our knowledge, there are no experiments that combine studies of intermittent watering in goats under arid and semi-arid husbandry conditions with physiological and behavioural registrations.
We hypothesised that Ethiopian Somali goats, which are subjected to regular repeated cycles of intermittent watering, adapt to the situation by employing physiological heat-defence mechanisms, storing water after drinking and changing their behaviour at pasture.
Material and methods
Location and climatic condition
The study was conducted at the Errer Valley Camel Research Station, Dire Dawa, Ethiopia during January and February 2005. The typical climatic condition is semi-arid with yearly rainfalls ranging from 400 to 500 mm. The long dry season occurs from October to the end of February (Tamire, Reference Tamire1986).
Animals and pre-experimental procedures
The short-eared Ethiopian Somali goat breed, characterised by its medium size, mainly white colour and short hair, was used. They are mainly kept under a pastoral management system (FARM-Africa, 1996). At the research station, a flock of 64 does were kept. They were let out on pasture daily but kept at the station during the night. After 2.5 months of lactation, 14 multiparous does with one kid each and that had kidded within a period of 11 days were selected from the available lactating does. The selection of animals was based on body weight and dentition of does (approx. 4 years old) as well as on uniformity of their kids. These does were separated from the flock, but let out on pasture every day as before along with their kids. When they returned to the station in the evening, they were led into a large outdoor enclosure. Dams were separated from kids and locked into individual outdoor pens and the kids were kept in two groups in separate pens.
During the following fortnight, four persons (the researcher and three others) followed the selected group and each person recorded the behaviour of one doe and her kid 2 days per week. In addition, two goat herders followed the flock and helped to observe behaviour. This was a training session for the persons involved in behaviour registration during the actual experiment.
Two days before the start of the actual experiment, an experienced person milked the does in the morning to determine the milk production level of individual animals. There is not much information about the milk production level of this breed. Therefore, only the left udder half and the morning milk was removed while the kids sucked the right udder half to facilitate milk let down and to avoid removing too much milk thereby jeopardising the growth of the kid. The does were watered starting at 1745 h on the 2 pre-experimental days.
The does were assigned to one of two watering treatments. One group would have water once per day (W1) and the other group once every 4 days (W4). They were grouped according to their body weight and milk yield of the previous 2 days. Body weight of dams was 23.9 ± 1.3 kg (W1) and 24.3 ± 1.3 kg (W4), respectively. The average milk yield in groups W1 and W4 was 65 ± 2.0 and 65 ± 2.0 ml per left udder half per morning, respectively.
Animal management and procedures during the experiment
At the start of the experiment, the does completed 3 months of lactation. The total duration of the experiment was 32 days, which was divided into four consecutive periods of 8 days each. The same routines were followed every day except for that measurements were taken during the first 4 days of the respective periods followed by 4 days without sampling before the next period commenced.
Watering regime
Water was given once every evening to W1 and once every 4th day to W4. The water was distributed separately to each does in their pen starting at about 1745 h. W1 does were offered 3 l while W4 does were offered 5 l at each watering occasion. The does were closely observed during the following 15 min and additional water was given to those does that seemed to finish the initially offered amount. After about 30 min, the water buckets were removed one at a time and the volume left was measured. That volume was subtracted from the total amount given in order to determine water intake.
Grazing, supplement feeding and housing
During the experiment, the animals were let out on pasture at 0900 h and at 1215 h; they were brought back to the station and led into the large outdoor enclosure. They were free to walk into the pens (2 m × 1.5 m × 2 m high), which each had a roof lightly covered with grass that provided shade. At 1315 h, they were let out for afternoon grazing. At 1645 h, the animals returned to the station and locked into their individual pens. After watering, each doe was supplemented with 300 g of concentrates.
Sample collection
Blood samples were collected from the jugular vein with vacutainers starting at 1715 h. The samples were immediately transferred to an icebox in which they were kept cool and transported to Haramaya University. For measurements of plasma osmolality and total plasma protein concentration, 5 ml of blood was collected in a tube containing Li-heparin. Blood samples were centrifuged at 4°C for 10 min at 3000 r.p.m. (model K40R series, Centurion Scientific Ltd; West Sussex, UK) and the plasma was transferred into a pre-cooled tube. The measurements were taken on the same day. For vasopressin analysis, 10 ml of blood was collected into tubes containing K3-EDTA. After centrifugation at 4°C for 20 min at 3000 r.p.m., plasma was transferred into three pre-cooled plastic tubes and stored at −20°C. All tubes were transported frozen to Sweden where they were stored at −70°C until analysis.
It is well established that milk osmolality follows that of blood plasma (Linzell and Peaker, Reference Linzell and Peaker1971) when the samples are taken at the same time. In the present study, we were interested to follow changes in osmolality twice daily. For practical reasons, blood samples were therefore taken in the evening and milk samples in the morning. During grazing hours, the kids followed the dams and were freely suckled. Starting at 1645, dams were separated from the kids. In the morning the left udder half of the does was milked between 0800 and 0830 h while the kids were sucking the right. After milking, the milk volume of the individual does was measured using a graduate glass cylinder and a sample of 10 ml milk was taken in a plastic tube for analysis of milk osmolality. The milk samples were kept cool until they were transported to Haramaya University and analysed on the same day. It was observed that the kids sucked both udder halves at pasture and that both halves maintained the same size. This implies that the milk production from the two halves was similar. The daily milk production of the doe was estimated by multiplying the milked volume by 2 and dividing this volume by the number of minutes the dams were separated from the kids (15 h × 60 min = 900 min) and then multiplying that number by 1440 min to get 24 h milk volumes.
Plants that were commonly found and eaten by the goats were identified by closely observing them at grazing during periods 1 and 2. During period 3, representative samples of the identified plant parts were collected from the entire grazing area and each sample was kept in a labelled cloth bag. The samples were transported to the laboratory and dried on the same day in an oven at 100°C for 24 h to determine dry matter (DM) content. The DM content of the plant species collected was grass species 828 g/kg fresh matter (FM), shrub species 423 g/kg FM and cactus (O. ficus-indica) 270 g/kg FM.
Laboratory analyses
Plasma and milk osmolality was determined by freezing point depression (μ OSMETTETM model 5004 automatic osmometer; Precision System Inc., Natick, MA, USA). Total plasma protein concentration was measured on a TS refractometer (American Optical, Buffalo, NY, USA).
Plasma arginine vasopressin was analysed by radio-immunoassay (RIA). The assay was validated for caprine plasma by showing that dilutions of the plasma were parallel to the standard curve. Before analysis, the plasma was extracted with acetone (GR; Merck, Darmstadt, Germany) and petroleum benzene (Merck, Darmstadt, Germany) with a recovery rate of 75%. It was analysed using the Vasopressin RIA (Euro-Diagnostika AB, Ideon, Malmö, Sweden). The cross-reaction of the antibody against Arg8 vasopressin with oxytocin was <0.1%. The minimum detectible value was 0.348 pmol/l. The intra-assay coefficient of variance was <10% (2.4–60.0 pmol/l) and the inter-assay coefficients of variance were 7.2%, 3.5% and 8.5% at 3.6, 15.8 and 31.2 pmol/l, respectively.
Rectal temperature and body weight
The rectal temperature (T r) was measured twice daily starting at about 0800 h in the morning and at 1715 h in the afternoon. The T r was measured by inserting a digital rectal thermometer into the rectum of the animal. Ambient temperature and relative humidity were measured at 0800 and 1715 h on each sampling day by a thermo-hygrometer in the shade (Table 1). Animals were weighed before watering on the sampling days.
LSM and s.e. for ambient temperature (°C) and relative humidity (%) at the station during the experiment
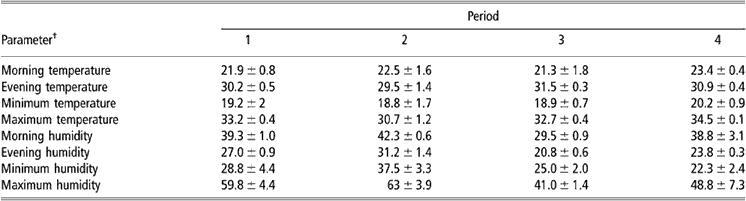
†Measured at 0800 and 1715 h.
Behaviour
The behaviour of the does was studied when they were out on pasture at an interval of every 5 min between 0930 to 1200 h in the morning and 1400 to 1630 h in the afternoon. The behaviour was recorded according to the two general categories, feeding pattern and location (Table 2). During the first three periods, the behaviours of two randomly taken does at each period from each treatment were studied. Since each group consisted of seven animals, one doe previously involved in the study was randomly picked to form a pair with the remaining goat at period 4. Each one of the four trained persons was assigned to one of the goats and followed this animal during the respective period. The persons were provided with a stopwatch set to sound every 5 min, which resulted in a total of 60 possible observations per animal and day. When the goats were eating cactus at the time of observation, it was recorded as ‘FC’, for all other plants consumed ‘F’ was written in the recording sheet.
Category and definition of registered behaviours in lactating Ethiopian Somali goat watered once every day or once every 4th day

Statistical analysis
Data were analysed using the Statistical Analysis Systems Institute (2005) software. Within each period, the effects of group, day and their interaction were assessed. The repeated measurement ANOVA (procedure MIXED) was employed for the physiological variables. When significant, pairwise comparisons of values were tested for significance with a Bonferroni correction for multiple comparisons. All values are presented as least-square means (LSM) ± s.e. The significance level was set at P < 0.05.
Individual behavioural observations of the W4 goats were evaluated against the overall mean of the W1 group. Both the feeding and position behaviours of the W1 group were uniform during the sampling days. To obtain the overall mean of the W1 group, the mean value of the animal used during two periods was first calculated. This mean was used with the observations of the other six goats to calculate the overall mean. The time during which the goats were observed to eat cactus was calculated as percentage of total feeding time. Three standard deviations (3 s.d.) from the overall mean of W1 was set as a reference point to decide whether a particular behaviour was affected by the water deprivation in the W4 group and whether the goats consumed more cactus with increasing days of water deprivation.
Results
Water consumption, intake of concentrate and body weight change
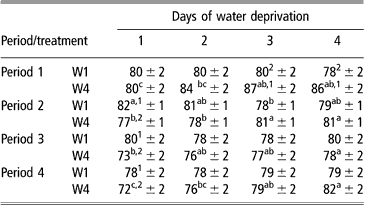
The W4 group consumed larger volumes of water at each watering occasions as compared with W1 (P < 0.001; Table 3), but when the volumes of water were calculated as means per day in each period, the W1 consumed more water than the W4 (periods 1 and 2, P < 0.01; periods 3 and 4, P < 0.001). Water intake per kilogram metabolic body weight was also higher in W1 as compared with W4 (periods 1 and 2, P < 0.01; periods 3 and 4, P < 0.001). The W4 group drank numerically smaller volumes of water during periods 2 and 3 as compared with period 1 and the amount consumed at period 4 was significantly smaller compared with the other periods (P < 0.001). Thus, the amount of water needed to replenish the lost body water decreased with repeated cycles of water deprivation. Both groups consumed all the concentrate on all days.
LSM and s.e. (n = 7) for total and calculated water intake at watering occasion (ml) of lactating Ethiopian Somali goats watered once every day (W1) or every 4th day (W4)

Means within the same row with different superscript letters (a–c) differ. Means within the same column and under the same parameter with different numeric superscripts (1 and 2) differ.
The body weight in the W1 group was similar between days within period (Figure 1). In W4, the body weight decreased with increasing days of water deprivation. It was lower on day 4 during period 1 (P < 0.05) and period 2 (P < 0.01) and on days 3 and 4 during period 4 (P < 0.05) as compared with that on day 1 during the respective periods. The W4 goats weighed significantly less than the W1 on the 4th day during periods 1 and 2 (P < 0.05). The temporary body weight loss in the W4 group decreased with repeated periods of water deprivation.
Body weight in lactating Ethiopian Somali goats during four repeated cycles of intermittent watering. Numbers on the x-axis denote the first 4 days in each 8-day period. W1 = does watered once every day. W4 = does watered once every 4th day. *P < 0.05, comparison between W1 and W4.

Plasma osmolality
The plasma osmolality in the W1 group was similar on the days within a period. It fluctuated between 307 ± 2 and 312 ± 2 mosm/l (period 1), 308 ± 2 and 312 ± 2 mosm/l (period 2), 304 ± 2 and 309 ± 2 mosm/l (period 3) and 301 ± 1 and 305 ± 1 mosm/l (period 4) (Figure 2a). In W4, the plasma osmolality reached the highest value of 336 ± 2 mosm/l on the 4th day during period 1, after which values on the 4th day of water deprivation increased less with repeated periods (Figure 2a). Comparison between groups revealed that plasma osmolality in W4 was higher than that in W1 on day 2 at period 1, on day 3 at periods 1 and 2 and on day4 at periods 1, 2 and 3, but not at period 4. Following the days of drinking, the plasma osmolality in W4 fell significantly lower than that in the W1 group and this difference was accentuated with repeated cycles (Figure 2a).
Plasma (a) and milk (b) osmolality in lactating Ethiopian Somali goats during four repeated cycles of intermittent watering. *P < 0.05; **P < 0.01; ***P < 0.001, comparison between W1 and W4. For explanations of numbers on x-axis and abbreviations, see Figure 1.

Milk osmolality
Milk osmolality in W1 fluctuated between 294 ± 3 and 305 ± 3 mosm/l (period 1), 291 ± 2 and 298 ± 2 mosm/l (period 2), 293 ± 2 and 298 ± 2 mosm/l (period 3) and 292 ± 2 and 298 ± 2 mosm/l (period 4) (Figure 2b). It was similar between days within period except that the milk osmolality on day 1 during period 1 was higher than that on day 3. In W4, the highest value was 343 ± 3 mosm/l on the 4th day of water deprivation during period 1, but the value on the last day of water deprivation became lower with repeated cycles (Figure 2b). The lowest value recorded was 280 ± 2 mosm/l during period 4 on the day after drinking (Figure 2b). Comparison between groups showed that the milk osmolality in the W4 group was higher than that in the W1 group except on day 1 during periods 1 and 2 and on day 2 during period 4 (Figure 2b).
Milk yield
The mean milk yields of W1 during periods 1, 2, 3 and 4 were 69 ± 5, 61 ± 5, 66 ± 5 and 75 ± 5 ml, respectively, per left udder half and day. This was significantly higher than the corresponding milk yields of W4, which was 54 ± 5, 46 ± 5, 51 ± 5 and 60 ± 5 ml, respectively (P < 0.05, in all periods).
Plasma vasopressin concentration
In W1, the highest plasma vasopressin concentration recorded was 3.2 ± 0.4 pmol/l on day 1 during period 3. The lowest value recorded was 1.4 ± 0.8 pmol/l on day 3 during period 1 (Figure 3). In this group, the vasopressin concentration was not significantly different between days within periods. In W4, the vasopressin concentration increased sharply from 1.4 ± 0.8 to 10.0 ± 0.8 pmol/l and from 2.6 ± 0.9 to 9.2 ± 0.9 pmol/l during periods 1 and 2, respectively. During periods 3 and 4, the vasopressin concentration on the 4th day of water deprivation reached less than half the maximum concentration of periods 1 and 2 (period 3, 4.2 ± 0.4 pmol/l; period 4, 4.4 ± 0.6 pmol/l). Between-treatment comparisons revealed that the vasopressin concentration on the days after drinking was similar between W1 and W4 except during period 3 when it was lower in W4. Its concentration was higher in W4 than in W1 on day 2 during periods 1 and 2, on day 3 during periods 1, 2 and 3 and on day 4 during all periods (Figure 3).
Plasma vasopressin concentration in lactating Ethiopian Somali goats during four repeated cycles of intermittent watering. *P < 0.05; **P < 0.01; ***P < 0.001, comparison between W1 and W4. For explanations of numbers on x-axis and abbreviations see Figure 1.

Total plasma protein concentration
In W1, the plasma protein concentration did not change over days within period except that its concentration on day 3 at period 2 was lower than that on day 1 (P < 0.05; Table 4). In W4, the concentration increased as water deprivation proceeded. Hence, its value on the 4th day during all periods and that on the 3rd day during periods 1, 2 and 4 was higher than that on day 1 during the respective periods (P < 0.05). Comparison between groups revealed that the total plasma protein concentration in W4 on days 3 and 4 during period 1 was higher than that in W1 on the same day (day 3, P < 0.05; day 4, P < 0.01). During the subsequent periods, the plasma protein concentration did not increase more in W4 compared with W1, but it was lower in W4 on the days after watering.
LSM and s.e. (n = 7) total plasma protein concentration (g/l) of lactating Ethiopian Somali does watered once every day (W1) or every fourth day (W4)
Means within the same row with different superscript letters (a–c) differ. Means within the same column and in the same period with different numeric superscripts (1 and 2) differ.
Rectal temperature
In both groups, the afternoon rectal temperature T r was on the average 3.5°C higher than in the morning (Figure 4). The lowest T r in the morning was observed on day 1 in period 3 when it measured 35.6 ± 0.2°C in both groups. The minimum temperature during the preceding night was 17.9°C. The highest mean T r in the afternoon was 40.7 ± 0.1 and 40.9 ± 0.1°C in W1 and W4, respectively, on the 4th day during period 1. The maximum temperature in the shade that day was 32°C. In W4, the greatest range was observed in one animal that had a morning T r of 35.0°C and an afternoon T r of 40.3°C during the same 24 h. It was 35.1°C in the morning and 41.0°C in the afternoon in one of the W1 goat during the same period as in W4, but on a different day.
T r at 0800 h (curve below) and at 1715 h (curve above) in lactating Ethiopian Somali goats during four repeated cycles of intermittent watering. *P < 0.05; **P < 0.01; ***P < 0.001, comparison between W1 and W4. For explanations of numbers on x-axis and abbreviations see Figure 1.

Comparison between treatments revealed that the morning values in T r were higher in W4 compared with W1 on day 3 during periods 1 and 3 and on day 4 during period 1. The afternoon T r in W4 was significantly higher than that in W1 on days 2, 3 and 4 during period 1 and days 2 and 4 during period 2 (Figure 4). Even though the T r in W4 remained slightly higher during periods 3 and 4, the difference was not significant between the two groups.
Behaviour
The total observations of each animal per day would theoretically be 60, but some values were missed and the results are therefore given as percent with 60 equivalent to 100%.
The W1 goats on average spent 87% of the available time grazing at the pasture (Figure 5a; line  ) and they were observed to consume cactus for about 3% of that time (Figure 5b; line ). The W4 goats spent about 80% of the available time grazing on days after drinking during all periods. During periods 1 and 2, all the W4 goats studied grazed less time compared with the reference group (W1) on the 3rd and 4th days of water deprivation (Figure 5a). One of the two goats decreased its feeding time already on the 2nd day of water deprivation. During period 3, the two observed goats decreased the time spent feeding only on the 4th day of water deprivation. At period 4, one goat decreased the time spent feeding on the 3rd and the other on the 4th day of water deprivation, but they were spent more of the time feeding cactus (Figure 5b).
Percent total feeding time (a) and time spent feeding cactus as percentage of the total feeding recorded (b) in lactating Ethiopian Somali goats during four repeated cycles of intermittent watering. The -line denotes the LSM of seven goats watered once daily and the horizontal lines in the graph are 3 s.d. from that mean. The black and white bars represent the goats watered once every 4th day. In each period, two goats from each group were studied daily. One of the goats was studied both at periods 1 and 4 (↓). Bars not reaching the 3 s.d. line (Figure 5a) and those passing it (Figure 5b) show days when behaviour of the dehydrated goats deviated from the control group. Numbers on the x-axis denote the first 4 days in each 8-day period (LSM: least-square means).

The W1 goats spread out in the field and grazed in the sun on average for nearly 70% of the hours at pasture (Figure 6). On the days after watering, most of the W4 goats stayed in the sun for 70% of the time at grazing, except the two goats during period 3. During periods 1, 3 and 4, all the W4 goats studied at the respective periods spent less time in the sun on the 3rd and 4th days of water deprivation. The percentage of time spent in the sun during these periods and days dropped below the critical value (−3 s.d.) set in relation to the mean value of the W1 group (Figure 6). During period 2, the time spent in the sun by one of the goats was above the critical point at all days, but the other goat spent less time in the sun on the 4th day of water deprivation. The W4 goats studied during periods 3 and 4 were observed to stay in the shade more often than during periods 1 and 2 and as compared with the daily watered group (Figure 6).
Time spent in the sun in lactating Ethiopian Somali goats during four repeated cycles of intermittent watering. Bars not reaching the 3 s.d. line show days when behaviour of the dehydrated goats deviated from the control group. For explanations of lines, symbols and numbers on x-axis see Figure 5.

Discussion
Animals living in arid and semi-arid environments are subjected to seasonal water scarcity and indigenous breeds have developed coping mechanisms, such as increasing core body temperature, storing water in the rumen and adjusting behaviour, to save the available water and efficiently utilise it (Schmidt-Nielsen et al., Reference Schmidt-Nielsen, Schmidt-Nielsen, Jarnum and Houpt1956; Macfarlane et al, Reference Macfarlane, Morris and Howard1963; Ostrowski et al., Reference Ostrowski, Williams and Ismael2003).
As observed in other goat breeds (Chosniak et al., Reference Chosniak, Wittenberg, Rosenfeld and Shkolnik1984; Maltz et al., Reference Maltz, Olsson, Glick, Fyhrquist, Silanikove, Chosniak and Shkolnik1984; Alamer, Reference Alamer2006), the Ethiopian Somali goat rapidly consumed large volumes when they were offered water following periods of water deprivation, but W4 goats did not drink as much water as could be expected by a summation of the daily water intake of W1. The W4 goats drank 65% during periods 1 and 2, 51% during period 3 and 47% during period 4 of the amount consumed by W1 during each period. Yet, the consumed volume of water was sufficient to compensate for the body weight loss during dehydration and indicates that the W4 group economised on water.
Changes in plasma osmolality support the hypothesis that W4 economised on water. Plasma osmolality rose with increasing days of water deprivation during period 1, which is in agreement with previous reports in sheep and goats (Abdelatif and Ahmed, Reference Abdelatif and Ahmed1994; Hossaini-Hilali et al., Reference Hossaini-Hilali, Benlamlih and Dahlborn1994; Alamer, Reference Alamer2006). In the beginning, the goats had not adjusted to scarcity of water and spent a considerable time in the sun and thereby lost much water by evaporation. This deprives the extracellular fluid including the plasma of water; thus plasma osmolality increased. As the cycles continued, however, the plasma osmolality increased less on the last day of dehydration simultaneously with a more pronounced dip in plasma osmolality on the 1st day after drinking. This indicates that the lactating Ethiopian Somali goat has the ability to store water in the extracellular space, similar to the black Bedouin goats (Chosniak et al., Reference Chosniak, Wittenberg, Rosenfeld and Shkolnik1984) and the lactating Moroccan goat (Hossaini-Hilali et al., Reference Hossaini-Hilali, Benlamlih and Dahlborn1994).
Increase in plasma protein concentration during water deprivation was observed in W4 and it has been reported in sheep (Igbokwe, Reference Igbokwe1993; Jaber et al., Reference Jaber, Habre, Rawda, Abi Said, Barbour and Hamadeh2004) and in other goat breeds (Dahlborn, Reference Dahlborn1987; Hossaini-Hilali et al., Reference Hossaini-Hilali, Benlamlih and Dahlborn1994). The day after drinking, the plasma protein concentration values dropped in W4, especially during periods 3 and 4, which indicate that the plasma volume increased. The changes in plasma osmolality and in plasma protein concentration suggest that the goats’ mobilised water-saving mechanisms as the intermittent watering schedule continued and can partly explain why W4 drank smaller volumes in the last period. The rise in the concentration of plasma protein in the water-deprived goats was expected as it maintains the colloid-osmotic tension of the blood under conditions of water stress (Khan et al., Reference Khan, Sasidharan and Ghosh1978).
Milk osmolality was higher than the plasma osmolality on the last day of dehydration. One explanation could be that the goats were fed concentrates in the evening and needed more water for digestion, which increased the osmolality of the body fluids as they became dehydrated. During the daytime, however, the dehydrated goats ate watery plants, spent more time in the shade, and thereby managed to keep the plasma osmolality relatively low.
Plasma vasopressin concentration increased about five-fold more in W4 on the 4th day of water deprivation during periods 1 and 2, but the rise was only about two-fold more in the last two periods. This could be expected in view of the lower plasma osmolality during these periods. However, the milk osmolality was very low on the morning after drinking. We did not measure urinary output, but frequent urination was not observed. In the dehydrated lactating Moroccan goat, plasma and milk osmolality were below control levels for 2 days after drinking, and their urinary osmolality did not fall (Hossaini-Hilali et al., Reference Hossaini-Hilali, Benlamlih and Dahlborn1994). This suggests that the two goat breeds have similar capacity to dilute the extracellular fluid volume and yet keep the vasopressin concentration sufficiently high to concentrate the urine. The overall plasma vasopressin concentration was higher than that previously observed in male goats of this breed kept on a similar watering schedule but partly in the shade at the station in Errer Valley (Mengistu et al., Reference Mengistu, Dahlborn and Olsson2007). This could be expected because the goats in the present study lost more water both via the milk and by evaporation as they spent more time in the sun.
Changes in rectal temperature were measured in the morning and afternoon (Figure 4). The overall difference between the morning and afternoon rectal temperature was 3.5°C. This difference is close to that reported in N’Dama cattle (Greig and McIntyre, Reference Greig and McIntyre1979). Some goats in both W1 and W4 varied their diurnal rectal temperature by more than 5°C on certain days. The strategy employed by Ethiopian Somali goats, therefore, resembles that of the camel and the East African ungulates (Schmidt-Nielsen et al., Reference Schmidt-Nielsen, Schmidt-Nielsen, Jarnum and Houpt1956; Taylor, Reference Taylor1970a and Reference Taylor1970b), which have long been known for their capacity to allow body temperature to fluctuate. However, reports on East African haired sheep and goats showed that these animals were not able to adjust their body temperature to such a large extent. Maloiy and Taylor (Reference Maloiy and Taylor1971) demonstrated that the animals increased their body temperature only by 1 to 2°C in response to heat stress. In contrast, the ability to vary the core body temperature appears to be one important strategy by which the Ethiopian Somali goats economise on water.
The changes in the physiological variables indicate that the strain on the fluid regulatory mechanisms was more severe during the first exposure to water deprivation than during the cycles that followed. This could be explained by the change in the goat behaviour. The W4 goats studied during periods 3 and 4 spent more time eating and were also observed to select plants with a high water content while staying in the shade. In this manner, the W4 group managed to partly compensate for the lack of drinking water during dehydration. Less volume of water was consequently needed to regain the temporary body weight loss in the last periods. The capability to continue feeding even during severe states of dehydration was also reported in the Bedouin goat (Brosh et al., Reference Brosh, Chosniak, Tadmore and Shkolnik1986). This could be one of the mechanisms by which the desert-adapted goats manage to cope with its environment.
When Bedouin goats and camels were watered every 2nd day and once a week, respectively, they maintained their milk production (Maltz and Shkolnik, Reference Maltz and Shkolnik1984; Dahlborn et al., Reference Dahlborn, Hossaini-Hilali and Benlamlih1992). The black Moroccan goats reduced their milk production immediately 24 h after water deprivation (Hossaini-Hilali et al., Reference Hossaini-Hilali, Benlamlih and Dahlborn1994). The Ethiopian Somali goat reduced their milk production immediately at the beginning of water deprivation similar to the black Moroccan goat, but the milk volume did not decrease further in the subsequent periods. However, only half of the udders were milked once daily in this study. Therefore, further work will be needed to characterise the milk production of the Ethiopian Somali goat during water deprivation.
In summary, the lactating Ethiopian Somali goats adapted to the water shortage with repeated cycles of water deprivation and tolerated 4-day cycles of intermittent watering during the dry period. We conclude that both more efficient storage as well as use of water, large diurnal variation of rectal temperature, adjustments in behaviour at pasture and lowered milk production are important mechanisms in combating water shortage in semi-arid habitats.
Acknowledgment
This work was supported by SIDA/SAREC – Haramaya University Ph.D. programme (U. Mengistu) and the Swedish Research Council – Medicine (project-3392 to K. Olsson). We thank Mr Ahmed Hassen, Mr Eyob Hailu, Mr Tibebu Tekle-Mariam and Mr Fassil Berhe for their meticulous help in behaviour data collection, Mrs Gunilla Drugge for the hormone analysis and Associate Professor Andrzej Madej for expert advice on statistics. We thank the farmers of the Errer Valley for their keen interest and participation in the research activities.


