


1. Introduction
Research into the causal effect of language on perception has been growing exponentially in recent decades. Much of this research strongly suggests the presence of linguistic influences on a variety of cognitive perceptual domains (Boroditsky, Reference Boroditsky2001; Lupyan, Reference Lupyan2012; Thierry et al., Reference Thierry, Athanasopoulos, Wiggett, Dering and Kuipers2009; Winawer et al., Reference Winawer, Witthoft, Frank, Wu, Wade and Boroditsky2007). However, previous studies have not clearly distinguished whether these perceptual effects are unique to language or are simply the result of general cross-modal interactions. Because of this uncertainty, some critics remain unconvinced that language can specifically drive perceptual differences (e.g., Pinker, Reference Pinker1994). Here, we address the question ‘Can language affect the nature of our perception?’ by examining how learning spoken words affects the perceptual discrimination ability of difficult-to-distinguish tactile stimuli. We aim to determine the specificity of this effect by comparing linguistic spoken word forms with acoustically matched, music-like auditory sound sequences.
Evidence of how language may shape our perceptions and cognitive representation has been accumulating for decades (Boutonnet et al., Reference Boutonnet, Dering, Viñas-Guasch and Thierry2013; Brown & Lenneberg, Reference Brown and Lenneberg1954; Kay & Kempton, Reference Kay and Kempton1984; Li et al., Reference Li, Casaponsa, Wu and Thierry2019; Maier et al., Reference Maier, Glage, Hohlfeld and Abdel Rahman2014; Thierry et al., Reference Thierry, Athanasopoulos, Wiggett, Dering and Kuipers2009; Vanek et al., Reference Vanek, Soskuthy and Majid2021). Often, the focus has been on how language creates individual categories, such as how we divide the spectrum of perceivable light into categories co-determined by language-specific color words (Mo et al., Reference Mo, Xu, Kay and Tan2011; Thierry et al., Reference Thierry, Athanasopoulos, Wiggett, Dering and Kuipers2009; Winawer et al., Reference Winawer, Witthoft, Frank, Wu, Wade and Boroditsky2007). Previous studies testing possible effects of new or known verbal labels on perception have also spanned various sensory domains, including visual (Athanasopoulos et al., Reference Athanasopoulos, Bylund, Montero-Melis, Damjanovic, Schartner, Kibbe, Riches and Thierry2015; Boutonnet et al., Reference Boutonnet, Dering, Viñas-Guasch and Thierry2013; Maier et al., Reference Maier, Glage, Hohlfeld and Abdel Rahman2014; Thierry et al., Reference Thierry, Athanasopoulos, Wiggett, Dering and Kuipers2009; Winawer et al., Reference Winawer, Witthoft, Frank, Wu, Wade and Boroditsky2007; Zhou et al., Reference Zhou, Mo, Kay, Kwok, Ip and Tan2010), auditory (Dolscheid et al., Reference Dolscheid, Shayan, Majid and Casasanto2013), olfactory (Vanek et al., Reference Vanek, Soskuthy and Majid2021) and tactile perception (Miller et al., Reference Miller, Schmidt, Blankenburg and Pulvermuller2018; Schmidt et al., Reference Schmidt, Miller, Blankenburg and Pulvermuller2019). However, the documented language effects were mostly found in group comparisons between speakers of different languages, which are subject to confounds such as, but not limited to, differences in perceptual and cognitive skill and experience and/or in culture-specific experiences and background knowledge (Freundlieb et al., Reference Freundlieb, Ridder, Dobel, Enriquez-Geppert, Baumgaertner, Zwitserlood, Gerloff, Hummel and Liuzzi2012). Many influential studies have advanced our understanding of linguistic effects through carefully designed between-group comparisons of speakers with vastly different language backgrounds (e.g., Athanasopoulos et al., Reference Athanasopoulos, Bylund, Montero-Melis, Damjanovic, Schartner, Kibbe, Riches and Thierry2015; Boroditsky, Reference Boroditsky2001; Boutonnet et al., Reference Boutonnet, Dering, Viñas-Guasch and Thierry2013; Li et al., Reference Li, Casaponsa, Wu and Thierry2019; Winawer et al., Reference Winawer, Witthoft, Frank, Wu, Wade and Boroditsky2007), with some studies, like Athanasopoulos et al. (Reference Athanasopoulos, Bylund, Montero-Melis, Damjanovic, Schartner, Kibbe, Riches and Thierry2015), innovatively combining both between- and within-subject approaches by manipulating language context in bilinguals. Building on these foundations, other researchers have employed experimental learning strategies by randomizing participants into groups that underwent different linguistic training and exposure (Lupyan et al., Reference Lupyan, Rakison and McClelland2007; Maier et al., Reference Maier, Glage, Hohlfeld and Abdel Rahman2014; Vanek et al., Reference Vanek, Soskuthy and Majid2021; Zhou et al., Reference Zhou, Mo, Kay, Kwok, Ip and Tan2010), thereby minimizing the risk of between-group confounds. Only a handful of experiments have effectively excluded between-group and cultural confounds entirely by employing within-subject learning designs. In these studies, participants are trained on counterbalanced sets of stimuli under different conditions, and their ability to discriminate or to categorize these stimuli was subsequently tested, ensuring that the same participants learned and were tested on the same stimuli in varied contexts (Miller et al., Reference Miller, Schmidt, Blankenburg and Pulvermuller2018).
Early learning studies in infants have already shown that at 12 months, using unique labels to identify objects leads to enhanced recognition of said objects when compared with objects that were associated either with the same label or with the same musical tone sequence (LaTourrette & Waxman, Reference LaTourrette and Waxman2020). This is likely due to the fact that distinct names highlight differences among objects, and using the same name for several objects highlights commonalities for those objects and promotes categorization (Nguyen et al., Reference Nguyen, Henningsen-Schomers and Pulvermüller2024; Waxman & Markow, Reference Waxman and Markow1995). In one study, parents were given a book of six distinct monkey faces to read to their 6-month-old babies. Three months later, the infants who were read a monkey book with six distinct names for the six distinct monkeys were able to distinguish also among new, previously unseen monkey faces. The infants who were read a book with six monkey faces all simply labeled ‘monkey’ were unable to make such distinctions (Scott & Monesson, Reference Scott and Monesson2009). When comparing labels with tones, infants at 6 and 12 months were able to form object categories only for the objects that were paired with novel words but not for those which were paired with a sequence of tones (Fulkerson & Waxman, Reference Fulkerson and Waxman2007). This evidence shows that even infants are influenced by the consistency of labels to create categorization and conceptual representations of objects, and these labels should be language-like words. Research among adult participants has also shown that, for example, novel names associated with objects can alter categorical perception as measured by event-related-potentials (Maier et al., Reference Maier, Glage, Hohlfeld and Abdel Rahman2014) and lead to slightly faster category formation (e.g., Lupyan et al., Reference Lupyan, Rakison and McClelland2007; Maier et al., Reference Maier, Glage, Hohlfeld and Abdel Rahman2014); however, evidence of meaningful improvements of discrimination driven specifically by verbal language remains lacking.
Tactile discrimination has thus far not been widely used to test for causal effects on discrimination (Arun & Lazar, Reference Arun and Lazar2021; Connell & Lynott, Reference Connell and Lynott2010). However, we consider tactile discrimination to be an ideal modality for several compelling reasons: its intrinsic high resolution in differentiating among a wide range of sensory inputs, the ability of the human sensory system to identify subtle differences in tactile sensations – such as sharpness, temperature and texture – with remarkable precision, and the unique opportunities it offers for investigating the interplay between sensory perception and cognitive processes. These characteristics not only differentiate tactile from other sensory modalities but also underscore its potential in advancing our understanding of sensory discrimination and its underlying mechanisms. Complex tactile patterns are not easily discriminated nor described verbally. Take for example the Braille alphabet, which must be meticulously learned and requires great effort for one to be considered proficient. By using novel complex tactile patterns in an experimental setting, we can be sure that normal participants (who are not Braille readers) are not used to discriminating among the stimuli (here, specific minimally different vibro-tactile patterns similar to Braille letters) so that stimulus familiarity can be perfectly controlled in an experiment addressing pattern discrimination and, potentially, the influence of language on perception. If language exerts a causal effect on learning, the pairing of verbal labels with a set of minimally, but borderline-perceptibly different tactile patterns, may facilitate the learning of the perceptual difference and thus influence discrimination ability. In our previous work (Miller et al., Reference Miller, Schmidt, Blankenburg and Pulvermuller2018; Schmidt et al., Reference Schmidt, Miller, Blankenburg and Pulvermuller2019), we indeed found evidence that language has such an effect of making previously imperceptible or borderline perceptible discrimination possible.
Associating a specific tactile pattern with a specific spoken verbal utterance, such as ‘fromp’, which is a ‘pseudoword’ with no meaning in the language(s) of the tested individuals while conforming to the phonological rules of their first language, improves discrimination of the pattern from other similar tactile patterns. At the same time, associating a slightly different tactile pattern to a different pseudoword, such as ‘gnarf’, appears to help the learner to realize that, though they share commonalities, these two tactile patterns are indeed distinct. Using unique labels for unique tactile percepts presented with a 70% probability of concordance in a learning experiment administered over several days has shown that, compared to exposure to patterns co-presented variably and randomly with a range of different pseudowords, tactile perception improves when each tactile pattern is preferentially paired with one label (Miller et al., Reference Miller, Schmidt, Blankenburg and Pulvermuller2018).
In brief, the most convincing evidence for influences of language on perception comes from well-controlled within-subject designs, where all subjects experience matched experimental conditions. We thus set out to study whether a ‘Whorfian condition’ of spoken words, as opposed to a ‘non-Whorfian condition’ consisting of non-linguistic auditory stimuli, such as musical sequences, can causally affect perceptual discrimination. We chose musical sequences as our control condition following established practice in language acquisition research (Fulkerson & Waxman, Reference Fulkerson and Waxman2007; Perszyk & Waxman, Reference Perszyk and Waxman2018), where tonal sequences provide an ideal control as they match speech in their auditory and temporal properties while lacking linguistic structure. This strategy allowed us to test whether any consistent cross-modal associations can enhance discrimination, or whether this effect is specific to language. Our investigation builds on the Whorfian tradition of examining how language shapes perception and cognition (Whorf, Reference Whorf1940, Reference Whorf1944, Reference Whorf and Carroll1956), but differs from classical studies that focus on established linguistic categories in different languages. Instead, we examine whether newly learned signs exert an influence on perceptual discrimination. We used a within-group design, exposing participants to minimally different tactile patterns paired with either verbal or musical stimuli and examined whether the presence of these ‘labels’ as irrelevant contexts changed our subjects’ ability to recognize minimal differences between the tactile stimuli (see Table 1). The hypothesis of language-perception causality, briefly, LaPeC (Miller et al., Reference Miller, Schmidt, Blankenburg and Pulvermuller2018; Schmidt et al., Reference Schmidt, Miller, Blankenburg and Pulvermuller2019) – which posits a direct causal influence of language on perception – predicts that meaningless verbal labels will lead to enhanced perceptual discrimination of minimally different tactile patterns in the Whorfian linguistic context, but that non-verbal musical sequences will not show an advantage.
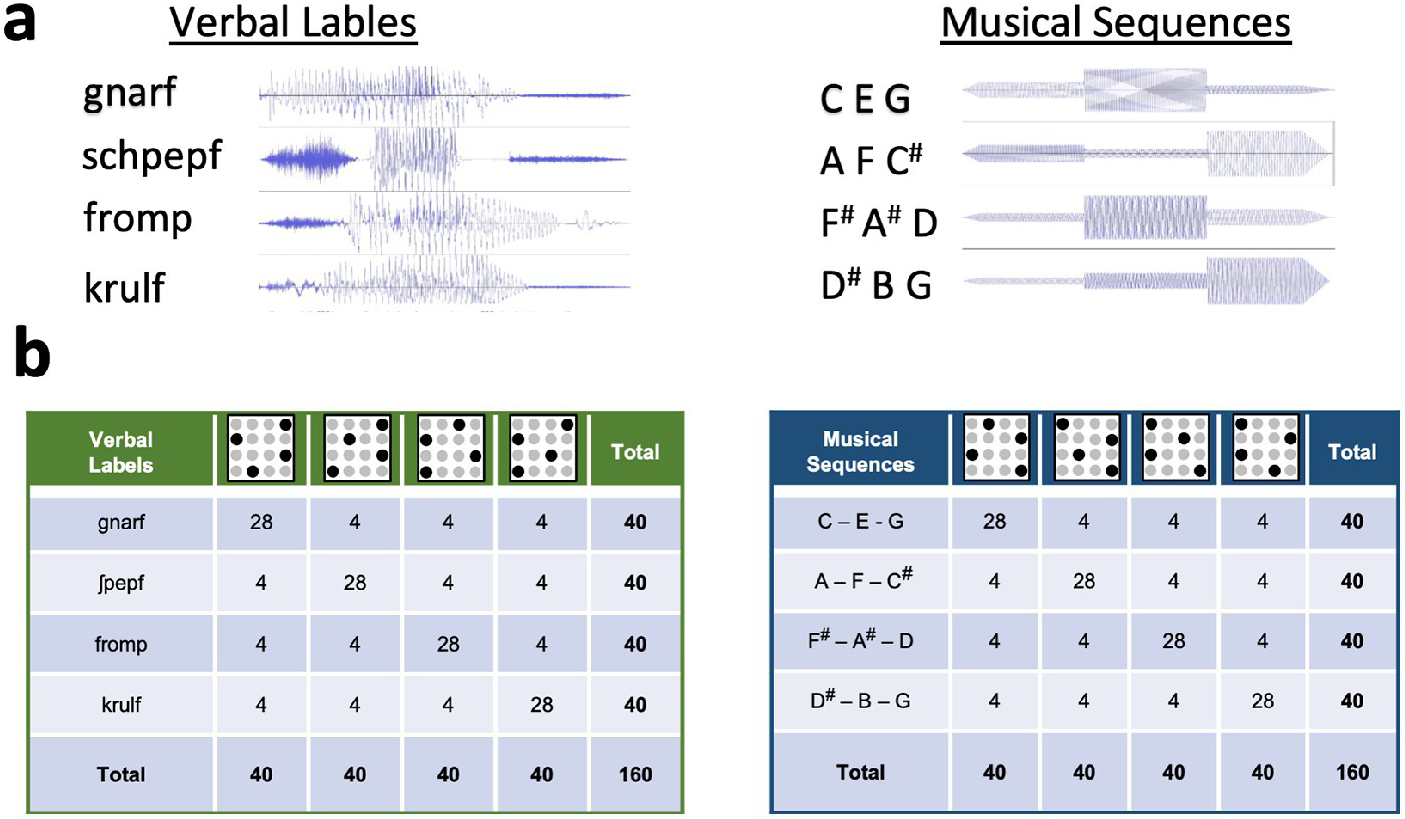
Acoustic wave forms and stimulus pairings. a, Acoustic wave forms of verbal labels (left) and musical sequences (right). Verbal labels conform to German phonotactic rules. Musical stimuli consisted of three notes lasting 200ms each in their presentation. b, An example of pairings between tactile stimuli (schematized in the top row of the tables) and the verbal, language-like pseudoword stimuli (in green, left) or the musical sequences (in blue, right). Pairings were determined by a random procedure and counterbalanced among subjects. For one pseudoword or tonal sequence, 28 of 40 presentations (70%) were always paired with a single pattern. The remaining 12 presentations were equally divided among the remaining three patterns within the set. Similarly, each of the remaining three pseudoword or tonal sequences were paired with one of the remaining tactile patterns in the same fashion. Note that pairings were counterbalanced between conditions across participants to eliminate any effects of stimulus features.
These results provide evidence that verbal labels, even previously meaningless ones, can influence and improve perceptual discrimination. However, this finding raises one important new question: Is this enhancement specific to spoken word stimuli, or could any consistent cross-modal association yield similar effects? To address this, we used a within-subject design comparing verbal syllables to musical tone sequences (following Perszyk & Waxman, Reference Perszyk and Waxman2018). We chose musical tone sequences as our non-Whorfian control condition because they share many physical properties with speech (such as temporal structure and acoustic complexity) while crucially lacking phonological linguistic features.
We presented subjects with tactile patterns (like those in our previous work, Miller et al., Reference Miller, Schmidt, Blankenburg and Pulvermuller2018; Schmidt et al., Reference Schmidt, Miller, Blankenburg and Pulvermuller2019; see also Methods), simultaneously presented with either a Whorfian condition of verbal labels or a non-Whorfian condition of matched musical sequences. We measured tactile discrimination performance both before and after the period of associative learning to determine whether the type of auditory pairing differentially affected perceptual discrimination. In line with Whorfian postulates, we predicted a causal effect of spoken language on perceptual discrimination but no comparable outcome for musical patterns.
2. Methods
2.1. Participants
Sixteen healthy, right-handed (mean laterality quotient 83.32 ± 21.12 S.D.) according to the Edinburgh Handedness Inventory (Oldfield, Reference Oldfield1971), native German-speaking participants (10 female) took part in this study. Participants provided written informed consent prior to partaking in the study and were compensated for their time. Procedures were approved by the Ethics Committee of the Charité Universitätsmedizin, Campus Benjamin Franklin, Berlin, Germany. All procedures were consistent with the guidelines included in the ‘Declaration of Helsinki – Ethical Principles for Medical Research Involving Human Subjects’. Age ranged from 18 to 28 (mean age 21.9 ± 3.1 S.D.). Three participants did not show up to all appointments, and they were excluded from the final analysis, leaving n=13 participants included for all data analyses. All participants were screened for calloused fingers before participation, and none exhibited any unusually thick skin on their fingers. Sample size (N=13) was determined based on established precedent in similar associative learning paradigms. Previous studies investigating language effects on perception and associative learning have demonstrated robust effects with comparable sample sizes ranging from 11 to 15 participants (Athanasopoulos et al., Reference Athanasopoulos, Bylund, Montero-Melis, Damjanovic, Schartner, Kibbe, Riches and Thierry2015; Breitenstein et al., Reference Breitenstein, Jansen, Deppe, Foerster, Sommer, Wolbers and Knecht2005; Freundlieb et al., Reference Freundlieb, Ridder, Dobel, Enriquez-Geppert, Baumgaertner, Zwitserlood, Gerloff, Hummel and Liuzzi2012; Miller et al., Reference Miller, Schmidt, Blankenburg and Pulvermuller2018).
2.2. Tactile stimuli
A 16-pin Braille-like display was programmed using a stimulator (Piezostimulator, QuaeroSys, St. Johann, Germany) to present specific patterns to the tip of the finger (see Figure 1). The 16 pins (on a 4×4 matrix with 2.5 mm spacing) were divided into two equal groups of eight pins. One group of eight pins was used to create a set of four vibrotactile patterns, each pattern consisting of four out of these eight pins and overlapping with each of the remaining three patterns by two pins. The remaining group of eight pins was used to create the second set of patterns so that the two sets have no overlap between each other. The two sets of patterns are also the mirror inverse of one another to be matched for difficulty, meaning that each set has an overlap within itself to maximize similarity. These tactile stimuli had already been used successfully in previous experiments (Miller et al., Reference Miller, Schmidt, Blankenburg and Pulvermuller2018; Schmidt et al., Reference Schmidt, Miller, Blankenburg and Pulvermuller2019). For each pattern, the 4 designated pins vibrated as 120 Hz sinusoidal. The remaining 12 unused pins thus remained static during each individual pattern presentation. Previous research has insinuated that language effects on perception are likely seen only in difficult tasks (Regier & Xu, Reference Regier and Xu2017; Winawer et al., Reference Winawer, Witthoft, Frank, Wu, Wade and Boroditsky2007). Therefore, this design was created to ensure that discrimination within one set of patterns was as difficult as possible while allowing participants to discriminate above chance level, as there are inherently overlapping pins when discriminating patterns from within a set. Previous piloting showed an initial d’ value of around 1 when patterns were presented with a 400-ms pause in between (Miller et al., Reference Miller, Schmidt, Blankenburg and Pulvermuller2018; Schmidt et al., Reference Schmidt, Miller, Blankenburg and Pulvermuller2019). Tactile patterns lasted 600 ms in their presentation.
Stimuli and design. a, Vibrotactile-stimuli were presented on a 4x4-pin Braille-like piezoelectric display to the right middle finger. Each stimulus consisted of static (non-vibrating) pins and four pins that vibrated with sigmoidal 120 Hz. b, Tactile stimuli composing of two sets, where within each set all patterns overlap by 2 out of 4 pins. Patterns were equally similar within each of two sets, and because the sets were parity inverse, stimulus comparisons within both sets were equally difficult. For training, one set was paired with a set of 4 pseudowords for the Verbal condition, and another set was paired with a set of four short tonal sequences for the Musical conditions. Set pairings were counterbalanced across subjects. For the pseudowords, four pseudowords (not overlapping in onset, nucleus, or coda), were constructed, where pseudowords conformed to German phonetic rules following a consonant-consonant-vowel-consonant-consonant pattern. For the musical, tonal sequence consisting of three sequential tones to mimic the onset-nucleus-coda constellation of the verbal stimuli were created. During the implicit learning phase, pairs of tactile-stimuli and pseudowords were defined to form the Verbal conditions and pairs of tactile stimuli and tonal sequences were defined to form the Musical condition. All participants were exposed to both pairings equally. c, In the discrimination task, participants were sequentially presented with two vibrotactile-stimuli without the presentation of pseudowords or musical sequences in a two-alternative forced choice task and were asked to indicate if the two consecutive stimuli were identical or different.

2.3. Whorfian (verbal) and non-Whorfian (musical) stimuli
Verbal pseudoword stimuli were taken from one set of the verbal materials used in Miller et al. (Reference Miller, Schmidt, Blankenburg and Pulvermuller2018). Four pseudowords were constructed to be maximally different, following the consonant-vowel pattern CCVCC (find pseudowords listed in Figure 1b). All pseudowords conformed to phonetic rules of German. The four pseudowords did not overlap by more than one non-vocalic phoneme in the same position. All pseudowords contain no neighbors. They were recorded by a male native German speaker, and single samples were normalized. All words lasted 600 ms in their presentation.
Four tonal sequences were created using Audacity® (Team, Reference Team2021). Each musical sequence consisted of three sequential tones to mimic the onset-nucleus-coda constellation of the verbal stimuli. Each of the three tones in a sequence lasted 200 ms in the presentation, yielding stimuli that were 600 ms long. Tones were taken from a scale in frequency from 261.626 Hz (which is commonly considered to be ‘middle C’) to 493.883 Hz (just under one full octave above ‘middle C’). The scale, divided into 12 notes from C to B, was then divided into 4 sets of 3 notes, which were all equally spaced along the scale. The first note belonged to the first stimulus sequence, the second note to the second, third to third and fourth to fourth, then the fifth note belonged to the first stimulus and sixth to the second, and so on. The sequence of the tones was then randomized to create four stimuli that had the sequence rising, falling, peaking, or dipping. To further mimic human speech, the second or third tone in the sequence was either lightly emphasized or deemphasized (Table 1a). The resultant musical patterns sounded unfamiliar; that is, they were not part of common tunes.
To exclude the possibility that pre-existing phonological-semantic links such as those immanent in sound symbolism (Imai et al., Reference Imai, Kita, Nagumo and Okada2008; Nygaard et al., Reference Nygaard, Cook and Namy2009; Paksoy et al., Reference Paksoy, Montaville and McCarthy1989) could play a role, we systematically varied the pairings of both verbal and musical labels and tactile patterns and counterbalanced those across participants. Before and after participants engaged in a task where they had to index, by button press, any stimulus repetitions, and thereby had opportunity to implicitly learn verbal–pattern relationships and nonverbal–pattern relationships. Discrimination of tactile patterns presented outside any auditory associative context was tested using a two-alternative same-different forced choice judgement with feedback. All participants had equal exposure to all auditory stimuli and tactile patterns.
2.4. Discrimination training and implicit learning phase
Participants completed two sessions of 1 hour each of implicit learning each day for 5 days, finishing with the first session on Friday morning. During each of these nine sessions, participants completed six 10-minute blocks with a self-timed break after each block. In each block, participants were presented binaurally with a random sequence of the verbal and non-verbal (musical) stimuli, which were paired with the simultaneous presentation of the vibrotactile patterns presented on the right middle finger. Inter-trial intervals were jittered between 500 and 2500 ms. No explicit information about the pairings or variations in pairing consistencies was given. To ensure cooperation, participants were directed to pay careful attention to both modalities and to respond to occasional repeats in the presentation stream by pressing the space bar using their left hand. Repeats in the stimulus stream consisted only of repetitions in both modalities, meaning tactile repetitions with their auditory pairs (verbal pseudowords or music sequences). Subjects reported focusing more on the auditory stimuli, as they found the tactile stimuli difficult to discriminate (as was seen in the low performance scores at the onset of the study) and thus could not tell if there were repetitions in this modality alone. Individual performance outcomes of this task were presented on screen at the end of each block. The low average rate of <10% misses and <3% false alarms demonstrated their sustained attention during the long-lasting learning sessions.
2.5. Discrimination test
Before starting and upon completion of the 1 week of implicit learning, participants performed a discrimination task to assess performance. Using a two-alternative forced-choice discrimination task, two tactile patterns were presented sequentially, but for this task without any accompanying auditory stimuli. Participants were instructed to judge whether the two patterns were either the same pattern repeated, or two different patterns, via button press with the left hand. The pairs of tactile patterns were presented with a 400-ms pause as per previous experiments (Miller et al., Reference Miller, Schmidt, Blankenburg and Pulvermuller2018; Schmidt et al., Reference Schmidt, Miller, Blankenburg and Pulvermuller2019), and feedback was shown briefly after each trial before the next trial began. Two blocks of 320 trials were administered, and in each block 50% of all trials were repetitions of one of the eight tactile patterns (each equally often). The remaining 50% of trial pairs contained one of three combinations: one pattern from each of the two sets (‘between’), two patterns from Set 1 (‘within’ Set 1), or two patterns from Set 2 (‘within’ Set 2).
Sensitivity was calculated before (Pre) and after (Post) implicit learning using $ d^{\prime } $
values calculated for each ‘within’ condition as well as the ‘between’ condition.
$ d^{\prime } $
values calculated for each ‘within’ condition as well as the ‘between’ condition.
Measurements of the z-transformed hit rate and false-alarm rates are used to calculate $ d^{\prime } $
as follows:
$ d^{\prime } $
as follows:
 $$ d^{\prime }=Z\;\left(\mathrm{hit}\;\mathrm{rate}\right)\hbox{--} Z\;\left(\mathrm{false}\ \mathrm{alarm}\ \mathrm{rate}\right) $$
A higher d’ indicates that the signal can be more readily detected.
Complete data from this experiment and analysis scripts are available in our open repository (https://doi.org/10.17605/OSF.IO/A542M)
3. Results
Our statistical analysis followed a comprehensive approach combining linear mixed models, planned comparisons, and enhancing statistical power by combining current data with previously published results in a comprehensive omnibus analysis. Statistical analysis was performed using RStudio software (version 2024.12.0+467). A linear mixed model (LMM) was implemented using Condition (Whorfian verbal and non-Whorfian musical) and Time (Pre, Post) as fixed effects and using Subject as a random effect. The model revealed a significant main effect of Time (χ 2 (1) = 13.44, p < 0.001), indicating improved performance over time. The main effect of Condition (χ 2 (1) = 1.52, p = 0.217) and the Condition × Time interaction (χ 2 (1) = 2.34, p = 0.126) did not reach significance. Across both conditions, participants showed lower performance in pre-test compared to post-test measurements (β = −0.56, SE = 0.16, 95% CI [−0.87, −0.25]). The random effects’ structure indicated substantial between-subject variability (SD = 0.47) relative to the residual variance (SD = 0.41). Statistical analyses of the same dataset using alternative approaches (including repeated-measures ANOVA) confirmed this main effect and also failed to reveal a significant interaction effect (see Supplementary Materials for details).
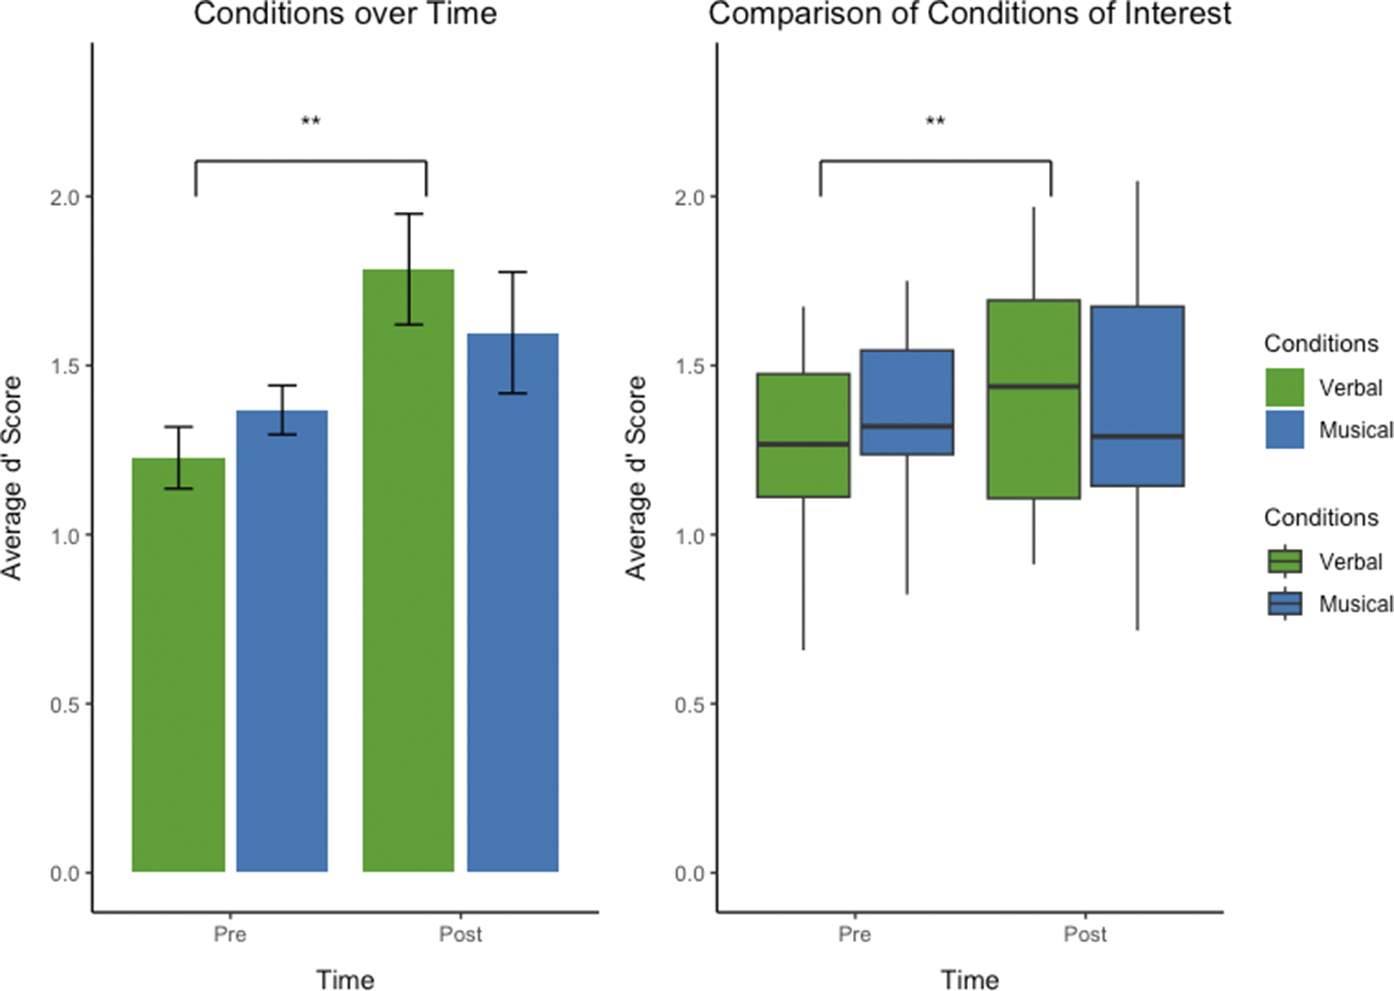
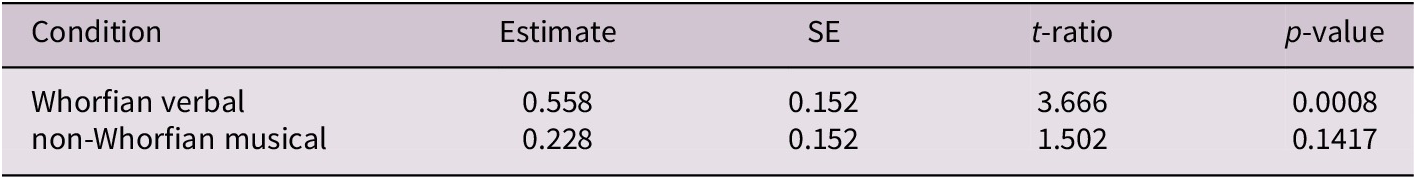
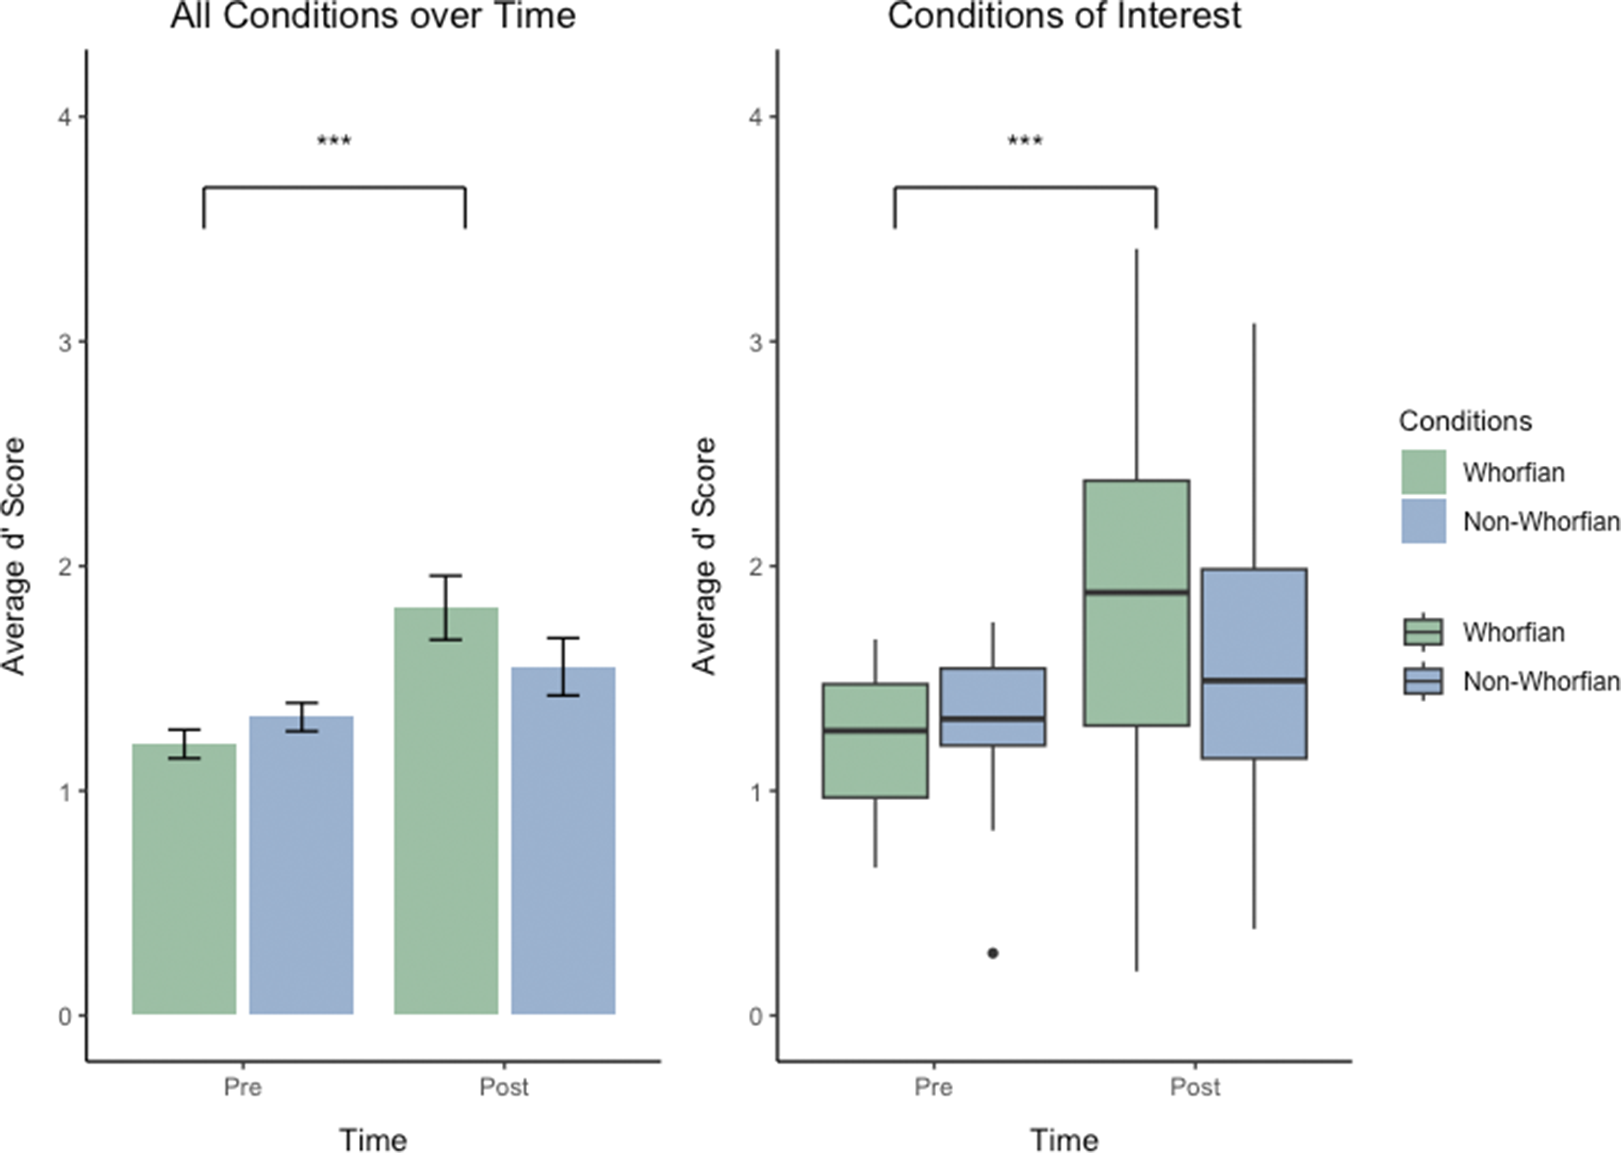
Despite the absence of a significant interaction, we used planned comparisons (Figure 2) motivated by our a priori hypothesis (see Introduction). These revealed condition-specific differences in learning outcomes (Table 2). For verbal stimuli, average discrimination d′ values improved significantly from 1.23 (SD ± 0.32) to 1.78 (SD ± 0.59), an increase of 0.55 (t (36) = 3.67, p < 0.001). In contrast, for musical stimuli, the improvement from 1.37 (SD ± 0.26) to 1.60 (SD ± 0.65), an increase of only 0.23, did not reach statistical significance (t (36) = 1.50, p = 0.14).
Tactile Pattern discrimination performance before and after learning in context of co-presented verbal and musical stimuli. Bar graphs (left) and box plots (right) illustrating the distribution of scores across the “Pre” and “Post” blocks under different conditions. Left: Bar graph showing the average discrimination performance quantified as d’ scores of discriminating patterns from all participants, divided into the two conditions of interest: discrimination of patterns paired with verbal labels (‘Verbal’, in green), patterns paired with musical tone sequences (‘Musical’, in blue). Post-learning discrimination of tactile pattern sets paired with verbal labels significantly improved. There was no significant improvement for tactile sets paired with Musical stimuli. Right: Box plot segregating the discrimination performance d’ scores from all participants into the two conditions of interest: patterns paired with Verbal (in green) or with Musical (in blue). Central lines represent the median of the data. Boxes show the interquartile range (IQR), meaning the range of the middle 50% of the data. The horizontal lines represent the median. Means are denoted by solid black points, with error bars representing the 95% confidence intervals for the mean. Whiskers above and below extent to furthest data point within 1.5 times the IQR from the box. Outliers plotted as individual points. Discrimination performance for the tactile stimuli set paired with language-like stimuli was significantly better (p < 0.001) after implicit learning compared with discrimination performance of the same tactile stimuli sets before learning.
Planned comparisons of pre- versus post-perceptual discrimination performance across conditions. The table shows estimated marginal means contrasts between post and pre timepoints within each condition (language and tones), derived from the linear mixed model. Values include effect estimates, standard errors (SE), t-ratios, and p-values (adjusted using Holm-Bonferroni correction). The language condition showed a significant improvement in discrimination performance from pre to post training (p < 0.001), while the tones condition did not reach statistical significance (p = 0.142).
Our previous study (Miller et al., Reference Miller, Schmidt, Blankenburg and Pulvermuller2018) had used the same pseudowords as in the current study’s Whorfian verbal condition of interest, though instead of comparing a verbal condition to a non-Whorfian musical condition, it instead compared Concordantly paired stimuli (meaning consistently paired, exactly like the verbal condition of the present study) to a different type of non-Whorfian condition, that is, verbal stimuli randomly or ‘discordantly’ paired with tactile patterns, and measured the effect this had on discrimination performance for 15 subjects different from the ones who participated in the current study. In that previous study, each pseudoword in the control (or non-Whorfian Discordant) condition was presented randomly with various tactile stimuli. The two experiments in the present and previous studies are comparable, as the Whorfian Concordant condition from Miller et al. (Reference Miller, Schmidt, Blankenburg and Pulvermuller2018) and the Whorfian verbal condition of the present study were identical. Similarly, the respective control condition in each experiment violated the Whorfian approach in a specific way, the present one in pairing a perceptual pattern not with a linguistic stimulus but with a tonal sequence instead (non-Whorfian musical condition) and the previous one by inconsistently pairing linguistic and perceptual stimuli (non-Whorfian Discordant condition from Miller et al., Reference Miller, Schmidt, Blankenburg and Pulvermuller2018). The two experiments thus offer a joint analysis of Whorfian vs minimally different non-Whorfian control conditions.
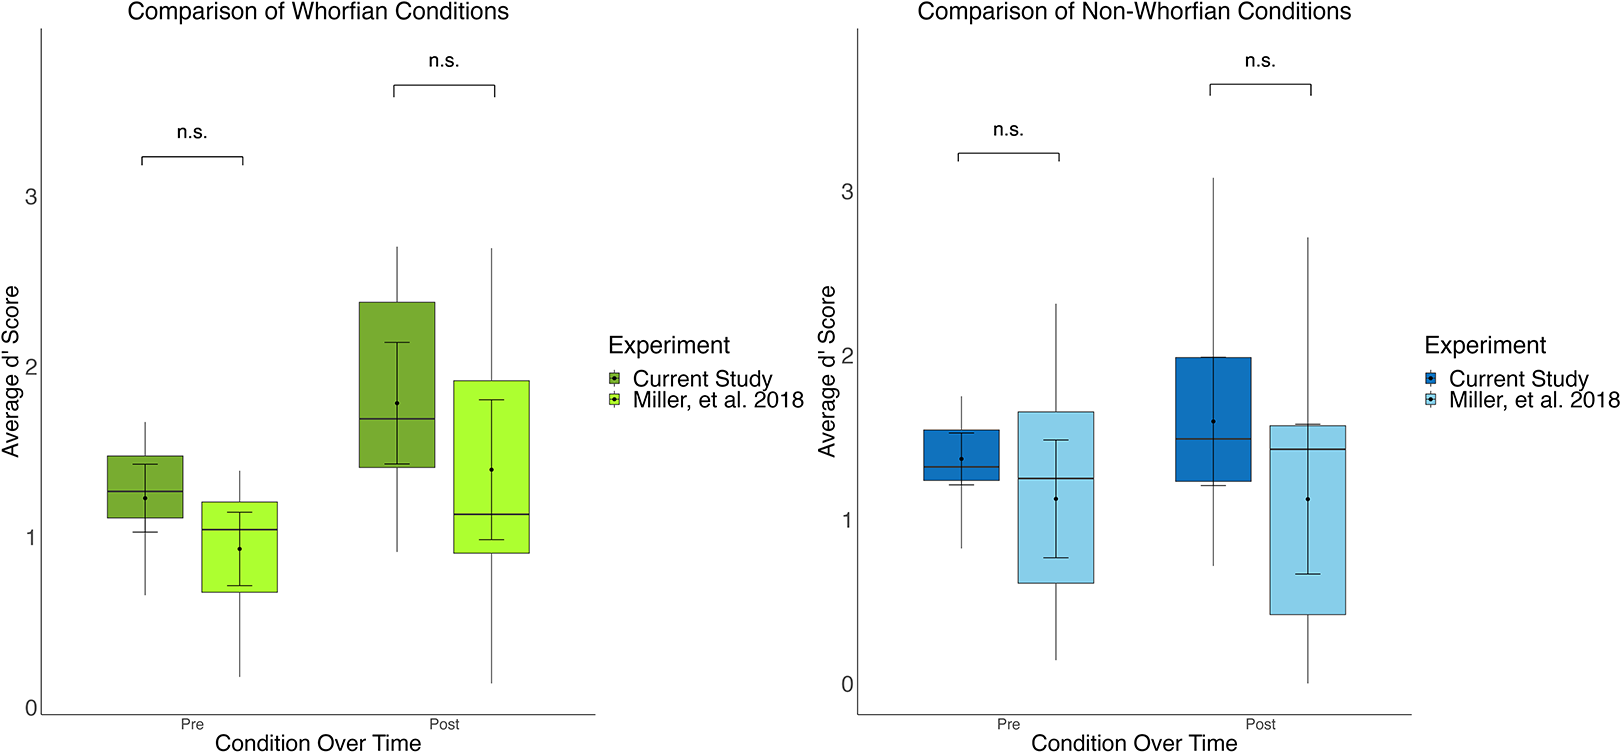
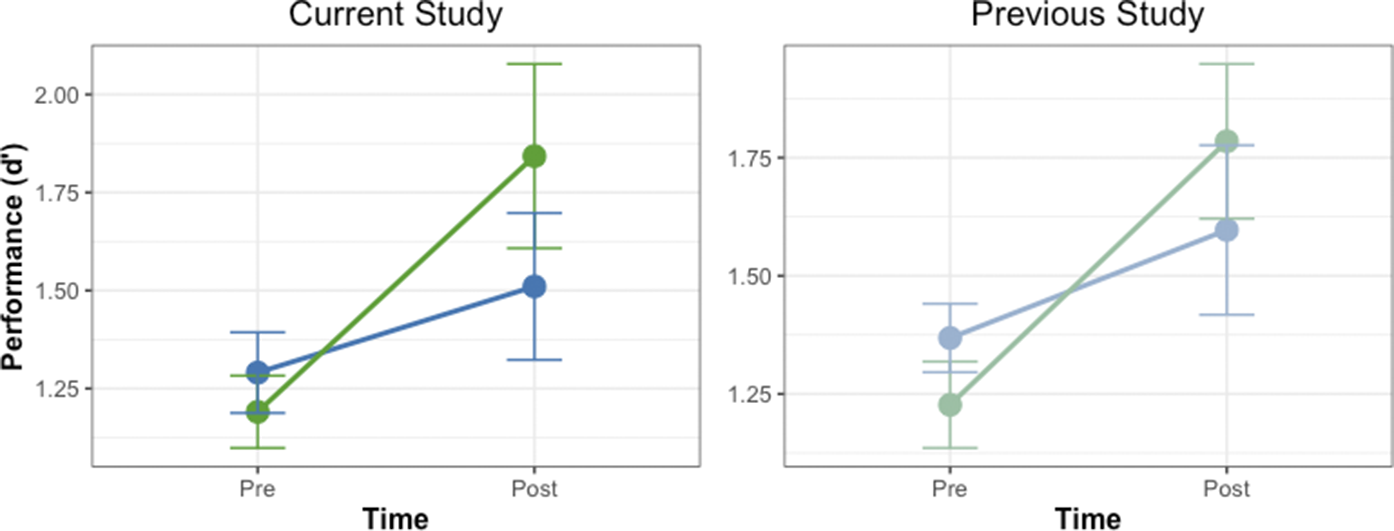
To investigate whether these two studies could be combined for an omnibus analysis, the means of both the Whorfian conditions and the means of both the non-Whorfian conditions were computed, and they were compared to investigate whether significant differences arose (Figure 3). A t-test comparing the d’ improvement of the Whorfian verbal condition of the present study (mean improvement = 0.558 ± 0.137 SEM) and the Whorfian Concordant conditions of the previous experiment (mean improvement = 0.465 ± 0.145 SEM) revealed no significant difference (2 tailed, t (26) = −0.442, p = 0.662). Furthermore, there was likewise no significant difference found between the improvement of the non-Whorfian musical condition of the current experiment (mean improvement = 0.2285 ± 0.1806 SEM) and that of the non-Whorfian Discordant condition of the previous experiment (mean improvement = 0.3086 ± 0.2044 SEM, 2 tailed, t (26) = 2.0639, p = 0.3484). This led us to collapse the conditions together into Whorfian and non-Whorfian conditions for further analysis.
Comparative analysis of discrimination performance under Whorfian and non-Whorfian conditions across two studies. Box plots showing side-by-side comparisons of participant discrimination d’ performance under Whorfian (left) and non-Whorfian (right) conditions, derived from two distinct experiments labeled as “Current Study” and Miller, et al. Reference Miller, Schmidt, Blankenburg and Pulvermuller2018. Each boxplot displays the distribution of participant d’ scores before (Pre) and after (Post) implicit associative learning. Data from the current study includes the conditions Verbal (dark green) and Musical (dark blue), contrasted with the conditions from a previous study which implemented Concordant pairings (light green) and Discordant pairings (light blue) with verbal stimuli. Average subject discrimination performance is showed before (Pre) and after (Post) learning. Boxes show the interquartile range (IQR), meaning the range of the middle 50% of the scores. The horizontal lines represent the median. Whiskers above and below extent to furthest data point within 1.5 times the IQR from the box. Means are denoted by solid black points, with error bars representing the 95% confidence intervals for the mean. There were no significant differences between the Labels and Concordant conditions, nor between the Musical and Discordant conditions, when comparing discrimination performance either before (Pre) or after (Post) the implicit association task, leading us to combine these conditions together for an ‘omnibus’ analysis.
For the omnibus analysis, the Whorfian verbal/concordant conditions of both the present experiment and the previous experiment were combined as the ‘Whorfian’ conditions, whereas the ‘non-Whorfian’ conditions consisted of the non-Whorfian Discordantly paired labelled conditions from (Miller et al., Reference Miller, Schmidt, Blankenburg and Pulvermuller2018), and the non-Whorfian musical condition of the present study.
We analyzed the data from both experiments using an LMM with Whorf (Whorfian vs. non-Whorfian conditions), Experiment (Miller et al., Reference Miller, Schmidt, Blankenburg and Pulvermuller2018 and current study), and Time (Pre vs. Post) as fixed effects and Subject as a random intercept. This approach allowed us to examine the effects across experiments while controlling for individual differences. The LMM revealed significant main effects of Condition (χ 2 (1) = 5.74, p = 0.017) and Time (χ 2 (1) = 30.58, p < 0.001) but no significant effect of Experiment (χ 2 (1) = 0.02, p = 0.887). Additionally, there was a significant Whorf × Time interaction (χ 2 (1) = 6.08, p = 0.014). The results are shown in Figure 4.
Combined results from current and previous studies. Line graphs showing the discrimination performance (d’) before and after associative learning across both studies. The Whorfian condition (green) represents tactile patterns paired consistently with verbal labels, the non-Whorfian condition (blue) shows tactile patterns paired with musical sequences (current study, left) or discordant verbal labels (previous study, right. Error bars indicate standard error of the mean. Despite similar initial performance levels in the Whorfian and non-Whorfian conditions, significant improvement after training was observed only in the Whorfian condition in both studies (p < 0.001), while the non-Whorfian condition showed no significant improvement. This pattern suggests that the perceptual enhancement effect depends specifically on linguistic pairing rather than any cross-modal association.
Planned comparisons examining pre versus post differences within each condition showed that performance improvement across the learning phase were highly significant in the Whorfian conditions (see Figure 5, Whorfian pre vs. post [2 tailed, t(27) = −4.939, p = < 0.001]), whereas the non-Whorfian conditions failed to reach a significant improvement of discrimination performance (non-Whorfian pre vs. post [two-tailed, t(27) = −0.863, p = 0.396]). These results suggest that while Whorfian verbal language training enhances tactile discrimination regardless of experimental context, non-Whorfian sequences and/or pairings do not produce comparable learning effects (also see Figure 4). A three-way repeated-measures ANOVA using the same factors confirmed these results (see Supplementary Materials).
Results from the collapsed analysis of data from present study and Miller, et al. Reference Miller, Schmidt, Blankenburg and Pulvermuller2018. Left: Illustration of the significant 2-way interaction of the factors Time (Pre vs Post) and Condition (Whorfian, non-Whorfian). Bar graph showing the d’ performance of subjects before and after 1 week of associative learning. Average discrimination d’ scores of subjects discriminating tactile sets presented in the Whorfian conditions are shown in green (Verbal Labels from present study and Concordant condition from Miller, et al. Reference Miller, Schmidt, Blankenburg and Pulvermuller2018), discrimination of sets presented in the non-Whorfian conditions are in blue (Musical Pairings from current paper and Discordant Pairings from Miller, et al. Reference Miller, Schmidt, Blankenburg and Pulvermuller2018). Right: Display of the significant 2-way interaction As box plots. Performance before and after training is shown, combining the Whorfian conditions in green and the non-Whorfian conditions in blue. Boxes show the interquartile range (IQR), meaning the range of the middle 50% of the scores. The horizontal lines represent the median. Whiskers above and below extent to furthest data point within 1.5 times the IQR from the box. Means are denoted by solid black points, with error bars representing the 95% confidence intervals for the mean. Central lines represent the median of the data. Discrimination performance for the tactile stimuli set associated with language-like stimuli in the “Whorfian” conditions was significantly better (p < 0.001) after implicit learning compared with discrimination performance of the same tactile stimuli sets before learning. Equal exposure but without associating to language-like stimuli showed no significant improvements among these same subjects.
4. Discussion
This experiment showed that the Whorfian verbal conditions showed significant learning effects, whereas the non-Whorfian musical condition showed no significant improvement across training. This indicates that perceptual discrimination improves more in the presence of language-like verbal labels than with either inconsistent verbal labels or consistent musical stimuli.
Language facilitates discrimination of tactile patterns. In the present study, we further confirm such a causal Whorfian effect and investigate whether it is specific to verbal materials. We asked: Would the co-presentation of irrelevant musical sequences improve the learning and recognition of minimally different fine-grained tactile patterns, as the co-presentation with meaningless pronounceable spoken pseudowords does? Musical sequences and tones offer an ideal control condition to language, as they share many physical properties with speech (e.g., temporal structure, acoustic complexity) while crucially lacking linguistic features (e.g., Patel, Reference Patel2003). Our results provide evidence against this notion. Below, we summarize the main features of the study and results, discuss how the documented difference can be explained, and address the neurobiological mechanisms that possibly underlie the difference.
In our within-subject design, participants learned to associate two sets of fine-grained tactile patterns (four patterns per set) with either Whorfian verbal stimuli (pronounceable pseudowords) or matched non-Whorfian/non-verbal stimuli (musical tone sequences). During nine learning sessions across one week, each tactile pattern was probabilistically paired (70% concordance) with its designated auditory stimulus while participants performed a repetition detection task. Discrimination performance was assessed before and after associative learning. Using the measurements pre- and post 5 days of exposure, an LMM analysis of discrimination performance revealed a significant main effect of Time, indicating overall improvement in discrimination across conditions. Although the Condition × Time interaction did not reach significance in this initial analysis, our a priori hypotheses specifically predicted improvement in the Whorfian verbal but not in the non-Whorfian musical condition, which was confirmed with planned comparison tests. Participants showed significant improvement in verbal-associated tactile discrimination performance, while the musical condition did not reveal any significant change. This pattern confirms a facilitatory ‘Whorfian’ or linguistic relativity effect specific to verbal labels. Crucially, our omnibus analysis combining current data with previously published results provided stronger statistical evidence, revealing a significant Whorf × Time interaction. This interaction demonstrates that the type of associative context during the exposure phase – whether it was in line with the assumptions immanent to Whorfian linguistic relativity – differentially affected subsequent tactile discrimination ability. This effect cannot be attributed to differences in the tactile stimuli themselves, as the tactile pattern sets were carefully matched and counterbalanced across participants.
While the non-Whorfian Music condition of the current experiment and the non-Whorfian Discordant condition of the previous experiment showed statistically similar outcomes, their theoretical underpinnings differ in important ways. The Discordant condition, where verbal labels were randomly paired with tactile patterns, likely resulted in weaker and inconsistent associations between individual verbal labels and specific tactile sensations. In contrast, the musical condition, featuring consistent tone sequences, may have established more stable associations with individual patterns, but these non-linguistic connections were apparently insufficient to enhance perceptual distinctions. The similar performance outcomes in these conditions, despite their distinct presumed mechanisms, suggests that the absence of consistent linguistic labels may be the critical factor, rather than the presence of potentially interfering or insufficient associations. This interpretation aligns with previous findings showing that non-linguistic stimuli, even when consistently paired, do not facilitate the same degree of perceptual reorganization as linguistic labels (e.g., Fulkerson & Waxman, Reference Fulkerson and Waxman2007). The lack of significant improvement in both non-Whorfian conditions, albeit through different mechanisms, underscores the specific role of consistent linguistic labels in enhancing perceptual discrimination.
To re-address the interaction issue using a larger subject sample and thus greater statistical power, the results from the current experiment were combined with results from a similar, previous experiment (see Results). Using a comprehensive linear mixed model analysis with Whorf (Whorfian condition and non-Whorfian condition), Experiment (current, previous), and Time (pre, post) as fixed effects and Subject as a random intercept, we examined the pattern of learning across conditions. The interaction between the factors Whorf and Time was significant and confirmed discrimination improvement specifically in the Whorfian paradigms (p < 0.001) but not for randomly paired verbal labels or regularly paired musical sequences. This main result was revealed by both LMM and repeated-measures ANOVA.
Our findings align with and extend previous research on linguistic effects in perceptual discrimination (Miller et al., Reference Miller, Schmidt, Blankenburg and Pulvermuller2018; Schmidt et al., Reference Schmidt, Miller, Blankenburg and Pulvermuller2019). Similar Whorfian effects of consistent verbal label learning have been reported in other modalities, including olfaction (Vanek et al., Reference Vanek, Soskuthy and Majid2021). The consistency of these effects across different control conditions – whether musical sequences or random verbal pairings – strengthens the conclusion that perceptual enhancement is specifically linguistic, rather than resulting from any consistent cross-modal associations.
One question that may arise is why we used probabilistic rather than strict one-to-one mapping (where each tactile pattern would be consistently paired with only one specific auditory stimulus). The use of probabilistic pairings in associative learning paradigms, where stimuli are paired with their designated match most but not all the time (in our case, 70% of presentations), has several documented advantages compared to a strict one-to-one mapping. Not only do these probabilistic associations mirror real-world learning conditions, where relationships between stimuli are not always perfectly consistent, but they can also discourage the use of learning strategies such as strict memorization (Freundlieb et al., Reference Freundlieb, Ridder, Dobel, Enriquez-Geppert, Baumgaertner, Zwitserlood, Gerloff, Hummel and Liuzzi2012; Gershman, Reference Gershman2015; Liuzzi et al., Reference Liuzzi, Freundlieb, Ridder, Hoppe, Heise, Zimerman, Dobel, Enriquez-Geppert, Gerloff, Zwitserlood and Hummel2010). Furthermore, some studies have demonstrated that the probabilistic pairings can actually promote stronger and more flexible learning associations than the typical one-to-one mapping (Gallistel & Gibbon, Reference Gallistel and Gibbon2000; Retter et al., Reference Retter, Erassmy and Schiltz2023). An added advantage is that probabilistic learning helps avoid attentional effects, as a 1:1 mapping could have guided participants to focus on differences in vibration when hearing different paired stimuli.
We note that, in contrast to a range of previous studies documenting differences in perceptual performance in speakers of different languages, the current experimental and controlled learning paradigm using within-subject comparisons can exclude important confounds of studies in the linguistic-relativity domain. If native speakers of different languages are compared, knowledge of a given language always comes with specific embedding ‘in sensory perception, everyday activities, habits, attention, emotional reactions, skills, and social interactions’ (Downey & Gillett, Reference Downey and Gillett2023), therefore leading to habitual and cultural differences between people coming from different cultural and language backgrounds (see related arguments in the Introduction above).
Before considering specific neural mechanisms, it’s important to consider what cognitive properties might make verbal stimuli uniquely effective for perceptual discrimination enhancement. While our study used meaningless pseudowords that lack semantic content, grammatical function or naming properties, these stimuli nonetheless engage phonological processing systems specialized for speech. The key cognitive difference may lie in how verbal stimuli, even when meaningless, activate highly specialized multimodal processing circuits that have been shaped by lifelong exposure to language. Speech sounds engage distributed networks integrating auditory, motor and sometimes visual information, creating richer representational connections than those typically activated by non-speech sounds such as musical tones. This multimodal engagement of language-related neural resources, rather than semantic or grammatical properties, may be what drives enhanced perceptual discrimination. This perspective aligns with neurobiological evidence showing that even meaningless speech-like stimuli activate language-specific brain regions and their connections to sensory processing areas, providing a mechanistic basis for the enhancement effects observed in our study.
One possible explanation for the language-related improvement of perceptual discrimination relies on the Hebbian principle underlying neuroplasticity, which states that connected neurons that ‘fire together, wire together’, thus strengthening their mutual connections. Such correlations lead to the formation of larger, strongly connected cell assemblies, whose neuronal elements may be spread out across several areas of cortex (Braitenberg, Reference Braitenberg1978; Braitenberg & Schüz, Reference Braitenberg and Schüz1998; Buzsaki, Reference Buzsaki2010; Palm, Reference Palm1982; Pulvermüller, Reference Pulvermüller2003). Connecting initially distinct cell assemblies assumed to process the two types of stimulus representations individually (tactile versus linguistic) to each other may therefore increase their corresponding cortical circuits, forming connections between neurons in somatosensory cortical and language-relevant areas (for evidence, see, for example, Schmidt et al., Reference Schmidt, Miller, Blankenburg and Pulvermuller2019) and lead to a stronger feedback activity within each of these neuron circuits. Once neuronal groups in these regions become strongly interlinked with each other, they form an operational cell assembly, which can then be fully ‘ignited’ by only partial activation due to the strong internal connections of the circuit (Braitenberg, Reference Braitenberg1978; Kaplan et al., Reference Kaplan, Sonntag and Chown1991; Pulvermuller, Reference Pulvermüller2013), meaning an incoming stimulus, be it the verbal label or tactile pattern, should automatically activate its corresponding multimodal representation. But this does not yet answer the question of why discrimination improves with verbal but not musical patterns. The crucial point here is that similar stimuli, such as the perceptually similar tactile patterns in this experiment, would activate overlapping cortical neuron sets prior to any associative learning, so that discrimination between these overlapping activation patterns may be difficult. If each of the similar stimulus representations is then linked with an entirely different circuit representing a verbal ‘label’, which are all maximally dissimilar in this study, the overlap (in terms of shared neurons) between the larger circuits will be reduced, thus leading to easier discrimination (for discussion, see Pulvermuller et al., Reference Pulvermuller, Garagnani and Wennekers2014). This ‘overlap reduction’ is, in part, a direct consequence of the binding between information across modalities (here: tactile and linguistic) and a consequence of so-called Anti-Hebbian learning, that neurons that fire independently of each other become disconnected. According to this theory, consistent verbal labeling leads to a reduction in overlap for labeled stimuli, while inconsistent pairing would result in interference, as the anti-Hebbian principle would weaken synapses due to the variability in pairings. The remaining question is whether consistent pairings could be created across any two modalities or if language-like labels had an advantage over non-linguistic labels. Therefore, we must look more closely into the putative neurocognitive differences between unfamiliar pseudowords and novel musical sequences.
An explanation of the observed difference in facilitating perceptual discrimination between pseudowords and music sequences may draw on several different, though possibly related or complementary, features. We address two of them here: First, all native speakers are very familiar with the sounds and the sound structure of their first language, which implies that they have representations of phonemes, likely larger phonological units such as syllable onsets and rhymes, and possibly even spoken putative word forms that are not part of their language but part of the repertoire of syllables and syllable sequences frequently used as early as the babbling stage of babies (Locke, Reference Locke1995; Locke & Pearson, Reference Locke and Pearson1990; Vihman, Reference Vihman1985; Werker & Tees, Reference Werker and Tees1999). Such syllables and sequences give rise to correlation learning, in which the articulation of phonemes via motor cortex activation simultaneously activates auditory processing of the acoustic features of those same phonemes, linking articulatory-phonetic information to acoustic-phonetic information (Boysson-Bardies, Reference Boysson-Bardies1991; Galantucci et al., Reference Galantucci, Fowler and Turvey2006; Locke & Pearson, Reference Locke and Pearson1990; Vihman, Reference Vihman1985; Werker & Tees, Reference Werker and Tees1999). In contrast, musical experience is variable, with some having ample experience with musical stimuli and others very little. Activation upon hearing musical tones in individuals who are anything less than professional or exceptionally proficient musicians would be limited to the auditory system, i.e. to superior-temporal areas of the auditory cortices, such as the transverse temporal gyri (Strainer et al., Reference Strainer, Ulmer, Yetkin, Haughton, Daniels and Millen1997; Warrier et al., Reference Warrier, Wong, Penhune, Zatorre, Parrish, Abrams and Kraus2009). Thus, it can be assumed that well-entrenched cortical representations are available consistently across subjects for the phonological constituents of pseudowords, but not for musical patterns. Further studies are needed to determine if this level of familiarity is relevant, in which case, one would expect to see similar Whorfian effects for musical patterns in musicians specifically and possibly even frequent listeners to music.
A second feature that may explain the advantage of verbal over musical effects stems from the multimodal character of language: phonemes, phoneme sequences and potential spoken word forms are multimodal patterns for most members of our culture, that is, subjects know them as auditory units, as elements of articulatory production and they also know their written and to-be-read analogues. In neurobiological terms, this means that neuron ensembles widely distributed across cortex are required as a mechanistic basis of such multimodal engrams. These would need to interlink, for example, the articulatory motor pattern of a spoken word form in the motor system with the auditory representation in temporal lobe. In contrast, musical patterns are unimodal auditory stimuli for individuals not actively playing music. Of the 13 participants included in the statistical analysis of the current experiment, seven reported having ‘no experience with music, instruments, or singing’; the other six reported having exposure, mostly in childhood, to musical instruments or singing, but none were currently practicing, and none identified as professional or highly skilled musicians. Although direct comparison of these subgroups did not yield a significant difference, it can be assumed that, at the level of the brain, the difference between uni- vs. multimodality of representational mechanisms corresponds to a differential distribution or dispersal of partaking neurons; in one case reaching across auditory, articulatory, writing-related and hand-motor systems and the connector hub areas interlinking these primary sites, and in the other case being confined to the auditory cortex and adjacent areas. In both cases, the linguistic units can be predicted to be cortically established by solid and widely distributed cell assemblies, whereas for musical stimuli in non-musicians, the respective cortical devices may be, if not absent entirely, quite small and focal in their distribution. In sum, the cortical feedback to perception that can be provided by these neuronal devices is predicted to be large for language stimuli but small for musical items. If the multimodality of the representations is relevant, the prediction is, once again, that musicians will show Whorfian facilitation of stimulus discrimination, but for both music-naïve persons and frequent listeners of music, there will be no comparable effect.
While our study demonstrates language-related perceptual changes that emerge over multiple training sessions, it is important to emphasize that Hebbian learning mechanisms can actually support both rapid and gradual associative learning, as demonstrated by recent computational modelling work on fast mapping (Constant et al., Reference Constant, Pulvermüller and Tomasello2023). Beyond these learning-dependent changes, research has revealed immediate effects of language on perception that can be disrupted via verbal interference. For instance, studies show that verbal interference tasks can impair categorical perception advantages (Boutonnet & Lupyan, Reference Boutonnet and Lupyan2015; Lupyan & Lewis, Reference Lupyan and Lewis2019; Lupyan & Spivey, Reference Lupyan and Spivey2010; Regier & Xu, Reference Regier and Xu2017). This is not due to new learning but rather to functional interaction between cell assemblies. When participants engage in verbal tasks, such as syllable or number repetition, these activities activate linguistic circuits that compete with and inhibit the specific language-related cell assemblies that would otherwise enhance perceptual discrimination. This competition for activation resources between cell assemblies provides a mechanistic explanation for how language dynamically modulates perception on a moment-to-moment basis. The Hebbian cell assembly framework elegantly accommodates both mechanisms: long-term structural changes through Hebbian learning and dynamic functional interactions between established language and perception circuits. These distributed neural networks not only represent linguistic-perceptual associations but also actively modulate ongoing perception through bidirectional activation dynamics and inhibitory competition, processes firmly grounded in the multimodal nature of language processing in the brain.
These considerations may provide first steps toward a perspective on explaining the observed difference in facilitatory effects of language versus music on tactile perception and to further investigate these differences in subsequent experiments. In the future, it will also be essential to model Whorfian mechanisms in greater detail using mechanistic neural network models constrained by human brain anatomy and function to assess which aspects of the underlying mechanisms may underlie the causal effect of language on perception and cognition (Henningsen-Schomers et al., Reference Henningsen-Schomers, Garagnani and Pulvermuller2023; Lupyan, Reference Lupyan2012; Westermann & Mareschal, Reference Westermann and Mareschal2014). Needless to say, these explanations also require more experimental testing, and we hereby endeavor to highlight specific novel predictions ready for testing in the next empirical steps. Ideally, such testing could even be paired with theoretical work, for example, by neural models of perception, language and music processing constrained by neuroanatomical and neurophysiological features of the human brain to derive and generate specific sets of predictions.
In summary, the previously observed discrimination improvement for tactile pattern sets that were consistently paired with unique pseudowords, as opposed to pattern sets that were randomly presented with different pseudowords, can be understood in the cell assembly framework (Miller et al., Reference Miller, Schmidt, Blankenburg and Pulvermuller2018; Schmidt et al., Reference Schmidt, Miller, Blankenburg and Pulvermuller2019). Implicit learning of consistent pseudoword-pattern pairs builds distributed and multimodal cell assemblies that are strongly interlinked, binding together information about tactile patterns and spoken pseudowords. After these ‘semantic’ circuits have formed, the tactile patterns presented in isolation can activate the entire assembly of strongly connected circuits. If two very similar tactile patterns (which may be realized in overlapping neuronal circuits) are bound to two dissimilar pseudoword circuits, this formation of semantic circuits reduces the similarity of the representations by reducing the overlap between circuits, which explains more reliable specific activation patterns for each stimulus and thus better stimulus discrimination. In contrast, in a network without prior co-association of word forms with patterns, similar tactile stimulus patterns lead to similar (e.g., strongly overlapping) neuronal activations, thus making stimulus discrimination less likely and successful. Such ‘similarity reduction’ specifically brought about by multimodal cell assembly formation was previously pointed out as a possible mechanism of Whorfian language-related perceptual discrimination enhancement (Pulvermuller et al., Reference Pulvermuller, Garagnani and Wennekers2014). Here, by linking patterns to two different types of auditory stimuli, we were able to test whether language-like stimuli had an advantage over music. Indeed, the observed advantage may be due to the fact that language-like stimuli link neurons in somatosensory areas into widely distributed semantic circuits, which also include neurons in the perisylvian language areas, spanning from temporal to prefrontal and motor areas, whereas musical stimuli would link somatosensory area neurons to auditory cortices only. This would plausibly explain why a significant improvement in tactile stimulus discrimination performance was present only for the language stimuli, though future research should test whether participants learn vibrotactile patterns through repeated exposure in the absence of any verbal label associations. Our study underscores the distinct advantage of language-like stimuli in enhancing tactile discrimination, providing insight into the neurobiological mechanisms underpinning this precise Whorfian effect.
Supplementary material
The supplementary material for this article can be found at http://doi.org/10.1017/langcog.2025.10006.
Data availability statement
All data and analysis scripts supporting the findings of this study are openly available in the OSF repository at https://doi.org/10.17605/OSF.IO/A542M. This repository contains the raw experimental data, statistical analysis code in R and detailed documentation of the tactile discrimination task. The dataset includes discrimination scores (d′) for all conditions and time points, as well as anonymized participant information.
Funding statement
This work was supported by the European Research Council through the Advanced Grant ‘Material constraints enabling human cognition, MatCo’ (ERC-2019-ADG 883811), by the Deutsche Forschungsgemeinschaft (German Research Foundation, DFG) under Germany´s Excellence Strategy through the Cluster of Excellence ‘Matters of Activity. Image Space Material, MoA’ (DFG EXC 2025/1 -390648296) and by DFG and Agence Nationale de la Recherche (ARN) research grant ‘Phonological Networks, PhoNet’ (DFG Pu 97/25-1).
Competing interests
The authors declare no competing interests.


 Open access