

Breast milk (BM) is widely advocated as the optimal nutrient for infants. Furthermore, in the last few years an increased number of reports have emphasised that failure of breast-feeding can sometimes result in dehydration and poor weight gain, with serious complications such as severe hypernatraemic dehydration, seizures, and permanent neurological and embolic damage (Arboit & Gildengers, Reference Arboit and Gildengers1980; Rowland et al. Reference Rowland, Zori, Lafleur and Reiter1982; Clarke & Sibert, Reference Clarke and Sibert1985; Cooper et al. Reference Cooper, Atherton, Kahana and Kotagal1995; Oddie et al. Reference Oddie, Richmond and Coulthard2001; Livingstone et al. Reference Livingstone, Willis, Abdel-Wareth, Thiessen and Lockitch2000). We have reported that during the first days of life, 7·7 % of exclusively breast-fed healthy, term newborn infants present a weight loss exceeding 10 % and, in 35 % of these, also hypernatraemia occurs (Manganaro et al. Reference Manganaro, Mamì, Marrone, Marseglia and Gemelli2001).
Some authors, in noting a high BM Na+ concentration in the mothers of breast-feeding infants presenting with hypernatraemic dehydration, have suggested a causal relationship between the infants' hypernatraemia and high BM Na+ concentration, and have advocated the cessation of breast-feeding (Peters, Reference Peters1989; Kumral et al. Reference Kumral, Duman, Tatli, Ozbek, Demircioglu and Ozkan2002).
The objective of the present study was to examine, in a population of healthy, exclusively breast-fed, newborn infants on the third day of life, the relationship between infants' daily BM intake (DBMI), daily Na intake, and percentage weight loss (%WL) and BM Na+ concentration.
Subjects and methods
After informed consent of mothers, and approval of the ethics committee of our hospital, all mothers, who gave birth between February and March 2004 at the Obstetric Clinic of University of Messina, and their babies were recruited for the study if they met the selection criteria. The criteria were: (a) uncomplicated prenatal course; (b) lack of maternal major medical problems and/or chronic medication; (c) single infant with a gestational age equal to or higher than 34 weeks, an Apgar score of more than 8 at 5 min, no congenital malformation, normal neonatal adaptation, and exclusively breast-fed; (d) hospital discharge after day 3. Information on the mother (age, parity, mode of delivery, any pathological condition, breast-feeding history, and level of education) and on the neonate (gestational age, mode of delivery, Apgar score, weight at birth, clinical examination, observation of breast-feeding, daily control of weight, %WL, and laboratory test results when performed) was recorded. All neonates were rooming in and were nursed by their mothers. Breast-feeding was encouraged by the baby being put to the breast by healthcare staff. All neonates were initially put to the breast in the delivery room within 1 h of life and subsequently on demand in the mother's room 24 h per d (eight to ten feeds per d). No infant received glucose or formula during the first 3 d of life. A milk sample was obtained from all mothers by manual expression from a single breast on the third day postpartum, between 09.00 and 11.00 hours, to minimise the effects of diurnal variations. On the third day of life, DBMI was measured by test weighing, corrected for insensible water loss by infants during the feed, which is a validated measure of milk intake (Neville, Reference Neville1987). All neonates were weighed fully clothed, immediately before and after each suckling episode, throughout 24 h, on an identical calibrated electronic scale equipped with an infant seat.
Analysis of mothers' milk
The milk samples were collected into sterile plastic containers. Due to the large variation in lipid content, and the potential for fatty samples to result in a falsely low Na+ concentration assessment, the milk samples were immediately sampled into 12 × 75 polystyrene tubes and centrifuged at 3000 rpm for 10 min at 4°C. Then, those liquid layers that were free of lipid were frozen and stored at − 35°C. Analysis of Na was performed by a flame photometer IL943 (Instrumentation Laboratory, Lexington, MA, USA).
The BM Na+ concentrations are expressed as mmol/l. Na+ intake (mmol/d and mol/kg per d) on the third day of life was calculated.
Statistical analysis
Preliminary analyses were performed by Spearman's correlation test in order to describe the relationships between the variables regarding the information on mothers and on neonates and BM Na+ concentration, Na+ intake (mmol/d), Na+ intake (mmol/kg per d) and %WL.
To verify the relationship between BM Na+ concentration, Na+ intake per d, and Na+ intake per kg per d v. DBMI and %WL, we performed regression tree analysis (Breiman et al. Reference Breiman, Friedman, Olshen and Stone1984). The central thrust of tree-based methods is the extraction of subgroups of observations. A simple tree consists of a main node (root) and several daughter nodes, which are subgroups. A node cannot have more than two nodes according to recursive portioning methods. The analysis of the results obtained with the ‘classification and regression tree’ (McCullagh & Nelder, Reference McCullagh and Nelder1999) approach has led us to try to identify a possible dependence between BM Na+ concentration, Na+ intake per d, Na+ intake per kg per d, and DBMI and %WL. For this reason, we have executed the generalised linear model and have applied a logarithm transformation to the outcome variables to make our distribution linear. All statistical analyses were performed by R statistical software (R Development core team, Vienna, Austria).
Results
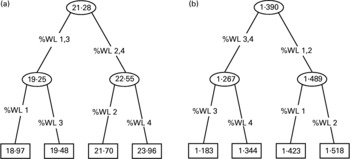
In total, 270 mothers gave birth during the recruitment period. Of these, 208 who satisfied selection criteria were enrolled in the study. As only five of the 208 infants were preterm, our population was considered as being homogeneous. The characteristics of the 208 mother–infant pairs are shown in Table 1. BM Na+ concentration, and infants' DBMI, Na+ intake per d, and Na+ intake per kg per d on the third day after delivery are reported in Table 2. The Spearman's correlation test shows a significant inverse relationship between BM Na+ concentration and DBMI (ρ − 0·283; P = 0·003), and between %WL and DBMI (ρ − 0·258; P = 0·004). Also, on the contrary, the Spearman's correlation test shows a positive association between Na+ intake per d and DBMI (ρ 0·441; P = 0·000) and between Na+ intake per kg per d and DBMI (ρ 0·329; P = 0·001). The plots of these relationships are shown in Fig. 1. Figs. 2, 3 and 4 report the regression trees, where the average of the response variables are indicated into the circles for subgroups or into the rectangles for the terminal nodes of the single group. To avoid the trees reaching enormous size, we have coded predictor variable into four levels in an ordinal scale. Fig. 2 shows the relationship between the three response variables BM Na+ concentration, Na+ intake per d, and Na+ intake per kg per d, and the predictor variable DBMI. Fig. 2 (a) shows that for a higher level of DBMI, the BM Na+ concentration is lower, and vice versa; Figs. 2 (b) and (c) show the positive relationship between the response variables Na+ intake per d and Na+ intake per kg per d and the predictor variable DBMI. Figs. 3 and 4 show the relationships between the predictor variable %WL and the response variables BM Na+ concentration, Na+ intake per d, Na+ intake per kg per d, and DBMI. The results suggest a possible dependence only for DBMI and %WL (Fig. 4 (b)).
Characteristics of 208 mother–infant pairs (Mean values, standard deviations and 95 % confidence intervals)
Breast milk (BM) sodium concentration and infant daily sodium intake (Mean values, standard deviations and 95 % confidence intervals)
Relationships with daily breast milk intake (DBMI). (a) Relationship between breast milk (BM) Na+ concentration and DBMI (ρ − 0·283; P = 0·003); (b) relationship between daily Na+ intake (mmol/d) and DBMI (ρ 0·441; P = 0·000); (c) relationship between daily Na+ intake (mmol/kg per d) and DBMI (ρ 0·329; P = 0·001); (d) relationship between percentage weight loss (%WL) and DBMI (ρ − 0·258; P = 0·004).

Regression trees showing relationships between breast milk (BM) Na+ concentration and daily BM intake (DBMI) (a), Na+ intake (mmol/kg per d) and DBMI (b) and Na+ intake (mmol/d) and DBMI (c). DBMI 1, intake < 180 g/d; DBMI 2, intake ≥ 180 to < 220 g/d; DBMI 3, intake ≥ 220 to < 267·5 g/d, DBMI 4, intake ≥ 267·5 g/d.

Regression trees showing relationships between breast milk Na+ concentration and percentage weight loss (%WL) (a) and Na+ intake (mmol/kg per d) and %WL (b). %WL 1, WL ≤ 5 %; %WL 2, WL >5 to ≤ 6·5 %; %WL 3, WL >6·5 to ≤ 8 %; %WL 4, WL >8 %.
Regression trees showing relationships between Na+ intake (mmol/d) and percentage weight loss (%WL) (a) and daily breast milk intake and %WL (b). %WL 1, WL ≤ 5 %; %WL 2, WL >5 to ≤ 6·5 %; %WL 3, WL >6·5 to ≤ 8 %; %WL 4, WL >8 %.

The analysis of the results, obtained with Spearman's correlation test and the classification and regression tree approach, has shown a possible dependence between BM Na+ concentration, Na+ intake per d, Na+ intake per kg per d, DBMI and %WL. For this reason, we performed the generalised linear model. We have applied a logarithm transformation to the outcome variables to make our distribution linear in order to obtain residuals more close to a Gaussian distribution. Table 3 shows the results for the fit models for each outcome variable, and Fig. 5 shows the plots of relationships between these variables for the fit models. Analysing them, we deduce the existence of an inverse relationship between BM Na+ concentration and infants' DBMI (for each unitary increase in infants' DBMI, BM Na+ concentration decreases by a mean of 0·997). By contrast, the relationship between Na+ intake per d and Na+ intake per kg per d, and infants' DBMI is positive (for each unitary increase in infants' DBMI, the dependent variables increase, for both, by a mean of 1·002).
Report of generalised linear model for breast milk (BM) sodium concentration, infant daily sodium intake v. daily BM intake (DBMI) (Coefficients, t values and standard errors)
Plot of response v. fit between breast milk (BM) Na+ concentration (a), Na+ intake (mmol/kg per d) (b) and Na+ intake (mmol/d) (c) v. daily BM intake (DBMI).

Discussion
It has long been known that after parturition the abrupt changes in plasma concentrations of the hormones of pregnancy trigger the onset of milk secretion, defined as lactogenesis stage II, which take place during the first 4 d postpartum and involving a programmed set of changes in milk composition and volumes (Neville & Morton, Reference Neville and Morton2001; Neville et al. Reference Neville, Morton and Umemura2001). In particular, immediately after birth there begins a fall in BM Na and chloride concentrations, which is largely complete by 72 h postpartum (Neville et al. Reference Neville, Allen, Archer, Casey, Seacat, Kellea, Lutes, Rasbach and Neifert1991). These changes precede the onset of the large increase in milk volume and are explained by closure of the tight junctions that block the paracellular pathway (Chen et al. Reference Chen, Nommsen-Rivers, Dewey and Lönnerdal1998; Nguyen & Neville, Reference Nguyen and Neville1998). A delay in the onset of lactogenesis has been reported with poorly controlled diabetes (Hartmann & Cregan, Reference Hartmann and Cregan2001) and stress during parturition (Dewey et al. Reference Dewey, Nommse-Rivers, Heinig and Cohen2003; Evans et al. Reference Evans, Evans, Royal, Esterman and James2003) and it has been also correlated with high BM Na+ concentration in poorly nursed infants (Rand & Kolberg, Reference Rand and Kolberg2001). Moreover, some authors, in noting a relationship between neonatal hypernatraemic dehydration and elevated BM Na+ concentration, have suggested a direct causal relationship, but they have placed little emphasis on evaluating the volume of BM intake (Oddie et al. Reference Oddie, Richmond and Coulthard2001; Rand & Kolberg, Reference Rand and Kolberg2001; Kumral et al. Reference Kumral, Duman, Tatli, Ozbek, Demircioglu and Ozkan2002).
We in 208 mother–infant pairs found that on the third day postpartum the mean BM Na+ concentration was 23·05 (sd 1·10) mmol/l, and the mean DBMI was 202 (sd 68·9) g/d. The BM Na+ concentration was inversely related to infants' DBMI, and decreased, by a mean of 0·997, for every unitary increase of DBMI. The mean infants' Na+ intake was, respectively, 4·36 (sd 0·22) mmol/d and 1·36 (sd 0·07) mmol/kg per d. Na+ intake was directly related to infants' DBMI and not to BM Na+ concentration. Moreover, we found that only infants' DBMI presents a relationship with infant weight loss. The present data confirm that high BM Na+ concentration is only a marker of suboptimal lactogenesis, which can be determined by a delay in the onset of lactogenesis or secondary to poor breast-feeding technique. Moreover, our finding that infants' DBMI is inversely related to BM Na+ concentration and positively related to infants' Na+ intake, for the first time, demonstrates that when lactogenesis is suboptimal, BM Na+ concentration is higher, but infants' Na+ intake is lower. These data support the hypothesis that, in breast-feeding infants, hypernatraemic dehydration, when it occurs, probably is the direct result of low feeding and not of increased BM Na+ concentration (Rand & Kolberg, Reference Rand and Kolberg2001; Richmond, Reference Richmond2003).
In conclusion, the present data clearly confirm that, in the assessment of breast-feeding, a high concentration of BM Na+ concentration may be predictive of impending lactation failure but it is not an indication to interrupt breast-feeding. Moreover, the data suggest that for the clinical assessment of breast-feeding, evaluation of milk intake, for its ease and reliability, remains the best method.


