Hyperuricaemia (HUA) is a metabolic disease caused by a disorder of purine metabolism in the body, which further progresses to gout. According to the Global Burden of Disease study, the number of patients with HUA and gout is still likely to increase further in the coming years due to changes in modern dietary patterns, as well as gut microbiota dysbiosis(Reference Rai, Fung and Lu1,Reference Kyu, Abate and Abate2) . It has been found that patients with HUA have an imbalanced gut microbiota, characterised by reduced microbial diversity and significant changes in metabolic pathways and metabolites(Reference Rakoff-Nahoum, Foster and Comstock3). Similarly, gut microbes are important for body purine homeostasis and serum uric acid (SUA) levels(Reference Lv, Xu and Zhang4–Reference Zhao, Zhao and Man6). The study shows that colonisation of gnotobiotic mice with purine-degrading bacteria modulates levels of UA and other purines in the gut systemically(Reference Tang, Ye and Wang7). Asymptomatic patients with HUA have a higher abundance of short-chain fatty acid-producing bacteria than those with HUA(Reference Martínez-Nava, Méndez-Salazar and Vázquez-Mellado8,Reference Dang, Zhang and Gao9) . At the same time, abnormalities in the urea cycle may also trigger a variety of neurological problems such as Alzheimer’s disease(Reference Ju, Bhalla and Hyeon10). Several cross-sectional studies have shown that as blood UA levels rise, memory and executive abilities, among others, decline(Reference Khaled, Abdelhamid and Al-Mazroey11). This suggests that there may be a strong link between UA levels and cognitive performance.
Dietary fibre (DF), a carbohydrate that cannot be digested by the body, has been extensively studied in the treatment of a variety of metabolic disorders(Reference Li, Yan and Liu12). In the absence of DF, the gut microbiota tends to produce mucus-degrading enzymes, resulting in thinning of the mucus layer, impairment of the barrier and increased intestinal permeability(Reference Zarrinpar, Chaix and Yooseph13,Reference Fu, Zheng and Gao14) . Research has demonstrated that DF, such as inulin, β-polyglucan and oligogalactose, either alone or in combination, have varying effects on the structure of gut microbiota(Reference Tawfick, Xie and Zhao15). Additionally, studies have found a significant negative correlation between total and grain fibre intake and UA levels in both Chinese and American adult populations(Reference Zhu, Yu and Li16,Reference Sun, Sun and Zhang17) . In contrast, inulin DF supplementation reduced UA levels in Uox knockout mice by modulating gut microbes(Reference Guo, Yu and Li18). This demonstrates the regulatory effect of DF on gut microbiota and provides new ideas for therapeutic research and neuroprotection in HUA. Currently, the focus of DF intervention in HUA has been on therapeutic administration, with a concentration on immunomodulatory effects and gut microbial perspectives. However, the importance of diverse DF in humans as omnivores and the protective role of gut microbiota during the disease process have been neglected. It is important to consider these factors in future research.
The aim of this study was to investigate the UA-lowering effects of single and complex DF, drugs and probiotics in a mice model of potassium oxyzinate (PO)-induced HUA using a preventive dosing approach(Reference Khazaie, Jafari and Heydari19). Additionally, the study examined the effects of these interventions on gut microbiology and metabolism. The study demonstrated that DF supplementation could be significant in preventing HUA and provides new evidence that dietary modification can effectively prevent the onset of chronic metabolic diseases(Reference Takashi20).
Materials and methods
Materials and reagents
The complex dietary fibre (CDF) utilised in this study was a proprietary internal laboratory formulation (inulin 60 %, polydextrose 15 %, xylo-oligosaccharide 10 %, L-arabinose 8 %, oligogalactose 5 %, chitosan 2 %). They were purchased from Shandong Balongchuangyuan Biotechnology Co. The inulin (Beneo Trade; HP-Gel) was obtained from Orafti (Oreye, Belgium) and polymerised 5–60. The probiotic supplement (Qingfeng probiotic solid beverage) was acquired from Huada Gene Co. Ltd. (Shenzhen, China), with specific details provided in online Supplementary Fig. S1. In addition, the similarity of the mechanism of action of probiotics, as common and effective supplements for regulating gut microbiota, could provide a comparison for the intervention effect of DF. Allopurinol (AP) was purchased from Greenleaf Biotechnology Co. Ltd. (Shanghai, China). PO were purchased from Sigma-Aldrich (St. Louis, MO, USA), which is a drug that induces a HUA model by inhibiting UA oxidase activity(Reference Tang, Ye and Wang7). Mouse IL-6, IL-1β, IL-10, TNF-α, xanthine oxidase (XOD), glutathione peroxidase (GSH-Px), amyloid-β (Aβ), Toll-like receptor 4 (TLR4) and NF-κB Elisa kits were obtained from Jiangsu Meimian Industrial Co., Ltd. Mouse serum blood urea nitrogen (BUN), creatinine (Cr), UA, malondialdehyde and superoxide dismutase (SOD) kits were procured by Jiancheng Bioengineering Institute (Nanjing, China). Other chemical reagents used in this experiment were purchased from China National Pharmaceutical Group Chemical Reagent Co., Ltd.
Experimental design
Male Kunming mice (5 weeks old, 36–38 g) were acquired from Jinan Pengyue Experimental Animal Breeding Center, Shandong, China, and housed at Binzhou Medical College Animal Experiment Center (Yantai, China). The mice were kept in a controlled environment (20–22°C) with a 12 h light–dark cycle. All experiments adhered to the National Institutes of Health Guidelines for Care and Use of Laboratory Animals (NIH Publication No. 8023, revised 1978) and were approved by the Yantai Institute of Coastal Zone Research, Chinese Academy of Sciences (approval no. KJ-LL-005).
Following 1-week acclimatisation period, mice were randomly divided into seven groups, with seven animals in each group, including a normal group (N, 0·5 % Carboxymethylcellulose Sodium Lubricant [CMC-Na] + normal saline), a model group (M, 350 mg/kg PO in 0·5 % CMC-Na + normal saline), a positive group (AP, 350 mg/kg PO in 0·5 % CMC-Na + 5 mg/kg AP), a probiotic supplement group (Pro-S, 350 mg/kg PO in 0·5 % CMC-Na + 250 mg/kg Pro-S), an inulin dietary fibre group (IDF, 350 mg/kg PO in 0·5 % CMC-Na + 4000 mg/kg IDF), a CDF group (CDF, 350 mg/kg PO in 0·5 % CMC-Na + 4000 mg/kg CDF) and a low-dose CDF group (L-CDF, 350 mg/kg PO in 0·5 % CMC-Na + 1500 mg/kg CDF). The dosage of intragastric administration was the equivalent dose converted by the surface area of the human. The treatment protocol is detailed in Fig. 1(a). Administration methods included intraperitoneal injection for model induction and intragastric administration for treatment, with a 6 h interval between procedures. Mice were monitored and weighed weekly for 3 weeks. Behavioural analyses were conducted 1 d post-final administration. Post-euthanasia, gut tissues, faeces, blood and kidney tissues were collected for further analysis. Sample collection: the mice were regularly fed and watered until the experiment conclusion. They were euthanised using pentobarbital anaesthesia (50 mg/kg, intraperitoneal) at the experiment’s end. Blood samples were allowed to stratify, followed by serum extraction via centrifugation at 4°C, 1000 × g for 15 min, and stored at −80°C for biochemical assays. The liver and cerebral tissues were harvested, weighed and flash-frozen in liquid nitrogen and then stored at −80°C.
DF reduced UA in HUA mice and its protective effect on kidney. (a) Experimental procedure. (b) Body weight changes. (c) Serum UA levels. (d) Serum urea nitrogen levels. (e) Serum creatinine levels. Data are presented as mean ± sd (n 7 per group). *P < 0·05, **P < 0·01 and ***P < 0·001 represent significance between each group compared with M group. #P < 0·05, ##P < 0·01 and ###P < 0·001 represent significance between M group compared with N group. DF, dietary fibre; UA, uric acid; HUA, hyperuricaemia.

Determination of biochemical indicators
SUA, cerebral UA, BUN, malondialdehyde and Cr levels were measured using commercial kits from Nanjing Jiancheng Biotechnology, following the instructions. Levels of TLR4, NF-κB, liver XOD, SOD, GSH-Px, and serum IL-6, IL-1β and IL-10 and TNF-α were quantified using ELISA kits from Nanjing Enzyme Immunoassay Biotechnology.
Behavioural testing
The Open-Field Test evaluates the autonomous behaviour, anxiety-like behaviour and stress of experimental animals in new environments. We used Open-Field Test to assess the neuroprotective effect of dietary fibre in mice. The apparatus consisted of a 50 × 50 × 35 cm black plastic box (width × length × height), with the bottom divided into sixteen grids. The central four grids formed the central zone, while the surrounding twelve grids were designated as the peripheral zone. A mouse was placed in the centre of the arena, and its movements were recorded for 10 min by a video camera. Behavioural data were analysed using the VisuTrack animal behaviour analysis system (Shanghai XinRuan Information Technology Co. Ltd, China). After each test, the box was cleaned with 75 % alcohol to remove olfactory cues.
DNA extraction and sequence analysis of faecal samples
Fresh faecal samples from each mouse were collected in individual sterile EP tubes at week 4, then immediately frozen in liquid nitrogen and stored at −80°C. The bacterial genomic DNA was extracted from the faecal samples using an E.Z.N.A.® soil DNA Kit as per the manufacturer’s instruction. The extracted genomic DNA was amplified with barcoded conventional primer pairs 338F (5’-ACTCCTACGGGAGGCAGCAG-3’) and 806R (5’- GGACTACHVGGGTWTCTAAT-3’) based on the bacterial 16S rRNA gene V3–V4 hypervariable region. The resulting PCR products were extracted from a 2 % agarose gel, purified using an AxyPrep DNA Gel Extraction Kit (Axygen Biosciences, USA) and further quantified using the Quantus™ Fluorimeter (Promega, USA). The purified amplicons were pooled in equal amounts and paired-end sequenced (2 × 300 bp) on an Illumina MiSeq platform following the standard protocols at Shanghai Majorbio BioPharm Technology Co. Ltd. (Shanghai, China). The 16S rDNA sequencing raw data were deposited in NCBI Sequence Read Archive under the accession number PRJNA1041986. Operational Taxonomic Units (OTU) clustering and taxon annotation (taxon relative abundance analysis and genus evolutionary analysis), multi-sample comparative analysis (non-metric multidimensional scaling analysis and linear discriminant analysis effect size analysis) and the significance test of community structural differences among the groups (Analysis of similarities) were used for sequence analysis. Taxa with significant differences among the groups were analysed by MetaStat, and the correlations between microbiota and metabolites were analysed by Spearman correlation analysis.
Non-targeted metabolomics analysis
The faecal samples were added to a centrifuge tube, and a diameter grinding bead was added. 400 μl of extraction solution (methanol: water = 4:1 (v:v)) containing 0·02 mg/ml of internal standard (L-2-chlorophenylalanine) was used for metabolite extraction and then centrifuged to remove the supernatant. The supernatant was collected after centrifugation, and the samples were analysed. The samples were gradient eluted using a HSS T3 chromatographic column (100 × 2·1 mm, 1·8 μm, Waters, USA) with a flow rate of 0·40 ml/min and a column temperature of 40°C. The Q Exactive™ HF-X mass spectrometer was operated in the positive and negative polarity modes. Then, the R package ‘ropls’ (version 1.6.2) was used to perform principal component analysis and orthogonal least partial squares discriminant analysis (OPLS-DA). The metabolites with variable importance in projection > 1 and P < 0·05, were determined as significantly different metabolites, through metabolic enrichment and pathway analysis based on Kyoto Encyclopedia of Genes and Genomes (KEGG) database. Python packages ‘scipy.stats’ were used to perform enrichment analysis to obtain the most relevant biological pathways for experimental treatments.
Statistical analysis
Statistical Analysis All bar graphs in this study were generated using GraphPadPrism 9.0, and the data are reported as the standard deviation of the means. Data were tested for normality and homogeneity of variance by SPSS 26.0 using the Shapiro–Wilk test and F test, respectively. If the data satisfy normal distribution, the student t test was used. If the data did not satisfy normality and χ2, the Mann–Whitney U test was used with significant set at P < 0·05. Some of the figures were created using BioRender (www.biorender.com).
Results
Effects of dietary fibre on serum uric acid, creatinine and blood urea nitrogen levels in hyperuricaemia mice
In terms of body weight changes, Tn, the M group had a significantly lower body weight gain than the N group, and the rest of the groups were not significantly different from the N group (Fig. 1(b)). Compared with the N group, the SUA level in the M group was significantly higher (P < 0·001), indicating that the HUA model induced by potassium oxonate was successful. In contrast, SUA levels were significantly lower in the AP, Pro-S, IDF, CDF and L-CDF groups (Fig. 1(c)). We also observed that compared with the N group, the BUN and Cr levels in the M group were significantly higher (P < 0·001; P < 0·001), whereas the serum BUN and Cr levels in the AP, IDF, CDF and L-CDF groups were significantly lower (Fig. 1(d) and (e)). Therefore, we concluded that DF could effectively reduce UA levels and achieved similar effects with AP and Pro-S groups, protecting the normal operation of renal function.
Effect of dietary fibre on xanthine oxidase activity and content
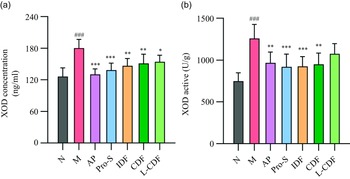
Compared with the N group, XOD activity and content in liver tissues were elevated by 68 % and 43 % in the model group (Fig. 2(a) and (b)). Meanwhile, liver XOD activity and content were significantly reduced after AP intervention compared with the M group. XOD activity was reduced by 28 %, 25 %, 26 %, 24 % and 13 % in the liver tissues of AP, Pro-S, IDF, CDF and L-CDF groups. However, L-CDF failed to significantly reduce XOD activity in HUA mice. Compared with the M group, the XOD content was reduced by 27 %, 23 %, 18 %, 16 % and 14 % in the liver tissues of AP, Pro-S, IDF, CDF and L-CDF groups, respectively.
The effect of DF on XOD content and active in the liver. (a) XOD concentration and (b) XOD active in the liver. *P < 0·05, **P < 0·01 and ***P < 0·001 represent significance between each group compared with M group. #P < 0·05, ##P < 0·01 and ###P < 0·001 represent significance between M group compared with N group. DF, dietary fibre; XOD, xanthine oxidase.

Dietary fibre slows down oxidative stress and inflammatory responses
The study revealed that levels of SOD and GSH-Px were significantly lower in the liver tissue of the M group (P < 0·001 for both), as shown in Fig. 3(c) and (d). In contrast, these levels were notably higher in the AP, Pro-S, IDF and CDF groups compared with the M group. Specifically, while the GSH-Px levels were significantly increased in the L-CDF group, no significant change was observed in SOD levels. Additionally, as a critical marker of oxidative damage, malondialdehyde levels were significantly elevated in the M group (Fig. 3(e)). However, these levels were substantially reduced in the AP, Pro-S, IDF and CDF groups. This suggests that both DF reduced oxidative damage induced by HUA.
DF slows down oxidative stress and inflammatory responses. (a) TLR4 concentration. (b) NF-κB concentration. (c) SOD concentration. (d) GSH-Px concentration. (e) MDA concentration. (f) IL-10 concentration. (g) IL-1β concentration. (h) TNF-α concentration. (i) IL-6 concentration. *P < 0·05, **P < 0·01 and ***P < 0·001 represent significance between each group compared with M group. #P < 0·05, ##P < 0·01 and ###P < 0·001 represent significance between M group compared with N group. DF, dietary fibre; Toll-like receptor 4; SOD, superoxide dismutase; GSH-Px, glutathione peroxidase; MDA, malondialdehyde.

TLR4/NF-κB pathway as an important pathway of inflammatory response, we did quantitative detection of TLR4 and NF-κB in mice cerebral tissue. Compared with the N group, the levels of TLR4 and NF-κB were significantly increased in the M group (Fig. 3(a) and (b)), while the levels of inflammatory factors IL-1β and IL-6 and TNF-α were significantly elevated in the serum (Fig. 3(g)–(i)). This indicated that potassium oxonate-induced mice were in an inflammatory state. In contrast, all these indicators were significantly reduced in the AP group. Under the intervention of DF, compared with the M group, the CDF group and L-CDF group significantly reduced the NF-κB content, and TLR4 also showed a decreasing trend, but there was no significant relationship. This result was similar to the Pro-S group. Compared with the N group, the serum levels of IL-6, IL-1β and TNF-α were significantly increased, and the anti-inflammatory factor IL-10 was significantly decreased in the M group (Fig. 3(f)). This suggests that, in the overall view, AP, Pro-S and DF can reduce the levels of IL-6, IL-1β and TNF-α and increase the level of IL-10 to different degrees. However, it is worth noting that the L-CDF group did not show significant changes from the M group.
Dietary fibre reduces amyloid-β deposition and alleviates neuroanxiety
Previous studies have shown that the urea cycle has an important role in normal cerebral cognitive function and that elevated UA may have an effect on behavioural cognition in mice(Reference Handley, Reid and Brauning21,Reference Mijailovic, Vesic and Borovcanin22) . We did quantitative tests on UA and Aβ in cerebral tissue, and the results showed that the UA level was significantly increased in the cerebral of the M group compared with the N group (Fig. 4(a)). Compared with the M group, AP, Pro-S, IDF, CDF and L-CDF groups were significantly decreased, which was consistent with the results of serum UA assay. In addition, Aβ content was significantly deposited in the M group compared with the N group, and Aβ content was significantly reduced in the AP, Pro-S, IDF, CDF and L-CDF groups compared with the M group (Fig. 4(b)). The results of the Open-Field Test showed 20 % reduction in the distance travelled in the M group compared with the N group (Fig. 4(c)). Compared with the M group, Pro-S, IDF and CDF groups were significantly higher. In addition, the HUA mice significantly reduced the exploration behaviour in the central region compared with the N group (Fig. 4(d) and (e). The time of exploration in the central region was significantly higher in the AP, Pro-S, IDF and CDF groups than in the M group.
DF reduces Aβ deposition and alleviates neuroanxiety. (a) Cerebral UA level. (b) Aβ level. (c) The total distance and (d) time spent in centre. (e) Representative exploration traces of OFT. *P < 0·05;**P < 0·01; ***P < 0·001 represent significance between each group compared with M group. #P < 0·05; ##P < 0·01; ###P < 0·001 represent significance between M group compared with N group. DF, dietary fibre; Aβ, amyloid-β; UA, uric acid; OFT, Open-Field Test.

Dietary fibre changed the structure of gut microbiota in hyperuricaemia mice
Diversity analysis and species composition analysis of gut microbiota
We investigated the relationship between gut microbiota changes and the development of HUA. Alpha diversity measures (Chao 1 and Shannon indices) and beta diversity were used to assess microbial diversity within and between groups. The results showed that interventions with AP, Pro-S, IDF, CDF and L-CDF significantly altered gut microbiota structure (Fig. 5(a)). Non-metric multidimensional scaling analysis revealed distinct differences in gut microbiota between the M group and N group. The Pro-S and AP groups showed marked differences from the N group, indicating that AP and probiotics, while reducing UA, significantly affected gut microbiota. In contrast, the IDF, CDF, L-CDF and N groups showed minimal differences, suggesting that DF interventions could mitigate potassium oxonate’s effects on gut microbiota in mice, maintaining a normal microbial composition (Fig. 5(b)). At the phylum level, dominant taxa included Firmicutes, Bacteroidetes, Actinobacteria, Proteobacteria and Desulfobacteria. The M group, compared with the N group, showed an increased relative abundance of Desulfobacteria, which was suppressed in other intervention groups. In terms of Firmicutes/Bacteroidetes (F/B rate), the F/B rate of HUA mice was higher than that of the N group, which was consistent with the results of Liu’s study(Reference Liu, Lv and Ren23). In contrast, in the AP group, there was a similar increasing trend in F/B, which may be related to the reduction of the relative abundance of Mycobacterium anomalum by AP(Reference Sun, Xu and Zhang24). The F/B rate ratio, influenced by dietary interventions, mirrored that of the N group (online Supplementary Fig. S2). At the genus level, Lactobacillus abundance increased in the M, AP and Pro-S groups, while groups receiving DF closely resembled the N group. These findings highlight DF supplementation’s potential in preserving microbiota composition and structure in HUA mice (Fig. 5(c)).
CDF changed the structure of gut microbiota in HUA mice. (a) Chao index and Shannon index in each group. (b) Non-metric multidimensional scaling (NMDS) analysis of gut microbiota on OTU level in each group. (c) Relative abundance changes of gut microbiota on genus level. (d) The comparison of bacterial microbiota between M and N at genus level. (e) The comparison of bacterial microbiota between M and CDF at genus level. CDF, complex dietary fibre; HUA, hyperuricaemia.

Analysis of significant differences in the types of gut microbiota
To assess the impact of AP, Pro-S, IDF, CDF and L-CDF on the mouse gut microbiota with HUA, we conducted a comparative analysis to identify key differential biomarkers. In the M group, significant increases were observed in Desulfovibrio, Streptococcus, norank_f_norank o_Clostridia_UCG-014 and norank f_Oscillospiraceae. This is consistent with studies of diabetes and the gut–brain axis (Fig. 5(d))(Reference Wang, Shen and Fu25–Reference Yan, Chen and Zhu28). Desulfovibrio, known to impair the gut barrier and increase permeability, was notably abundant. AP enriched Lactobacillus and norank f_norank o_Clostridia_UCG-014, while reducing Lachnospiraceae NK4A136 group, Rikenella, Mucispirillum and Desulfovibrio (online Supplementary Fig. S3). Pro-S resulted in an enrichment of Lactobacillus and norank f_Eggerthellaceae and a decrease in Rikenella, Mucispirillum and Desulfovibrio in the Pro-S group (online Supplementary Fig. S4). IDF increased the presence of GCA-900066575, norank_f_Eubacterium_coprostanoligenes_group, UCG-003 (online Supplementary Fig. S5). The L-CDF group saw an enrichment of norank_f_norank_o_Clostridia_UCG-014, Akkermansia, norank_f_Ruminococcaceae and Parabacteroides and a decrease in Candidatus_Saccharimonas and Anaerofustis (online Supplementary Fig. S6). The CDF group experienced an increase in Akkermansia, Muribaculum and Prevotellaceae_NK3B31_group and a reduction in Lachnospiraceae_NK4A136_group, Desulfovibrio and Streptococcus (Fig. 5(e)). These findings suggest that DF diminishes harmful bacterial colonisation and promotes the growth of beneficial species such as Akkermansia and Prevotellaceae.
Linear discriminant analysis effect size analysis of gut microbiota
To further explore microbial group alterations across the seven experimental groups, linear discriminant analysis effect size analysis was performed. This method identified biomarkers and visualised dominant microorganisms through linear discriminant analysis (LDA) score histograms and classification evolutionary branch diagrams (LDA > 4). Linear discriminant analysis effect size analysis revealed significant differences at the phylum level, particularly in Patescibacteria, Verrucomicrobiota, Desulfobacterota, Bacteroidota and Firmicutes. At the genus level, notable differences were found in Akkermansia, Saccharimonas, Lachnospiraceae_NK4A136_group and Desulfovibrio, especially between the M group and the N group. After the supplementation of AP, g_Lactobacillus and other bacteria were enriched. After the supplementation of IDF, g_Rikenella, f_Deferribacteraceae, g_Mucispirillum, p_Deferribacterota and other bacteria were enriched. After the supplementation of CDF, f_Muribaculaceae, f_Muribaculaceae, o_Bacteroidales, c_Bacteroidia and other bacteria were enriched (online Supplementary Fig. S7).
Effect of complex dietary fibre on the metabolism of hyperuricaemia mice
Metabolite spectrum analysis
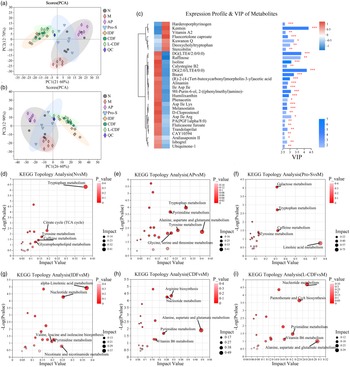
Principal component analysis was utilised to detect outlier samples and cluster those with high similarity. The proximity of samples within the principal component analysis plot reflects their similarity, with greater distances indicating more variability. The figure shows that the quality control samples are tightly clustered, demonstrating the liquid chromatography-mass spectrometry system’s robust stability during the analytical process. A distinct separation trend was observed between the M group and the N group, AP group, IDF group, CDF group and L-CDF group. Within each group, samples clustered cohesively, indicating significant metabolic variations between groups. The separation among the IDF, L-CDF and CDF groups was less pronounced, consistent with expected results (Fig. 6 (a) cation; (b) anion). Notably, the significant spatial distance between the dietary fibre intervention group and the M group highlights the effectiveness of DF intervention in regulating metabolic dysregulation of the gut microbiota caused by potassium oxonate.
Effect of CDF on metabolism of HUA mice. (a) Scores plot of PCA analysis of all samples of positive ion mode. (b) Score plot of PCA analysis of all samples of negative ion mode. (c) Expression profile, VIP score, and P value of the top 30 differential serum metabolites in M compared with N. Detection of the metabolic pathway topology analysis. (d) N Group v. M group. (e) AP group v. M group. (f) AP group v. M group. (g) IDF group v. M group. (h) CDF group v. M group. (i) L-CDF group v. M group. Each bubble represents a metabolic pathway. CDF, complex dietary fibre; HUA, hyperuricaemia; PCA, principal component analysis; VIP, variable importance in projection; AP, allopurinol; IDF, inulin dietary fibre; L-CDF, low-dose complex dietary fibre.

Screening of differential metabolites
Orthogonal least partial squares discriminant analysis revealed significant differences in faecal metabolites between the N group and the M group, as well as between the M group and the AP, Pro-S, IDF, CDF and L-CDF groups. Differential metabolites were identified based on the variable importance in projection score from the orthogonal least partial squares discriminant analysis model and Student’s t test P value (variable importance in projection > 1 and P < 0·05). A total of 1624 differential metabolites were identified through comparison and screening. Compared with the N group, levels of proline, tryptophan, tyrosine, 7-methylxanthine and 7-deoxyguanosine significantly decreased in the M group (P < 0·05), while 7-methyladenine, arachidonic acid glycerol, myristic acid, 3,4,5,6-tetrahydrohippUA, N′-formylkynurenine, 5-hydroxyindoleacetic acid salt and urochole significantly increased (P < 0·001). Conversely, compared with the M group, deoxyguanosine, adenine, oxypurine alcohol, 7-methyladenine, 1-methylguanine, hypoxanthine and dihydrouracil were notably decreased in the CDF and IDF groups. Lysine, 7-methyladenine, deoxycholic acid, N-eicosapentaenyl tryptophan and isoleucine were significantly reduced in the Pro-S group (Fig. 6(c)).
Analysis of differential metabolic pathways
We utilised the scipy pathway analysis module to examine the metabolic functions of identified differential metabolites. The accompanying figure displays the top 20 pathways, encompassing protein digestion and absorption; arginine and proline metabolism; biosynthesis of phenylalanine, tyrosine and tryptophan; ATP-binding cassette transporters; and nucleotide metabolism. Additionally, KEGG topological analysis was conducted to explore the differential metabolite pathways between groups (P < 0·05), specifically focusing on the top five pathways. This analysis unveiled significant differences in metabolic pathways influenced by CDF to those affected by AP and probiotic supplements. Notably, both the IDF group and the CDF group shared pathways in nucleotide and pyrimidine metabolism. Furthermore, the metabolic pathways involving alanine, aspartic acid and glutamic acid were notably enriched in the AP group, CDF group and L-CDF group, suggesting a positive effect on UA metabolism (Fig. 6(d)–(i)).
Correlation analysis of gut microbiota and metabolites
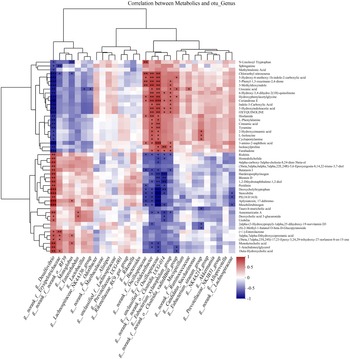
Spearman correlation analysis identified a strong positive correlation between the genera such as Lachnospiraceae NK4A136 group, Desulfovibrio and Erysipelotrichaceae and various metabolites including hypoxanthine, urecholine hydrochloride, hydroxypurine, 2,6-dihydroxypurine, 2ʼ-deoxyinosine, 3ʼ-deoxyinosine, 4-methyl-2-oxopentanoic acid and arachidonic acid ester. Conversely, these metabolites showed a negative correlation with norank_f_Muribaculaceae, Prevotellaceae UCG-001, Ruminococcaceae, Akkermansia and Prevotellaceae NK3B31 group. Significantly, the Prevotellaceae NK3B31 group was positively correlated with SCFA such as hydroxybutyric acid, and energy metabolism–related complexes including sucrose and succinic acid, as well as the antioxidant cysteine (Fig. 7).
Spearman correlation analysis of the gut microbiota and metabolomics. Note: the red oval indicates a positive correlation, and the blue oval indicates a negative correlation between the gut microbiota and metabolomics.

Correlation analysis of gut microbiota and inflammatory factors
The images are heatmap analyses of the correlation between UA, inflammatory factors (IL-1β, IL-6 and TNF-α), anti-inflammatory factors (IL-10) and gut microorganisms (genus level, abundance ranked in the top 20) (Fig. 8). norank_f_Erysipelotrichaceae, norank_f_norank_o_RF39, Desulfovibrio and Lachnospiraceae_NK4A136_group were significantly positively correlated with UA levels, inflammatory factors, and significantly negatively correlated with anti-inflammatory factors (P < 0·05). Among them, norank_f_Erysipelotrichaceae was particularly significant in this relationship, which was similar to the results of previous studies(Reference Kaakoush29). Alloprevotella, norank_f_norank_Clostridia_UCG-014 was negatively correlated with UA levels, pro-inflammatory factors, and positively correlated with anti-inflammatory factors, which is consistent with the results of previous studies on beneficial body effects(Reference Downes, Dewhirst and Tanner30). Interestingly, Enterorhabdus showed a positive correlation with UA levels and inflammatory factors and a negative correlation with anti-inflammatory factors, which is consistent with the findings of Zhang’s team(Reference Meng, Hu and Wei31). Rikenella showed a significant correlation with UA levels (P < 0·05), while similar results were found in a study of a mouse model of chronic renal failure induced using a 0·2 % adenine diet(Reference Wang, Hu and Ye32).
Correlation analysis of gut microbiota and inflammatory factors. Note: the red oval indicates a positive correlation, and the blue oval indicates a negative correlation between the gut microbiota and inflammatory factors.

Discussions
In this study, we compared the changes in gut microbiota and metabolites in HUA mice by three common interventions: drugs, probiotics and DF (IDF and CDF) through the microbiome and metabolome. Previous studies have shown that single DF is an effective approach for the prevention and treatment of metabolic system disorders(Reference Pan, Han and Ma33,Reference Zhang, Chen and Yuan34) . It is worth noting that various dietary fibres contribute to the complex functions and interactions of gut microbiota. However, the combined effects of multiple dietary fibres on the prevention of HUA have not been thoroughly explored.
Studies have demonstrated that human UA is synthesised in the liver through urea catalysis by XOD and subsequently excreted through gut microbiota and renal filtration(Reference Srivastava, Kaze and McMullan35). The excessive accumulation of UA can impair renal filtration and eventually lead to the development of gout(Reference Chilappa, Aronow and Shapiro36). Our finding indicates that DF has the ability to inhibit the activity and expression of XOD, thereby reducing UA production in the body. Additionally, based on the results of BUN and Cr, DF was found to protect normal kidney function in HUA mice by ensuring UA excretion and reducing its accumulation in vivo (Reference Leblanc, Garred and Cardinal37). Furthermore, DF has been shown to up-regulate levels of SOD and GSH-Px while decreasing malondialdehyde production – an oxidative stress product. This serves to scavenge free radicals post-oxidative stress, improve antioxidant capacity and reduce damage caused by oxidative stress within the body(Reference Chaudhary, Janmeda and Docea38). Oxidative stress damage coupled with fluctuations in gut microbiota can induce inflammatory factor production(Reference Li, Lin and Zhang39,Reference Tomasello, Mazzola and Leone40) . The results demonstrate significant changes in pro-inflammatory and anti-inflammatory factors between the M group compared with the N group, indicating that HUA mice were experiencing an inflammatory state. This inflammatory response may be attributed to elevated UA levels, imbalanced in gut microbiota as well as increased gut permeability among mice(Reference Bian, Wang and Wang41). However, intervention with DF significantly altered this phenomenon – suggesting that supplementation with CDF can help reduce both production and accumulation of UA while also decreasing overall inflammatory responses within the body. Moreover, it helps protect normal kidney function.
In this study, we observed a significant shift in the composition of gut microbiota in HUA mice, particularly in the F/B ratio, which plays a crucial role in gut homeostasis and is implicated in HUA. Although the F/B ratio in the M group exceeded that of the N group, the difference was not statistically significant, consistent with findings from another preclinical study(Reference Li, Chen and Gao42). However, it is noteworthy that the drug and probiotic treatments notably deviated from this pattern. This emphasises the necessity for further research to elucidate the relationship between the F/B ratio and HUA. Notably, under dietary fibre intervention, the F/B ratio approached normal levels, suggesting that while both drug and probiotic treatments reduced UA levels, they significantly altered gut microbiota. NMDS analysis supported these findings. At the phylum level, an increase in Desulfobacter and Lachnospiraceae_NK4A136 group was documented in the model group, consistent with previous studies(Reference Oshima, Shiiya and Nakamura43). Desulfovibrio is a detrimental bacterium found in human colonic microbiota; its presence can decrease goblet cell numbers and mucin production leading to compromised mucus barrier and increased gut permeability. This may facilitate lipopolysaccharide translocation into the bloodstream triggering inflammation(Reference Zhang, Qin and Qiu44,Reference Fang, Wang and Zhou45) . Moreover, the abundance of Desulfovibrio correlates with the severity of neurological conditions such as Parkinson’s disease(Reference Murros, Huynh and Takala46,Reference Huynh, Takala and Murros47) . CDF intervention not only reduced Lachnospiraceae_NK4A136 and Desulfovibrio populations but also enhanced beneficial acetic acid-producing bacteria like AKK, Streptococcus and UCG003, as well as Rhodospirillales, which are conducive to gut barrier integrity that a benefit not mirrored in the drug treatment group. Given that HUA has been linked to Alzheimer’s disease progression, our findings of reduced anxiety and improved exploratory behaviour in HUA mice due to DF intake are significant(Reference Mijailovic, Vesic and Borovcanin22,Reference Li, Ma and Bi48) . These behavioural changes, coupled with decreased UA, TLR4, NK-κB and Aβ levels in the brain, parallel the benefits seen with IDF(Reference Xu, Yang and Li49,Reference Sun, Koyama and Shimada50) , hinting at the potential of adequate DF consumption in preventing neurodegenerative disorders such as autism and Alzheimer’s disease(Reference Nettleton, Klancic and Schick51–Reference Inoue, Sakaue and Kawada53).
The accumulation of UA may precipitate renal acid–base imbalance, mitochondrial dysfunction and acute kidney injury, while also enhancing renal glutamine and glutamate uptake(Reference Valdivielso, Eritja and Caus54,Reference Wang, Halimulati and Huang55) . Elevated Aβ levels further influence N-methyl-D-aspartic acid receptor receptor-mediated glutamine transformation, suggesting a potential glutamine and glutamate deficiency or overdrive in HUA mice(Reference Olajide and Chapman56,Reference Wu, Du and Xu57) . This study’s KEGG pathway analysis revealed metabolic disturbances in tryptophan, citrate and tyrosine metabolism within the model group, aligning with prior research. Notably, CDF influenced various metabolic pathways akin to the AP group, with alanine, aspartate, glutamate metabolism and pyrimidine metabolism potentially crucial in HUA prevention. Earlier studies have corroborated that glycine and tryptophan supplementation markedly lower SUA in mild HUA(Reference Oshima, Shiiya and Nakamura43,Reference Oshima, Shiiya and Nakamura58) , highlighting their significant role in the citric acid cycle and tryptophan metabolism. Additionally, our findings suggest a distinct vitamin B6 metabolism under CDF supplementation. While vitamin B6 direct link to UA levels is not established, its association with cardiovascular, metabolic and neurological diseases is well recognised(Reference Han, Lim and Lee59,Reference Zhang and Qiu60) , including its use in alleviating dexamethasone-induced depression(Reference Wang, Li and Montazeri61–Reference Theofylaktopoulou, Ulvik and Midttun63). Thus, the contributory role of vitamin B6 metabolism in UA reduction warrants further investigation. This study showed that although the Pro-S group, AP group and the DF intervention group were all effective in preventing the occurrence of HUA, it is worth noting that the DF group was different from the other two groups in that it was derived from food and could be obtained naturally, rather than chemically synthesised or cultured in vitro. In this perspective, DF interventions may be superior to traditional pharmacological and probiotic interventions in the disease prevention phase. This also suggests the importance of a balanced nutrient intake.
Conclusions
In summary, this study showed that DF inhibits UA production by regulating the structure and metabolism of gut microbiota, inhibiting hepatic XOD activity and reducing hepatic XOD expression, and also has anti-inflammatory, hepatoprotective and anti-kidney injury effects, alleviating neurological damage in HUA mice. Compared with drug and probiotic group, it is more advantageous in maintaining the structure of gut microbiota. However, whether the positive therapeutic effects of CDF are mediated by changes in the gut microbiota should be further explored by faecal microbiota transplantation and targeting the metabolome. Our findings provide evidence that DF–gut microbiota interactions can alleviate HUA, as well as provide an important basis for the prevention and treatment of HUA through dietary modification(Reference Zhang, Chen and Yuan34,Reference Wang, Chen and Zhong64) .
Acknowledgements
The project was supported by Science & Technology Specific Projects in Agricultural High-tech Industrial Demonstration Area of the Yellow River Delta, grant no. 2022SZX01.
Y. W.: methodology, data analysis, software, visualisation and writing – original draft. F. M.: conceptualisation, resources, supervision, writing – original draft – and project administration. Y. Y.: conceptualisation, data interpretation, supervision, funding acquisition, project administration and writing – review and editing. J. W.: conceptualisation and methodology. M. Z.: resources and project administration. F. Y.: conceptualisation and resources.
The authors declared no competing interests.
Supplementary material
For supplementary material(s) referred to in this article, please visit https://doi.org/10.1017/S0007114524001211.