


1 Introduction
Lower hybrid current drive (LHCD) (Fisch Reference Fisch1978; Bernabei et al. Reference Bernabei, Daughney, Efthimion, Hooke, Hosea, Jobes, Martin, Mazzucato, Meservey and Motley1982; Fisch Reference Fisch1987) plays a key role in controlling the current profile in tokamak experiments aimed at improving confinement and stability of fusion plasmas. The first high confinement (H-mode) plasma by LHCD was obtained in limiter configuration in JT-60 (Tusji et al. Reference Tusji, Ushigusa, Ikeda, Imai, Nemoto, Nagashima, Koide, Kawano, Fukuda and Kondoh1990). In joint European torus (JET), a long lasting internal transport barrier (ITB) was sustained during H-mode operation using LHCD (Crisanti et al. Reference Crisanti, Litaudon, Mailloux, Mazon, Barbato, Baranov, Bécoulet, Bécoulet, Challis and Conway2002; Cesario et al. Reference Cesario, Cardinali, Castaldo, Paoletti and Mazon2004). Recently, the LHCD H-mode has been extensively obtained in EAST (Xu et al. Reference Xu, Wan, Wang, Guo, Zhao, Liu, Naulin, Diamond, Tynan and Xu2011; Ding et al. Reference Ding, Kong, Li, Zhang, Wei, Wang, Xu, Li, Ling and Zang2013a ,Reference Ding, Kong, Zhang, Ekedahl, Li, Zhang, Wei, Li, Wu and Xu b ; Liu et al. Reference Liu, Ding, Li, Wan, Shan, Wang, Liu, Zhao, Li and Li2015; Wan et al. Reference Wan, Li, Guo, Liang, Xu, Wang, Gong and Garofalo2015). However, concerning a fusion reactor, at least two issues must be solved, namely a good lower hybrid wave (LHW)–plasma coupling and effective current drive capability at high density, since high density is inevitable in fusion reactors. As mentioned in the following sections, related works have been studied and continued in many fusion devices, including Japan tokamak-60 upgrade (JT-60U), axially symmetric divertor experiment (ASDEX), JET, Tore-supra, Hefei tokamak-7 (HT-7), Alcator C-Mod and frascati tokamak upgrade (FTU).
In order to obtain the scientific goal of EAST (a long pulse and high performance), two LHCD systems have been developed and exploited on EAST, operating, respectively, at 2.45 GHz (4 MW) (Ding et al.
Reference Ding, Qin, Li, Li, Kong, Zhang, Ekedahl, Peysson, Decker and Wang2011, Reference Ding, Li, Zhang, Li, Wei, Kong, Wang, Xu, Wang and Xu2015) and 4.6 GHz (6 MW) (Ding et al.
Reference Ding, Kong, Li, Zhang, Wei, Wang, Xu, Li, Ling and Zang2013a
,Reference Ding, Kong, Zhang, Ekedahl, Li, Zhang, Wei, Li, Wu and Xu
b
). Typical spectra calculated by an advanced lower hybrid antenna (ALOHA) (Hillairet et al.
Reference Hillairet, Voyer, Ekedahl, Goniche, Kazda, Meneghini, Milanesio and Preynas2010) are shown in figure 1, in which $N_{/\!/}$
is the refractive index in the parallel direction,
$N_{/\!/}$
is the refractive index in the parallel direction, $N_{/\!/}^{peak}$
is the corresponding peak value and
$N_{/\!/}^{peak}$
is the corresponding peak value and $\unicode[STIX]{x0394}\unicode[STIX]{x1D6F7}$
refers to the phase difference between the adjacent main waveguides. For clarity, the spectrum with
$\unicode[STIX]{x0394}\unicode[STIX]{x1D6F7}$
refers to the phase difference between the adjacent main waveguides. For clarity, the spectrum with $0\leqslant N_{/\!/}\leqslant 4$
is displayed. Aiming at exploring the role of LHCD in a fusion reactor, related studies in EAST including LHW–plasma coupling and current drive capability toward to high density have been performed and are summarized as follows.
$0\leqslant N_{/\!/}\leqslant 4$
is displayed. Aiming at exploring the role of LHCD in a fusion reactor, related studies in EAST including LHW–plasma coupling and current drive capability toward to high density have been performed and are summarized as follows.
Typical spectra for the 4.6 GHz (a) and 2.45 GHz (b) LH antennas calculated by the ALOHA code ( $N_{/\!/}$
is the refractive index in parallel direction,
$N_{/\!/}$
is the refractive index in parallel direction, $N_{/\!/}^{peak}$
is the corresponding peak value,
$N_{/\!/}^{peak}$
is the corresponding peak value, $\unicode[STIX]{x0394}\unicode[STIX]{x1D6F7}$
refers to the phase difference between the adjacent main waveguides. The directivity defined by the ratio of power with positive
$\unicode[STIX]{x0394}\unicode[STIX]{x1D6F7}$
refers to the phase difference between the adjacent main waveguides. The directivity defined by the ratio of power with positive $n_{/\!/}$
to total power is 74 %–75 % and 76 %–77 % for 2.45 GHz and 4.6 GHz, respectively.).
$n_{/\!/}$
to total power is 74 %–75 % and 76 %–77 % for 2.45 GHz and 4.6 GHz, respectively.).

2 Issue of LHW–plasma coupling
Good LHW–plasma coupling is the first necessary condition for LHCD experiments, especially for sustaining a long pulse H-mode. In the H-mode plasma, the edge density will decrease rapidly enough that the density at the grill mouth does not satisfy the wave–plasma coupling condition (Brambilla Reference Brambilla1976; Petržilka et al. Reference Petržilka, Leuterer, Söldner, Giannone and Schubert1991), resulting in a large reflection. Consequently, the LHW power cannot be effectively coupled to the plasma if the plasma density at the grill is below the cutoff density.
Top view of local gas puffing for electron drift side and ion drift side.

Coupling comparison between gas puffing from electron side (GIM_e) and ion side (GIM_i) (a) reflection coefficient, (b) density at the last closed flux surface (LCFS) and (c) density at the poloidal limiter ( $f=0.45$
GHz).
$f=0.45$
GHz).

To improve LHW–plasma coupling, local gas puffing near the antenna has been developed, which has been studied in JT-60U, ASDEX, JET, Tore-supra, HT-7 (Leuterer et al. Reference Leuterer, Söldner, Brambilla, Munich, Monaco, Zouhar, Bartiromo, Tuccillo, Bernabei and Forest1991; Ikeda et al. Reference Ikeda, Naito, Kondoh, Seki, Ide, Asakura, Bernabei, Fujita, Itami and Kamada1994; Pericoli-Ridolfini et al. Reference Pericoli-Ridolfini, Ekedahl, Erents, Mailloux, Podda, Sarazin and Tuccillo2004; Ekedahl et al. Reference Ekedahl, Granucci, Mailloux, Baranov, Erents, Joffrin, Litaudon, Loarte, Lomas and Mcdonald2005, Reference Ekedahl, Rantamäki, Goniche, Mailloux, Petrzilka, Alper, Baranov, Basiuk, Beaumont and Corrigan2009, Reference Ekedahl, Petrzilka, Baranov, Biewer, Brix, Goniche, Jacquet, Kirov, Klepper and Mailloux2012; Ding et al. Reference Ding, Li, Qin, Li, Zhang, Shan, Liu, Wang, Meng and Xu2010). Also, in EAST, with the 2.45 GHz LHCD system, local gas puffing from the electron drift side (GIM_e) and ion drift side (GIM_i), as shown in figure 2, was studied (Ding et al. Reference Ding, Kong, Li, Zhang, Wei, Wang, Xu, Li, Ling and Zang2013a ,Reference Ding, Kong, Zhang, Ekedahl, Li, Zhang, Wei, Li, Wu and Xu b ). The experimental results are shown in figure 3, indicating the effect of gas puffing on coupling improvement from the electron drift side is better than that from the ion drift side. It is seen that, for the same gas flow, the reflection coefficient (RC) in the case of GIM_i gas puffing is a little higher, implying that the density at the grill mouth in this case is less favourable to the coupling. This is also demonstrated by the measured edge density. The difference in the edge density between electron- and ion-side cases suggests that local ionization of puffed gas plays a dominant role in affecting the grill density due to different movement direction of ionized electrons and that part of gas has been locally ionized near the gas pipe before diffusing into the grill region (Ding et al. Reference Ding, Kong, Li, Zhang, Wei, Wang, Xu, Li, Ling and Zang2013a ,Reference Ding, Kong, Zhang, Ekedahl, Li, Zhang, Wei, Li, Wu and Xu b ).
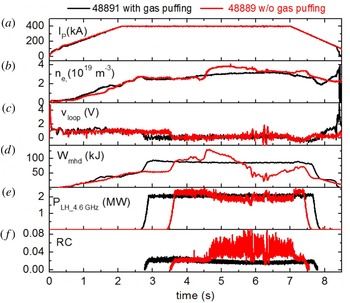
Referenced from the above study, only local gas puffing structures from the electron drift side were installed on EAST, both for 2.45 GHz and 4.6 GHz, so as to save the space in the device. Similar to the 2.45 GHz LHCD, as shown in figure 4, it is seen that the coupling with the 4.6 GHz LHW is improved by means of local gas puffing. Also, the coupling characteristics between low confinement (L-mode) and H-mode are also compared in figure 5. It is seen that, although the RC in the H-mode is higher than that in the L-mode, its level remains acceptable and does not much affect the coupling. Therefore, in routine experiments in EAST, local gas puffing from the electron drift side is utilized for good LHW–plasma coupling.
Coupling improved by means of local gas puffing ( $f=4.6$
GHz). (a) Plasma current (
$f=4.6$
GHz). (a) Plasma current ( $I_{p}$
), (b) central-line-averaged density (
$I_{p}$
), (b) central-line-averaged density ( $n_{e}$
), (c) loop voltage (
$n_{e}$
), (c) loop voltage ( $V_{loop}$
), (d) stored energy (
$V_{loop}$
), (d) stored energy ( $W_{mhd}$
) calculated with magnetic measurement, (e) internal inductance (li) and (f) reflection coefficient (RC).
$W_{mhd}$
) calculated with magnetic measurement, (e) internal inductance (li) and (f) reflection coefficient (RC).
Coupling characteristics comparison between L- and H-mode ( $f=4.6$
GHz).
$f=4.6$
GHz).

3 LHCD capability at high density
High density is a challenge with LHCD experiments. Reactor relevant high plasma density regimes have faced the LHCD tool with the challenge of effectively penetrating the main plasma without excessive power dissipation of the coupled radio frequency (RF) power at the edge. LHCD experiments on many tokamaks (Pericoli-Ridolfini, Giannone & Bartiromo Reference Pericoli-Ridolfini, Giannone and Bartiromo1994; Cesario et al.
Reference Cesario, Amicucci, Cardinali, Castaldo, Marinucci, Panaccione, Santini, Tudisco, Apicella and Calabrò2010; Wallace et al.
Reference Wallace, Parker, Bonoli, Hubbard, Hughes, Labombard, Meneghini, Schmidt, Shiraiwa and Whyte2010; Cesario et al.
Reference Cesario, Amicucci, Castaldo, Kempenaars, Jachmich, Mailloux, Tudisco, Galli and Krivska2011) have shown a decrease in non-thermal tails and a drop in bremsstrahlung emission much steeper than $1/n_{e}$
at high densities, which is stronger than expected based on current models. Similar results (Ding et al.
Reference Ding, Kong, Li, Zhang, Wei, Wang, Xu, Li, Ling and Zang2013a
,Reference Ding, Kong, Zhang, Ekedahl, Li, Zhang, Wei, Li, Wu and Xu
b
, Reference Ding, Li, Zhang, Li, Wei, Kong, Wang, Xu, Wang and Xu2015) have also been reported in EAST. Some possible mechanisms, including collisional absorption (CA) (Bonoli & Englade Reference Bonoli and Englade1986), parametric instabilities (PI) (Liu & Tripathi Reference Liu and Tripathi1986; Cesario et al.
Reference Cesario, Cardinali, Castaldo, Paoletti and Mazon2004) and scattering from density fluctuations (SDF) (Bonoli & Ott Reference Bonoli and Ott1982; Peysson et al.
Reference Peysson, Decker, Morini and Coda2011), individually or simultaneously, have been identified to preclude the penetration of LHWs, dissipating the power in the plasma periphery and degrading LH efficiency. In order to explore the experimental condition for high current drive (CD) efficiency at high density in EAST, experiments with a double null configuration with the 2.45 GHz LHW (
$1/n_{e}$
at high densities, which is stronger than expected based on current models. Similar results (Ding et al.
Reference Ding, Kong, Li, Zhang, Wei, Wang, Xu, Li, Ling and Zang2013a
,Reference Ding, Kong, Zhang, Ekedahl, Li, Zhang, Wei, Li, Wu and Xu
b
, Reference Ding, Li, Zhang, Li, Wei, Kong, Wang, Xu, Wang and Xu2015) have also been reported in EAST. Some possible mechanisms, including collisional absorption (CA) (Bonoli & Englade Reference Bonoli and Englade1986), parametric instabilities (PI) (Liu & Tripathi Reference Liu and Tripathi1986; Cesario et al.
Reference Cesario, Cardinali, Castaldo, Paoletti and Mazon2004) and scattering from density fluctuations (SDF) (Bonoli & Ott Reference Bonoli and Ott1982; Peysson et al.
Reference Peysson, Decker, Morini and Coda2011), individually or simultaneously, have been identified to preclude the penetration of LHWs, dissipating the power in the plasma periphery and degrading LH efficiency. In order to explore the experimental condition for high current drive (CD) efficiency at high density in EAST, experiments with a double null configuration with the 2.45 GHz LHW ( $N_{/\!/}^{peak}=2.1$
) were studied (Ding et al.
Reference Ding, Kong, Li, Zhang, Wei, Wang, Xu, Li, Ling and Zang2013a
,Reference Ding, Kong, Zhang, Ekedahl, Li, Zhang, Wei, Li, Wu and Xu
b
) by increasing density in one discharge with poor and strong lithiation, following the method assessed on FTU of the reduced PI effect under the higher temperature of the plasma edge (Cesario et al.
Reference Cesario, Cardinali, Castaldo, Paoletti and Mazon2004, Reference Cesario, Amicucci, Cardinali, Castaldo, Marinucci, Panaccione, Santini, Tudisco, Apicella and Calabrò2010). In the experiments, the local gas puffing from GIM_e is utilized. The capability of the current drive is estimated by the count of hard X-ray rate (60–200 keV) normalized by the injected LHW power, which is proportional to the current driven efficiency. Seen from the results shown in figure 6(a), in strongly lithiated discharge, there is no sudden decrease in driven current, where the hard X-ray radiation (HXR) counts deviate from the curve of
$N_{/\!/}^{peak}=2.1$
) were studied (Ding et al.
Reference Ding, Kong, Li, Zhang, Wei, Wang, Xu, Li, Ling and Zang2013a
,Reference Ding, Kong, Zhang, Ekedahl, Li, Zhang, Wei, Li, Wu and Xu
b
) by increasing density in one discharge with poor and strong lithiation, following the method assessed on FTU of the reduced PI effect under the higher temperature of the plasma edge (Cesario et al.
Reference Cesario, Cardinali, Castaldo, Paoletti and Mazon2004, Reference Cesario, Amicucci, Cardinali, Castaldo, Marinucci, Panaccione, Santini, Tudisco, Apicella and Calabrò2010). In the experiments, the local gas puffing from GIM_e is utilized. The capability of the current drive is estimated by the count of hard X-ray rate (60–200 keV) normalized by the injected LHW power, which is proportional to the current driven efficiency. Seen from the results shown in figure 6(a), in strongly lithiated discharge, there is no sudden decrease in driven current, where the hard X-ray radiation (HXR) counts deviate from the curve of $1/n_{e}$
, until a density of up to
$1/n_{e}$
, until a density of up to $3.0\times 10^{19}~\text{m}^{-3}$
, which is much larger than the value of
$3.0\times 10^{19}~\text{m}^{-3}$
, which is much larger than the value of $2.0\times 10^{19}~\text{m}^{-3}$
in the case of poor lithiation. This suggests that the strong wall lithiation promotes the occurrence of the LHCD effect at high density, in agreement with previous results (Cesario et al.
Reference Cesario, Amicucci, Cardinali, Castaldo, Marinucci, Panaccione, Santini, Tudisco, Apicella and Calabrò2010).
$2.0\times 10^{19}~\text{m}^{-3}$
in the case of poor lithiation. This suggests that the strong wall lithiation promotes the occurrence of the LHCD effect at high density, in agreement with previous results (Cesario et al.
Reference Cesario, Amicucci, Cardinali, Castaldo, Marinucci, Panaccione, Santini, Tudisco, Apicella and Calabrò2010).
(a) Relationship between HXR counts and density with strong and poor lithiation, (b) frequency of IC sidebands with strong and poor lithiation.

The trends of LHCD with plasma density and PI signatures, documented by the frequency power spectrum of the signal collected by a RF probe located outside the machine, have been analysed. The spectrum consists a broadening at approximately the LH wave operating frequency, and a sideband shift of an amount in the range of the ion cyclotron frequency (IC sideband). The relationship between IC sideband and plasma density is shown in figure 6(b). It shows that, compared to the strong lithiation case, the IC sideband frequency in the case of poor lithiation decreases faster with density to a low value of ${\sim}$
14.5 MHz, which corresponds to the local IC frequency in the edge region where PI occurs. The trend of decreasing IC sideband frequency with density is consistent with the sharp decay of HXR counts that indicates the current drive capability, supporting the conclusion that the PI mechanism plays a key role in affecting LHCD. The measured RF spectrum indicating PI behaviour is nearly in agreement the PI modelling based on the PI code (Takase & Porkolab Reference Takase and Porkolab1983; Cesario et al.
Reference Cesario, Amicucci, Castaldo, Kempenaars, Jachmich, Mailloux, Tudisco, Galli and Krivska2011; Baek et al.
Reference Baek, Parker, Shiraiwa, Wallace, Bonoli, Porkolab, Takase, Brunner, Faust and Hubbard2014), demonstrating the influence of PI on LHCD efficiency in EAST (Ding et al.
Reference Ding, Li, Zhang, Li, Wei, Kong, Wang, Xu, Wang and Xu2015). Studies indicate that low recycling is preferred for high density LHCD operation and, more generally, for improving confinement and stability (Cesario et al.
Reference Cesario, Cardinali, Castaldo, Paoletti and Mazon2004, Reference Cesario, Amicucci, Cardinali, Castaldo, Marinucci, Panaccione, Santini, Tudisco, Apicella and Calabrò2010, Reference Cesario, Amicucci, Fonseca, Chapman, Jenko, Marinucci, Saarelma, Smeulders, Told and Zagorski2013, Reference Cesario, Amicucci, Cardinali, Castaldo, Marinucci, Napoli, Paoletti, De Arcangelis, Ferrari and Galli2014).
${\sim}$
14.5 MHz, which corresponds to the local IC frequency in the edge region where PI occurs. The trend of decreasing IC sideband frequency with density is consistent with the sharp decay of HXR counts that indicates the current drive capability, supporting the conclusion that the PI mechanism plays a key role in affecting LHCD. The measured RF spectrum indicating PI behaviour is nearly in agreement the PI modelling based on the PI code (Takase & Porkolab Reference Takase and Porkolab1983; Cesario et al.
Reference Cesario, Amicucci, Castaldo, Kempenaars, Jachmich, Mailloux, Tudisco, Galli and Krivska2011; Baek et al.
Reference Baek, Parker, Shiraiwa, Wallace, Bonoli, Porkolab, Takase, Brunner, Faust and Hubbard2014), demonstrating the influence of PI on LHCD efficiency in EAST (Ding et al.
Reference Ding, Li, Zhang, Li, Wei, Kong, Wang, Xu, Wang and Xu2015). Studies indicate that low recycling is preferred for high density LHCD operation and, more generally, for improving confinement and stability (Cesario et al.
Reference Cesario, Cardinali, Castaldo, Paoletti and Mazon2004, Reference Cesario, Amicucci, Cardinali, Castaldo, Marinucci, Panaccione, Santini, Tudisco, Apicella and Calabrò2010, Reference Cesario, Amicucci, Fonseca, Chapman, Jenko, Marinucci, Saarelma, Smeulders, Told and Zagorski2013, Reference Cesario, Amicucci, Cardinali, Castaldo, Marinucci, Napoli, Paoletti, De Arcangelis, Ferrari and Galli2014).
4 Effect of LH frequency on CD characteristic
LHW frequency is one of important parameters affecting wave propagation. In order to study the effect of frequency on LHCD characteristics, two different frequency waves (2.45 GHz and 4.6 GHz) with the same power ( $P_{LH}=1.05~\text{MW}$
) were injected in one discharge with almost constant density (
$P_{LH}=1.05~\text{MW}$
) were injected in one discharge with almost constant density ( $n_{e}=2.0\times 10^{19}~\text{m}^{-3}$
) and the typical waveforms are shown in figure 7. It is seen that the residual voltages (
$n_{e}=2.0\times 10^{19}~\text{m}^{-3}$
) and the typical waveforms are shown in figure 7. It is seen that the residual voltages ( $V_{loop}$
) are 0.27 V and 0.15 V respectively for a current drive with 2.45 GHz and 4.6 GHz, indicating better CD efficiency for 4.6 GHz wave. Better plasma heating effect for 4.6 GHz wave can be obtained from the time evolution of plasma stored energy (
$V_{loop}$
) are 0.27 V and 0.15 V respectively for a current drive with 2.45 GHz and 4.6 GHz, indicating better CD efficiency for 4.6 GHz wave. Better plasma heating effect for 4.6 GHz wave can be obtained from the time evolution of plasma stored energy ( $W_{MHD}\sim$
68.3 kJ and 74.8 kJ, respectively for 2.45 GHz and 4.6 GHz). Also, the internal inductance is higher with the 4.6 GHz LH wave injection, indicating the occurrence of more effective LHCD in the plasma core with respect to the 2.45 GHz wave (Hooke Reference Hooke1984; Takase et al.
Reference Takase, Porkolab, Schuss, Watterson, Fiore, Slusher and Surko1985). Since the power spectrum is an important parameter affecting wave propagation and power deposition, using a ray-tracing/Fokker–Planck code (C3PO/LUKE) (Peysson & Decker Reference Peysson and Decker2008; Peysson, Decker & Morini Reference Peysson, Decker and Morini2012) with the experimental spectra (
$W_{MHD}\sim$
68.3 kJ and 74.8 kJ, respectively for 2.45 GHz and 4.6 GHz). Also, the internal inductance is higher with the 4.6 GHz LH wave injection, indicating the occurrence of more effective LHCD in the plasma core with respect to the 2.45 GHz wave (Hooke Reference Hooke1984; Takase et al.
Reference Takase, Porkolab, Schuss, Watterson, Fiore, Slusher and Surko1985). Since the power spectrum is an important parameter affecting wave propagation and power deposition, using a ray-tracing/Fokker–Planck code (C3PO/LUKE) (Peysson & Decker Reference Peysson and Decker2008; Peysson, Decker & Morini Reference Peysson, Decker and Morini2012) with the experimental spectra ( $N_{/\!/}^{peak}=2.1$
and 2.04 for 2.45 GHz and 4.6 GHz, respectively), power deposition and driven current profile are calculated without considering the spectrum broadening (see figure 8). It is seen that though the total driven current is somewhat small with the 2.45 GHz LHW, it cannot account for the experimental discrepancy (
$N_{/\!/}^{peak}=2.1$
and 2.04 for 2.45 GHz and 4.6 GHz, respectively), power deposition and driven current profile are calculated without considering the spectrum broadening (see figure 8). It is seen that though the total driven current is somewhat small with the 2.45 GHz LHW, it cannot account for the experimental discrepancy ( ${\sim}$
100 kA) estimated by the loop voltage. Therefore, the discrepancy in the initial spectrum could not dominate the difference in the current drive. In addition, a comparison of frequency spectra between the two waves is illustrated in figure 9, from which it is seen that larger spectral broadening occurs for the 2.45 GHz case, indicating a stronger PI behaviour. This could partly explain the better CD effect with the 4.6 GHz LH wave in terms of reduced parasitic PI effect, as previously reported (Cesario et al.
Reference Cesario, Cardinali, Castaldo, Paoletti and Mazon2004, Reference Cesario, Amicucci, Cardinali, Castaldo, Marinucci, Panaccione, Santini, Tudisco, Apicella and Calabrò2010).
${\sim}$
100 kA) estimated by the loop voltage. Therefore, the discrepancy in the initial spectrum could not dominate the difference in the current drive. In addition, a comparison of frequency spectra between the two waves is illustrated in figure 9, from which it is seen that larger spectral broadening occurs for the 2.45 GHz case, indicating a stronger PI behaviour. This could partly explain the better CD effect with the 4.6 GHz LH wave in terms of reduced parasitic PI effect, as previously reported (Cesario et al.
Reference Cesario, Cardinali, Castaldo, Paoletti and Mazon2004, Reference Cesario, Amicucci, Cardinali, Castaldo, Marinucci, Panaccione, Santini, Tudisco, Apicella and Calabrò2010).
Effect of LH frequency on LHCD characteristics. (a) Plasma current ( $I_{p}$
), (b) central-line-averaged density (
$I_{p}$
), (b) central-line-averaged density ( $n_{e}$
) and loop voltage (
$n_{e}$
) and loop voltage ( $V_{loop}$
), (c) LH power, (d) stored energy (
$V_{loop}$
), (c) LH power, (d) stored energy ( $W_{mhd}$
) calculated with magnetic measurement and internal inductance (li).
$W_{mhd}$
) calculated with magnetic measurement and internal inductance (li).

Power simulation and drive current profile with C3PO/LUKE code.

Spectrum broadening measured by a RF loop antenna.

The above results indicate that the 4.6 GHz frequency is more efficient for producing a stronger LHCD on EAST. Based on the studies of coupling and LHCD characteristics, a repeatable H-mode was obtained by LHCD in EAST. With the 2.45 GHz and 4.6 GHz LHCD systems, a high density H-mode is obtained and the typical waveforms are shown in figure 10. The electron cyclotron emission (ECE) signal drops quickly at the L–H transition, implying a decrease of LH driven current, possibly due to the concomitant density increase. Seen from the loop voltage and ECE signal, it is inferred that part of current is driven by LHW even if at the density of $4.5\times 10^{19}~\text{m}^{-3}$
. Such a density is higher than that of
$4.5\times 10^{19}~\text{m}^{-3}$
. Such a density is higher than that of $1.5{-}2.5\times 10^{19}~\text{m}^{-3}$
obtained in the 2.45 GHz case (Ding et al.
Reference Ding, Kong, Li, Zhang, Wei, Wang, Xu, Li, Ling and Zang2013a
,Reference Ding, Kong, Zhang, Ekedahl, Li, Zhang, Wei, Li, Wu and Xu
b
).
$1.5{-}2.5\times 10^{19}~\text{m}^{-3}$
obtained in the 2.45 GHz case (Ding et al.
Reference Ding, Kong, Li, Zhang, Wei, Wang, Xu, Li, Ling and Zang2013a
,Reference Ding, Kong, Zhang, Ekedahl, Li, Zhang, Wei, Li, Wu and Xu
b
).
Typical LHCD H-mode plasma at high density. (a) Plasma current ( $I_{p}$
), (b) central-line-averaged density (
$I_{p}$
), (b) central-line-averaged density ( $n_{e}$
), (c) loop voltage (
$n_{e}$
), (c) loop voltage ( $V_{loop}$
), (d) stored energy (
$V_{loop}$
), (d) stored energy ( $W_{mhd}$
) calculated with magnetic measurement, (e) LH power (f) ECE supra-electron emission measured by ECE in edge region, (g) neutral hydrogen radiation (Da), (h) normalized beta (
$W_{mhd}$
) calculated with magnetic measurement, (e) LH power (f) ECE supra-electron emission measured by ECE in edge region, (g) neutral hydrogen radiation (Da), (h) normalized beta ( $\unicode[STIX]{x1D6FD}_{N}$
).
$\unicode[STIX]{x1D6FD}_{N}$
).

Concerning the application of the LH wave to a reactor, whether in the higher frequency range or the lower, in which many alpha particles could be in the plasma centre, there is a concern that energetic alpha particles in the plasma centre could damp the lower hybrid wave. This was first pointed out by Wong & Ono (Reference Wong and Ono1984), supported by calculations by Fisch & Rax (Reference Fisch and Rax1992a ), and led to suggestions (Barbato & Santini Reference Barbato and Santini1991; Pavlo, Krlin & Tluchor Reference Pavlo, Krlin and Tluchor1991) that, to propagate LH waves close to the plasma centre while avoiding absorption of the LH wave by alpha particles, it would be necessary to use LH waves in a rather high frequency range, even higher than the 4.6 GHz used here, in EAST tokamak. The waveguides for launching such high frequency waves are technologically more challenging than those used at lower frequency.
However, the calculations of the energetic alpha particle damping (Wong & Ono Reference Wong and Ono1984; Barbato & Santini Reference Barbato and Santini1991; Pavlo et al. Reference Pavlo, Krlin and Tluchor1991; Fisch & Rax Reference Fisch and Rax1992a ) do not take into account that the wave–particle interaction occurs in a radial gradient of the alpha particles. Because the alpha particles in the centre are energetic, but cool at the periphery, the alpha particles can amplify the LH waves through the alpha channelling effect (Fisch & Rax Reference Fisch and Rax1992b ). Hence, it might not be necessary to resort to very high frequencies to allow the LH waves to reach near the plasma centre in a reactor, for two reasons: first, from the consideration of interaction with alpha particles, instead of the wave damping on the alpha particles, the wave might grow due to the interaction with alpha particles. That would also enable the wave to counteract the electron Landau damping that tends to extinguish the LH wave near the very hot tokamak centre, allowing further penetration than in the absence of the channelling effect. Second, the alpha channelling effect allows the tokamak to operate in the hot ion mode, where the electrons can be made much colder than the ions (Fisch & Herrmann Reference Fisch and Herrmann1994). Among the advantages of operating at lower electron temperature is that the Landau damping of the LHW by electrons is lessened, allowing further penetration to the tokamak centre. If the wave damping concerns were alleviated for these two reasons, then the main concerns on the frequency would be only the linear wave accessibility and the avoidance of the PI.
Although the alpha channelling effect has generally been pursued using waves in the ion cyclotron range of frequencies (Fisch Reference Fisch1995; Herrmann & Fisch Reference Herrmann and Fisch1997), recently it was shown that there are ways of launching the LH wave that can exploit the alpha channelling effect (Ochs, Bertelli & Fisch Reference Ochs, Bertelli and Fisch2015a ,Reference Ochs, Bertelli and Fisch b ). The preferred launching techniques avoid launching the LH wave from the low field side of the tokamak. One might then also imagine using the LHW to accomplish synergistic alpha channelling effects when more than one wave is used (Fisch & Herrmann Reference Fisch and Herrmann1995). The alpha channelling effect can also be accomplished synergistically with the cyclic operation of LHCD, or transformer recharging, considered in the next section (Fisch Reference Fisch2010).
5 Cyclic operation of lower hybrid current drive
Due to the density limitation of LHCD, at which the CD efficiency decreases sharply, LHCD cyclic operation (Fisch Reference Fisch1987) could be one alternative candidate for more economical fusion reactors. The schematic of the cyclic operation regime is shown in figure 11, in which there are two stages: the current generation stage, namely the current ramp-up by LH, and the current relaxation stage.
Schematic of LHCD cyclic operation. ( $I_{0}$
is the plasma current before LH application and
$I_{0}$
is the plasma current before LH application and $I_{max}$
is the maximum plasma current before switching off LH power.
$I_{max}$
is the maximum plasma current before switching off LH power. $T_{g}$
and
$T_{g}$
and $T_{r}$
are time durations, and
$T_{r}$
are time durations, and $Z_{g}$
and
$Z_{g}$
and $Z_{r}$
are the effective ion charge states for the two stages, respectively.).
$Z_{r}$
are the effective ion charge states for the two stages, respectively.).

The first stage is characterized by plasma with relatively low density and high effective ion charge state $Z_{eff}$
, so that the plasma current can be driven effectively by LH, and simultaneously the current can be ramped up quickly, due to (with larger
$Z_{eff}$
, so that the plasma current can be driven effectively by LH, and simultaneously the current can be ramped up quickly, due to (with larger $Z_{eff}$
or smaller electron temperature) the relatively short time constant
$Z_{eff}$
or smaller electron temperature) the relatively short time constant $L/R$
, where
$L/R$
, where $L$
and
$L$
and $R$
are the plasma inductance and the resistivity, respectively. With the current ramped up, the LH power would be converted into poloidal field energy stored in plasma column and then released in the current relaxation stage. During the current relaxation stage, the plasma would be optimized by higher density for greater fusion power and lower effective ion charge state for longer relaxation time. Therefore, there are at least 3 key points for the LHCD cyclic operation, (i) fast over-drive at low density and slow decay at high density, (ii) zero ohmic field completely and (iii) density and impurity control.
$R$
are the plasma inductance and the resistivity, respectively. With the current ramped up, the LH power would be converted into poloidal field energy stored in plasma column and then released in the current relaxation stage. During the current relaxation stage, the plasma would be optimized by higher density for greater fusion power and lower effective ion charge state for longer relaxation time. Therefore, there are at least 3 key points for the LHCD cyclic operation, (i) fast over-drive at low density and slow decay at high density, (ii) zero ohmic field completely and (iii) density and impurity control.
In EAST, the experiments (Ding et al.
Reference Ding, Li, Fisch, Qin, Li, Wilson, Kong, Zhang, Wei and Li2012) for the first stage have been carried out and the preliminary results are shown in figure 12, for the first time demonstrating current ramp-up without ohmic heating and transformer recharging in EAST. The plasma current was ramped up with a time-averaged rate of 18 kA/s with LH power. The average conversion efficiency $P_{el}/P_{LH}$
was approximately 3 %, where
$P_{el}/P_{LH}$
was approximately 3 %, where $P_{el}$
is the increase in poloidal field energy due to the LH contribution and
$P_{el}$
is the increase in poloidal field energy due to the LH contribution and $P_{LH}$
is the LH power.
$P_{LH}$
is the LH power.
Typical time traces of current ramp-up by LH (see Ding et al.
Reference Ding, Li, Fisch, Qin, Li, Wilson, Kong, Zhang, Wei and Li2012). (a) Plasma current ( $I_{\text{p}}$
), (b) injected LH power (
$I_{\text{p}}$
), (b) injected LH power ( $P_{LH}$
) and the rate of change of poloidal field energy, (c) loop voltage in edge (
$P_{LH}$
) and the rate of change of poloidal field energy, (c) loop voltage in edge ( $V_{edge}$
) and centre (
$V_{edge}$
) and centre ( $V_{centre}$
), (d) line-averaged density (
$V_{centre}$
), (d) line-averaged density ( $n_{e}$
), (e) poloidal beta (
$n_{e}$
), (e) poloidal beta ( $\unicode[STIX]{x1D6FD}_{p}$
) and half of the internal inductance (
$\unicode[STIX]{x1D6FD}_{p}$
) and half of the internal inductance ( $l_{i}/2$
) and (f) hard X-ray radiation (HXR).
$l_{i}/2$
) and (f) hard X-ray radiation (HXR).

6 Conclusion and discussion
Aiming at a fusion reactor, efforts have been made to improve LHW–plasma coupling and current drive capability at high density in EAST as follows. (i) LHW–plasma coupling is improved by means of local gas puffing and gas puffing from the electron side is taken as a routine procedure for EAST operation with LHCD. (ii) High density experiments suggest that, due to the PI effect and collisional absorption in the edge region, high edge temperature and low edge density are preferred for the LHCD experiments at high density. (iii) High LH frequency is useful to improve RF power propagation into the core region and enhance CD efficiency at high density. A repeatable H-mode plasma is obtained by LHCD. Currently, the H-mode with maximum density (of $4.5\times 10^{19}~\text{m}^{-3}$
) is obtained with the combination of the two LHCD systems (2.45 GHz and 4.6 GHz). (iv) The first stage of LHCD cyclic operation has been demonstrated in EAST.
$4.5\times 10^{19}~\text{m}^{-3}$
) is obtained with the combination of the two LHCD systems (2.45 GHz and 4.6 GHz). (iv) The first stage of LHCD cyclic operation has been demonstrated in EAST.
As mentioned above, although some progress has been made in LHW–plasma coupling and LHCD capability at high density, further work should be continued. (i) Although the density can be improved by local gas puffing, feedback control of the grill density by gas puffing is a challenge, especially for long pulse LHCD operation. (ii) The mechanisms affecting CD efficiency show that edge parameters play an important role. However, it is not easy to effectively control the parameters since coupling and current drive both depend on edge parameters. (iii) Although preliminary results show that high LH frequency is useful to improve LHCD capability at high density, the mechanism is not so clear and further studies need to be continued. (iv) Although the first stage has been demonstrated in EAST, some challenges still exist for the operation. For example, (a) it is very difficult to turn off the ohmic field completely, since it and the equilibrium field are coupled to each other, and (b) the ramp-up rate is relatively slow because the $L/R$
times are relatively large due to the large size of EAST. To fix the second issue, one possible way is to increase the drive current (
$L/R$
times are relatively large due to the large size of EAST. To fix the second issue, one possible way is to increase the drive current ( $I_{LH}$
), or reduce
$I_{LH}$
), or reduce $L/R$
by increasing the impurity. (v) In addition, high temperatures in the edge region should be very important for LHCD operation at high density. As done in the experiments, lowering recycling by means of lithiation could be one effective way. Another could be the direct heating of electrons near the edge region, as concluded in Cesario et al. (Reference Cesario, Amicucci, Cardinali, Castaldo, Marinucci, Panaccione, Santini, Tudisco, Apicella and Calabrò2010). Since electron cyclotron resonance heating is available in EAST, it could be an effective tool to enhance current drive capability at high density.
$L/R$
by increasing the impurity. (v) In addition, high temperatures in the edge region should be very important for LHCD operation at high density. As done in the experiments, lowering recycling by means of lithiation could be one effective way. Another could be the direct heating of electrons near the edge region, as concluded in Cesario et al. (Reference Cesario, Amicucci, Cardinali, Castaldo, Marinucci, Panaccione, Santini, Tudisco, Apicella and Calabrò2010). Since electron cyclotron resonance heating is available in EAST, it could be an effective tool to enhance current drive capability at high density.
Acknowledgements
This work is supported by the National Magnetic Confinement Fusion Science Program of China (grant nos 2015GB102003, 2013GB106001B, 2013GB112003), the National Natural Science Foundation of China under grant nos 11175206, 11305211, 11275233 and 11675214, Hefei Science Center CAS (2015HSC-UE005, 2016HSC-IU008) and the JSPS-NRF-NSFC A3 Foresight Program in the field of Plasma Physics (NSFC no. 11261140328). It is partly supported by the China-France, the China-Italy and the China–US Collaboration program.


