


Background
The interface between mental health services and the Criminal Justice System (CJS) is the area that forensic mental health services occupy. In the UK, forensic psychiatry was recognised as a speciality in 1973.Reference Turner and Salter1 Traditionally, individuals who committed offences while mentally ill were treated in one of four high secure special hospitals. The Butler Report in 19752 was credited with transforming forensic psychiatry by recommending that medium secure units be established in each region of the country. These were needed to address the gap between high secure hospitals and other mental health services that had developed following a period of deinstitutionalisation and mass bed closures.Reference Gunn3 Prior to this the creation of medium secure units had been resisted during a period when psychiatric hospitals became more open institutions in the 1960s with a focus on voluntary treatment, deinstitutionalisation and bed closures, partly driven by a negative view of asylums.
Forensic mental health services also work in prisons. The number of people in prison has risen steeply in England and Wales since the 1990s.Reference Sturge4 In 1991, following a series of prison disturbances across the UK, the Woolf Report5 identified serious issues within prisons, such as overcrowding and understaffing. As well as improvements to the prison environment, it recommended a greater focus on those with severe mental illness. The following year in 1992 the Reed Report,Reference Reed6 recommended that those with severe mental illnesses should be referred to health and social services as opposed to prison. More recently the Bradley ReportReference Bradley7 identified the need for appropriate referrals and diversion to specialist teams for those in contact with the CJS with mental health problems and intellectual disabilities (also known as learning disabilities in UK health services), with services such as forensic in-reach and more recently the implementation of mental healthcare wings.
The current Mental Health Act 1983 in England and Wales8 allows for two broad types of detention in hospital: civil detentions under Part II; and forensic detention under Part III. An individual can be detained under a civil section when in the community or in hospital. Only those appearing in court or in prison can be detained under a forensic section.
Aims
We recently investigated changes to detentions under the Mental Health Act 1983 and found that although civil detentions had risen substantially the overall rate of forensic detentions had not changed substantially.Reference Keown, Murphy, McKenna and McKinnon9 In this study, we aim to describe changes to forensic detentions in more detail. A strong association between the closure of mental illness beds and the rise in civil detentions has previously been reported in England.Reference Keown, Weich, Bhui and Scott10 We will test whether there has been an association between the reduction in bed numbers and the rate of forensic detentions, as well as with the size of the prison population. One reason for a civil detention can be ‘for the protection of others’, so we will explore any association between the rate of civil detentions and the rate of forensic detentions.
Method
Data regarding civil (Part II) and forensic (Part III) detentions in National Health Service (NHS) and private facilities from 1984 until 2015/16 were collated from the publicly available annual publication Inpatients Formally Detained in Hospital under the Mental Health Act 1983, obtained via the National Archives11 and NHS Digital.12 Civil detentions in hospital permitting detentions for up to 28 days or longer were included (i.e. sections 2 and 3). All such detentions were included irrespective of their duration. These were split into two groups: (a) civil involuntary admissions where a patient was detained in hospital from outset, and (b) civil involuntary detentions where an individual was detained after an initial period of voluntary/informal in-patient treatment (henceforth referred to as ‘subsequent detentions’). Civil involuntary admissions also included admissions where section 2 or 3 immediately followed on from short-term detentions under section 4 (up to 72 h), section 136 (police holding power) or following the revocation of a community treatment order (CTO).
The outcomes of section 4 and section 136 detentions were not available for the first 4 years of the study (1984 to 1987). Estimates were calculated for those first 4 years by assuming that 50% of section 4 detentions and 30% of section 136 detentions resulted in ongoing detention under section 2 or 3. This was based on the data for the subsequent 7 years (1988 to 1995). Likewise, data on subsequent detentions under civil sections were not available for the first 4 years. These were estimated using data from the subsequent 7 years and calculating a linear trend using a polynomial function. The raw numbers of each type of detention, and the estimated numbers for the years 1984 to 1987, are shown in supplementary Table 1 available at https://doi.org/10.1192/bjo.2019.73.
Forensic (Part III) detentions included court orders and prison transfers for assessment and treatment. Detentions for the purpose of assessment only (section 35) were separated from all other forensic detentions, and are referred to as ‘court assessment orders’. Forensic detentions for assessment and treatment (sections 36, 37, 38, 44, 45A, 46, 47 and 48) were all included and split into two categories: court treatment orders; and prison transfers. Prison transfers authorise the transfer of prisoners either on remand or serving a sentence, from prison to hospital for further assessment and treatment (sections 47 and 48). Court orders are a sentencing option where a court decides that individuals with mental disorders should be admitted to hospital rather than prison (primarily section 37 although interim (section 38) and hybrid orders (section 45A) also exist). For the purpose of calculating rates of prison transfers and court treatment orders, detentions with and without restrictions were combined. See the Appendix for data that were available from various years.
NHS psychiatric bed numbers were collated for England. Between 1980 and 2017 mental illness and intellectual disability bed numbers were available for each year in England from the UK Department of Health. The number of psychiatric beds was calculated by combining mental illness and intellectual disability bed numbers for each year in England. Prison numbers for England and Wales were available between 1970 onwards.Reference Sturge4 This data is available separately for each country from 2002. The prison population for each year in England prior to 2002 was estimated by multiplying the figure for England and Wales by 0.97, reflecting the proportion from each country between 2002 and 2007, as 3% of the prison population was in Wales.
Rates of detention per 100 000 population, rates of psychiatric bed provision per 100 000 and rates of prison population per 100 000 were calculated using the total population in England. Rates at the start of the study period in 1984 were compared with rates at the end of the study period in 2015/16 to calculate percentage changes.
Statistical analysis
Pearson's correlations were calculated to explore associations between prison transfers and court treatment orders with three variables: (a) rates of civil detention; (b) psychiatric bed provision; and (c) the prison population rate. Correlations were categorised as follows: very strong >0.9; strong >0.7; moderate >0.4. The correlations were initially performed on the raw annual data. Next a smoothing transformation was performed on the annual numbers using the T4253H function in SPSS Version 24.13 Smoothing was carried out to reveal patterns while eliminating noise. One degree of differencing was then introduced to calculate the difference between each data point in the smoothed time series (one data point for each year). This revealed the annual change in rates from the smoothed data. The annual changes in rates were then correlated. Those correlations that remained moderately strong after this transformation were then subject to time-lagged cross correlation to investigate which time lag had the strongest correlation. The time lag with the strongest correlation was used as the independent variable in a single linear regression with either the rate of prison transfers or the rate of court treatment orders as the dependent variable.
Results
The rates of most types of detention increased during the study period. The largest increase (+710%) was in prison transfers – from 0.2 to 1.6 per 100 000, and next largest was civil detentions, particularly civil involuntary admissions (from 24.2 to 81.9 per 100 000, +241%) and to a lesser extent subsequent detentions (from 14.6 to 30.7, +111%). In contrast, court treatment orders fell by 39% from 2.3 to 1.4 per 100 000. Section 37 detentions (with and without restrictions) formed the majority of the court treatment orders and these fell from 2.3 to 1.2 per 100 000 (−49%). Over the same period the provision of psychiatric in-patient beds fells by 86% from 260.1 to 37.6 per 100 000 and the prison population increased by 70% from 89.3 to 151.1 per 100 000 (Table 1).
Rates of civil and forensic detention, psychiatric bed provision and prison population per 100 000 population in England in 1984 and 2015/6 with percentage changes

NHS, National Health Service.
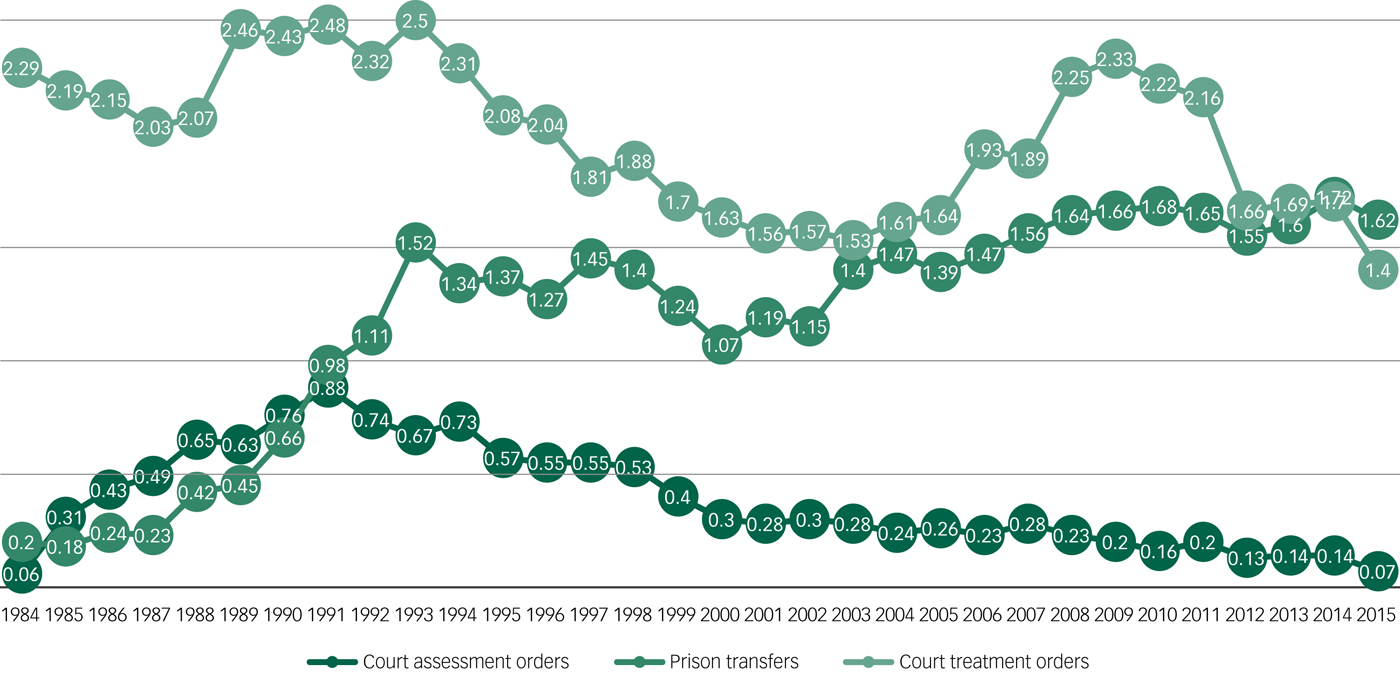
The changes to the rate of forensic sections are shown in more detail in Fig. 1. Court assessment orders showed a sharp initial rise peaking in 1991 before falling again to their original levels. Prison transfers also increased in the earlier years, with a peak in 1993, and then started rising again with the highest rate in 2014. The rate of court treatment orders fluctuated with peaks in 1993 and 2008, before falling to the lowest rate in 2015.
Annual rate, per 100 000 population, of court treatment orders, prison transfers and court assessment orders.
Data refers to forensic detentions under the Mental Health Act in England between 1984 and 2015/16.
Association of court treatment orders and prison transfers with the rate of civil detention, psychiatric beds and prison population
There was a very strong negative correlation between the rate of prison transfers and psychiatric bed provision (r = −0.95), and a very strong positive correlation between the rate of prison transfers and the rate of civil detentions (r = +0.90). There was a strong positive correlation between the rate of prison transfer and the size of the prison population (r = +0.75). There was a moderately strong positive correlation between the rate of court orders and psychiatric bed numbers (r = +0.51). There was a moderately strong negative correlation between the rate of court orders and the rate of civil detention (r = −0.63) and with the size of the prison population (r = −0.57) (Table 2). When the estimated data from the first 4 years of the study (1984–1987) were excluded, these correlations remained strong or moderate.
The correlation of the rate of court treatment orders and prison transfers with three variables: National Health Service (NHS) psychiatric bed provision, the prison population and the rate of civil detentionsa

a. Results are shown for England 1984–2016 and for 1988–2016 separately. Correlations >0.4 are shown in bold.
b. Raw yearly numbers of each variable.
c. Annual changes in the smoothed yearly numbers of each variable.
After smoothing the rates and then introducing one degree of difference to calculate the annual changes, two of these correlations remained moderately strong: the negative correlation between the rate of prison transfers and the number of psychiatric beds (r = −0.61); and the negative correlation between court treatment orders and civil detentions (r = −0.43). The remaining correlations were weak and non-significant (Table 2).
A time-lagged cross correlation demonstrated that the yearly change in the rate of prison transfers correlated most strongly with the annual change in the rate of NHS psychiatric in-patient beds 2 years earlier (r = −0.65, n = 31, P < 0.001, Table 3). The correlation between the annual change in the smoothed rate of court treatment orders was strongest with the annual change in the smoothed rate of civil detentions 3 years earlier (r = −0.57, n = 28, P = 0.002, Table 4).
Time-lagged cross correlation between the annual change in the rate of prison transfers and the annual change in in psychiatric bed numbers per 100 000a

a. Data are for England: prison transfer data from 1984 to 2016; psychiatric bed provision from 1980 to 2017.
Time-lagged cross correlation between the annual change in the rate of court treatment orders and the annual change in the rate of civil detentions per 100 000

Data are for England 1984–2016.
Model for the number of prison transfers
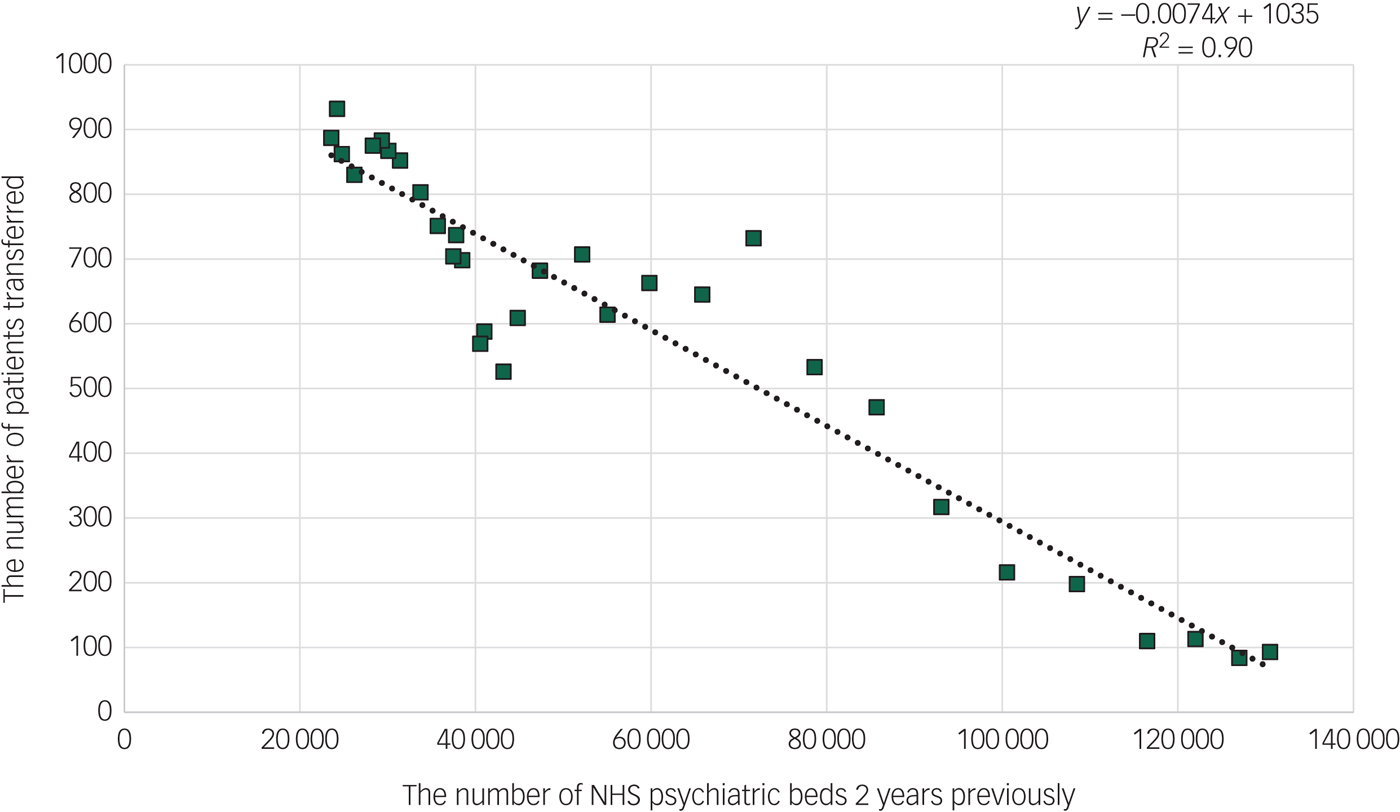
The association between the number of NHS psychiatric beds and the number of transfers of individuals from prison to psychiatric hospital 2 years later was best described by a linear model that is shown in Fig. 2. This indicates a baseline number of over 1000 transfers from prison to psychiatric hospital each year and that for every 135 NHS psychiatric beds there would be one less transfer. This model explained 90% of the variation in the number of prison transfers each year. Visual inspection of Fig. 2 also suggests that this association was particularly evident when the number of NHS psychiatric beds fell below 115 000.
The number of National Health Service (NHS) psychiatric beds each year (x-axis) and the number of transfers under the Mental Health Act from prison to psychiatric hospitals 2 years later (y-axis).
Data are for England 1984–2016.
Model for the rate of court treatment orders
The association between the rate of civil detentions and the rate of court treatment orders 3 years later can also be described by a liner model that is shown in Fig. 3. This indicates a yearly rate of 2.9 court treatment orders per 100 000 population, and that for every 72 civil detentions per 100 000 population the rate of court treatment orders decreased by one. This model explained 47% of the variation in the rate of court treatment orders per year.
The rate of civil detentions per 100 000 each year (x-axis) and the corresponding rate of court treatment orders 3 years later (y-axis).
Data are for England 1984–2016.

Discussion
Main findings and interpretation
Most types of detention increased in England over the 32 years covered by this study. The largest increase was in transfers from prison followed by civil involuntary admissions. However, a very important type of detention declined in both rate and numbers, namely court treatment orders.
We found two important associations. The strongest association was between NHS psychiatric bed provision and transfers from prison to hospital of individuals for psychiatric treatment: for every 135 fewer psychiatric beds there was one more transfer to hospital from prison for psychiatric treatment. The association between prison transfers and psychiatric beds was strongest at a time lag of 2 years with the reduction of psychiatric beds coming first. One interpretation is that the reduction of psychiatric beds has resulted in more patients being in the community, some of whom end up in prison, and during their time in prison they experience a relapse requiring transfer to hospital for treatment. An alternative explanation would be that if an individual with a mental disorder offends but there is no available bed, a psychiatrist may not make the recommendation for hospital treatment to the court. The individual may then be imprisoned and subsequently may need transfer to hospital.
We found a weaker association between rates of civil detentions and subsequent rates of court treatment orders: for every 72 civil detentions, there was one less person being sentenced to treatment in hospital by the courts 3 years later. The criteria for a civil detention includes if there are concerns regarding risks to others from an individual who has a mental disorder. One interpretation of our results is that civil detentions are successful in reducing the number of offences committed by individuals with mental disorders, and the rise in the rate of civil detentions is part of the explanation for why the rate of court orders has fallen.
The figure of 72 civil detentions to prevent one court order has many complexities. Most commonly, individuals are detained in the interests of their health and/or safety. A proportion are detained for the protection of others. If a third of civil detentions were for the protection of others then instead of 72, the figure may be 24 civil detentions to prevent one court treatment order. This is still a relatively high number. If a tenth of civil detentions were for the protection of others then the figure would be seven. Previous research has identified that the number needed to detain to prevent one offence using structured risk assessments was two, which is much lower.Reference Fazel, Singh, Doll and Grann14 Furthermore, those at risk of harm to others can also have risks to their own health and safety.
Limitations
There are limitations to this data. It is routinely collected data. It refers to the number of detentions rather than the number of patients detained in a year. However, it is clear that the number of patients detained also increased during this time.11 Another limitation is that some patients on civil sections are transferred to secure units, and some patients on forensic sections are transferred to non-secure units. Although the data on detentions refers to both NHS and private hospitals, the data on psychiatric bed numbers only refers to the NHS. The lack of data on private sector psychiatric beds is a limitation as for some types of psychiatric wards the private sector provides a significant proportion of NHS-funded care; indeed, in 2018 it was calculated that there were 2347 psychiatric rehabilitation beds in the independent sector compared with 2050 in NHS hospitals.15 However, the vast majority (approximately 90%) of detentions were to NHS hospitals.Reference Keown, Murphy, McKenna and McKinnon9 Were the private sector data to become available, this will be made available for re-analysis to ensure general commitment to openness with data.
Changes in community-based treatment
Figure 1 shows that the fall in court treatment orders did not occur uniformly through the 32 years. Rates peaked in 1993, which followed 2 years after the introduction of the Care Programme Approach (1991) aiming to provide more structured and coordinated support for those with severe mental illness in the community.16 In 1994 the Ritchie reportReference Ritchie, Dick and Lingham17 heavily criticised the clinicians involved in the care of a patient who went on to commit a homicide following discharge from hospital. In the same year, the rate of court treatment orders started to fall and continued to fall for the following 8 years.
Further attempts to improve community care were outlined in the NHS Plan in 2000,18 which introduced crisis resolution teams, many of which were available 24 h a day, early intervention in psychosis teams and assertive outreach teams. Although these additional community-based services were rolled out across England, the rate of involuntary civil detentions continued to rise. More concerning is that the rate of court orders plateaued and then started to rise again in the years following the introduction of the NHS Plan, as is shown in Fig. 1.
As part of the 2007 amendments to the 1983 Mental Health Act, CTOs were introduced to replace supervised discharge orders (SDOs) and aimed to reduce readmissions into hospital. Unlike SDOs, a revocation of a CTO automatically results in a patient being detained in hospital. The first full year of CTOs in clinical practice was 2009/10. The rate of court orders peaked the following year in 2010/11 and then fell over the subsequent years to the lowest rate in 2015/16.
Implications
If these findings are accepted then an ethical debate needs to be had. For example, if civil detentions do in fact reduce the rate of offending by those with mental disorders then what effect size would make this justifiable? Clearly if the relationship was 1:1 then this would be more straightforward, but we found a relationship of 1:72 which seems a very high ratio. However, civil detentions can also be in the interests of an individual's safety or health – particularly the risk of self-harm and suicide – creating a complicated picture. Furthermore, the method of recording the number of detentions in England changed in 2016 which is going to make future trends more difficult to compare.
Concern has been expressed regarding the rising rates of detentions under the Mental Health Act and this is currently being reviewed on behalf of the government,19 and in particular the over-representation of those from Black, Asian and minority ethnic groups. It will be important to ensure that any measures taken to reduce the rate of detention (particularly the rate of civil detention) does not have the unintended consequence of increasing rates of court orders, particularly as the over-representation of Black, Asian and minority ethnic groups is greatest in forensic settings.
The findings of our study have important implications for clinical practice and policy. They suggest that the increase in the prison population that occurred at the same time as significant psychiatric bed closures has been associated with an increasing number of patients with severe mental illnesses in prison. This emphasises the importance of improving mental health services in prison, and of improving the pathway from prison to hospital for those that require this.
It also reflects decisions by wider society and successive governments about mental healthcare. The view in the last few decades has been ‘community good, hospital bad’.Reference Tyrer20 The closure of psychiatric beds has in part been because of a sceptical view of asylums. However, at the same time successive governments have chosen to have a more punitive justice system and to increase the prison estate. These trends can be seen as somewhat contradictory, and there is evidence that prisons can have a detrimental effect on mental health whereas psychiatric hospitals have the opposite effect. However, hospitals are more expensive to run than prisons and this economic imperative may be part of the driving force for the changes that have occurred.
The TAPS projectReference Leff, Trieman, Knapp and Hallam21 investigated the impact of closing two psychiatric hospitals in a part of London and found a low rate of subsequent imprisonment. This suggests that the association demonstrated in our paper between the reduction in psychiatric beds and the increase in prison transfers may be indirect, for example by the development of psychiatric in-reach teams working in prisons. However, it is worth noting that most of the discharges in the TAPS project occurred prior to 1986, which was the year when our findings demonstrate that the number of prison transfers started to increase.
An interesting experiment suggested by our findings is that: if some of the resources currently spent on the prison estate were used to increase the number of psychiatric beds in one region of the country, then the number of prison transfers would drop in that region. Future research should also test the Penrose hypothesis using the prison population and the number of NHS beds over a longer period of time than this study covers.
Appendix
Data available from 1984, 1988 and 2008 on different types of detention under the Mental Health Act 1983 in England

Supplementary material
Supplementary material is available online at http://doi.org/10.1192/bjo.2019.73.


 Open access


eLetters
No eLetters have been published for this article.