





1 Introduction
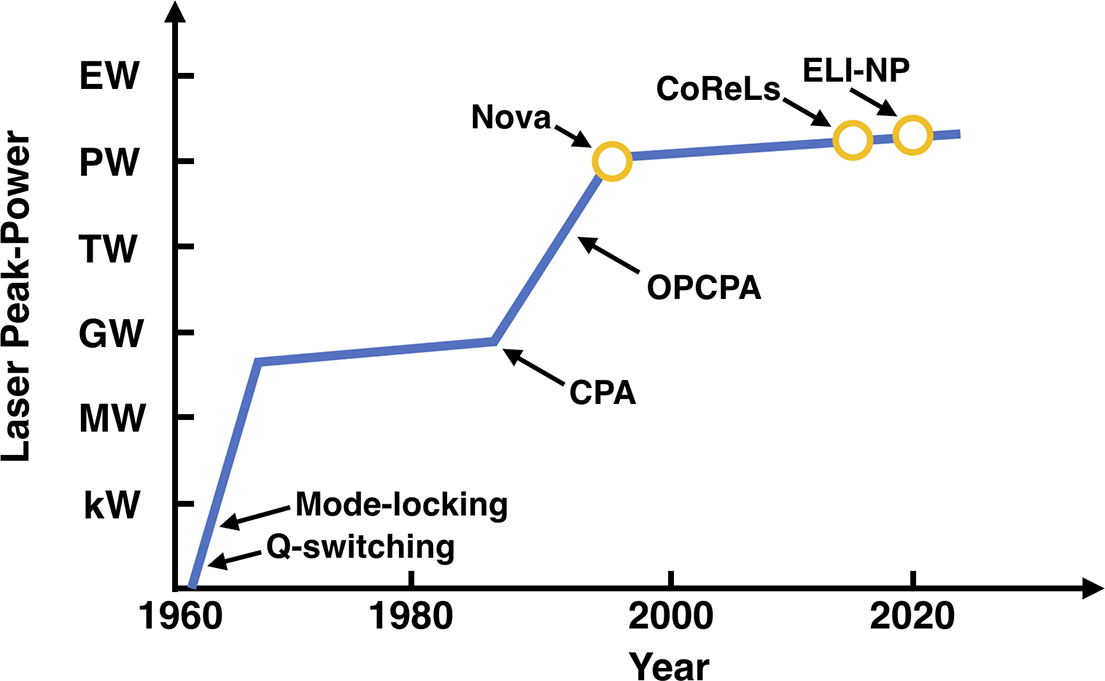
In 1960 the invention of the laser[ Reference Maiman 1 ], with its rapid advancement in peak power to gigawatt levels following the discovery of Q-switching[ Reference McClung and Hellwarth 2 ] and mode-locking[ Reference Hargrove, Fork and Pollack 3 – Reference Mocker and Collins 6 ], unlocked sufficient electric field strengths to observe nonlinear optics[ Reference Franken, Hill, Peters and Weinreich 7 ] and multi-photon physics[ Reference Kaiser and Garrett 8 ]. Over two decades later, chirped pulse amplification (CPA)[ Reference Strickland and Mourou 9 ] allowed high-peak-power lasers to break through to the multi-terawatt regime[ Reference Barty, Gordon and Lemoff 10 , Reference Sullivan, Hamster, Kapteyn, Gordon, White, Nathel, Blair and Falcone 11 ] with focused intensities exceeding 1015 W/cm2. At these intensities, the laser field strength exceeds the electron binding energy, enabling a host of new laser–plasma applications[ Reference McPherson, Gibson, Jara, Johann and Luk 12 – Reference Siders, Le Blanc, Fisher, Tajima, Downer, Babine, Stepanov and Sergeev 14 ]. Since the creation of the Nova PW laser in 1999[ Reference Perry, Pennington, Stuart, Tietbohl, Britten, Brown, Herman, Golick, Kartz, Miller, Powell, Vergino and Yanovsky 15 ], ultra-high-intensity laser systems based on CPA technology have grown in both number[ 16 ] and peak power, with several multi-petawatt facilities already operating or under construction[ Reference Lureau, Matras, Chalus, Derycke, Morbieu, Radier, Casagrande, Laux, Ricaud, Rey, Pellegrina, Richard, Boudjemaa, Simon-Boisson, Baleanu, Banici, Gradinariu, Caldararu, Boisdeffre, Ghenuche, Naziru, Kolliopoulos, Neagu, Dabu, Dancus and Ursescu 17 – Reference Bromage, Bahk, Bedzyk, Begishev, Bucht, Dorrer, Feng, Jeon, Mileham, Roides, Shaughnessy, Shoup, Spilatro, Webb, Weiner and Zuegel 21 ]. In 2021, CoReLs in the Republic of Korea, a 4-PW Ti:sapphire laser, achieved the new world record intensity of 1023 W/cm2, opening the door to new experiments in strong field quantum electrodynamics (SF-QED)[ Reference Yoon, Kim, Choi, Sung, Lee, Lee and Nam 22 ]. Recently, the Multi-Petawatt Physics Prioritization Workshop determined that the next generation of SF-QED experiments, laser-driven nuclear reactions and advanced photon and particle sources require lasers with peak power of the order of hundreds of petawatts and focused intensity greater than 1024 W/cm2 [ Reference DiPiazza, Willingale and Zuegel 23 ]. Laser facilities are currently operating in the 10-PW peak-power class; ELI-NP-HLPS in Romania has demonstrated 10 PW[ Reference Lureau, Matras, Chalus, Derycke, Morbieu, Radier, Casagrande, Laux, Ricaud, Rey, Pellegrina, Richard, Boudjemaa, Simon-Boisson, Baleanu, Banici, Gradinariu, Caldararu, Boisdeffre, Ghenuche, Naziru, Kolliopoulos, Neagu, Dabu, Dancus and Ursescu 17 ] and SULF in China has the necessary power and bandwidth[ Reference Li, Gan, Yu, Wang, Liu, Guo, Xu, Xu, Hang, Xu, Wang, Huang, Cao, Yao, Zhang, Chen, Tang, Li, Liu, Li, He, Yin, Liang, Leng, Li and Xu 24 ], along with several currently under construction[ Reference Rus, Bakule, Kramer, Naylon, Thoma, Green, Antipenkov, Fibrich, Novák, Batysta, Mazanec, Drouin, Kasl, Baše, Peceli, Koubíková, Trojek, Boge, Lagron, Weiss, Hřebček, Hříbek, Durák, Polan, Košelja, Korn, Horáček, Horáček, Himmel, Havlíček, Honsa, Korouš, Laub, Haefner, Bayramian, Spinka, Marshall, Johnson, Telford, Horner, Deri, Metzger, Schultze, Mason, Ertel, Lintern, Greenhalgh, Edwards, Hernandez-Gomez, Collier, Gaul, Martinez, Frederickson, Hammond, Malato, White and Houžvička 25 – Reference Papadopoulos, Zou, Le Blanc, Chériaux, Georges, Druon, Mennerat, Ramirez, Martin, Fréneaux, Beluze, Lebas, Monot, Mathieu and Audebert 27 ]. Breakthroughs in laser peak-power have been precipitated by new laser science techniques, as seen in Figure 1, and the extension of CPA-based, high-peak-power lasers to exawatt class, however, presents significant technological hurdles. CPA mitigates optical damage due to small-scale self-focusing in a laser amplifier by temporally stretching the pulse prior to amplification, which lowers the pulse intensity in the gain media, thereby decreasing the B-integral accumulation (a metric of nonlinear phase accumulation related to pulse intensity). This has allowed for laser peak power to increase by several orders of magnitude, but has effectively pushed the damage problem from the amplifier and onto the final optics. In particular, the final compressor grating, and all downstream optics, where the pulse duration is the shortest and intensity the highest, become the weak link in the system. If these optics are operated at above 1013 W/cm2, the field strength of the laser will exceed the binding potential of electrons in the optic and the optic will be damaged. This damage mechanism presents a hard limit on pulse intensity within the laser system. To further increase peak power beyond the current state-of-the-art, the pulse intensity on the final optics must be reduced by increasing the beam aperture either directly, with beam expansion and larger optics, or indirectly, by coherently combining multiple beam apertures. Thus, most designs for new laser systems that can go beyond the current 10-PW limit center on one of four schemes: (i) multiple amplifier beamlines that are coherently beam combined (CBC) post-compression[ Reference Mourou, Georg, Sander and Collier 28 , Reference Bashinov, Gonoskov, Kim, Mourou and Sergeev 29 ]; (ii) a single exawatt-class amplifier beamline that is compressed by a large, tiled grating assembly[ Reference Kessler, Bunkenburg, Huang, Kozlov and Meyerhofer 30 , Reference Li, Li, Wang, Xu, Wu, Li and Leng 31 ]; (iii) a single exawatt-class amplifier beamline that is compressed with plasma optics[ Reference Hur, Ersfeld, Lee, Kim, Roh, Lee, Song, Kumar, Yoffe, Jaroszynski and Suk 32 ]; and (iv) a single exawatt-class amplifier beamline that is split into multiple identical beamlets prior to final compression[ Reference Barty 33 , Reference Barty 34 ].
It is the peak-focused intensity, rather than peak power, that allows for novel laser applications and the discovery of new science. CoReLs, while not the highest peak-power laser, was able to achieve record intensity through careful management of wavefront errors on the 4-PW beamline to minimize the focal spot area[ Reference Yoon, Kim, Choi, Sung, Lee, Lee and Nam 22 ]. Extending this to multiple individual amplifier beamlines that are coherently combined is very challenging. Each amplifier will have a different prompt wavefront distortion shot-to-shot, ultimately limiting the maximum focused intensity achievable. In the tiled grating compressor architecture, the void between gratings imparts a mosaic error onto the near-field of the beam that negatively affects the focal spot distribution, lowering the intensity[ Reference Blasiak and Zheleznyak 35 – Reference Yang, Qi, Mi, Zhang, Yu, Yu, Li and Yang 37 ]. Furthermore, each tiled grating has five degrees-of-freedom that must be aligned with nanometer-level precision for the gratings to be coherently tiled together[ Reference Yang, Qi, Mi, Zhang, Yu, Yu, Li and Yang 37 , Reference Cotel, Castaing, Pichon and Le Blanc 38 ]. This becomes prohibitively expensive and complicated as the laser scales in size.
Trend line of the highest achieved laser peak power over time. Advents of new laser techniques allow for an initial rapid increase in laser peak power followed by a period of more moderate increases as the technology matures.
To achieve the highest intensity possible with a fixed laser power, it is desirable to have a single, exawatt-class amplifier beamline split into multiple identical beamlets that are compressed separately. There are amplifier architectures capable of this, although they are few. Ti:sapphire amplifiers are limited in energy by the maximum crystal size possible and parasitic amplified spontaneous emission (ASE)[ Reference Patterson, Bonlie, Price and White 39 – Reference Laux, Lureau, Radier, Chalus, Caradec, Casagrande, Pourtal, Simon-Boisson, Soyer and Lebarny 41 ]; barring new techniques to drastically reduce the pulse duration in these systems, it is unlikely that a single Ti:sapphire amplifier will produce greater than 10 PW. Recently, Liu et al. [ Reference Liu, Liu, Li, Leng and Li 42 ] presented a method to tile four Ti:sapphire amplifiers together in a 2×2 array seeded from a common front-end to scale beyond 10 PW to 40 PW. While this showed improvements over coherent beam combining, there are challenges in scaling further to the exawatt class. In 2021, Li et al. [ Reference Li, Kato and Kawanaka 43 ] published a scheme called wide-angle non-collinear optical parametric chirped pulse amplification (WNOPCPA) that could potentially produce an approximately 0.12-EW beamline prior to thin-plate post-compression and approximately 0.59 EW with thin-plate post-compression. However, this scheme does not have a design for the compressor system and is predicated on a multi-kJ pump laser as well as meter-scale chirped mirrors.
Large-aperture Nd:glass lasers, leveraging decades of research and implementation as the highest energy laser systems produced[ Reference Soures, Kumpan and Hoose 44 – Reference Neauport, Airiau, Beck, Belon, Bordenave, Bouillet, Chanal, Chappuis, Coic, Courchinoux, Denis, Gaudfrin, Gaudfrin, Gendeau, Heymans, Julien, Lacombe, Lamy, Lebeaux, Luttmann, Modelin, Perrin, Ribeyre, Rouyer, Tournemenne, Valla and Vermersch 47 ], are a prime candidate for a single amplifier exawatt-class beamline. They continue to be used as the platform for new high-intensity lasers when high energy is desired[ Reference Rus, Bakule, Kramer, Naylon, Thoma, Green, Antipenkov, Fibrich, Novák, Batysta, Mazanec, Drouin, Kasl, Baše, Peceli, Koubíková, Trojek, Boge, Lagron, Weiss, Hřebček, Hříbek, Durák, Polan, Košelja, Korn, Horáček, Horáček, Himmel, Havlíček, Honsa, Korouš, Laub, Haefner, Bayramian, Spinka, Marshall, Johnson, Telford, Horner, Deri, Metzger, Schultze, Mason, Ertel, Lintern, Greenhalgh, Edwards, Hernandez-Gomez, Collier, Gaul, Martinez, Frederickson, Hammond, Malato, White and Houžvička 25 , Reference Jourdain, Chaulagain, Havlík, Kramer, Kumar, Majerová, Tikhonchuk, Korn and Weber 48 ], with further progress allowing for repetition rates up to 10 Hz[ Reference Reagan, Albrecht, Alessi, Ammons, Banerjee, Barillas, Batysta, Buckley, Chemali, Clark, Davila, Deri, Eseltine, Fishler, Fulkerson, Galbraith, Galvin, Gonzales, Gopalan, Herriot, Hubka, Jimenez, Kiani, Koh, Kupfer, Liao, Lusk, Nguyen, Patel, Peer, Peterson, Plummer, Schaffers, Sistrunk, Spinka, Stolz, Tamer, Tang, Telford, Terzi, Utley, Velas, Vella and Wong 49 ]. One can safely extract approximately 25 kJ from a single amplifier of the National Ignition Facility (NIF) laser if the input pulse is stretched to greater than 20 ns[ Reference Van Wonterghem, Burkhart, Haynam, Manes, Marshall, Murray, Spaeth, Speck, Sutton and Wegner 50 ]. While large-aperture Nd:glass lasers, such as that of the NIF, typically operate with a compressed pulse duration of approximately 3–5 ns, Hays et al. [ Reference Hays, Gaul, Martinez and Ditmire 51 ] have shown that a Nd:mixed-glass power amplifier (PA), composed of mixed silicate and phosphate glass amplifier slabs, when operated with an appropriate front-end based on a Ti:sapphire seed laser and optical parametric chirped pulse amplification (OPCPA) pre-amplifier can support the amplified bandwidth necessary to produce 100-fs Fourier transform-limited (FTL) pulses. Combining this broadband front-end with a large-aperture Nd:mixed-glass PA has the potential to provide a single amplifier beamline capable of producing approximately 20-kJ, 100-fs pulses, after diffraction losses from compression, for a peak power of 0.2 EW. However, this is predicated on the ability to stretch the pulse to 20 ns and compress it back to 100 fs. If this were to be done in a typical CPA setup using a four-grating Tracey compressor[ Reference Treacy 52 ] with the existing advanced radiographic capability (ARC) laser grating design[ Reference Britten, Molander, Komashko and Barty 53 ], gratings two and three would require a width of approximately 6 m for sufficient optical path length difference between the red and blue components to temporally recompress the pulse. These gratings are estimated to have a damage threshold of approximately 1 J/cm2 when scaled to 100-fs pulse durations[ Reference Britten 54 , Reference Alessi, Carr, Hackel, Negres, Stanion, Fair, Cross, Nissen, Luthi, Guss, Britten, Gourdin and Haefner 55 ]; to drop the fluence below this value requires expanding the beam and grating height to approximately 5.5 m. The production of 6-m × 5.5-m gratings is well beyond the capabilities of any existing, large-scale grating fabrication system.
Chirped pulse juxtaposed with beam amplification (CPJBA), patented in 2004[ Reference Barty 33 ] and first presented at the International Committee on Ultra-High Intensity Lasers Conference 2014, is a technique to produce an ultra-high-intensity laser by extracting the full energy from a high-saturation fluence laser system using a highly stretched chirped-beam pulse, which is a pulse that has been both spatially and temporally chirped, and recompressing with a six-grating compressor system. Final optic damage is avoided by splitting the pulse into multiple identical copies, prior to final temporal compression, and distributing the fluence over many final grating pairs. When applied to a single NIF-like beamline this system is expected to produce an exawatt-class peak-power laser, which we will refer to as the Nexawatt[ Reference Barty 34 ]. All the fundamental components of the Nexawatt are based on existing technology that has been implemented in current high-intensity lasers and large-scale optical systems. Despite this, to reach exawatt-class peak power these optics demand a damage threshold, as well as high surface quality and uniformity over a large aperture, at the edge of present capabilities. Ongoing development of next-generation fusion and PW lasers will be very beneficial to achieve the specifications needed here. It is to be expected that any effort to create an exawatt-scale laser will require significant capital and technical investment. While we believe the Nexawatt system avoids many of the complications of other exawatt-class peak-power laser proposals that could degrade focused intensity, it does require intricate two-dimensional (2D) spatio-spectral pulse sculpting along with nanometer-scale optical component alignment to properly phase together multiple beams, which will need significant development effort. Small-scale demonstration of various sub-systems will be necessary to address the unique challenges of this novel laser architecture, which are as follows:
-
• seed pulse generation – creation of a 20-ns stretched, chirped-beam, seed pulse;
-
• chirped-beam amplification – management of the pulse distortions that occur during amplification due to the unique chirped-beam pulse structure;
-
• long-duration pulse compression – compression of the 20-ns stretched pulse to its 100-fs Fourier transform limit using gratings based on existing technology;
-
• management of final optics damage – generation of identical, lower-peak-power beams prior to final pulse compression;
-
• multi-beamlet focusing – focusing and phasing of multiple, identical output beams.
This paper presents a first-pass design and simulation of the various sub-systems required to create, amplify, compress and, finally, focus the chirped-beam pulse. This architecture potentially allows the production of 0.2-EW peak-power laser pulses and subsequent focused intensities of 1025 W/cm2, or two orders of magnitude beyond the current record.
The design of a novel multi-pass regenerative stretcher, capable of producing stretched pulses greater than 20 ns with moderate size gratings and optics, is discussed in detail. The unique spatio-temporal and spatio-spectral distortions that arise from amplifying a simultaneously spatially and temporally chirped beam are shown via numerical simulation. Spectral sculpting and spatial masking of the input pulse fluence, as well as spatial variation of the gain distribution, are optimized to mitigate pulse distortions. This results in an amplified pulse of 25 kJ with the appropriate spatio-spectral and spatio-temporal distribution that can be compressed by a six-grating chirped-beam pulse compressor. To avoid final optic damage the pulse is split into 36 copies using a dispersion and amplitude-balanced splitting arrangement prior to total compression by the final grating pair of the six-grating compressor. This distributes the pulse over many grating pairs producing multiple identical beamlets at the output, which inherently allows a variety of multi-beam focusing arrangements such as dipole focusing[ Reference Gonoskov, Bashinov, Gonoskov, Harvey, Ilderton, Kim, Marklund, Mourou and Sergeev 56 ] and other multi-beam applications[ Reference Magnusson, Gonoskov, Marklund, Esirkepov, Koga, Kondo, Kando, Bulanov, Korn, Geddes, Schroeder, Esarey and Bulanov 57 , Reference Nelson, Charbonnet, Effarah, Reutershan, Chesnut and Barty 58 ]. The details and error analysis of a segmented parabolic focusing mirror, similar to those used on large-aperture telescopes[ Reference Trumper, Hallibert, Arenberg, Kunieda, Guyon, Stahl and Kim 59 ], is shown to coherently phase together the identical beamlets in a manner that would produce a focused intensity exceeding 1025 W/cm2.
2 Chirped pulse juxtaposed with beam amplification
High-saturation fluence gain materials, for example Nd:glass and Yb:glass, require a highly stretched temporal pulse to extract the full stored energy while avoiding optical damage from B-integral accumulation leading to small-scale self-focusing. Small-scale self-focusing is initiated by the high-frequency spatial noise content on the beam, which can be reduced by a spatial filter. Extensive experimental work on high-energy Nd:glass laser systems has suggested a delta B-integral, the B-integral accumulated between passes through a spatial filter, a limit of 3 and a cumulative B-integral, total B-integral accumulated, of 5–6[ Reference Simmons, Hunt and Warren 60 – Reference Van Wonterghem, Murray, Campbell, Speck, Barker, Smith, Browning and Behrendt 62 ]. The greater the amount of stored energy in the amplifier, the longer the stretched pulse duration required – this is one of the primary reasons why high-energy, Nd:glass laser systems operate at a small portion, around 10%, of their total stored energy. The NIF has shown that a stretched pulse of 23 ns is able to safely extract the full 26 kJ of stored energy in a single amplifier beamline[ Reference Van Wonterghem, Burkhart, Haynam, Manes, Marshall, Murray, Spaeth, Speck, Sutton and Wegner 50 ]. However, as the stretched pulse duration extends into the nanosecond regime a practical problem emerges: the gratings must be large enough to handle a nanosecond-scale delay between the red and blue components of the spectrum. A delay of 1 ns equates to approximately 30 cm of path difference, and when projected onto a grating at its operating angle-of-incidence (AOI) requires meter-scale grating apertures. Furthermore, large-area beams, as found on high-energy Nd:glass lasers, are very inefficient in their use of the grating aperture for temporal compression as the maximum normal separation of a grating pair, and hence the maximum negative group delay dispersion (GDD) induced on the pulse is limited, in part, by the spatial beam width. In a previous publication we detailed how to enhance the temporal compression efficiency of a grating pair by spatially chirping the input beam to allow for greater grating separation[ Reference Chesnut and Barty 63 ]. This chirped-beam grating pair led to the design of the six-grating compressor and is one of the fundamental components of CPJBA[ Reference Barty 34 , Reference Chesnut and Barty 63 ]. In a typical grating pair compressor, the maximum normal grating separation is given by the following:
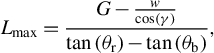 $$\begin{align}{L}_\mathrm{max}=\frac{G-\frac{w}{\cos \left(\gamma \right)}}{\tan \left({\theta}_\mathrm{r}\right)-\tan \left({\theta}_\mathrm{b}\right)},\end{align}$$
where $G$
is the width of the second grating,
$G$
is the width of the second grating, $w$
is the input beam width,
$w$
is the input beam width, $\gamma$
is the AOI on the first grating and
$\gamma$
is the AOI on the first grating and ${\theta}_\mathrm{r}$
and
${\theta}_\mathrm{r}$
and ${\theta}_\mathrm{b}$
are the diffracted angles of the red-most and blue-most components of the spectrum, respectively, as determined by the grating equation[
Reference Chesnut and Barty
63
]. Figure 2 graphically demonstrates the effect that the input beam width has on the maximum grating separation, where a smaller beam enables a larger grating separation before clipping.
${\theta}_\mathrm{b}$
are the diffracted angles of the red-most and blue-most components of the spectrum, respectively, as determined by the grating equation[
Reference Chesnut and Barty
63
]. Figure 2 graphically demonstrates the effect that the input beam width has on the maximum grating separation, where a smaller beam enables a larger grating separation before clipping.
In developing the ARC PW laser, the Lawrence Livermore National Laboratory (LLNL) produced high-efficiency, high-damage-threshold multi-layer dielectric (MLD) gratings with a groove density of 1780 lines/mm and AOI of 76.5 degrees[ Reference Britten, Molander, Komashko and Barty 53 ]. Current ARC gratings are approximately 0.9-m wide[ Reference Barty, Key, Britten, Beach, Beer, Brown, Bryan, Caird, Carlson, Crane, Dawson, Erlandson, Fittinghoff, Hermann, Hoaglan, Iyer, Jones, Jovanovic, Komashko, Landen, Liao, Molander, Mitchell, Moses, Nielsen, Nguyen, Nissen, Payne, Pennington, Risinger, Rushford, Skulina, Spaeth, Stuart, Tietbohl and Wattellier 64 ], but it is believed the grating manufacturing equipment, used by the Plymouth Grating Laboratory and LLNL, can be scaled up to produce 2-m-wide gratings[ Reference Erdogan 65 ]. Horiba France has produced the approximately 0.575-m × 1.015-m gratings currently used on the ELI-NP HPLS compressor[ Reference Lureau, Matras, Chalus, Derycke, Morbieu, Radier, Casagrande, Laux, Ricaud, Rey, Pellegrina, Richard, Boudjemaa, Simon-Boisson, Baleanu, Banici, Gradinariu, Caldararu, Boisdeffre, Ghenuche, Naziru, Kolliopoulos, Neagu, Dabu, Dancus and Ursescu 17 ] and 0.66-m × 1.41-m gratings that have undergone experimental demonstration at SIOM[ Reference Han, Li, Zhang, Kong, Cao, Jin, Leng, Li and Shao 66 ]. Given the ARC grating design, with a maximum aperture of 2 m, and a 37-cm beam width, as is commonly found on large-aperture Nd:glass lasers[ Reference Neauport, Airiau, Beck, Belon, Bordenave, Bouillet, Chanal, Chappuis, Coic, Courchinoux, Denis, Gaudfrin, Gaudfrin, Gendeau, Heymans, Julien, Lacombe, Lamy, Lebeaux, Luttmann, Modelin, Perrin, Ribeyre, Rouyer, Tournemenne, Valla and Vermersch 47 , Reference Spaeth, Manes, Kalantar, Miller, Heebner, Bliss, Spec, Parham, Whitman, Wegner, Baisden, Menapace, Bowers, Cohen, Suratwala, Di Nicola, Newton, Adams, Trenholme, Finucane, Bonanno, Rardin, Arnold, Dixit, Erbert, Erlandson, Fair, Feigenbaum, Gourdin, Hawley, Honig, House, Jancaitis, LaFortune, Larson, Le Galloudec, Lindl, MacGowan, Marshall, McCandless, McCracken, Montesanti, Moses, Nostrand, Pryatel, Roberts, Rodriguez, Rowe, Sacks, Salmon, Shaw, Sommer, Stolz, Tietbohl, Widmayer and Zacharias 67 ], a standard four-grating compressor can compress, at maximum, a 3.34-ns stretched pulse down to a 100-fs FTL.
Illustration of how the grating pair is limited by the angular dispersion of the red-most and blue-most frequency components along with the aperture size of the second grating.
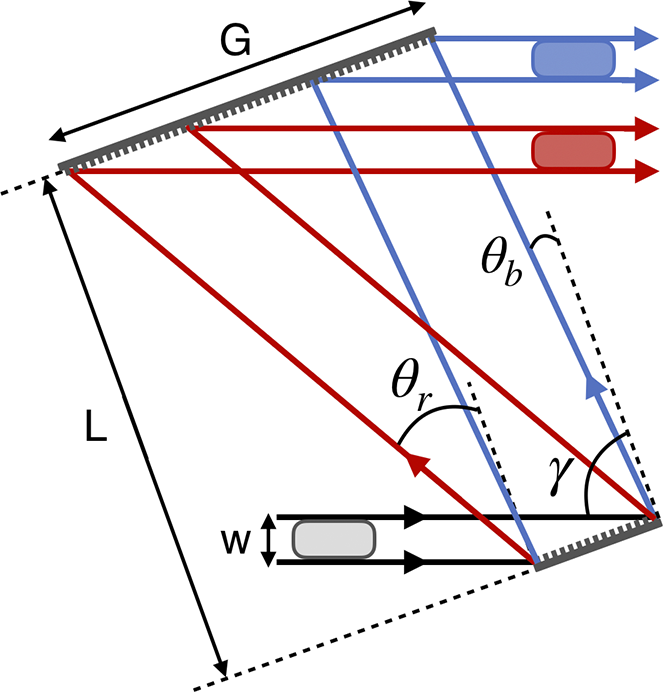
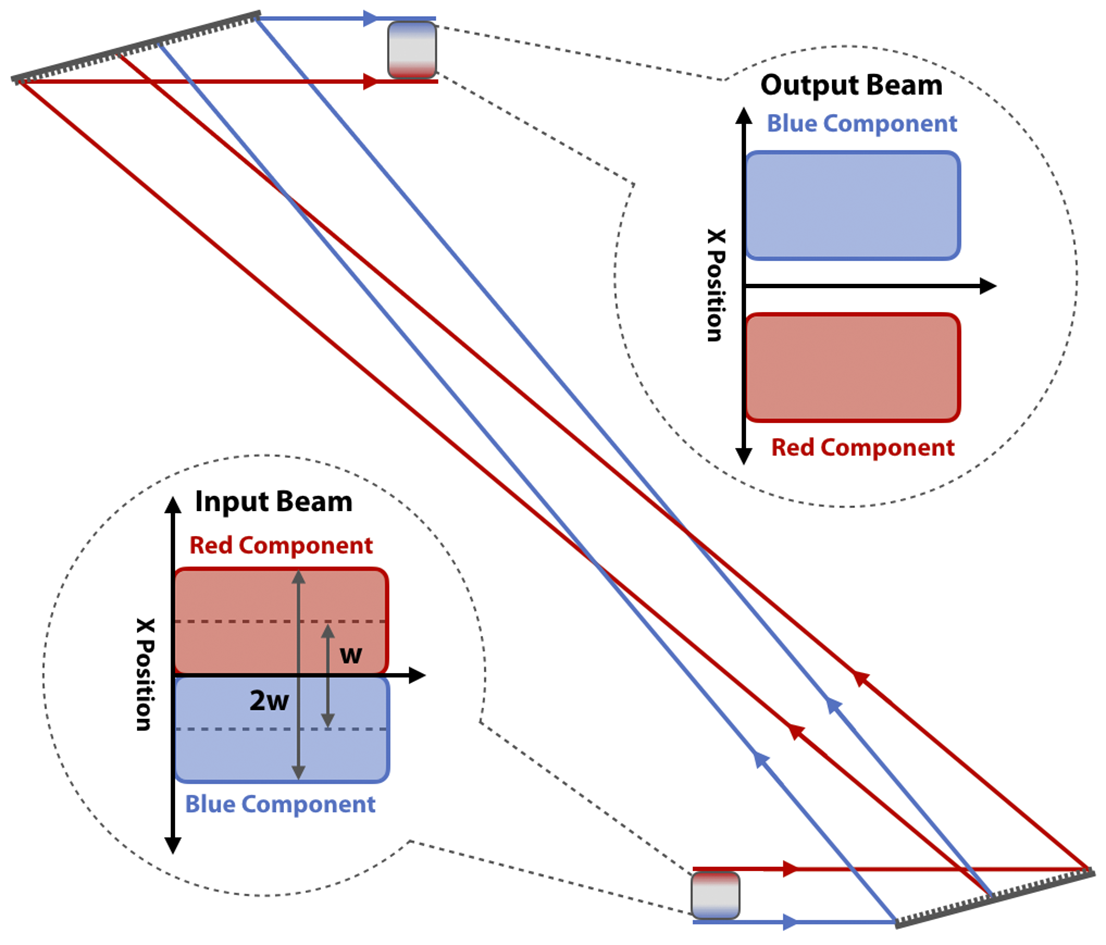
Illustration of a chirped-beam grating pair interacting with a spatially chirped-beam pulse with a $\chi$
of two.
$\chi$
of two.
The compressive effect of a maximum-aperture-limited grating pair can be extended by employing spatial chirp on the input beam[
Reference Chesnut and Barty
63
]. Spatial chirp is defined as a varying spatial location, transverse to the direction of propagation, of the frequency components in a laser pulse[
Reference Gu, Akturk and Trebino
68
]. Spatial chirp can be conveniently described by the spatial chirp parameter, $\chi$
, which normalizes the spatial chirp to the beam size. Here,
$\chi$
, which normalizes the spatial chirp to the beam size. Here, $\chi$
represents the total beam width expansion factor due to spatial chirp; a
$\chi$
represents the total beam width expansion factor due to spatial chirp; a $\chi$
of two represents a beam whose red-most and blue-most components (i.e., the spectral cutoff frequencies that experience zero clipping on the grating aperture) have been separated a transverse distance equal to the initial beam width. Generally, spatial chirp is created by optics that induce angular dispersion. For example, in Figure 2 the pulse enters the first grating with all the frequency components overlapped in space; the first grating imparts angular dispersion to the pulse causing the frequency components to spatially separate; the second grating removes the angular dispersion yet the frequency components remain spatially separated. Consider further separating the grating pair until the input beam has doubled from the original full-width due to the spatial chirp of the spectral components. Now, as illustrated in Figure 3, the input beam has a spatial chirp parameter of two (i.e., the red and blue components of the pulse have been separated transversely in space by a distance equivalent to the original beam width) and the optical path length difference of the spectral components between the grating pair is increased. We refer to this simultaneous spatial and temporal chirp as a chirped-beam pulse. With this, the maximum normal grating separation becomes[
Reference Chesnut and Barty
63
]
$\chi$
of two represents a beam whose red-most and blue-most components (i.e., the spectral cutoff frequencies that experience zero clipping on the grating aperture) have been separated a transverse distance equal to the initial beam width. Generally, spatial chirp is created by optics that induce angular dispersion. For example, in Figure 2 the pulse enters the first grating with all the frequency components overlapped in space; the first grating imparts angular dispersion to the pulse causing the frequency components to spatially separate; the second grating removes the angular dispersion yet the frequency components remain spatially separated. Consider further separating the grating pair until the input beam has doubled from the original full-width due to the spatial chirp of the spectral components. Now, as illustrated in Figure 3, the input beam has a spatial chirp parameter of two (i.e., the red and blue components of the pulse have been separated transversely in space by a distance equivalent to the original beam width) and the optical path length difference of the spectral components between the grating pair is increased. We refer to this simultaneous spatial and temporal chirp as a chirped-beam pulse. With this, the maximum normal grating separation becomes[
Reference Chesnut and Barty
63
]
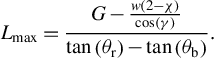 $$\begin{align}{L}_\mathrm{max}=\frac{G-\frac{w\left(2-\chi \right)}{\cos \left(\gamma \right)}}{\tan \left({\theta}_\mathrm{r}\right)-\tan \left({\theta}_\mathrm{b}\right)}.\end{align}$$
For the ARC grating design, a full-width beam of 37 cm and a pulse with spectral content ranging from 1040 to 1070 nm, this chirped-beam pulse grating pair generates 425% more negative GDD than the traditional grating pair[ Reference Chesnut and Barty 63 ].
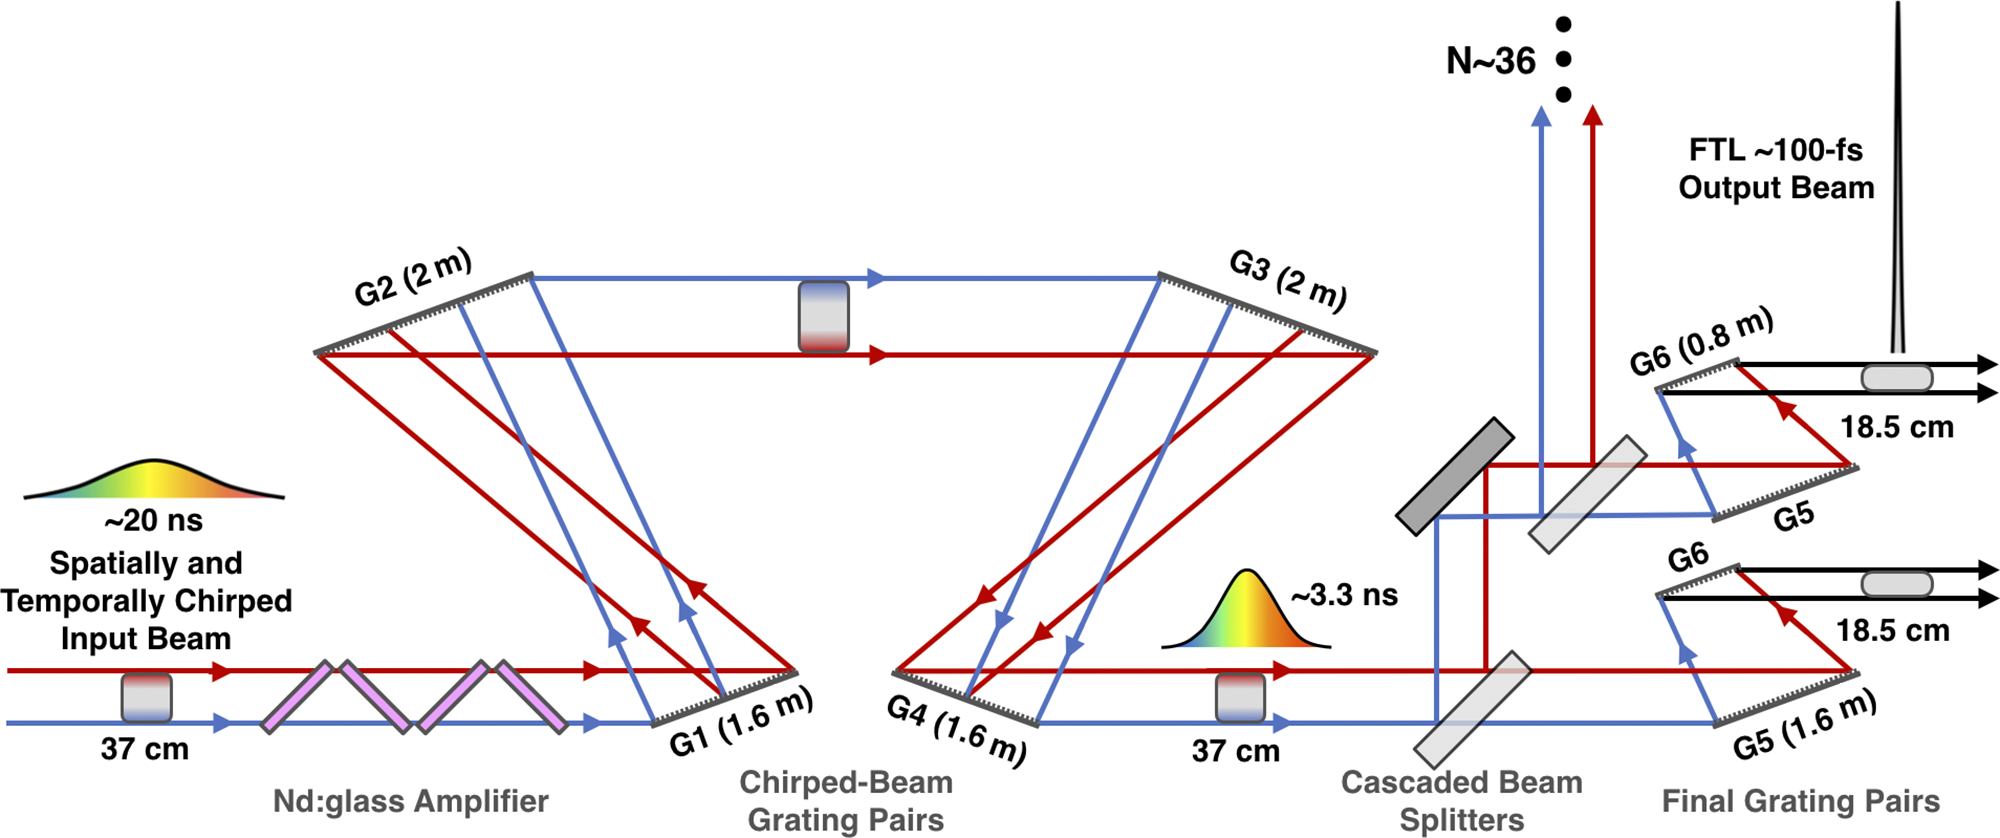
Schematic of the six-grating compressor for CPJBA designed to compress a 37-cm × 37-cm aperture simultaneously spatially and temporally chirped 20-ns pulse down to an 18.5-cm × 37-cm aperture 100-fs Fourier transform-limited pulse[ Reference Chesnut and Barty 63 ].
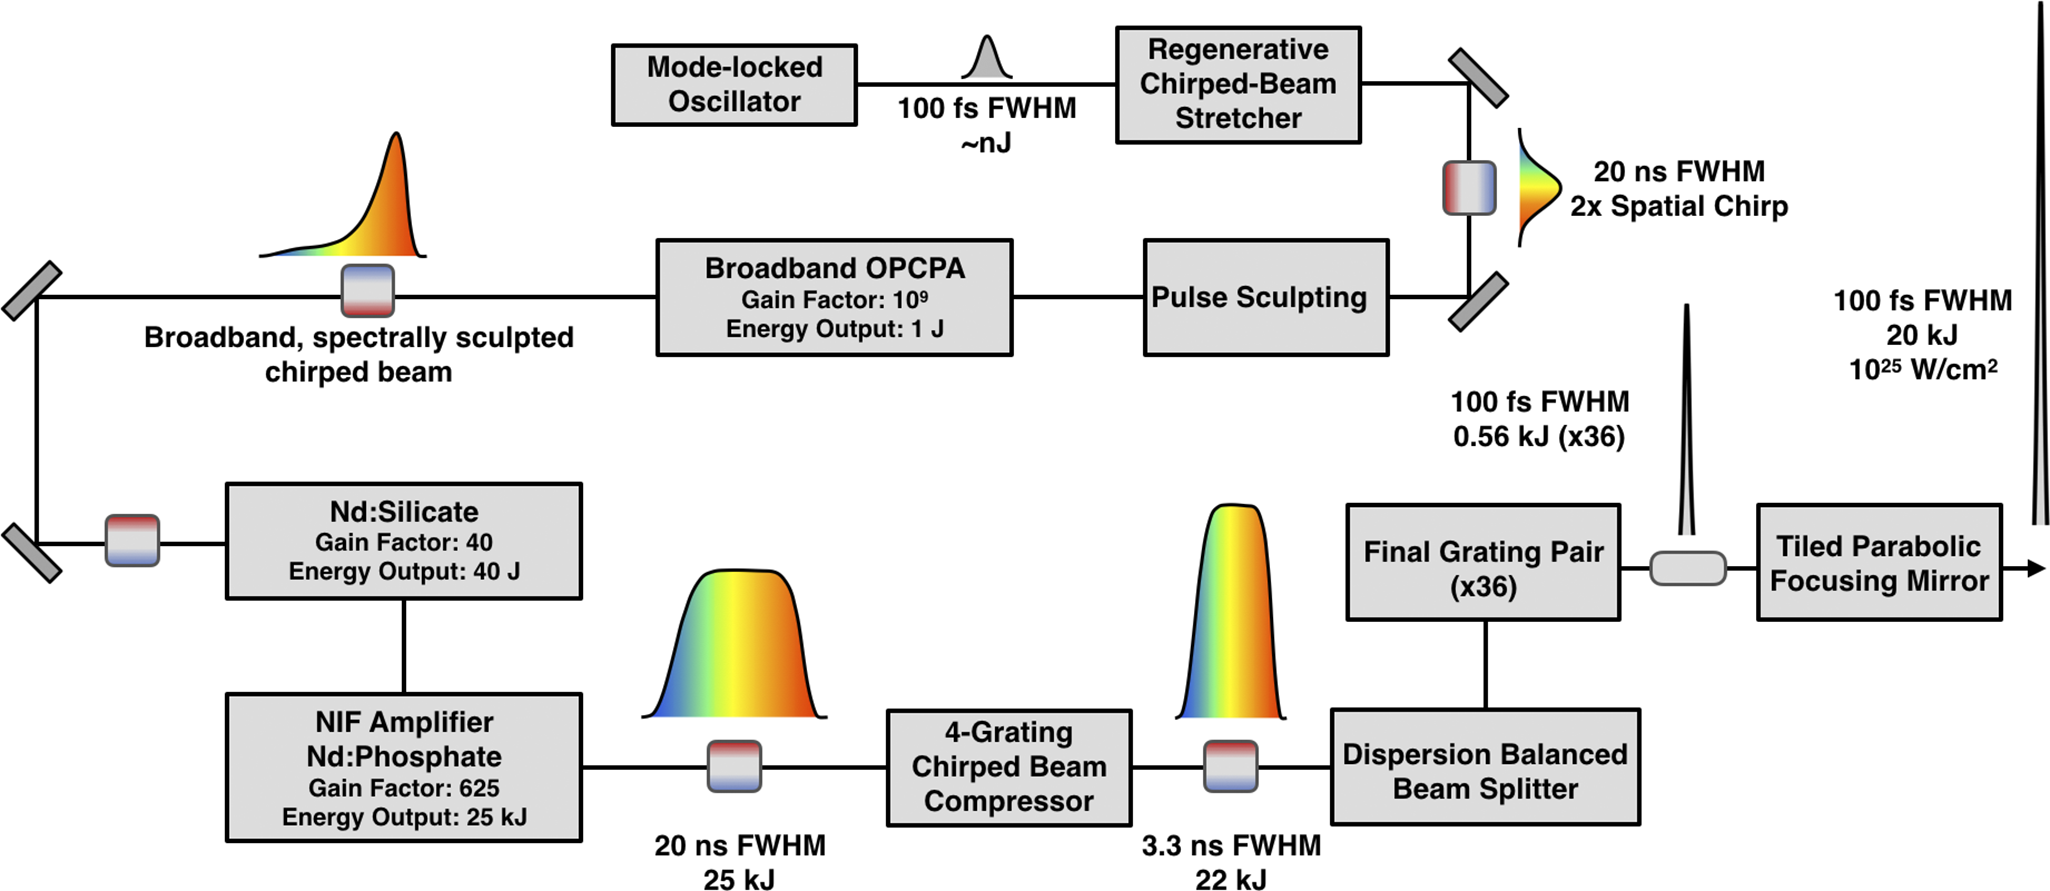
Flow chart diagram of the Nexawatt laser.
CPJBA enables highly efficient temporal compression of large-aperture beams with a novel six-grating compressor, shown in Figure 4. Here, two chirped-beam pulse grating pairs (G1-G2 and G3-G4) perform a majority of the temporal compression but leave the spatial chirp unchanged. The chirped-beam pulse then enters a final grating pair that removes the spatial chirp and performs the remaining amount of temporal compression. In this way, one can compress a 20-ns stretched pulse down to its 100-fs FTL using ARC gratings with a maximum aperture of 2 m. As mentioned previously, the final grating has a finite damage threshold of approximately 1 J/cm2 at 100 fs[ Reference Britten 54 , Reference Alessi, Carr, Hackel, Negres, Stanion, Fair, Cross, Nissen, Luthi, Guss, Britten, Gourdin and Haefner 55 ] and cannot handle the full power of the compressed pulse. Instead, through a careful arrangement of beam splitters, the chirped-beam pulse is split into multiple identical beamlet copies prior to total temporal compression by as many final grating pairs – this effectively increases the aperture of the final grating, reducing the fluence seen on the final optic. Since the beamlets all originate from the same amplifier there is a single wavefront distortion to correct for, and all beamlets will be identical to the extent that the beam splitters and final gratings can be made identical. To accomplish this compression factor with a standard four-grating Tracey compressor, the ARC grating design would require a grating aperture of 5.4 m (height) × 1.6 m (wide) for gratings 1 and 4, and 5.4 m (height) × 6.14 m (wide) for gratings 2 and 3. Supposing a maximum grating aperture of 0.5 m (height) × 2 m (wide), to drop the fluence below the 1-J/cm2 damage limit the tiled grating approach would need 11 × 1 tiled gratings for gratings 1 and 4 and 11 × 4 tiled gratings for gratings 2 and 3 – a total of 110, 2-m wide gratings. Each of these gratings has 5 degrees-of-freedom that require nm-scale alignment precision to properly maintain the pulse structure[ Reference Blasiak and Zheleznyak 35 – Reference Yang, Qi, Mi, Zhang, Yu, Yu, Li and Yang 37 ]. In contrast, the CPJBA six-grating compressor involves only two, 2-m aperture gratings as most of the gratings are 1.6 or 0.8-m wide, and it has lower complexity alignment and does not require masking the beam.
3 Nexawatt system overview
The Nexawatt (NIF Exawatt) system is based on a single aperture of a modified NIF beamline that incorporates an OPCPA front-end and Nd:mixed-glass main amplifiers (MAs), similar to the Texas Petawatt and ELI-Aton lasers[ Reference Rus, Bakule, Kramer, Naylon, Thoma, Green, Antipenkov, Fibrich, Novák, Batysta, Mazanec, Drouin, Kasl, Baše, Peceli, Koubíková, Trojek, Boge, Lagron, Weiss, Hřebček, Hříbek, Durák, Polan, Košelja, Korn, Horáček, Horáček, Himmel, Havlíček, Honsa, Korouš, Laub, Haefner, Bayramian, Spinka, Marshall, Johnson, Telford, Horner, Deri, Metzger, Schultze, Mason, Ertel, Lintern, Greenhalgh, Edwards, Hernandez-Gomez, Collier, Gaul, Martinez, Frederickson, Hammond, Malato, White and Houžvička 25 , Reference Gaul, Martinez, Blakeney, Jochmann, Ringuette, Hammond, Borger, Escamilla, Douglas, Henderson, Dyer, Erlandson, Cross, Caird, Ebbers and Ditmire 69 ], that utilizes the CPJBA scheme to potentially extend its peak power into the exawatt regime. Nd:glass amplifiers have been traditionally considered ‘narrow-bandwidth’ amplification mediums; however, when the amplifier is composed of mixed substrate glass it can support a much broader spectrum enabling high-energy, short-pulse amplification. In 2007 Hays et al. [ Reference Hays, Gaul, Martinez and Ditmire 51 ] showed in a numerical study that an initial amplification stage of K-824 Nd:silicate glass slabs followed by a second amplifier composed of APG-1 Nd:phosphate glass slabs can have with total gain 104 while supporting an amplified bandwidth capable of producing approximately 100-fs FTL pulses. Using a 20-ns chirped-beam pulse to extract the full energy from a NIF-like beamline composed of Nd:mixed glass could potentially result in, after diffraction losses from a CPJBA six-grating compressor, approximately 20 kJ in a 100-fs FTL pulse – a 0.2-EW peak-power laser. The general architecture of the full Nexawatt energetics chain is based on the conceptual schematic presented by Hays et al. [ Reference Hays, Gaul, Martinez and Ditmire 51 ].
A top-level flow chart of the Nexawatt system is shown in Figure 5. The pulse originates from a Ti:sapphire mode-locked oscillator as an approximately 100-fs duration, approximately nJ pulse with a spectrum centered at 1060 nm. The pulse travels to a multi-pass regenerative stretcher where it is temporally stretched to approximately 20 ns. From here, the beam is sent into a cylindrical telescope to expand the vertical dimension, creating a 2:1 aspect ratio, and then enters a single grating pair, composed of gratings identical to those in the compressor, that induces a 2× spatial chirp. The output of this is our chirped-beam pulse. Due to the unique gain effects present in CPJBA, the spatio-spectral distribution of the pulse must be appropriately sculpted[ Reference Korman, Bahar, Arieli and Suchowski 70 , Reference Zhan 71 ]. To further deal with spatial gain effects and amplifier inhomogeneities an adaptive optic allows for a spatial mask to be applied to the beam, similar to the NIF front-end[ Reference Heebner, Borden, Miller, Hunter, Christensen, Scanlan, Hayman, Wegner, Hermann, Brunton, Tse, Awwal, Wong, Seppala, Franks, Marley, Williams, Budge, Henesian and Dinicola 72 , Reference Heebner, Acree, Alessi, Barnes, Bowers, Browning, Budge, Burns, Chang, Christensen, Crane, Dailey, Erbert, Fischer, Flegel, Golick, Halpin, Hamamoto, Hermann, Hernandez, Honig, Jarboe, Kalantar, Kanz, Knittel, Lusk, Molander, Pacheu, Paul, Pelz, Prantil, Rushford, Schenkel, Sigurdsson, Spinka, Taranowski, Wegner, Wilhelmsen, Nan Wong and Yang 73 ]. A vast majority of the total system gain comes from a broadband OPCPA pre-amplifier, with a gain of 109, which also performs the bulk of the spectral sculpting on the highly stretched pulse by modulating the pump intensity in time[ Reference Batysta, Antipenkov, Borger, Kissinger, Green, Kananavičius, Chériaux, Hidinger, Kolenda, Gaul, Rus and Ditmire 74 , Reference Lee, Kim, Yoo, Yoon, Yang, Lim, Nam, Sung and Lee 75 ]. At this point the chirped-beam pulse has approximately 1 J of energy and is expanded to an aperture of 37 cm × 37 cm before entering the two separate large-aperture, NIF-like PA stages – a Nd:silicate stage followed by a Nd:phosphate stage[ Reference Hays, Gaul, Martinez and Ditmire 51 ]. The lens-based spatial filter currently used in the NIF amplifier is not suitable for short-pulse operation; instead, an entirely reflective spatial filter arrangement can be incorporated to minimize dispersion effects[ Reference Chesnut, Bayramian, Erlandson, Galvin, Sistrunk, Spinka and Haefner 76 ]. The now 20-ns, 25-kJ chirped-beam pulse travels through the six-grating compressor, split into 36 identical copies by a dispersion balanced beam splitter arrangement to 36 distributed final grating pairs, and emerges as 36, 18.5-cm by 37-cm aperture beamlets each with approximately 556 J of energy compressed down to a 100-fs FWHM FTL pulse duration for a total power of 0.2 EW. The beamlets are phased together using a multi-mirror focusing array; both a tiled parabolic focusing mirror, similar to those used by large-aperture telescopes[ Reference Trumper, Hallibert, Arenberg, Kunieda, Guyon, Stahl and Kim 59 ], and a dipole focusing system[ Reference Gonoskov, Bashinov, Gonoskov, Harvey, Ilderton, Kim, Marklund, Mourou and Sergeev 56 ] have been discussed. The former, shown here, can focus to 1025 W/cm2, while the latter has been previously simulated with a 0.2-EW laser to achieve 1026 W/cm2[ Reference Gonoskov, Bashinov, Gonoskov, Harvey, Ilderton, Kim, Marklund, Mourou and Sergeev 56 ]. This is, respectively, two and three orders of magnitude greater than the current world record. This focused intensity would push ultra-high-intensity lasers into the ultra-relativistic optics regime[ Reference Mourou 77 ], and well within the quantum electrodynamics (QED) plasma regime[ Reference Qu and Fisch 78 ].
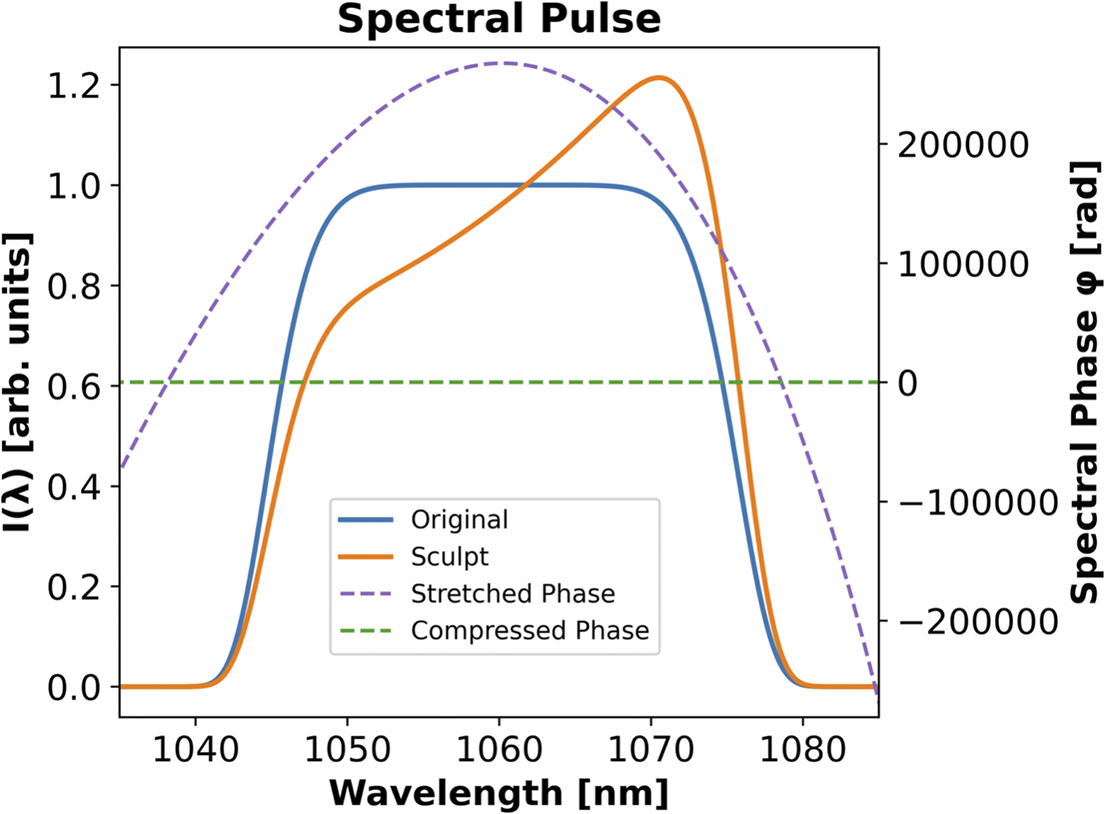
For Nexawatt, we consider a pulse spectrum with an eighth-order super-Gaussian envelope to avoid clipping on the gratings or amplifier, centered at 1060 nm with 30.2-nm full width at half maximum (FWHM) – this will produce a 100-fs FWHM transform-limited sinc2-like temporal pulse. The spectral cutoff points, to handle the finite width of the grating, are defined as the spectral components with 1% of the peak spectral power. This results in a red-most wavelength of 1078 nm and a blue-most wavelength of 1042 nm. Clipping the spectrum here has minimal effect on the temporal pulse shape. The spectral pulse is shown in Figure 6. Spatially, the input beam to the six-grating compressor is a rectilinear eighth-order super-Gaussian with a width and height of 37 cm × 37 cm, at 1% peak fluence, as found on most large-aperture Nd:glass lasers[
Reference Haynam, Wegner, Auerbach, Bowers, Dixit, Erbert, Heestand, Henesian, Hermann, Jancaitis, Manes, Marshall, Mehta, Menapace, Moses, Murray, Nostrand, Orth, Patterson, Sacks, Shaw, Spaeth, Sutton, Williams, Widmayer, White, Yang and Van Wonterghem
46
]. At the entrance of the compressor the beam has a spatial chirp of two that has been generated by an upstream grating pair. This spatial chirp distributes the spectral components across the transverse dimension, the x-position, of the beam as dictated by the grating equation, which follows a decidedly nonlinear distribution. This generates a larger spatial dispersion, ${\zeta \equiv \mathrm{d}{x}_0/\mathrm{d}\omega}$
, where
${\zeta \equiv \mathrm{d}{x}_0/\mathrm{d}\omega}$
, where ${x}_0$
is the center x-position of the frequency component
${x}_0$
is the center x-position of the frequency component $\omega$
, for the red end of the spectrum compared to the blue end of the spectrum[
Reference Nelson, Chesnut, Reutershan, Effarah, Charbonnet and Barty
79
]. At the output of the six-grating compressor the spatial chirp has been undone and the beam emerges with a width and height of 18.5 cm × 37 cm, respectively.
$\omega$
, for the red end of the spectrum compared to the blue end of the spectrum[
Reference Nelson, Chesnut, Reutershan, Effarah, Charbonnet and Barty
79
]. At the output of the six-grating compressor the spatial chirp has been undone and the beam emerges with a width and height of 18.5 cm × 37 cm, respectively.
Power spectrum of the original super-Gaussian pulse as well as the sculpted pulse that counteracts the asymmetry of the spatio-temporal pulse that arises from the large TOD of the ideal stretched pulse. The spectral phase of the stretched pulse and compressed pulse is shown as well.
Original super-Gaussian spectral pulse with ideal (a) spatio-spectral and (b) spatio-temporal input to the six-grating compressor. (c) Log intensity of the FTL temporal pulse of both the original and sculpted spectra. (d) Spatial distribution of the peak intensity across the transverse position of the beam for both the original and sculpted spectra.
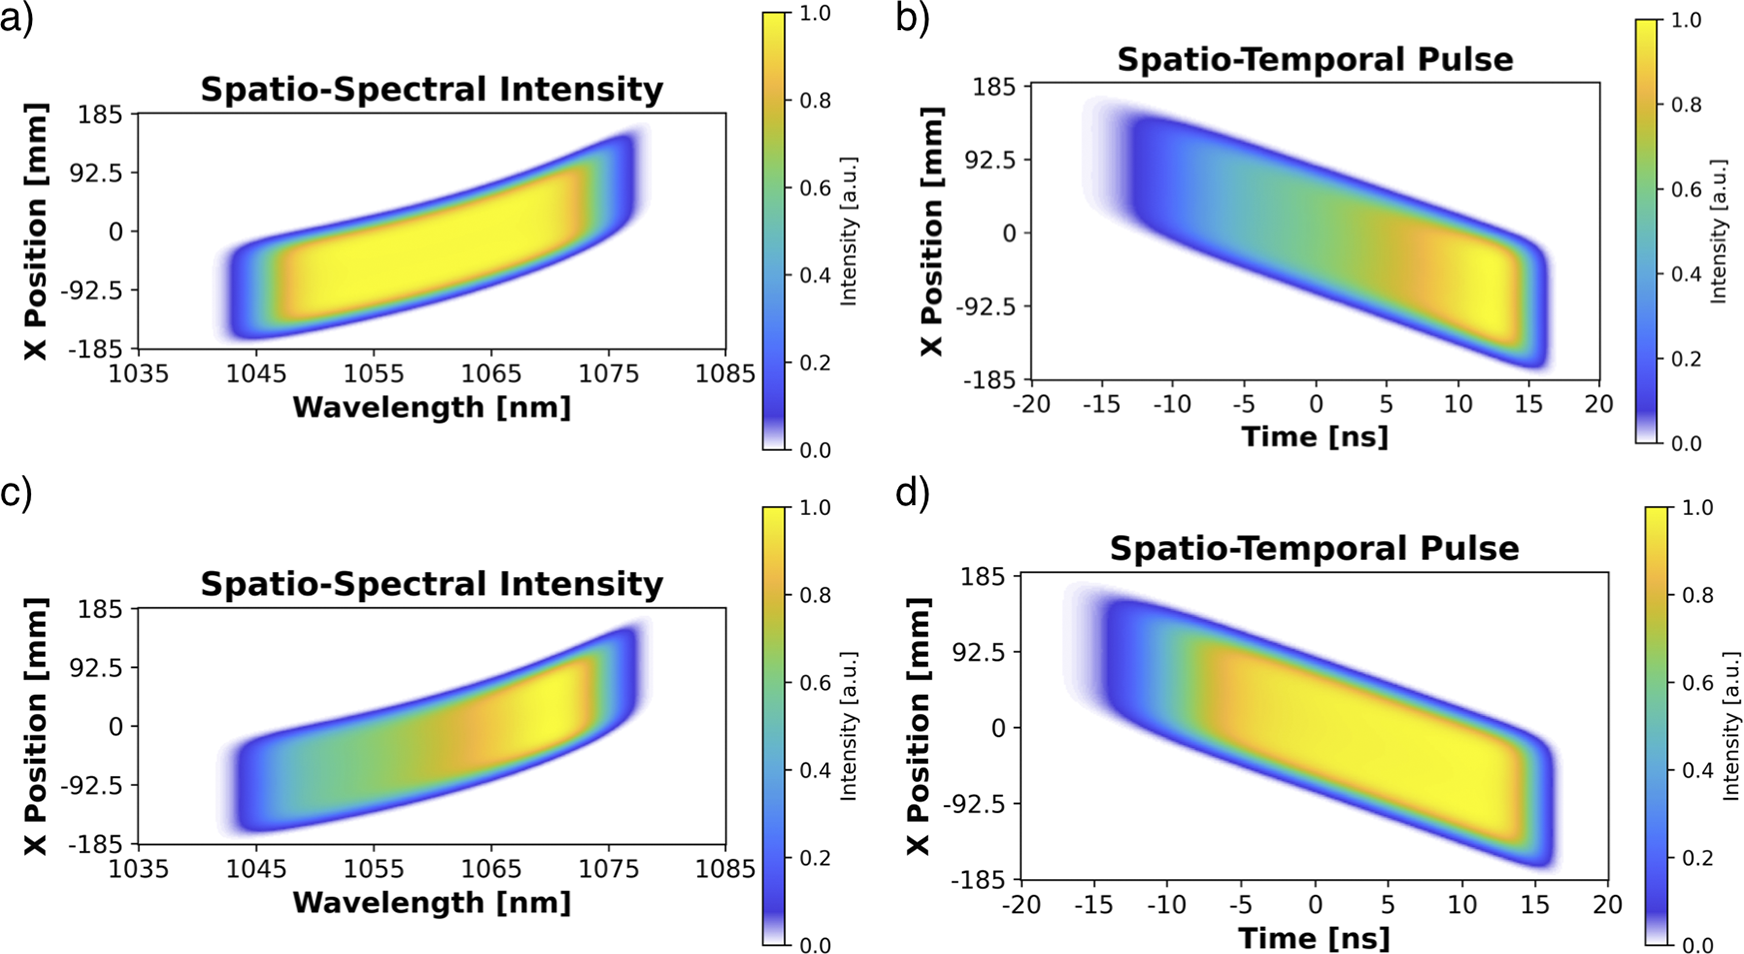
Most of the modeling presented in this paper has been done by taking the desired sub-system output and propagating it backwards in time through the sub-system optical components, which gives the appropriate sub-system input. In our previous detailing of the six-grating compressor arrangement for Nexawatt[ Reference Chesnut and Barty 63 ], the optimal spatio-spectral and spatio-temporal chirped-beam pulse distribution that can be compressed by this chirped-beam compressor arrangement was determined by back-propagating the desired final output pulse through the six-grating compressor using the ray trace software VirtualLab[ 80 ]. An analysis plane after G1, the input to the six-grating compressor, collects the spatio-spectral intensity distribution, Figures 7(a) and 7(c), and spectral phase, Figure 6. A post-processing script in Python[ Reference Van Rossum and Drake 81 ] iterates through the spatial positions of the beam performing a Fourier transform on each spectral cross-section to produce the spatio-temporal intensity map seen in Figures 7(b) and 7(d). Webb et al. [ Reference Webb, Guardalben, Dorrer, Bucht and Bromage 82 ] used a similar technique to simulate the effects of compressor grating misalignments on CPA systems. The temporal asymmetry seen in the spatio-temporal distribution is caused by the large amount of third-order dispersion (TOD) that is a consequence of any high-dispersion, grating-based stretcher–compressor system with this magnitude of temporal chirp. This spatial variation of the temporal intensity is not ideal for amplification as the highest intensity portion of the beam will accumulate the most B-integral and limit the amount of total energy that can be extracted. To homogenize the intensity distribution, and by extending the B-integral contribution, the spectrum can be red-shifted, as shown in Figures 6 and 7(c). This distributes more energy content to the earlier time positions in the stretched spatio-temporal pulse that travels through the amplifier, resulting in a flatter peak intensity distribution, Figure 7(d), while maintaining the same FTL pulse duration after compression.
4 Multi-pass regenerative stretcher
To safely extract the full stored approximately 26 kJ of energy from a single NIF PA requires a stretched pulse with duration greater than 20 ns[ Reference Haynam, Wegner, Auerbach, Bowers, Dixit, Erbert, Heestand, Henesian, Hermann, Jancaitis, Manes, Marshall, Mehta, Menapace, Moses, Murray, Nostrand, Orth, Patterson, Sacks, Shaw, Spaeth, Sutton, Williams, Widmayer, White, Yang and Van Wonterghem 46 ]. In practice, this stretch factor is difficult to achieve on few-pass stretchers as a nanosecond difference in group delay requires nanosecond size optics, which are meter-scale. Stretcher optics have stringent quality requirements, such as radius of curvature, surface flatness, roughness and so forth, to avoid wavefront aberrations propagating through the amplifier chain and maintain a high level of temporal intensity contrast. These two factors combined present a large engineering and financial challenge. Instead, by inducing only a small amount of GDD per pass and performing a high number of passes until the desired GDD is acquired, one can use reasonably sized optics. However, losses from the gratings, as well as other optics, will compound on each pass. Having sub-nJ pulses after stretching places considerable burden on the downstream OPCPA amplifier. By placing the stretcher inside the cavity of a regenerative amplifier one can create a high-pass stretcher that maintains, or amplifies, the pulse energy.
The major requirements of the regenerative stretcher for the Nexawatt system are to produce a stretched pulse of at least 20 ns, have a dispersion profile that is the conjugate of the compressor and total system material dispersion and minimize the creation of pre- and post-pulses that can propagate through the system, degrading the final temporal contrast. To date, two intracavity stretcher designs have been published. In 2017, Liebetrau et al. [ Reference Liebetrau, Hornung, Keppler, Hellwing, Kessler, Schorcht, Hein and Kaluza 83 ] published an intracavity Offner-type stretcher producing a 3.9-ns, 100-μJ stretched pulse. However, the line focus produced on a secondary telescope mirror of the stretcher, inherent to any Offner-type stretcher, limited the pulse energy to avoid optical damage and led to degraded temporal intensity contrast in the ps-pedestal. At the convex mirror the beam is spatially chirped and focused to a small size, which imparts a spectral phase noise on the pulse due to mirror imperfections and manifests as a ps-scale slow-rising edge on the pulse[ Reference Lu, Zhang, Li and Leng 84 , Reference Roeder, Zobus, Brabetz and Bagnoud 85 ]. In 2019, Su et al. [ Reference Su, Peng, Li, Lu, Chen, Wang, Lv, Shao and Leng 86 ] presented an intracavity Martinez-type stretcher demonstrating 10-ns, 5-mJ stretched pulses. This design utilized a simple hemispherical cavity that is susceptible to pulse overlap in the gain media. Pulse overlap creates a spectral interference leading to a modulation of the pulse phase and intensity generating a pre-pulse after compression[ Reference Didenko, Konyashchenko, Lutsenko and Tenyakov 87 , Reference Kiriyama, Miyasaka, Sagisaka, Ogura, Nishiuchi, Pirozhkov, Fukuda, Kando and Kondo 88 ]. The regenerative stretcher presented here, shown in Figure 8, uses a Martinez stretcher inside an optical cavity that places the gain media in a unidirectional, single-pass ring to better isolate it from pulse overlap and reduce the mode size in the crystal for more efficient pumping.
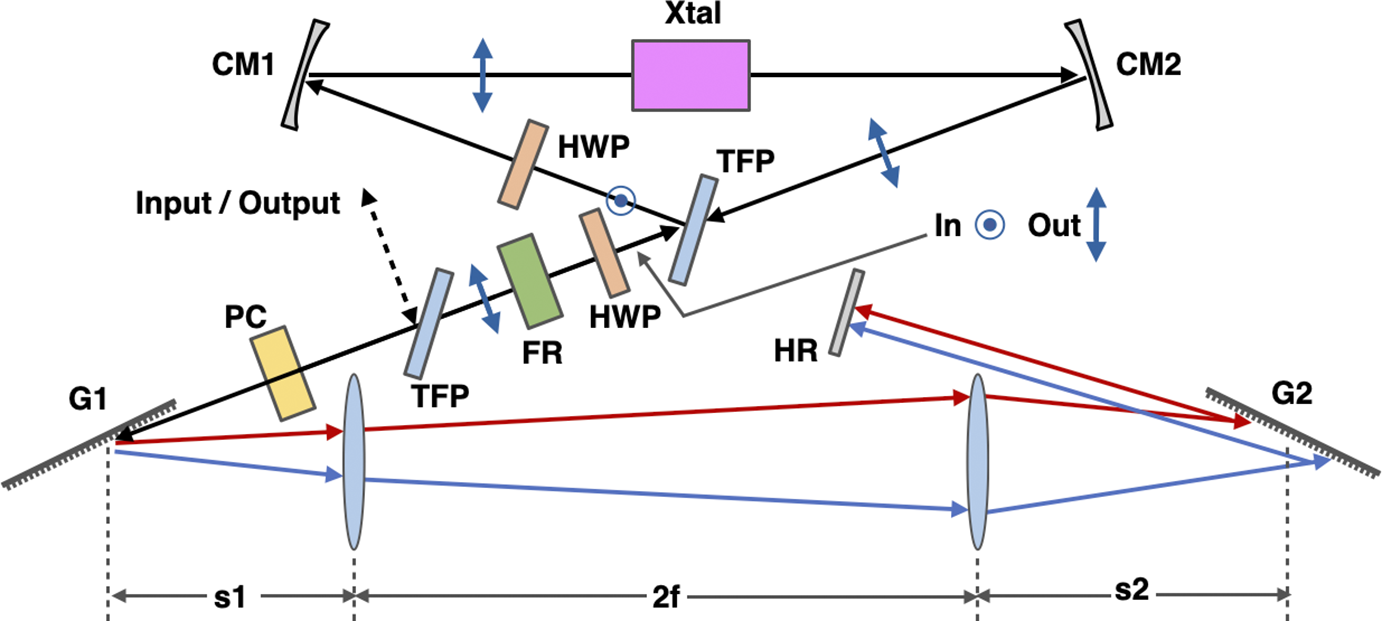
Schematic of the regenerative stretcher. The polarization state of the beam as it transverses the ring is denoted by the vector symbols.
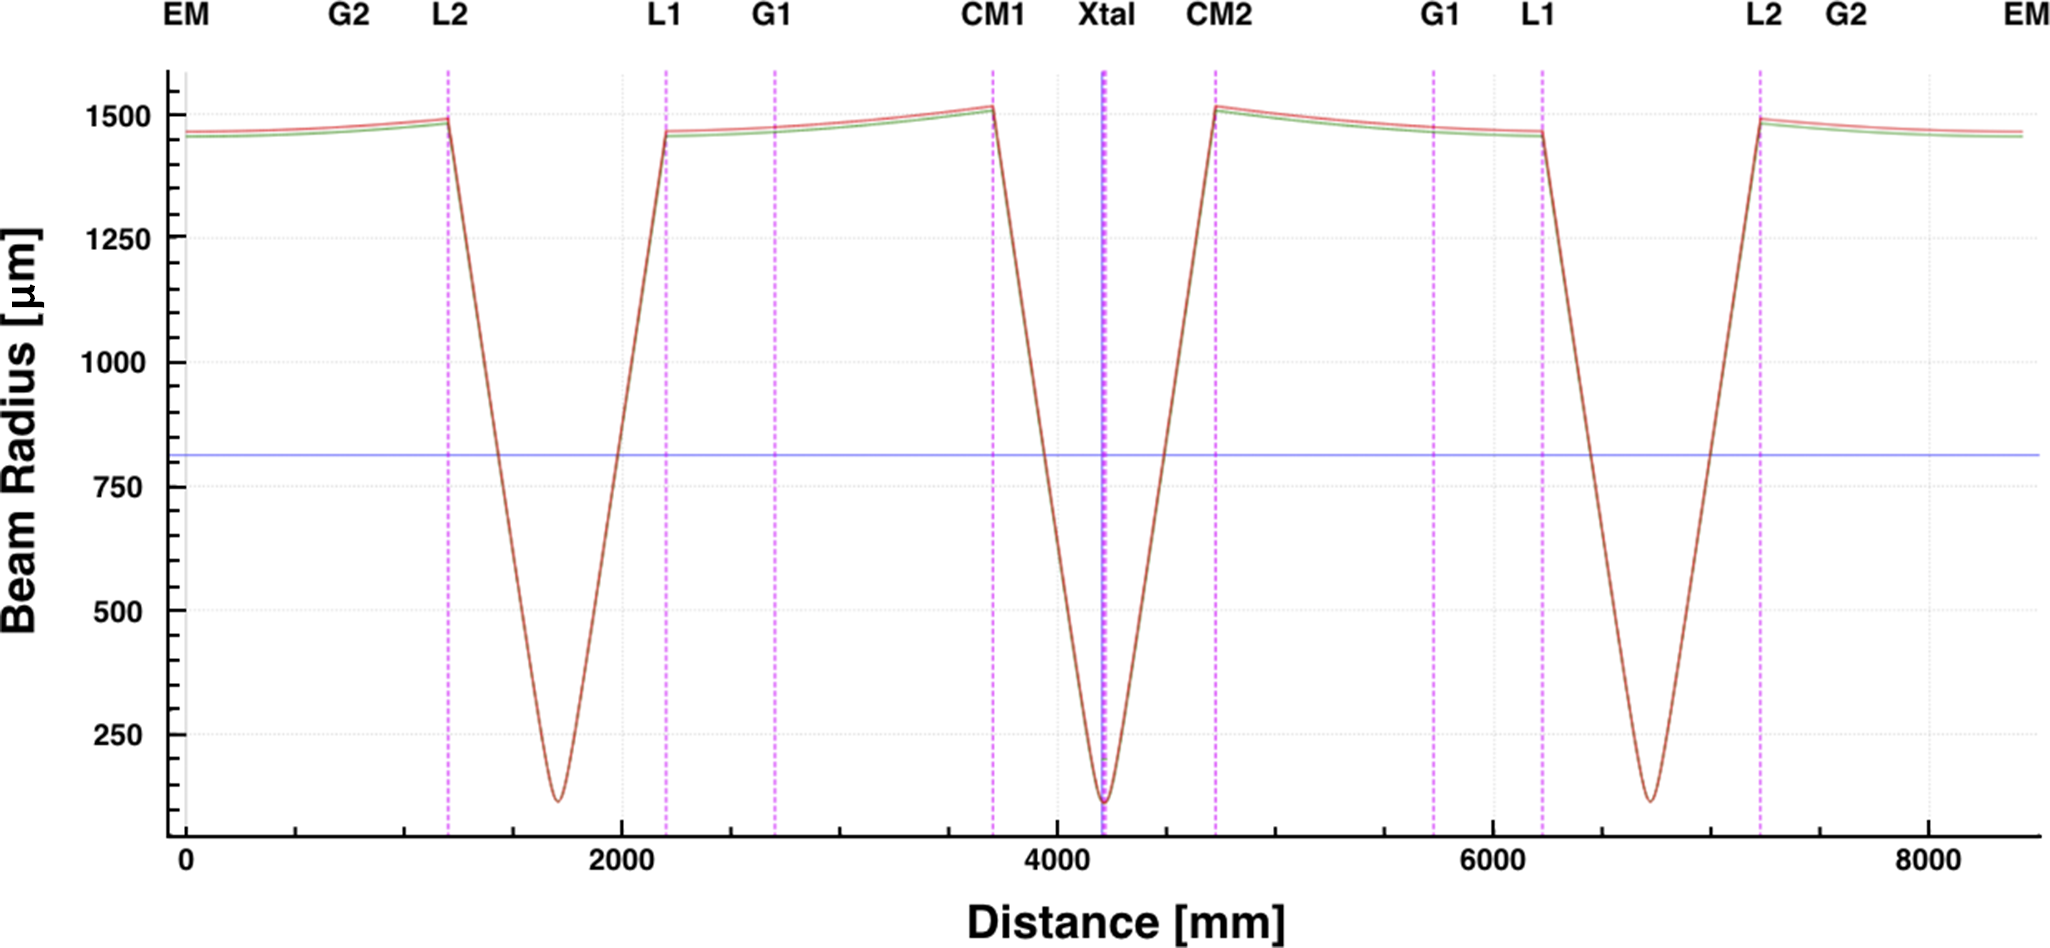
Beam caustic in the tangential plane of the cavity mode supported by the regenerative stretcher using the physical parameters discussed in this section.
The pulse is coupled into, and out of, the regenerative stretcher by a thin-film polarizer (TFP) and a Pockels cell (PC) where it then travels through a Martinez stretcher. After double passing the stretcher, the pulse polarization is rotated from p-polarization to s-polarization by a Faraday rotator (FR) and a half-wave plate (HWP) to be reflected by a second TFP. Once reflected, the pulse is rotated back to p-polarization by an HWP so it can pass lossless through a Brewster cut Ti:sapphire crystal (Xtal) and back through the TFP. In this unidirectional single-pass ring, a one-to-one Keplerian telescope, formed by two 500-mm focal length concave mirrors (CMs) at 4-degree AOI for astigmatism compensation in the 12-mm long Brewster cut crystal, focuses the pulse for amplification. The Martinez stretcher must have a length greater than 3 m, for a double-pass length of 6 m, to fully contain the 20-ns stretched pulse on one side of the PC. In this paper we have used 500-mm achromat lenses as the focusing elements in the Martinez stretcher for simplicity of the cavity design and dispersion analysis; however, in practice the stretcher should be built with concave, circular mirrors to avoid the aberrations that come with the use of lenses[ Reference Lemoff and Barty 89 ]. Starting from the flat high-reflectivity (HR) mirror in the spectrally dispersed arm of the stretcher, a full round-trip in the cavity, shown in Figure 8, will double-pass the stretcher while passing through the gain element only once.
This regenerative stretcher cavity is essentially a four-mirror x-fold cavity where the two arms have been combined into one and only a single pass of the gain medium per round-trip. The total round-trip ABCD ray transfer matrix of the regenerative stretcher determines the stability limits of the cavity. We define the distance from the end mirror (HR) to the second grating (G2) as ${d}_1$
, the distance from the first grating (G1) to either curved mirror (CM1/2) as
${d}_1$
, the distance from the first grating (G1) to either curved mirror (CM1/2) as ${d}_2$
and the length of the Martinez stretcher,
${d}_2$
and the length of the Martinez stretcher, $2f-{s}_1-{s}_2$
, as
$2f-{s}_1-{s}_2$
, as ${L}_\mathrm{str}$
. Starting at the flat end mirror (HR), and breaking the cavity into the stretcher arm and the crystal ring, the total round-trip ABCD matrix is as follows:
${L}_\mathrm{str}$
. Starting at the flat end mirror (HR), and breaking the cavity into the stretcher arm and the crystal ring, the total round-trip ABCD matrix is as follows:
 $$\begin{align}{\mathbf{M}}_\mathrm{Total}&={\mathbf{M}}_\mathrm{arm}{\mathbf{M}}_\mathrm{xtal}{\mathbf{M}}_\mathrm{arm}, \end{align}$$
 $$\begin{align}{\mathbf{M}}_\mathrm{arm}&=\left[\begin{array}{cc}-1& {L}_\mathrm{str}-{d}_1-{d}_2\\ {}0& -1\end{array}\right],\end{align}$$
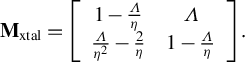 $$\begin{align}{\mathbf{M}}_\mathrm{xtal}&=\left[\begin{array}{cc}1-\frac{\varLambda }{\eta }& \varLambda \\ {}\frac{\varLambda }{\eta^2}-\frac{2}{\eta }& 1-\frac{\varLambda }{\eta}\end{array}\right].\end{align}$$
Here, both $\varLambda$
and
$\varLambda$
and $\eta$
have a different form in the tangential and sagittal planes. Namely,
$\eta$
have a different form in the tangential and sagittal planes. Namely,
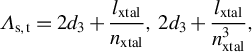 $$\begin{align}{\varLambda}_{\mathrm{s,t}}&=2{d}_3+\frac{l_\mathrm{xtal}}{n_\mathrm{xtal}},\ 2{d}_3+\frac{l_\mathrm{xtal}}{n_\mathrm{xtal}^3},\end{align}$$
 $$\begin{align}{\eta}_{\mathrm{s,t}}&=\frac{R}{2\cos \theta },\ \frac{R\cos \theta }{2},\end{align}$$
where ${l}_\mathrm{xtal}$
is the length of the crystal,
${l}_\mathrm{xtal}$
is the length of the crystal, ${n}_\mathrm{xtal}$
is the crystal index of refraction,
${n}_\mathrm{xtal}$
is the crystal index of refraction, ${d}_3$
is the distance from the curved mirror to the crystal face,
${d}_3$
is the distance from the curved mirror to the crystal face, $R$
is the curved mirror’s radius of curvature and
$R$
is the curved mirror’s radius of curvature and $\theta$
is the AOI on the curved mirror. Like the four-mirror oscillator, the stability of the cavity and collimation of the cavity mode in the stretcher arm can be obtained by tuning the separation of the two curved mirrors. Defining
$\theta$
is the AOI on the curved mirror. Like the four-mirror oscillator, the stability of the cavity and collimation of the cavity mode in the stretcher arm can be obtained by tuning the separation of the two curved mirrors. Defining ${\varLambda =2\eta +\delta}$
, the cavity stability can be defined in terms of a detuning parameter,
${\varLambda =2\eta +\delta}$
, the cavity stability can be defined in terms of a detuning parameter, $\delta$
, from a perfect telescope:
$\delta$
, from a perfect telescope:
 $$\begin{align}0\le \delta \left(\frac{1}{\eta }-\frac{L_\mathrm{str}-{d}_1-{d}_2}{\eta^2}\right)\le 2.\end{align}$$
The cavity is stable when the detuning parameter is zero, and for many small values of $\delta$
as long as
$\delta$
as long as $\left({L}_\mathrm{str}-{d}_1-{d}_2\right)/\eta \le 1$
. This is better viewed by recasting the cavity stability in terms of the distances
$\left({L}_\mathrm{str}-{d}_1-{d}_2\right)/\eta \le 1$
. This is better viewed by recasting the cavity stability in terms of the distances ${d}_1$
and
${d}_1$
and ${d}_2$
allowed for some given detuning parameter and stretcher length:
${d}_2$
allowed for some given detuning parameter and stretcher length:
 $$\begin{align}{L}_\mathrm{str}-\eta \le {d}_1+{d}_2\le \left({L}_\mathrm{str}-\eta \right)+\frac{2{\eta}^2}{\delta }.\end{align}$$
When $\delta$
is small, this cavity design supports a wide range of mirror spacings
$\delta$
is small, this cavity design supports a wide range of mirror spacings ${d}_1$
and
${d}_1$
and ${d}_2$
, making it relatively insensitive to changes in these mirror spacings. In the design presented here,
${d}_2$
, making it relatively insensitive to changes in these mirror spacings. In the design presented here, ${d}_1$
is 764.5 mm,
${d}_1$
is 764.5 mm, ${s}_1$
and
${s}_1$
and ${s}_2$
equal 435.5 mm,
${s}_2$
equal 435.5 mm, ${d}_2$
is 1064.5 mm and the detuning parameter
${d}_2$
is 1064.5 mm and the detuning parameter $\delta$
is approximately 14.4 mm in the sagittal plane and approximately 14.7 mm in the tangential plane. This equates to a cavity stability parameter of approximately 0.126 in the sagittal plane and approximately 0.130 in the tangential plane. The cavity caustic for the particular spacing and geometry described here is shown in Figure 9.
$\delta$
is approximately 14.4 mm in the sagittal plane and approximately 14.7 mm in the tangential plane. This equates to a cavity stability parameter of approximately 0.126 in the sagittal plane and approximately 0.130 in the tangential plane. The cavity caustic for the particular spacing and geometry described here is shown in Figure 9.
Here, the stretcher is designed to generate approximately 1 ns of stretch on the temporal pulse per round-trip pass. The transmissive optics in a NIF-like beamline, along with the intracavity optical elements of the regenerative stretcher, impart additional material dispersion that cannot be compensated by an identical stretcher–compressor pair. This can largely be accounted for by modifying the groove density and AOI of the stretcher gratings[ Reference Lemoff and Barty 89 , Reference Kane and Squier 90 ]. Table 1 lists the GDD and TOD contributions of each element in the regenerative stretcher, the six-grating CPJBA compressor and the reported material dispersion of a NIF beamline[ Reference Williams, Crane, Alessi, Boley, Bowers, Conder, Di Nicola, Di Nicola, Haefner, Halpin, Hamamoto, Heebner, Hermann, Herriot, Homoelle, Kalantar, Lanier, LaFortune, Lawson, Lowe-Webb, Morrissey, Nguyen, Orth, Pelz, Prantil, Rushford, Sacks, Salmon, Seppala, Shaw, Sigurdsson, Wegner, Widmayer, Yang and Zobrist 91 ]. Furthermore, the 2× spatial chirp required for CPJBA is created by a parallel grating pair with the same design as the final compressor gratings, 1780-line/mm groove density and 76.5-degree AOI, after the regenerative stretcher. The additional negative dispersion created by the grating pair can be compensated by over stretching the pulse. A parameter scan was performed on the regenerative stretcher grating groove density and AOI to determine the optimal configuration that balances all GDD in the system while minimizing the TOD contribution. This first-pass optimization suggests the use of 1760-line/mm groove density gratings at a 71.85-degree AOI, which allows for full GDD compensation of the system with a residual TOD of –4.94 × 10⁵ fs3. This residual TOD would broaden the final 100-fs TFL output pulse to 102.6 fs. A breakdown of the GDD and TOD contributions of the various components of the Nexawatt laser chain is shown in Table 1. Through further optimization of the regenerative stretcher, such as modifications to the spherical mirrors in the stretcher[ Reference Lemoff and Barty 89 ], one can fully compensate the residual TOD; however, that analysis is beyond the scope of the paper as it requires accurate knowledge of the full system design. Using 500-mm focal length achromat lenses, the 2f−2s length in this stretcher design is 129.8 mm, and with the above grating configuration generates the appropriate GDD to stretch the pulse to 20 ns after 20 round-trip passes.
Tabulation of the GDD and TOD contribution of the regenerative stretcher intracavity components and the rest of the Nexawatt laser chain for the full system dispersiona.
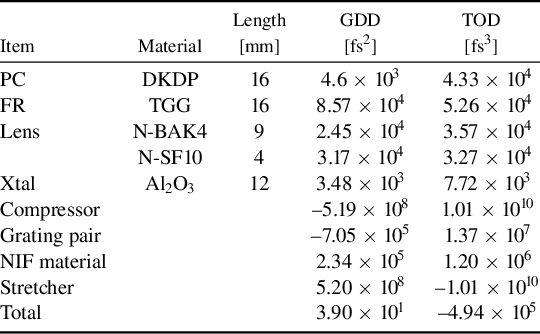
aDKDP, deuterated potassium dihydrogen phosphate; TGG, terbium gallium garnet; N-BAK4, Schott light barium crown glass; N-SF10, Schott dense flint glass.
5 Chirped pulse juxtaposed with beam amplification energetics
5.1 Energetics modeling
CPJBA is unique in its amplification of a highly temporally stretched, spatially chirped beam. An amplification model capable of handling a custom spatio-temporal field was developed to demonstrate these effects. The amplification model is based on a numerical implementation of the Frantz–Nodvik solution, which describes the gain dynamics of a square-shaped temporal pulse in an amplifier[
Reference Frantz and Nodvik
92
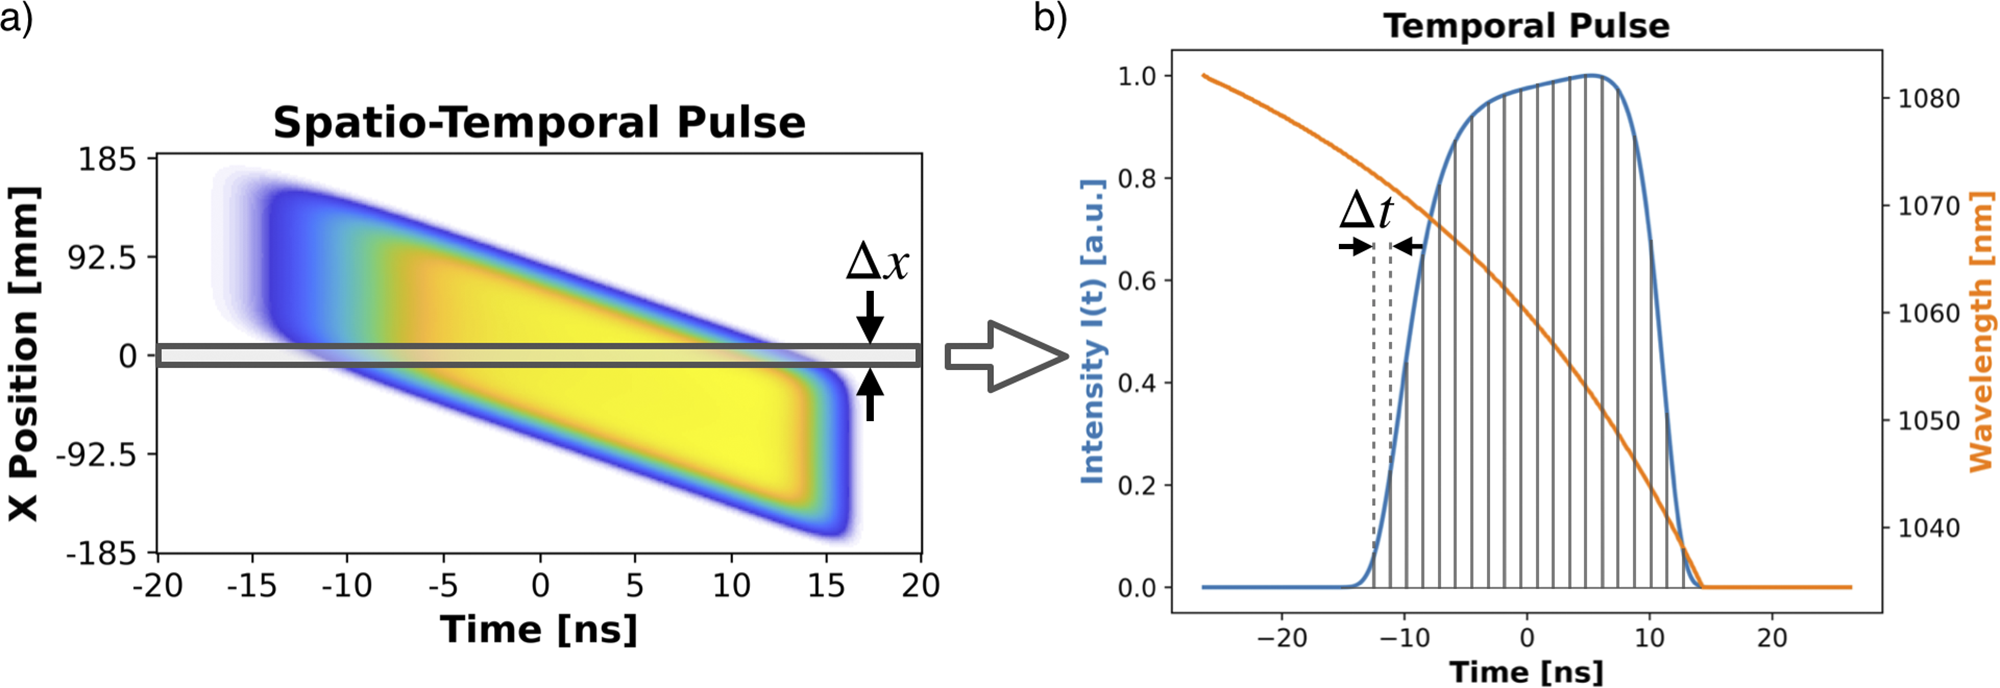
]. This solution is extended to temporal pulses of arbitrary shape by modeling them as a collection of discrete square pulses of width $\Delta t$
and varying amplitude[
Reference Jeong, Cho, Hwang, Lee and Yu
93
]. The square pulses are treated consecutively by the Frantz–Nodvik solution, Equation (11), with each modifying the remaining population inversion and, thus, the gain that the subsequent experiences, Equation (12). The high temporal stretch factor means each unit of time in the pulse corresponds to a different wavelength with a different emission cross-section in Nd:APG-1. Thus, each of our square pulses in time will have different small-signal gain and gain saturation. The group delay of each wavelength is calculated from the spectral phase of the pulse that is compressed by the six-grating compressor. This correlates each of the discrete square temporal pulses with the correct spectral wavelength. Due to the spatial chirp the gain effects need to be considered transversely across the beam as well. This is done by breaking the beam and amplifier medium into a transverse grid, with spacing
$\Delta t$
and varying amplitude[
Reference Jeong, Cho, Hwang, Lee and Yu
93
]. The square pulses are treated consecutively by the Frantz–Nodvik solution, Equation (11), with each modifying the remaining population inversion and, thus, the gain that the subsequent experiences, Equation (12). The high temporal stretch factor means each unit of time in the pulse corresponds to a different wavelength with a different emission cross-section in Nd:APG-1. Thus, each of our square pulses in time will have different small-signal gain and gain saturation. The group delay of each wavelength is calculated from the spectral phase of the pulse that is compressed by the six-grating compressor. This correlates each of the discrete square temporal pulses with the correct spectral wavelength. Due to the spatial chirp the gain effects need to be considered transversely across the beam as well. This is done by breaking the beam and amplifier medium into a transverse grid, with spacing $\Delta x$
, and recording the beam energy and population inversion along this coordinate.
$\Delta x$
, and recording the beam energy and population inversion along this coordinate.
The amplification model is initialized by defining the transverse spatial distribution of the stored energy in the amplifier, which sets the starting population inversion at each spatial location ${x}_i$
. The script iterates over each of these spatial points, taking the temporal cross-section at that location and breaking the temporal pulse into a sequence of square pulses, as shown in Figure 10, where they are consecutively amplified according to the Frantz–Nodvik solution. With this, our coupled gain and population inversion equations are as follows:
${x}_i$
. The script iterates over each of these spatial points, taking the temporal cross-section at that location and breaking the temporal pulse into a sequence of square pulses, as shown in Figure 10, where they are consecutively amplified according to the Frantz–Nodvik solution. With this, our coupled gain and population inversion equations are as follows:
 $$\begin{align}{E}_\mathrm{out}\left({x}_i,{t}_n\right)={E}_\mathrm{in}\left({x}_i,{t}_n\right)G\left({x}_i,{t}_n\right),\end{align}$$
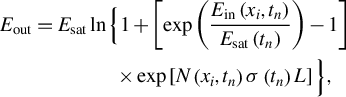 $$\begin{align}{E}_\mathrm{out}&={E}_\mathrm{sat}\ln \Big\{1+\left[\exp \left(\frac{E_\mathrm{in}\left({x}_i,{t}_n\right)}{E_\mathrm{sat}\left({t}_n\right)}\right)-1\right]\nonumber\\&\qquad\qquad \times\exp \left[N\left({x}_i,{t}_n\right)\sigma \left({t}_n\right)L\right]\Big\},\end{align}$$
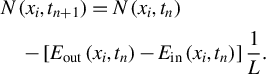 $$\begin{align}&N\left({x}_i,{t}_{n+1}\right)=N\left({x}_i,{t}_n\right)\nonumber\\ & \quad -\left[{E}_\mathrm{out}\left({x}_i,{t}_n\right)-{E}_\mathrm{in}\left({x}_i,{t}_n\right)\right]\frac{1}{L}.\end{align}$$
(a) Input spatio-temporal intensity distribution to the amplification code that iterates over the spatial distribution with discretized segments of width $\Delta x$
, which produce (b) temporal cross-sections that are modeled as a collection of square temporal pulses, of width
$\Delta x$
, which produce (b) temporal cross-sections that are modeled as a collection of square temporal pulses, of width $\Delta t$
, to be treated by the Frantz–Nodvik solution.
$\Delta t$
, to be treated by the Frantz–Nodvik solution.
Here, ${E}_{\mathrm{out}}$
(
${E}_{\mathrm{out}}$
( ${x}_i$
,
${x}_i$
, ${t}_n$
) and
${t}_n$
) and ${E}_{\mathrm{in}}$
(
${E}_{\mathrm{in}}$
( ${x}_i$
,
${x}_i$
, ${t}_n$
) are the beam output and input energy, respectively,
${t}_n$
) are the beam output and input energy, respectively, ${E}_{\mathrm{sat}}$
(
${E}_{\mathrm{sat}}$
( ${t}_n$
) is the saturation fluence of the pulse, N(
${t}_n$
) is the saturation fluence of the pulse, N( ${x}_i$
,
${x}_i$
, ${t}_n$
) is the population inversion,
${t}_n$
) is the population inversion, $\sigma$
(
$\sigma$
( ${t}_n$
) is the emission cross-section and L is the length of the amplifier. In our simplified model we ignore ASE, transient pumping effects, thermal gain effects and phase distortion from the atomic phase shift in the amplifier. Our spatio-temporal simulation grid is broken into 200 spatial points, of
${t}_n$
) is the emission cross-section and L is the length of the amplifier. In our simplified model we ignore ASE, transient pumping effects, thermal gain effects and phase distortion from the atomic phase shift in the amplifier. Our spatio-temporal simulation grid is broken into 200 spatial points, of $\Delta x$
width of approximately 1.89 mm, and 500 temporal points of
$\Delta x$
width of approximately 1.89 mm, and 500 temporal points of $\Delta t$
width of approximately 0.11 ns. To calculate the B-integral, defined in Equation (13), the total length, L, of the amplifier is divided into sections
$\Delta t$
width of approximately 0.11 ns. To calculate the B-integral, defined in Equation (13), the total length, L, of the amplifier is divided into sections $\Delta z$
of length 10 mm. At each section
$\Delta z$
of length 10 mm. At each section $\Delta z$
of the amplifier the local peak intensity is used to generate that segments contribution to the B-integral:
$\Delta z$
of the amplifier the local peak intensity is used to generate that segments contribution to the B-integral:
 $$\begin{align}B=\frac{2\pi }{\lambda }{n}_2{\int}_0^{L}I(z)\kern0.1em \mathrm{d}z=\frac{2\pi }{\lambda }{n}_2\sum \limits_{z=0}^{z=n}{I}_{\mathrm{peak},z}\Delta z.\end{align}$$
As described in Section 2, the output pulse spectrum is an eighth-order super-Gaussian envelope, to avoid clipping on the gratings or amplifier, centered at 1060 nm with 30.2-nm FWHM – this will produce a 100-fs FWHM transform-limited sinc2 temporal pulse. Spatially, each beamlet emerging from the six-grating compressor is a rectilinear, eighth-order super-Gaussian with a width of 18.5 cm and height of 37 cm. A 2× spatial chirp, induced prior to the six-grating compressor and amplifier, produces a 37-cm × 37-cm beam, which is comparable to the aperture size of most high-energy Nd:glass lasers[ Reference Neauport, Airiau, Beck, Belon, Bordenave, Bouillet, Chanal, Chappuis, Coic, Courchinoux, Denis, Gaudfrin, Gaudfrin, Gendeau, Heymans, Julien, Lacombe, Lamy, Lebeaux, Luttmann, Modelin, Perrin, Ribeyre, Rouyer, Tournemenne, Valla and Vermersch 47 , Reference Spaeth, Manes, Kalantar, Miller, Heebner, Bliss, Spec, Parham, Whitman, Wegner, Baisden, Menapace, Bowers, Cohen, Suratwala, Di Nicola, Newton, Adams, Trenholme, Finucane, Bonanno, Rardin, Arnold, Dixit, Erbert, Erlandson, Fair, Feigenbaum, Gourdin, Hawley, Honig, House, Jancaitis, LaFortune, Larson, Le Galloudec, Lindl, MacGowan, Marshall, McCandless, McCracken, Montesanti, Moses, Nostrand, Pryatel, Roberts, Rodriguez, Rowe, Sacks, Salmon, Shaw, Sommer, Stolz, Tietbohl, Widmayer and Zacharias 67 ]. The input pulse energy is set to 40 J to match the previous energetics study on high-energy, broadband Nd:mixed-glass amplifiers[ Reference Hays, Gaul, Martinez and Ditmire 51 ]. The amplifier system is modeled after the architecture of a single NIF beamline with a four-passed MA and a double-passed PA – the PA is passed through once before and once after the four passes on the MA[ Reference Spaeth, Manes, Kalantar, Miller, Heebner, Bliss, Spec, Parham, Whitman, Wegner, Baisden, Menapace, Bowers, Cohen, Suratwala, Di Nicola, Newton, Adams, Trenholme, Finucane, Bonanno, Rardin, Arnold, Dixit, Erbert, Erlandson, Fair, Feigenbaum, Gourdin, Hawley, Honig, House, Jancaitis, LaFortune, Larson, Le Galloudec, Lindl, MacGowan, Marshall, McCandless, McCracken, Montesanti, Moses, Nostrand, Pryatel, Roberts, Rodriguez, Rowe, Sacks, Salmon, Shaw, Sommer, Stolz, Tietbohl, Widmayer and Zacharias 67 ]. All slabs are composed of Nd:APG-1, each 4-cm thick with an on-beam aperture of 37 cm × 37 cm and a Nd doping concentration of 4.22 × 10²⁰ ions/cm3 [ Reference Suratwala, Campbell, Miller, Thorsness, Riley, Ehrmann and Steele 94 ]. Pulse amplification depends only on the total stored energy and is agnostic to the total path length in the amplifier insofar as energy is concerned. The total number of slabs will modify the ASE and B-integral[ Reference Haney, Williams, Sacks, Orth, Auerbach, Lawson, Henesian, Jancaitis, Renard and Trenholme 95 , Reference Caird, Agrawal, Bayramian, Beach, Britten, Chen, Cross, Ebbers, Erlandson, Feit, Freitas, Ghosh, Haefner, Homoelle, Ladran, Latkowski, Molander, Murray, Rubenchik, Schaffers, Siders, Stappaerts, Sutton, Telford, Trenholme and Barty 96 ], while not affecting the amplified pulse structure. We initially consider the ‘11-7’ configuration – eleven MA slabs and seven PA slabs[ Reference Spaeth, Manes, Kalantar, Miller, Heebner, Bliss, Spec, Parham, Whitman, Wegner, Baisden, Menapace, Bowers, Cohen, Suratwala, Di Nicola, Newton, Adams, Trenholme, Finucane, Bonanno, Rardin, Arnold, Dixit, Erbert, Erlandson, Fair, Feigenbaum, Gourdin, Hawley, Honig, House, Jancaitis, LaFortune, Larson, Le Galloudec, Lindl, MacGowan, Marshall, McCandless, McCracken, Montesanti, Moses, Nostrand, Pryatel, Roberts, Rodriguez, Rowe, Sacks, Salmon, Shaw, Sommer, Stolz, Tietbohl, Widmayer and Zacharias 67 ]. In the amplifier, the pulse will travel through a spatial filter after the first passes in the PA, after the first and second passes in the MA, again after the third and fourth passes in the MA, then once again after the second PA pass[ Reference Spaeth, Manes, Kalantar, Miller, Heebner, Bliss, Spec, Parham, Whitman, Wegner, Baisden, Menapace, Bowers, Cohen, Suratwala, Di Nicola, Newton, Adams, Trenholme, Finucane, Bonanno, Rardin, Arnold, Dixit, Erbert, Erlandson, Fair, Feigenbaum, Gourdin, Hawley, Honig, House, Jancaitis, LaFortune, Larson, Le Galloudec, Lindl, MacGowan, Marshall, McCandless, McCracken, Montesanti, Moses, Nostrand, Pryatel, Roberts, Rodriguez, Rowe, Sacks, Salmon, Shaw, Sommer, Stolz, Tietbohl, Widmayer and Zacharias 67 ].
5.2 CPJBA amplification effects
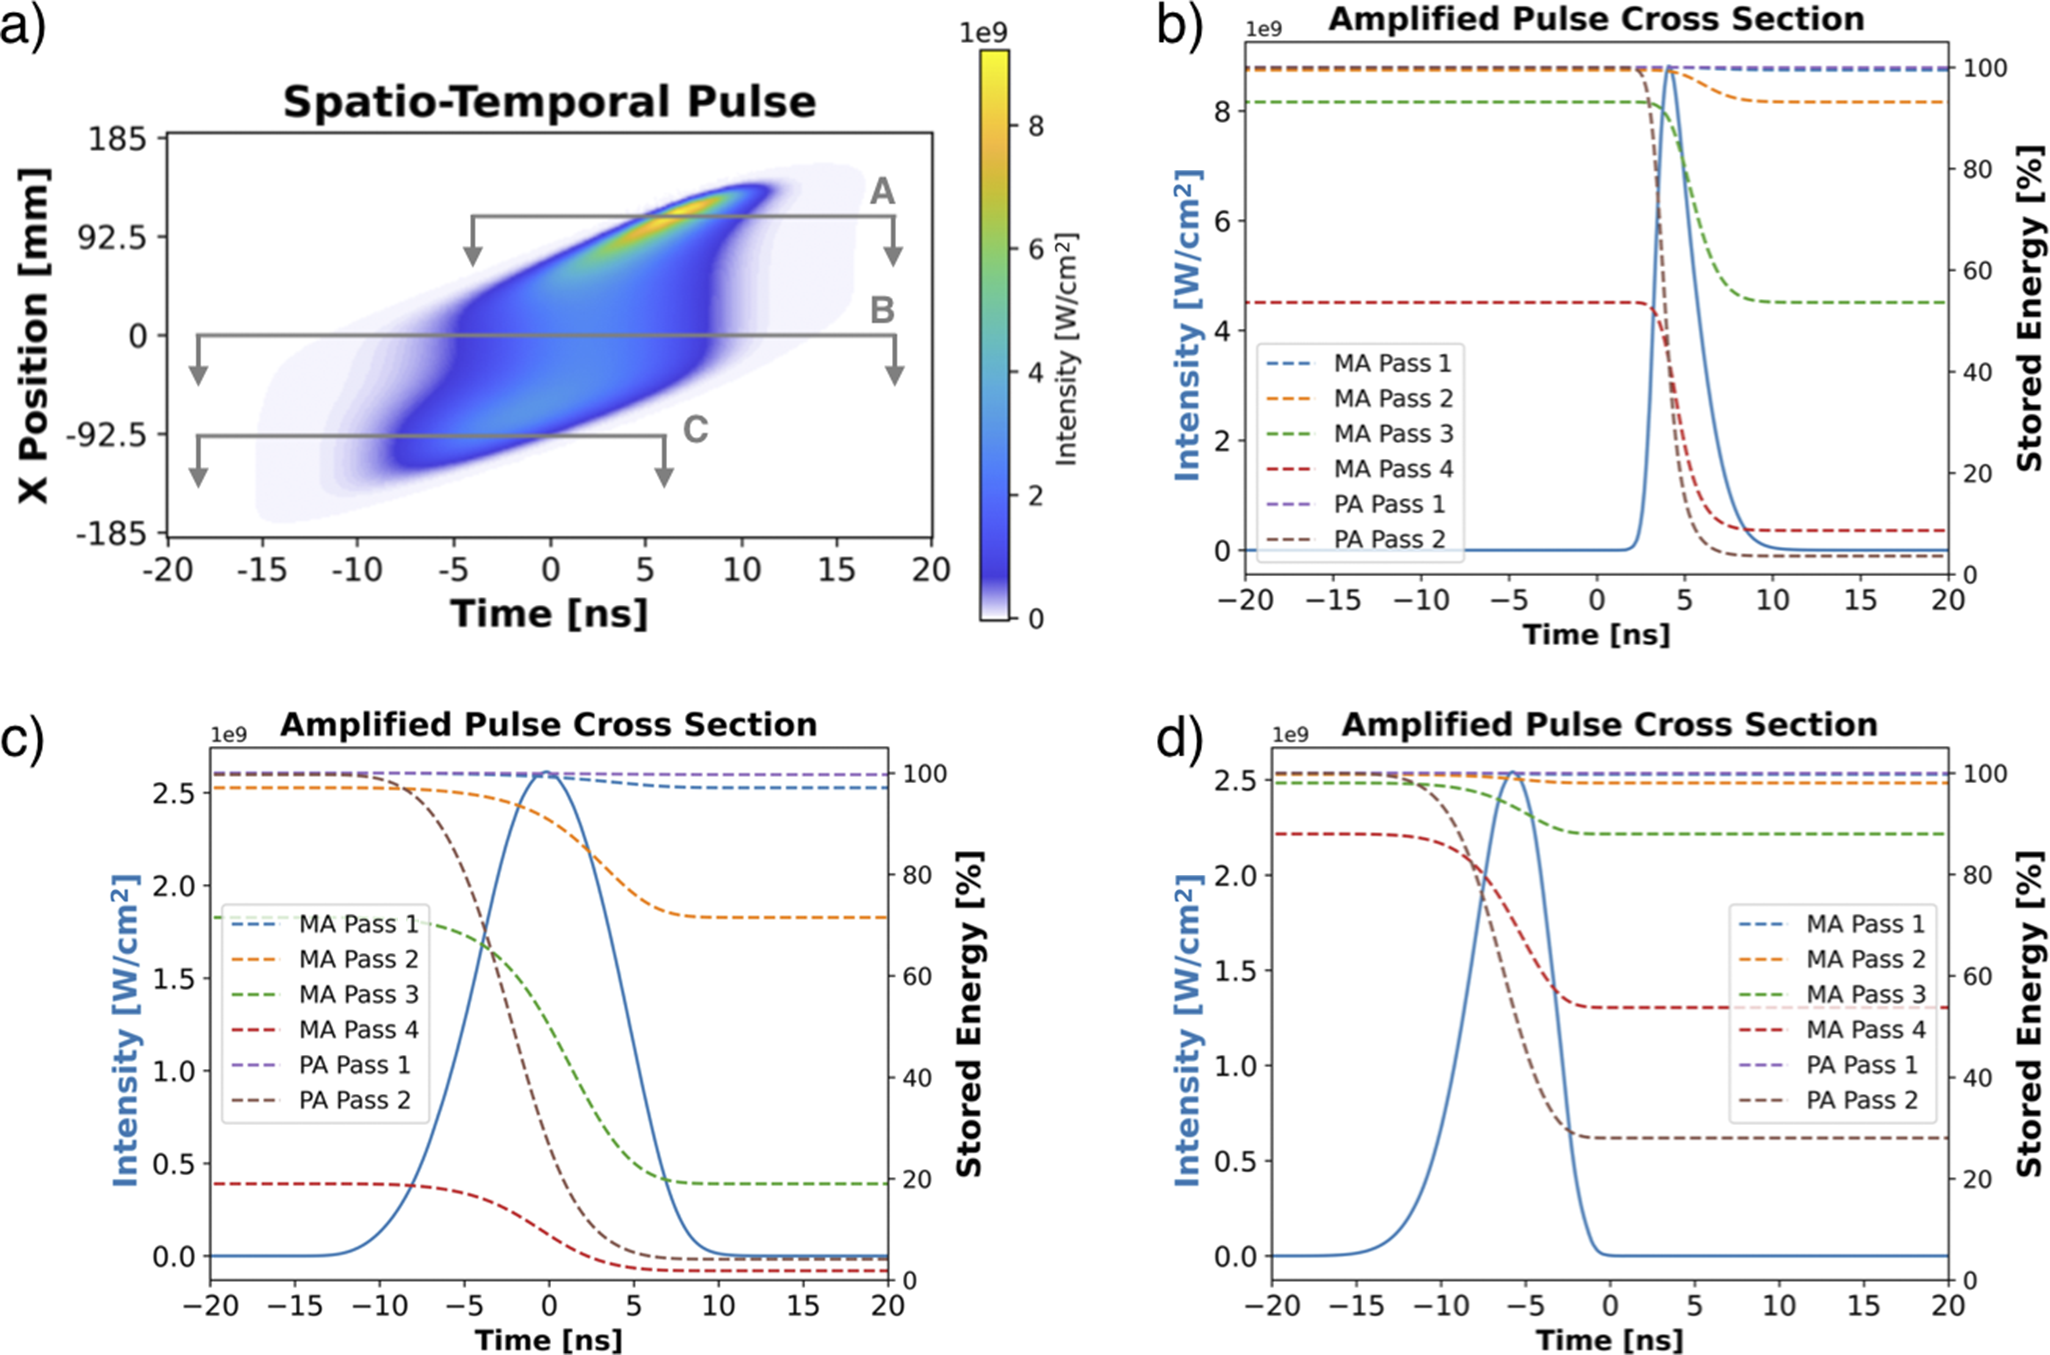
To illustrate the CPJBA amplification effects, the spatio-temporal distribution shown in Figure 7(d), with a total energy of 40-J, is sent into the amplifier. Using a flat initial spatial gain distribution in the amplifiers (i.e., the stored energy in the amplifier slabs is spatially uniform across the transverse dimension of the slabs) with an initial stored energy of 22.7 kJ in the MA and 14.445 kJ in the PA, will amplify the chirped-beam pulse to 25 kJ with the resulting spatio-temporal distribution as shown in Figure 11(a). This corresponds to a total stored energy of 37.145 kJ in the amplifiers and an efficiency of 67.3%. The output exhibits significant pulse distortions from the desired amplified pulse due to a combination of gain narrowing and gain saturation. Both effects are ubiquitous to broadband, high-gain amplification; however, they have a unique presentation in CPJBA. Gain narrowing, a process where the spectral components at the peak of the emission cross-section curve experience higher gain than the spectral wings[ Reference Hotz 97 ], results in a lack of pulse content at the temporal edges of the amplified pulse shown in Figure 11(a). This causes the FWHM pulse duration at the middle of the beam to be reduced from 20.6 to 9.51 ns, as shown in Figure 11(c). Temporal pulse distortion due to gain saturation is a well-known phenomenon in CPA laser amplifiers[ Reference Cabezas, McAllister and Ng 98 , Reference Schimpf, Seise, Limpert and Tünnermann 99 ]. When operating near the saturation fluence of the gain media, the leading edge of the temporal pulse will deplete the population inversion of the amplifier before the trailing edge arrives, leading to higher gain and distortion of the temporal pulse shape.
(a) Spatio-temporal intensity distribution in units of W/cm2 of the amplified 25-kJ output pulse. (b) Cross-section A at x = 110 mm with an FWHM duration of 2.54 ns. (c) Cross-section B at x = 0 mm with an FWHM duration of 9.51 ns. (d) Cross-section C at x = –95 mm with an FWHM of 5.60 ns. The dashed lines indicate the temporal evolution of the stored energy of both the main and power amplifier slabs on each pass.
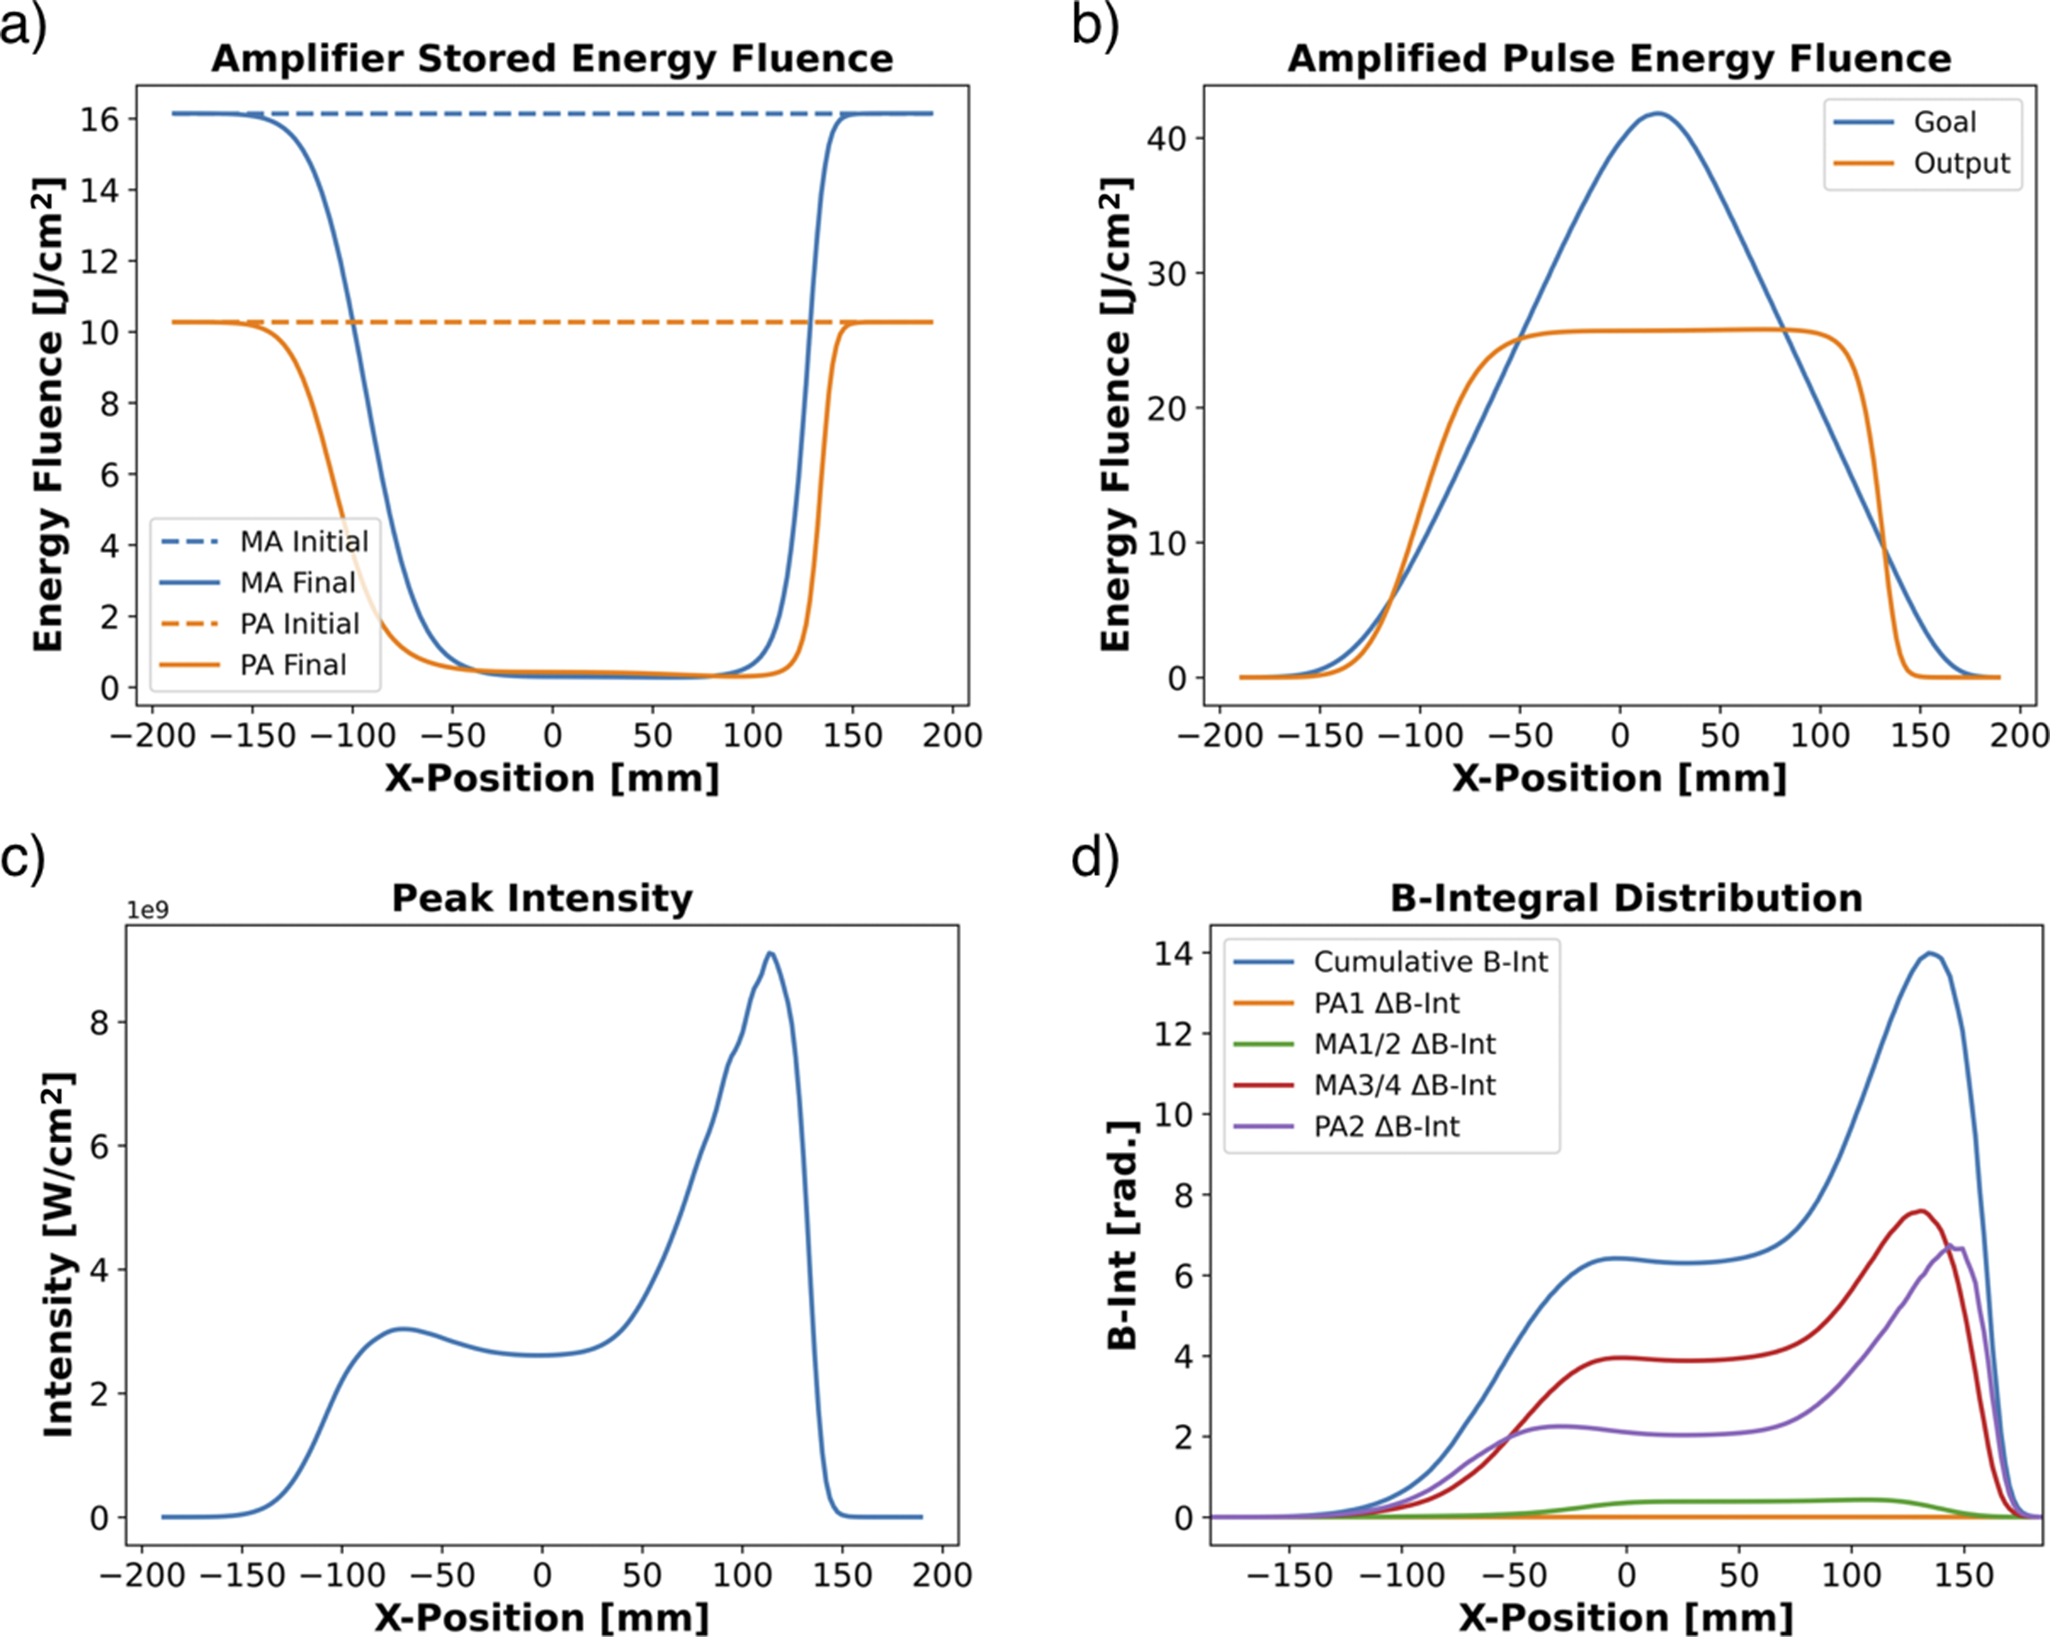
In CPJBA, the spatial chirp induces a spatial dependence on the temporal position of the leading edge. Now, the spectral components at the emission cross-section peak are exposed to the full stored energy in the amplifier, and hence gain, before the spectral components with lower emission cross-section can deplete it. Along with the spatial energy distribution of the pulse, this leads to a varying effective gain across the transverse profile of the beam producing the asymmetric amplified pulse energy fluence distribution, seen in Figure 12(b), which significantly varies from the goal-amplified pulse energy fluence. Since the spatial edges of the beam have a reduced FWHM pulse duration, an intensity hot spot develops on the leading-edge side of the beam corresponding to the temporal position of the 1053-nm component of the pulse spectrum (i.e., the emission cross-section and gain maximum). This results in a large B-integral accumulation, shown in Figure 12(d), at the spatial position of the intensity hot spot with a peak of 17.75.
Spatial distribution of (a) initial and final stored energy fluence in the MA and PA, (b) the amplified pulse fluence comparing the base case input pulse output to the goal-amplified pulse, (c) peak intensity of the amplified output pulse and (d) the total accumulated B-integral during amplification.
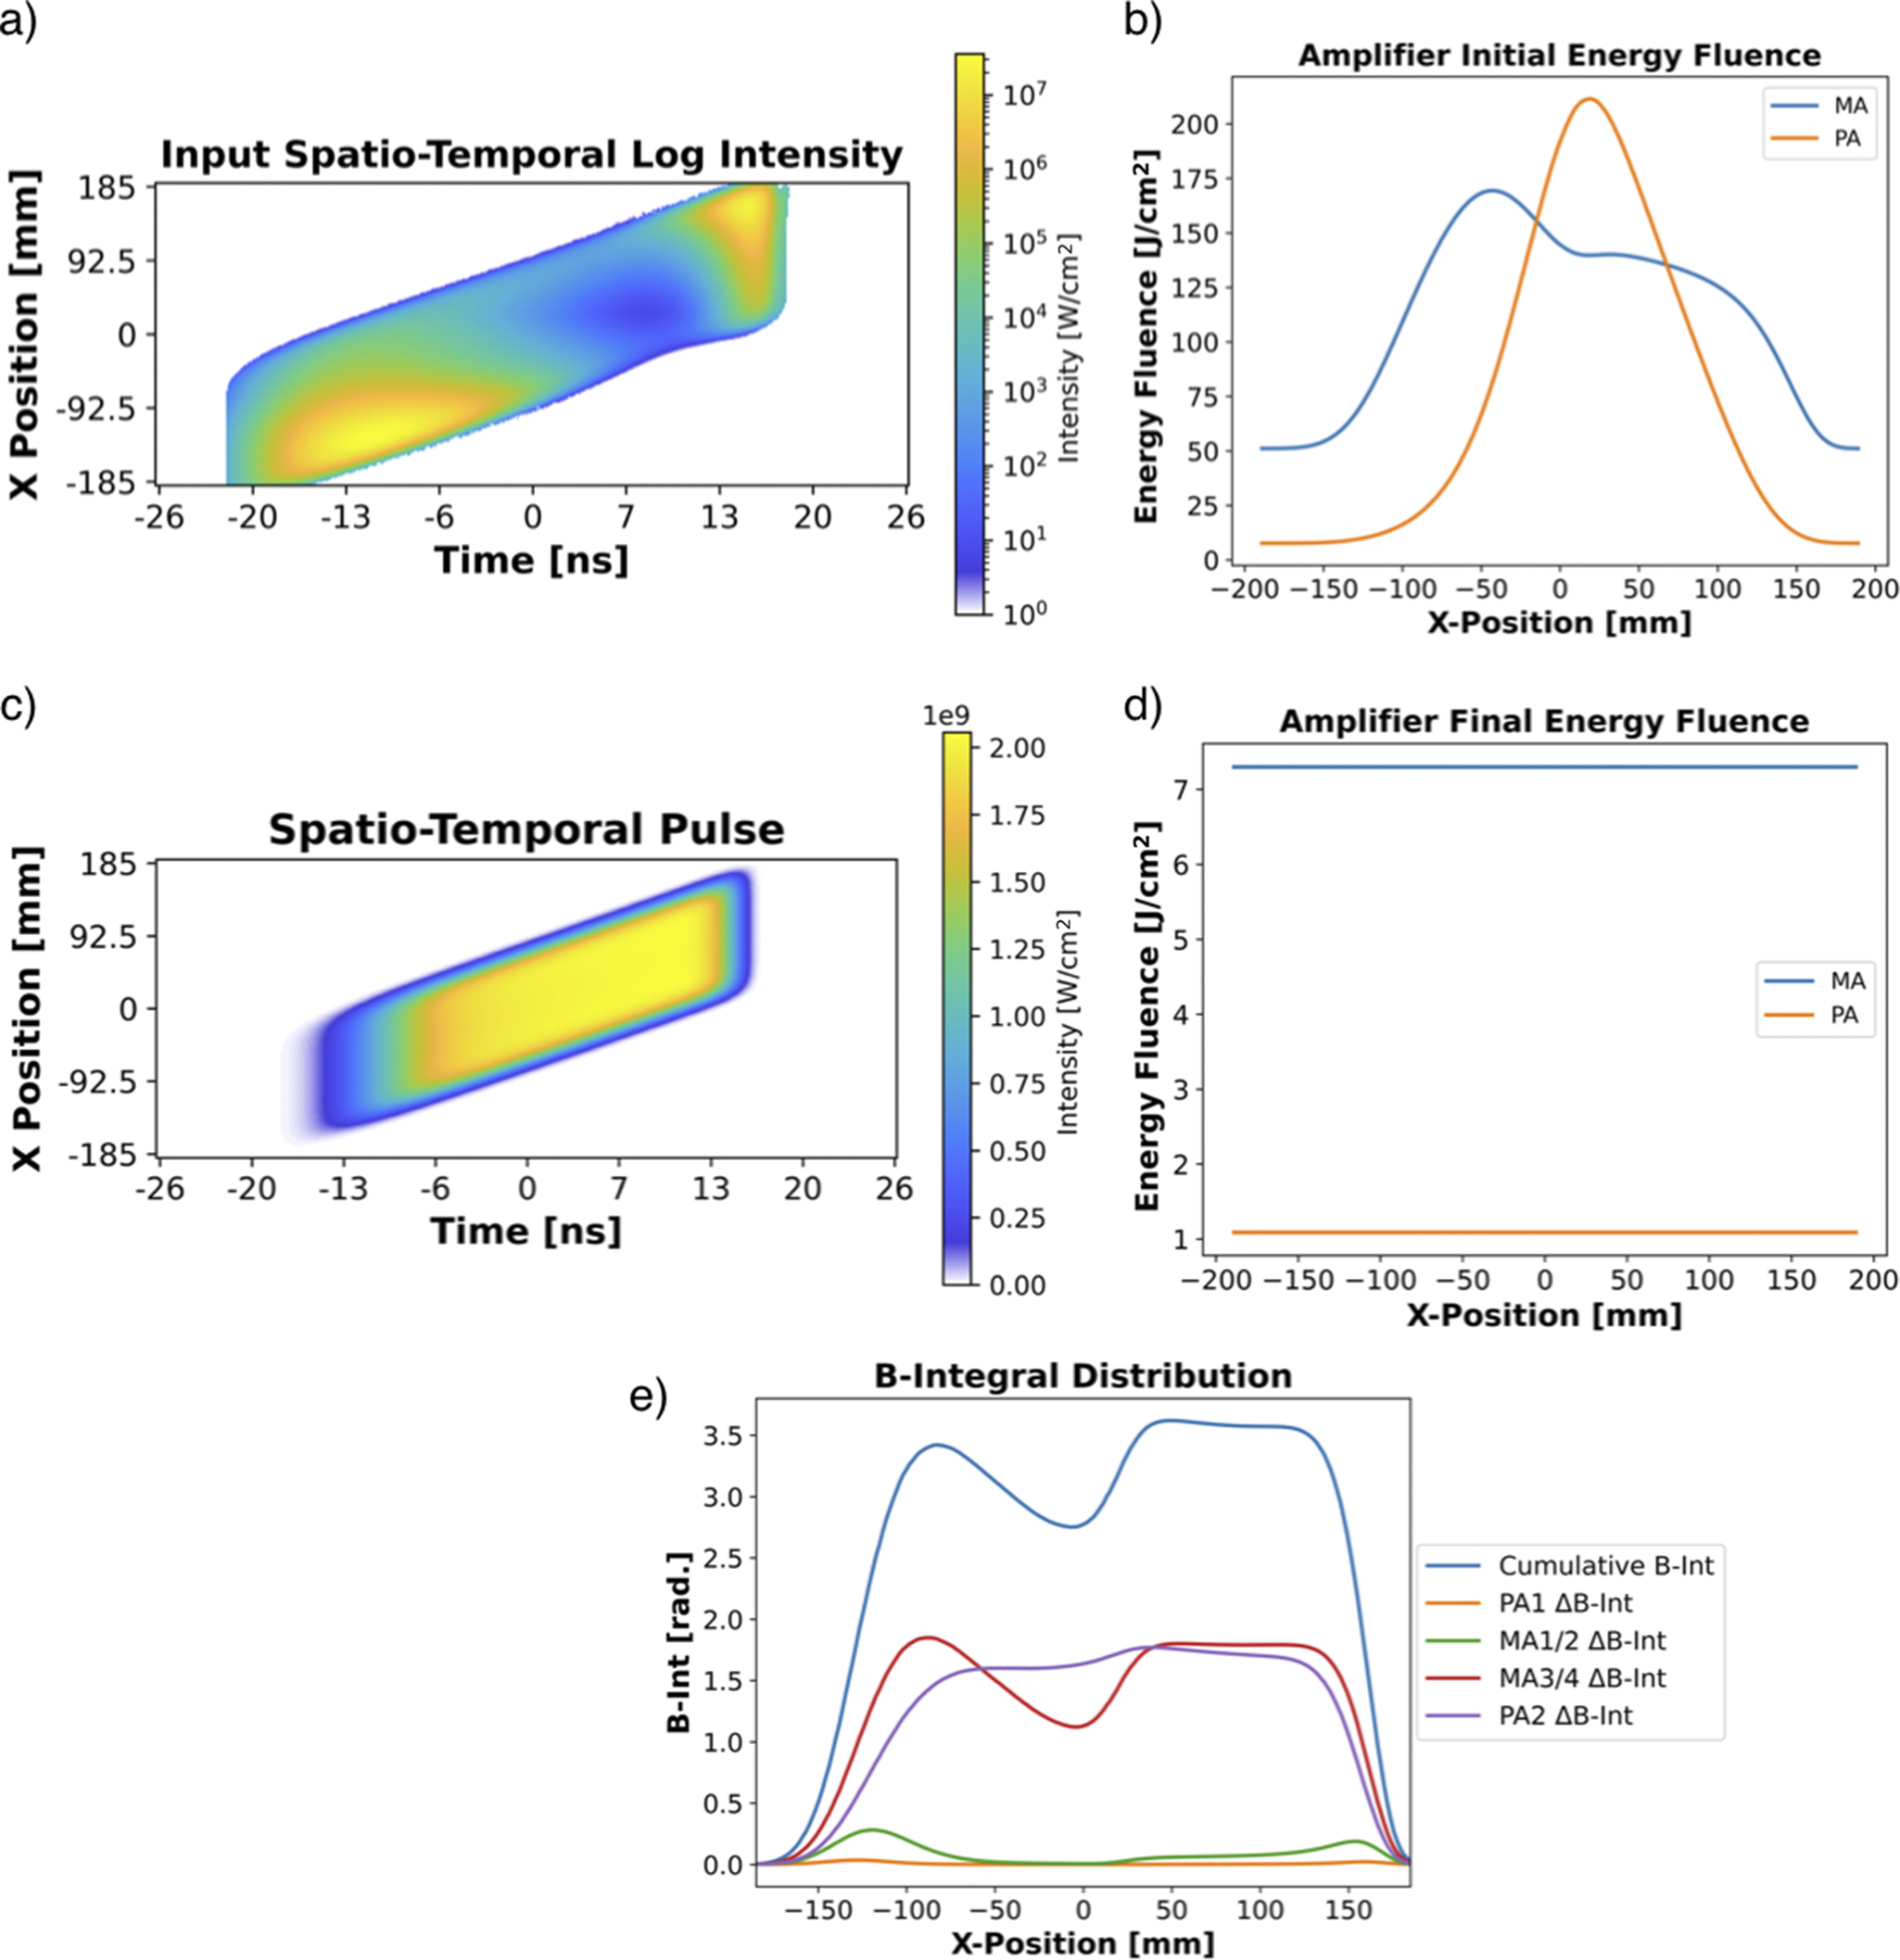
The first case of a flat distribution of remaining stored energy in the MA and PA. (a) Log intensity of the 40-J input pulse spatio-temporal profile sent into the NIF-like final amplifier with an (b) initial stored energy fluence spatial distribution in the MA and PA. This results in (c) the amplified 25-kJ output pulse spatio-temporal profile and (d) a final stored energy fluence spatial distribution in the MA and PA. (e) Spatial distribution of the total B-integral accumulated during amplification for this configuration.
The temporal and spatial pulse distortion effects present in CPJBA due to amplification can be compensated by appropriately shaping both the input pulse and transverse gain distribution in the amplifier. This gain saturation effect is compensated by appropriately sculpting the spectrum of the input pulse to the amplifier, skewing the input power spectrum to the shorter wavelength components[
Reference Schimpf, Seise, Limpert and Tünnermann
99
]. In the Nexawatt system, spectral sculpting can be accomplished in the broadband OPCPA stage. The temporal distribution of the spectrum in this highly stretched 20-ns pulse enables control of the gain of the different spectral components by modifying the temporal shape of the pump pulse[
Reference Batysta, Antipenkov, Borger, Kissinger, Green, Kananavičius, Chériaux, Hidinger, Kolenda, Gaul, Rus and Ditmire
74
,
Reference Lee, Kim, Yoo, Yoon, Yang, Lim, Nam, Sung and Lee
75
]. This is readily achieved with current multi-joule, ns-duration narrowband lasers and low-capacitance (i.e., fast switching) electro-optic cells. While this technique can perform the bulk of the spectral shaping, with a single PC supporting an extinction ratio of greater than or equal to 5000:1, this will only allow for a single spectral sculpting shape across the entire spatial extent of the beam. However, there are a number of 2D pulse shaping methods to fine tune the spatio-spectral distribution of the input pulse to the amplifier (i.e., a unique spectral sculpt profile at different transverse spatial positions on the beam)[
Reference Korman, Bahar, Arieli and Suchowski
70
,
Reference Zhan
71
]. These 2D pulse shapers take the traditional 4f pulse shaper, essentially a Martinez stretcher with s ${}_1$
= s
${}_1$
= s ${}_2$
= f and an amplitude modulator at the Fourier plane between two lenses, and replace the one-dimensional (1D) amplitude modulator with a 2D device such as a diffractive optical element or digital micromirror device. This enables the spectral content of the pulse to be modulated along one of the transverse spatial coordinates of the beam[
Reference Zhan
71
].
${}_2$
= f and an amplitude modulator at the Fourier plane between two lenses, and replace the one-dimensional (1D) amplitude modulator with a 2D device such as a diffractive optical element or digital micromirror device. This enables the spectral content of the pulse to be modulated along one of the transverse spatial coordinates of the beam[
Reference Zhan
71
].
The spatial pulse distortions during amplification can be addressed by two different methods – spatially shaping the beam prior to amplification and spatially varying the gain within the amplifier. The pre-amplifier modules (PAMs) at the NIF incorporate a programmable spatial shaper (PSS) that is composed of a system of specialty spatial light modulators, which allows for the blocking of portions of the low-fluence beam that correspond to the location of damage sites that are present on the downstream optics[ Reference Heebner, Borden, Miller, Hunter, Christensen, Scanlan, Hayman, Wegner, Hermann, Brunton, Tse, Awwal, Wong, Seppala, Franks, Marley, Williams, Budge, Henesian and Dinicola 72 , Reference Heebner, Acree, Alessi, Barnes, Bowers, Browning, Budge, Burns, Chang, Christensen, Crane, Dailey, Erbert, Fischer, Flegel, Golick, Halpin, Hamamoto, Hermann, Hernandez, Honig, Jarboe, Kalantar, Kanz, Knittel, Lusk, Molander, Pacheu, Paul, Pelz, Prantil, Rushford, Schenkel, Sigurdsson, Spinka, Taranowski, Wegner, Wilhelmsen, Nan Wong and Yang 73 ]. This system has demonstrated an optical density (OD) attenuation factor of OD 2 with mm-scale spatial resolution and extension to OD 5 is reasonable. In addition to the PSS, the NIF also incorporates a static spatial mask prior to the MA to account for the nonuniform small-signal spatial gain profile[ Reference Heebner, Borden, Miller, Hunter, Christensen, Scanlan, Hayman, Wegner, Hermann, Brunton, Tse, Awwal, Wong, Seppala, Franks, Marley, Williams, Budge, Henesian and Dinicola 72 , Reference Heebner, Acree, Alessi, Barnes, Bowers, Browning, Budge, Burns, Chang, Christensen, Crane, Dailey, Erbert, Fischer, Flegel, Golick, Halpin, Hamamoto, Hermann, Hernandez, Honig, Jarboe, Kalantar, Kanz, Knittel, Lusk, Molander, Pacheu, Paul, Pelz, Prantil, Rushford, Schenkel, Sigurdsson, Spinka, Taranowski, Wegner, Wilhelmsen, Nan Wong and Yang 73 ]. The easiest way to modify the spatial gain profile in the amplifier slabs is to shape the spatial profile of the pump fluence. The flash lamp pumps on the MA slabs of the NIF utilize a carefully designed, multi-curved reflector to distribute the pump energy more evenly, producing a more spatially uniform small-signal gain[ Reference Spaeth, Manes, Kalantar, Miller, Heebner, Bliss, Spec, Parham, Whitman, Wegner, Baisden, Menapace, Bowers, Cohen, Suratwala, Di Nicola, Newton, Adams, Trenholme, Finucane, Bonanno, Rardin, Arnold, Dixit, Erbert, Erlandson, Fair, Feigenbaum, Gourdin, Hawley, Honig, House, Jancaitis, LaFortune, Larson, Le Galloudec, Lindl, MacGowan, Marshall, McCandless, McCracken, Montesanti, Moses, Nostrand, Pryatel, Roberts, Rodriguez, Rowe, Sacks, Salmon, Shaw, Sommer, Stolz, Tietbohl, Widmayer and Zacharias 67 ]. For CPJBA, the desired spatial gain profile can be made nonuniform to compensate for the spatial pulse distortions. Moving to a diode pump source, as is common with current high-intensity Nd:glass lasers[ Reference Reagan, Albrecht, Alessi, Ammons, Banerjee, Barillas, Batysta, Buckley, Chemali, Clark, Davila, Deri, Eseltine, Fishler, Fulkerson, Galbraith, Galvin, Gonzales, Gopalan, Herriot, Hubka, Jimenez, Kiani, Koh, Kupfer, Liao, Lusk, Nguyen, Patel, Peer, Peterson, Plummer, Schaffers, Sistrunk, Spinka, Stolz, Tamer, Tang, Telford, Terzi, Utley, Velas, Vella and Wong 49 , Reference Caird, Agrawal, Bayramian, Beach, Britten, Chen, Cross, Ebbers, Erlandson, Feit, Freitas, Ghosh, Haefner, Homoelle, Ladran, Latkowski, Molander, Murray, Rubenchik, Schaffers, Siders, Stappaerts, Sutton, Telford, Trenholme and Barty 96 ], will allow for greater control over the spatial distribution of the gain profile.
5.3 Nexawatt amplification
Conveniently, the Frantz–Nodvik solution is reversible[ Reference Spaeth, Manes, Kalantar, Miller, Heebner, Bliss, Spec, Parham, Whitman, Wegner, Baisden, Menapace, Bowers, Cohen, Suratwala, Di Nicola, Newton, Adams, Trenholme, Finucane, Bonanno, Rardin, Arnold, Dixit, Erbert, Erlandson, Fair, Feigenbaum, Gourdin, Hawley, Honig, House, Jancaitis, LaFortune, Larson, Le Galloudec, Lindl, MacGowan, Marshall, McCandless, McCracken, Montesanti, Moses, Nostrand, Pryatel, Roberts, Rodriguez, Rowe, Sacks, Salmon, Shaw, Sommer, Stolz, Tietbohl, Widmayer and Zacharias 67 ]. This allows one to specify the remaining stored energy in the amplifier and the desired amplified output pulse to obtain the ideal input pulse and initial stored energy. The inverse Frantz–Nodvik solution takes the following form:
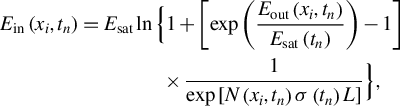 $$\begin{align}{E}_\mathrm{in}\left({x}_i,{t}_n\right)&={E}_\mathrm{sat}\ln \Big\{1+\left[\exp \left(\frac{E_\mathrm{out}\left({x}_i,{t}_n\right)}{E_\mathrm{sat}\left({t}_n\right)}\right)-1\right]\nonumber\\&\qquad\qquad\times\frac{1}{\exp \left[N\left({x}_i,{t}_n\right)\sigma \left({t}_n\right)L\right]}\Big\},\end{align}$$
 $$\begin{align}&\quad N\left({x}_i,{t}_{n-1}\right)=N\left({x}_i,{t}_n\right)+\left[{E}_\mathrm{in}\left({x}_i,{t}_n\right)+{E}_\mathrm{out}\left({x}_i,{t}_n\right)\right]\frac{1}{L}.\end{align}$$
The desired output spatio-temporal intensity distribution, scaled to 25 kJ in Figure 13(c), is a fixed input, while the spatial distribution of the remaining stored energy in each amplifier section, post-amplification, is a free variable. This desired, amplified spatio-temporal pulse distribution is then back-propagated through the amplifier using the inverse Frantz–Nodvik solution. Each supplied final energy distribution results in a unique, ideal spatio-temporal pulse input and initial stored energy distribution. Optimization is contingent on real-world design constraints, which are currently not material, and this section seeks, instead, to demonstrate the amplification dynamics.
We first consider the case of a spatially flat final stored energy distribution, Figure 13(d), with remaining energy split between the MA and PA at a ratio that produces approximately the same initial energy per slab in both the MA and PA for the ‘11-7’ amplifier configuration. The total remaining energy determines the input pulse energy; a lower amount of remaining stored energy in the amplifier (i.e., more efficient energy extraction) requires a higher input pulse energy. Here it is set to 10.4 kJ to give an input pulse energy of 40 J, which is commensurate with previous studies on potential exawatt-class Nd:glass lasers[ Reference Hays, Gaul, Martinez and Ditmire 51 ]. Using this final stored energy distribution of the amplifier and back-propagating the desired amplified output pulse using the inverse Frantz–Nodvik solution produces the input pulse spatio-temporal distribution, Figure 13(a), as well as the initial stored energy distribution in the amplifiers, shown in Figure 13(b). This input pulse, in combination with the initial stored energy distribution, will result in the amplified spatio-temporal output pulse distribution, shown in Figure 13(c). The initial stored energy distribution has a total energy of approximately 36.76 kJ for an efficiency of 68.0%, and is free of any high-frequency spatial modulations, allowing for gain shaping with a diode pump source. In addition to producing a nearly ideal amplified output pulse, this arrangement has a peak B-integral value of approximately 3.5 with a relatively flat spatial distribution – well within the acceptable limits of large-aperture Nd:glass lasers. While the spatio-temporal distribution of this input pulse is quite different from pulse structures normally used during amplification, Figures 14(a)–14(f) show how the pulse evolves during the various passes through the MA and PA, culminating in the desired amplified output pulse spatio-temporal distribution.
Evolution of the spatio-temporal pulse distribution during amplification given the input pulse seen in Figure 13(a) and initial stored energy distribution in Figure 13(b).
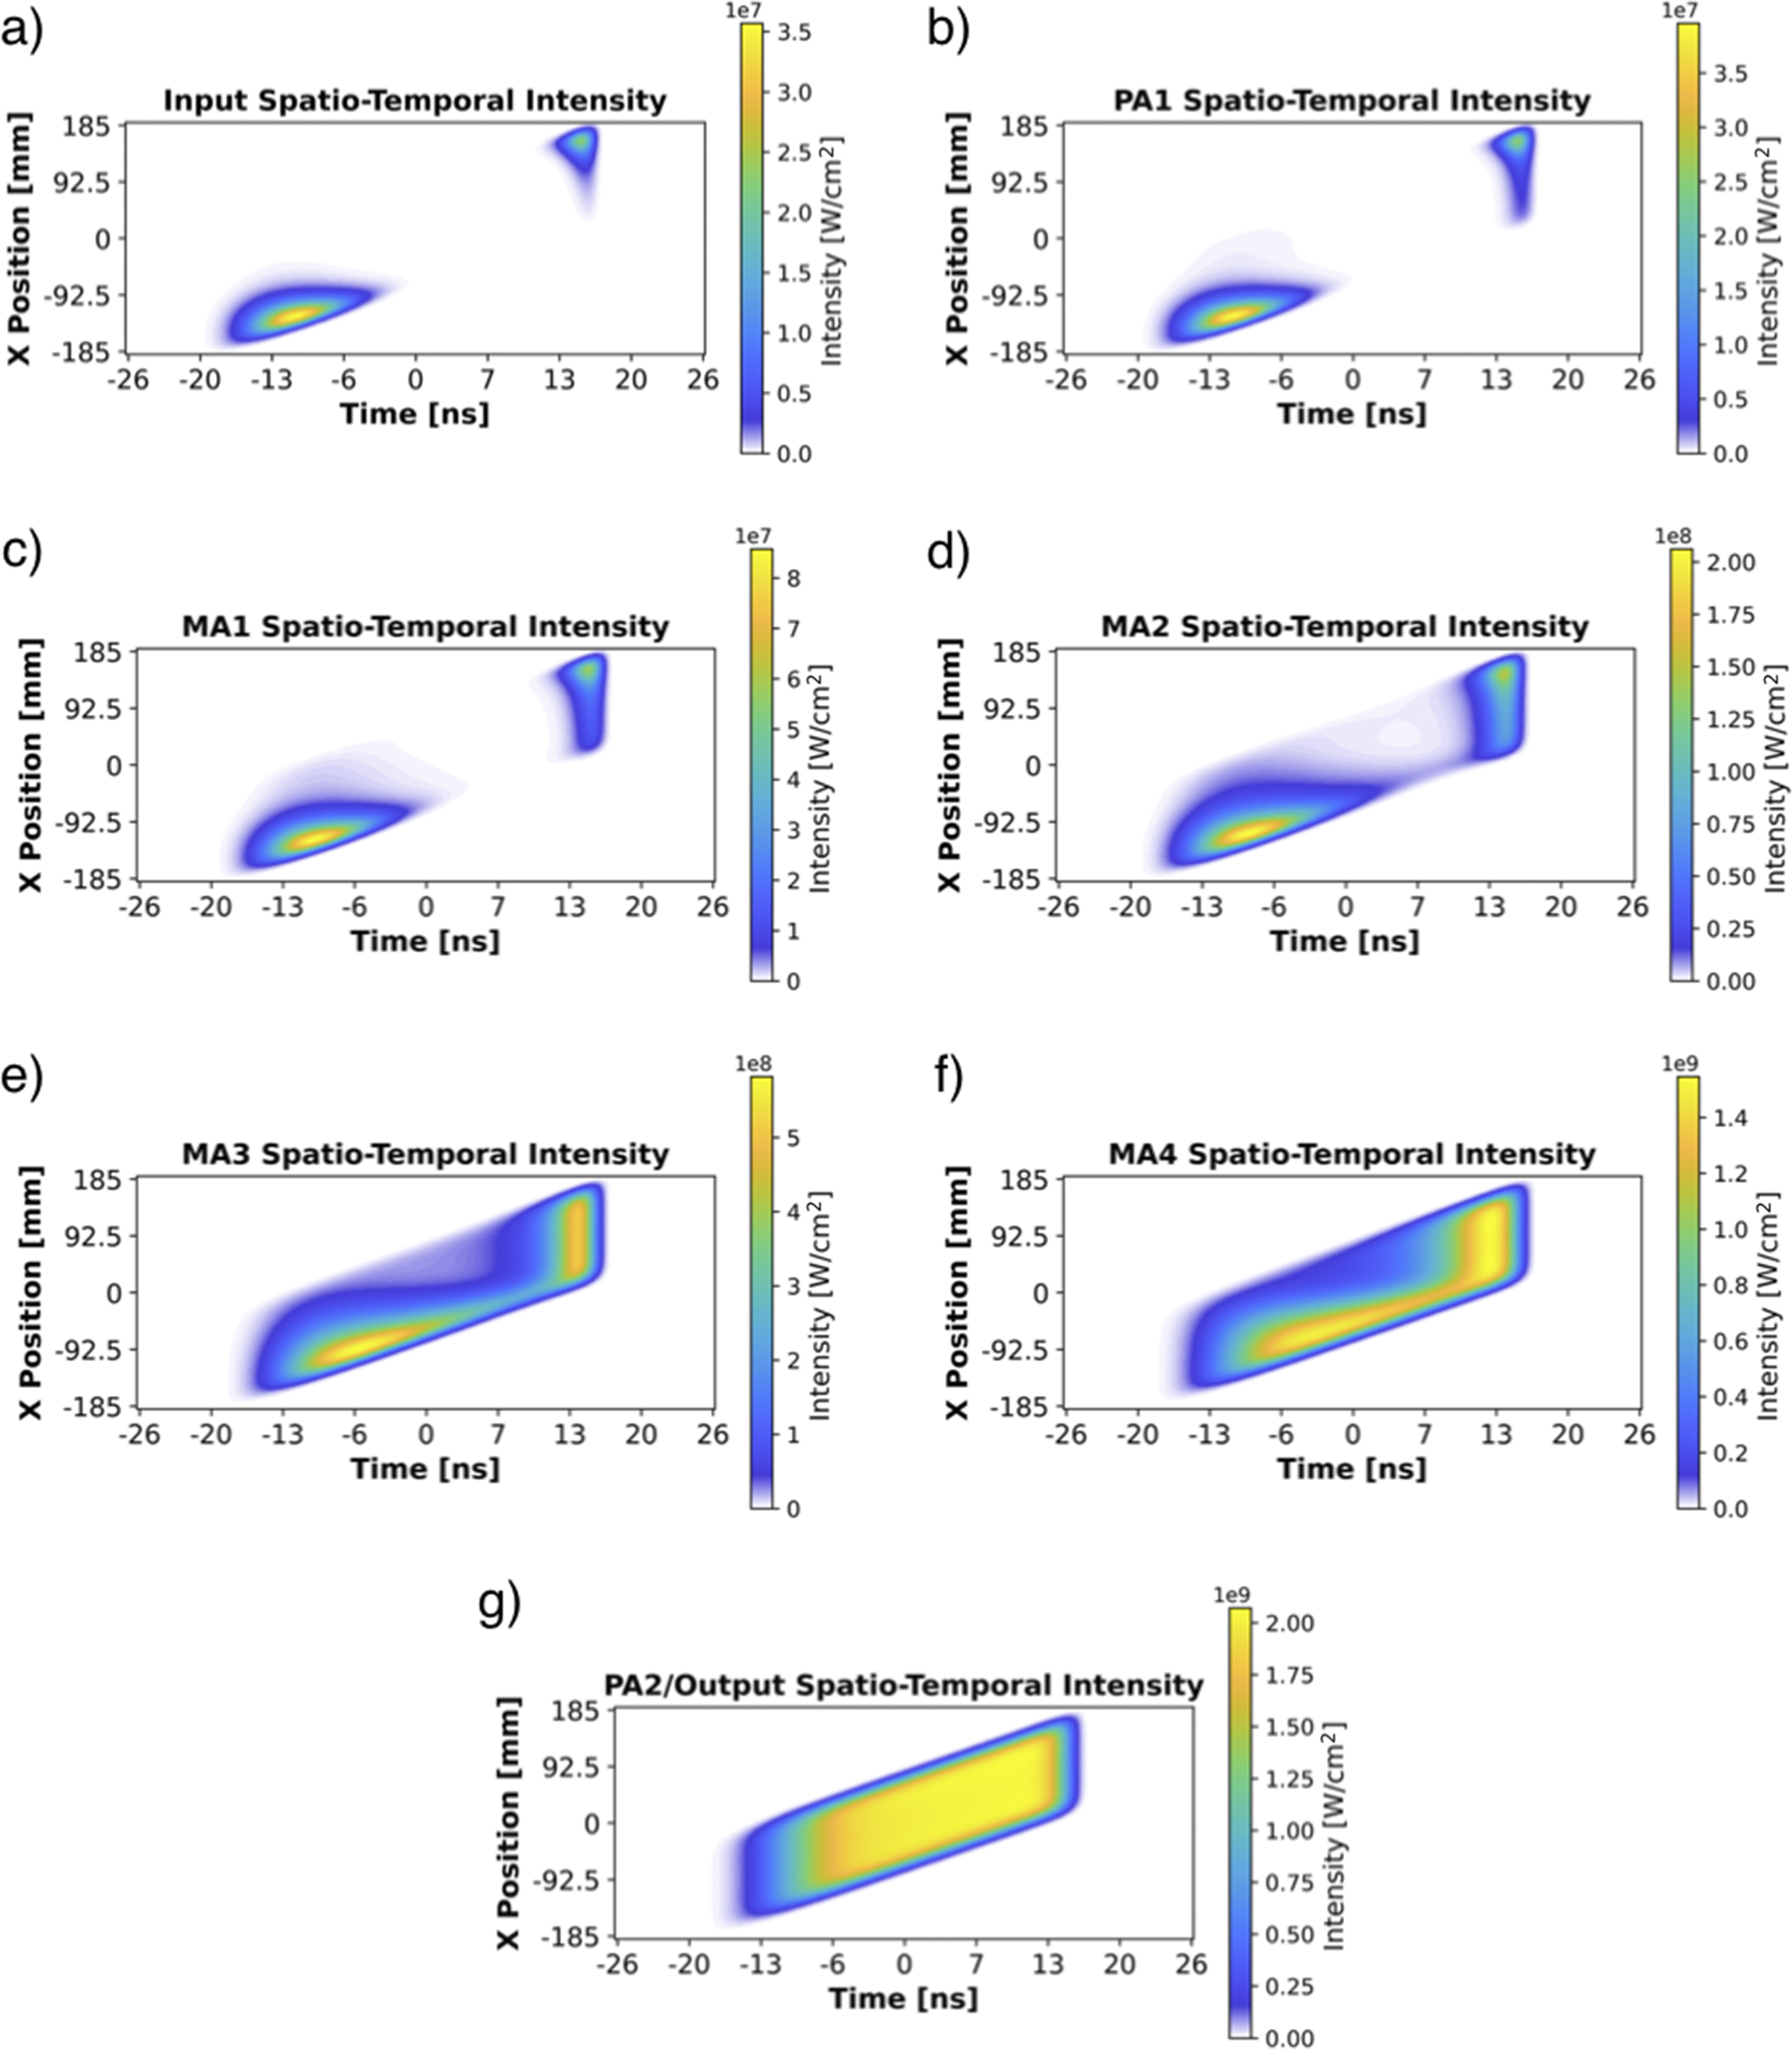
One can control the input pulse spatio-temporal profile by modifying the remaining stored energy spatial distribution in the amplifier. Increasing the amount of remaining stored energy at a particular transverse position in the amplifier will decrease the necessary energy of the input pulse at the same location, lowering the pulse intensity there. This can allow for an input spatio-temporal pulse profile with lessened sculpting requirements. To demonstrate, the inverse of the goal output pulse’s spatial energy distribution, seen in Figure 12(b), is used as the remaining stored energy spatial distribution, shown in Figure 15(d). For an input pulse of 40 J and initial stored energy split evenly for the ‘11-7’ configuration, a total stored energy of approximately 34.46 kJ is required, equating to a 72.5% amplification efficiency – 4.5% greater than the flat remaining stored energy case above. Increasing the remaining energy on the spatial edges of the amplifier and reducing the energy on the center lowers the sculpting requirements on the pulse, as seen in the input pulse spatio-temporal intensity distribution, Figure 15(a). While this arrangement has greater efficiency and reduced sculpting requirements, it does have a larger peak B-integral value of approximately 5.
The second case of a modified distribution of remaining stored energy in the MA and PA with reduced remaining energy on the center. (a) Log intensity of the 40-J input pulse spatio-temporal profile sent into the NIF-like final amplifier with an (b) initial stored energy fluence spatial distribution in the MA and PA. This results in (c) the amplified 25-kJ output pulse spatio-temporal profile and (d) a final stored energy fluence spatial distribution in the MA and PA. (e) Spatial distribution of the total B-integral accumulated during amplification for this configuration.
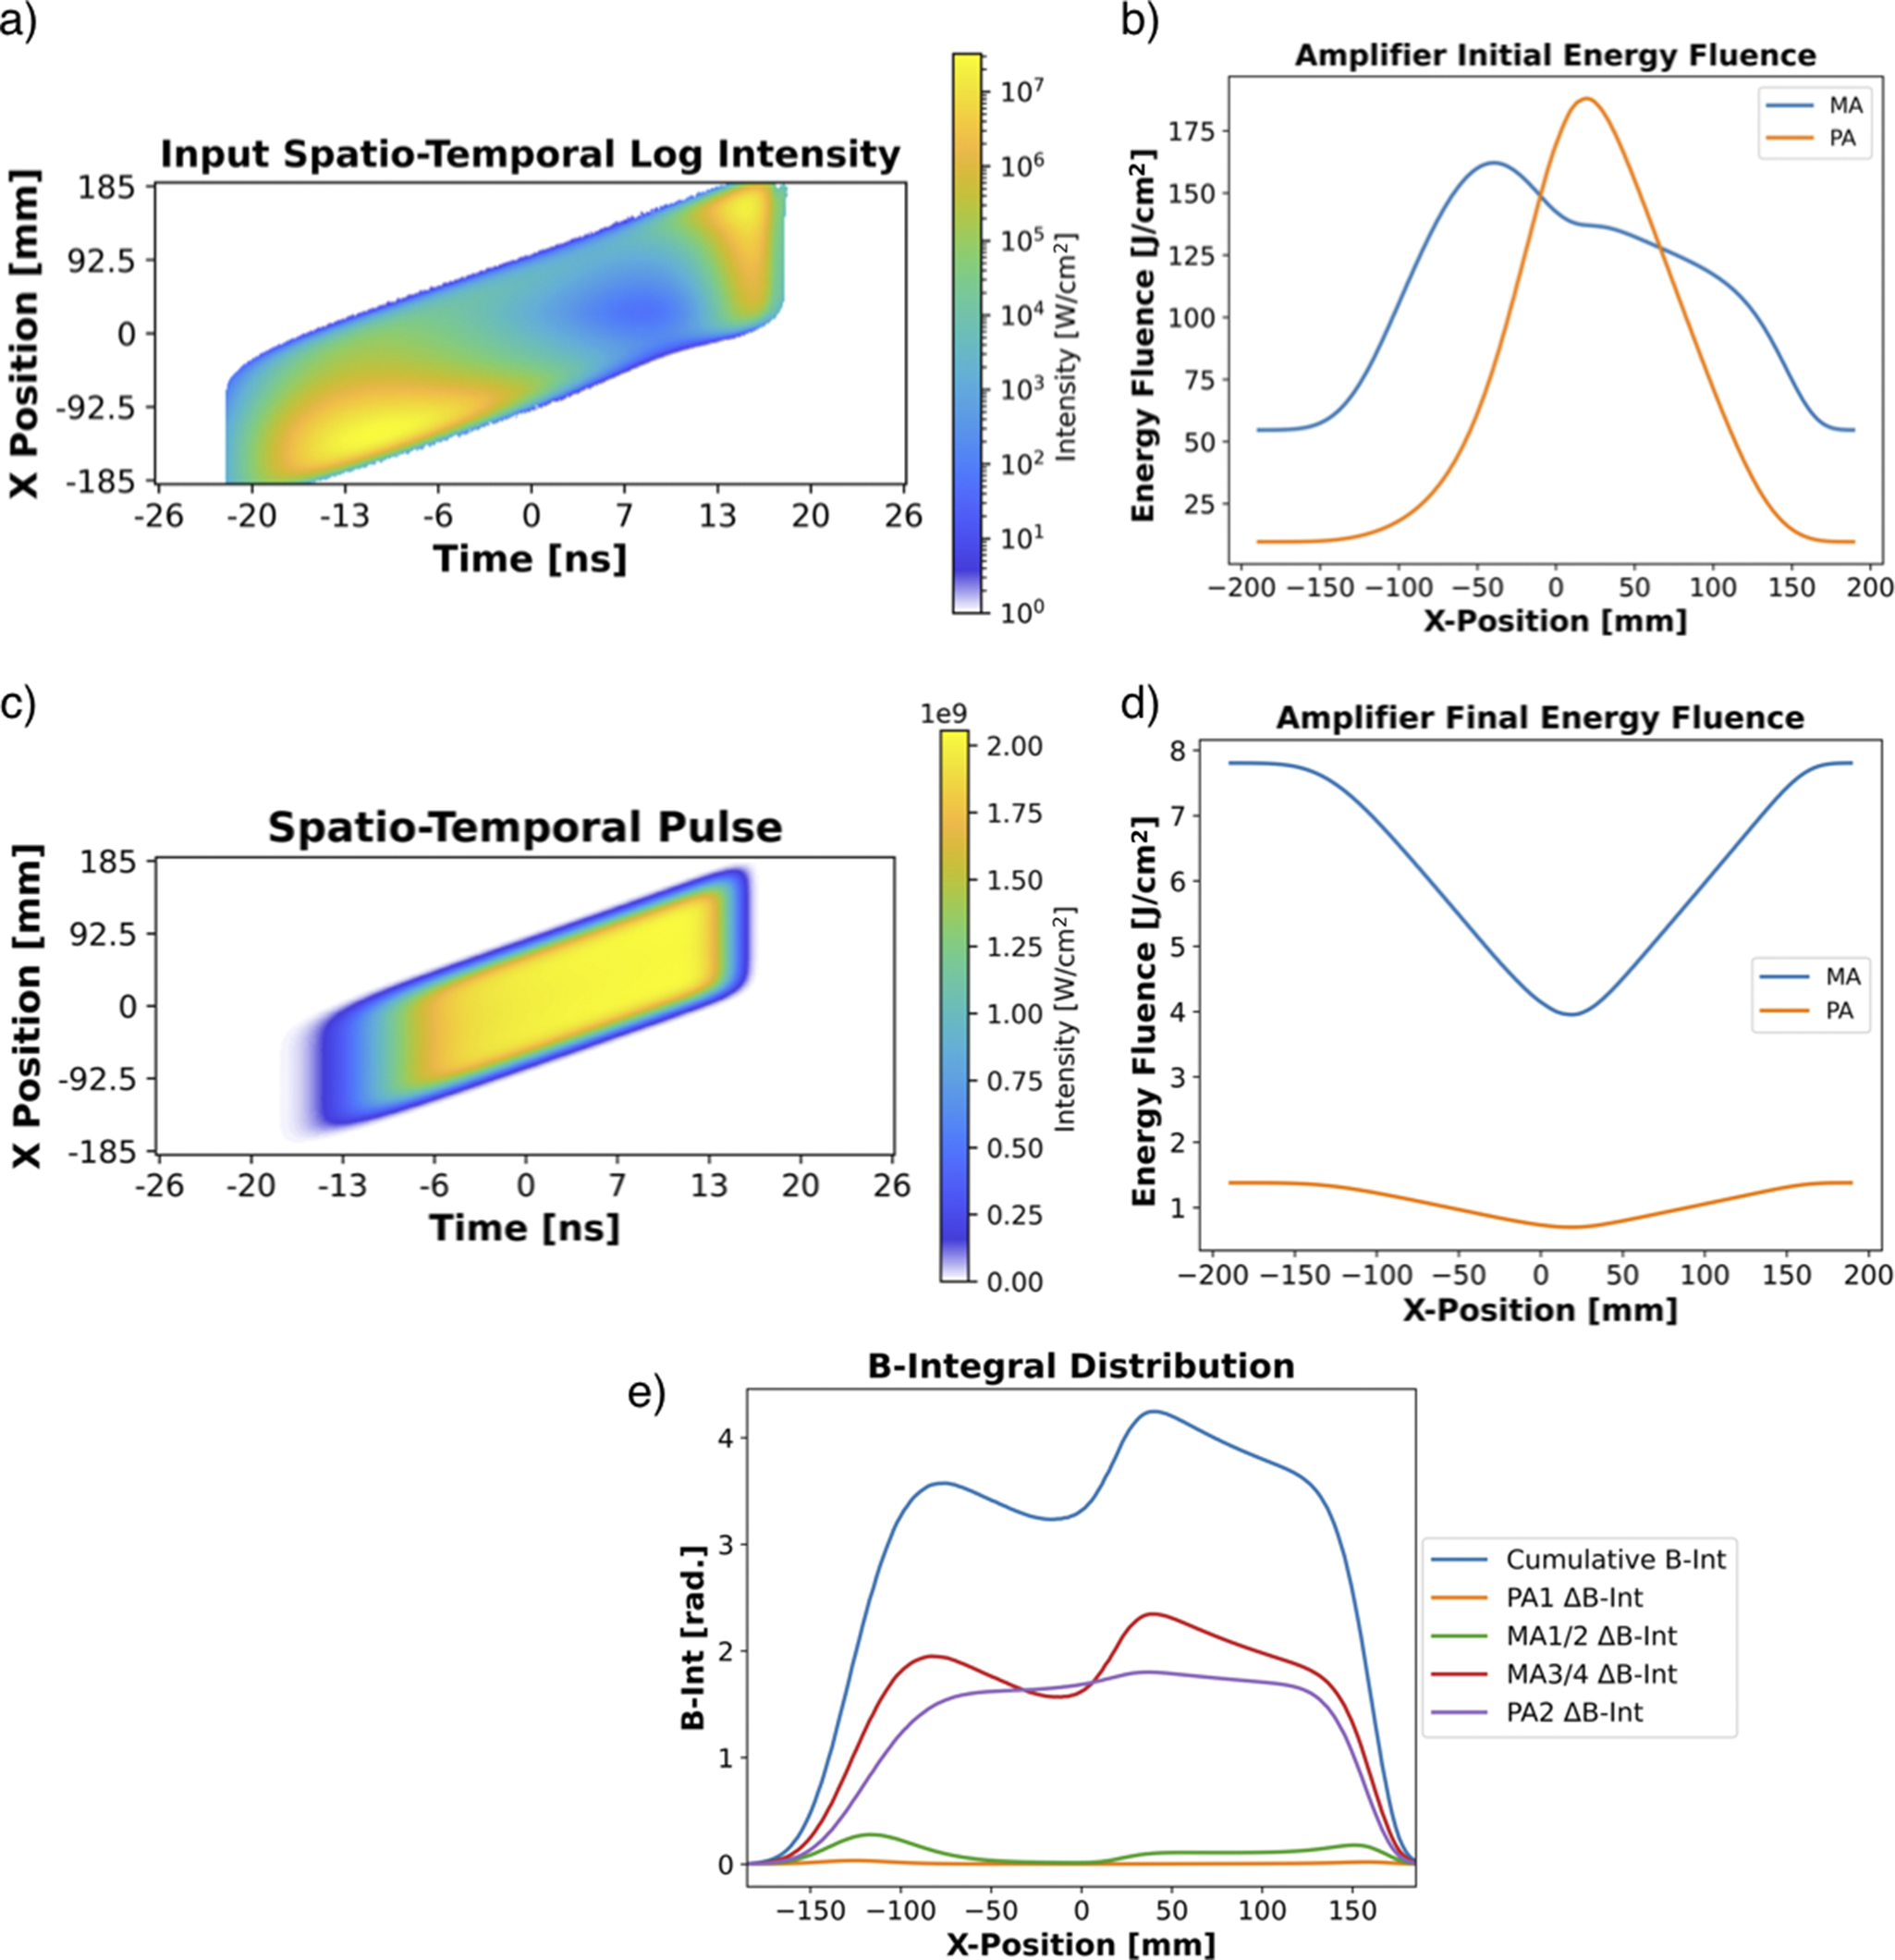
6 Multi-beam focusing system
Prior to the final compressor grating pair the pulse must be split into multiple identical copies to lower the fluence of each beamlet below the damage threshold of the gratings. This can be accomplished with a cascading beam splitter arrangement, shown in Figure 16, where each beamlet is transmitted through a beam splitter only once to ensure all copies experience the same dispersion response. Prior to splitting the beam will be 37 cm × 37 cm with approximately 21.6 kJ of energy, after diffraction losses, for a fluence of 16.5 J/cm2, and partially temporally compressed to a pulse duration of 3.3 ns.
Unit cell of the dispersion balanced beam splitting arrangement that splits the amplified chirped-beam pulse into 36 copies prior to final compression by the last grating pair in the six-grating compressor.
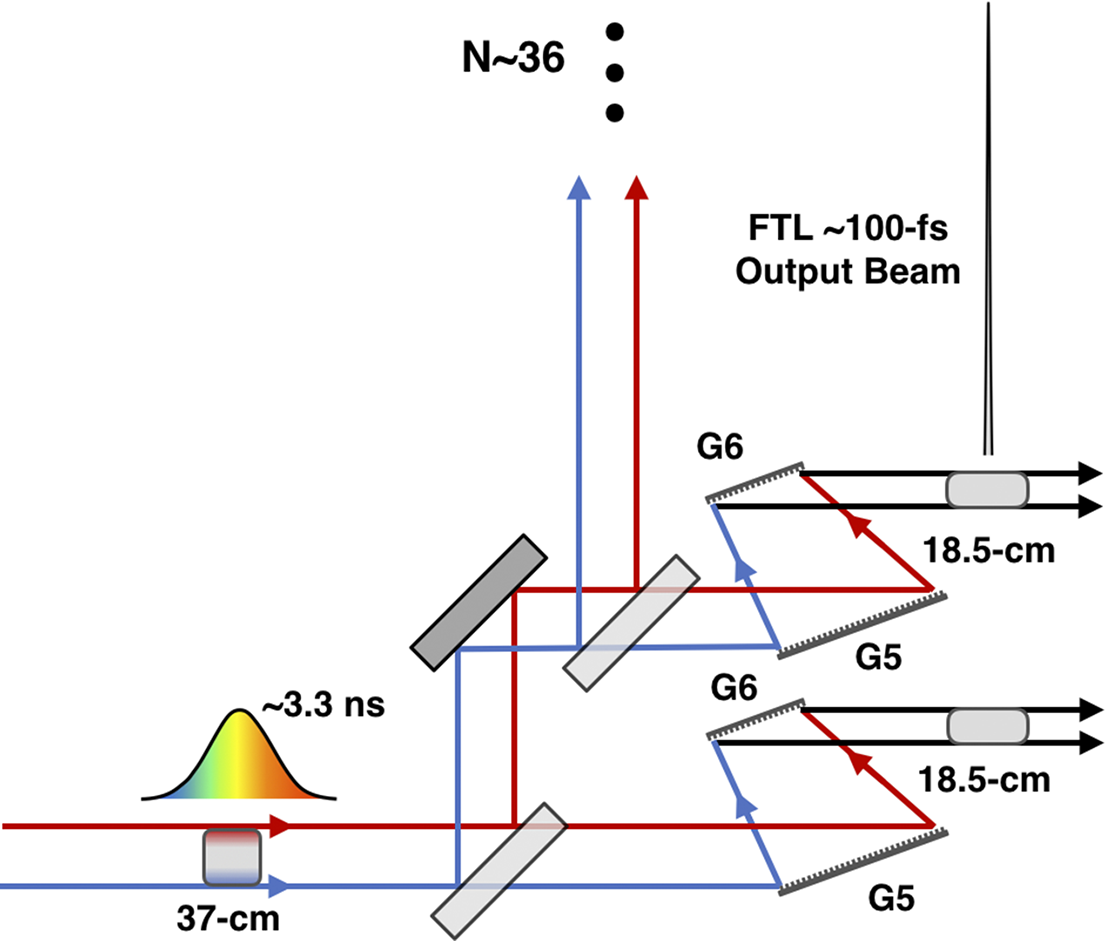
Leveraging the past few decades of experience developing high-quality MLD coatings, substantial research effort is being made today to push the size and laser-induced damage threshold (LIDT) of both electron beam evaporation (EBE) and ion beam sputtered (IBS) MLD coatings for high-energy inertial confinement fusion lasers and high-intensity petawatt lasers[
Reference Oliver, Rigatti, Noll, Spaulding, Hettrick, Gruschow, Mitchell, Sadowski, Smith and Charles
100
–
Reference Laurence, Alessi, Feigenbaum, Negres, Qiu, Siders, Spinka and Stolz
102
]. Current industry leaders can supply large-aperture (i.e., $>$
40 cm diameter) MLD coated beam splitters with high surface uniformity, substrate thickness tolerances of less than 100 μm and reflectivity variable from 0.2% to 99.5%[
103
,
104
]. HR mirrors are capable of an LIDT of more than 80 J/cm2 at 1064-nm, 10-ns pulses[
103
]. However, coatings designed for partial reflectivity have a reduced LIDT compared to HR mirrors, which scales with reflectivity, with 50-50 beam splitters having an LIDT as low as 15 J/cm2. For this reason, the first beam splitter arrangement should start with the highest reflectivity (i.e., 97.2% reflection to transmit 1/36 of the pulse energy) and decrease from there. While each beamlet will have the same number of transmissions they will have an uneven number of reflection events, making the wavefront quality of the beam splitters critical. Recently, large-scale anti-reflection (AR) metasurfaces have been written onto fused silica demonstrating an enhanced LIDT compared to traditional MLD AR coatings[
Reference Ray, Yoo, Nguyen, Norton, Cross, Carr and Feigenbaum
105
]; this technique, applied to the backside of the beam splitter, would further extend the power handling capabilities of these optics. The exact design and optimization of this beam splitter arrangement are subject to further work. In particular, careful design is required to handle the minor reflectivity from the backside AR coatings causing back reflections that can interfere with the main pulse. This would lead to possible pre- and post-pulse generation as well as modulations to the near-field, and is a major challenge in high-intensity lasers with multiple transmissive optical components.
$>$
40 cm diameter) MLD coated beam splitters with high surface uniformity, substrate thickness tolerances of less than 100 μm and reflectivity variable from 0.2% to 99.5%[
103
,
104
]. HR mirrors are capable of an LIDT of more than 80 J/cm2 at 1064-nm, 10-ns pulses[
103
]. However, coatings designed for partial reflectivity have a reduced LIDT compared to HR mirrors, which scales with reflectivity, with 50-50 beam splitters having an LIDT as low as 15 J/cm2. For this reason, the first beam splitter arrangement should start with the highest reflectivity (i.e., 97.2% reflection to transmit 1/36 of the pulse energy) and decrease from there. While each beamlet will have the same number of transmissions they will have an uneven number of reflection events, making the wavefront quality of the beam splitters critical. Recently, large-scale anti-reflection (AR) metasurfaces have been written onto fused silica demonstrating an enhanced LIDT compared to traditional MLD AR coatings[
Reference Ray, Yoo, Nguyen, Norton, Cross, Carr and Feigenbaum
105
]; this technique, applied to the backside of the beam splitter, would further extend the power handling capabilities of these optics. The exact design and optimization of this beam splitter arrangement are subject to further work. In particular, careful design is required to handle the minor reflectivity from the backside AR coatings causing back reflections that can interfere with the main pulse. This would lead to possible pre- and post-pulse generation as well as modulations to the near-field, and is a major challenge in high-intensity lasers with multiple transmissive optical components.
The ARC grating design has undergone extensive damage testing[ Reference Britten 54 , Reference Alessi, Carr, Hackel, Negres, Stanion, Fair, Cross, Nissen, Luthi, Guss, Britten, Gourdin and Haefner 55 ]. For longevity of the grating, actual operational fluence should not occur at the LIDT, but at a much lower fluence where damage is statistically unlikely. On the ARC design the operational fluence was set at the point where a 10–4 fraction of the beam causes damage. Extrapolating the grating damage threshold trend, we estimate that the MLD gratings can handle approximately 1 J/cm2 at 100 fs. With a final beamlet size of 18.5 cm × 37 cm each can have a maximum energy of approximately 685 J to stay below the grating damage threshold. With an estimated grating efficiency of approximately 97.5% the extracted approximately 25.1 kJ will be reduced to approximately 21.6 kJ after the sixth grating. Splitting the pulse into 36 beamlets, the fluence on the final grating, G6, will be approximately 600 J and below the operational fluence limit.
Phasing the 36 identical beamlets together is carried out by an appropriate focusing arrangement. In 2014, Gonoskov et al. [ Reference Gonoskov, Bashinov, Gonoskov, Harvey, Ilderton, Kim, Marklund, Mourou and Sergeev 56 ] presented a technique called anomalous radiative trapping (ART) where multiple ultra-high-intensity beams are focused together to approximate an electric dipole. In this simulation they showed that a 200-PW laser split into multiple channels can reach a focused intensity greater than 1026 W/cm2. While this setup would provide the theoretical maximum focused field intensity, it has yet to be experimentally demonstrated. Here we examine a more traditional focusing arrangement, shown in Figure 17, where a large-aperture parabolic mirror is created by tiling together multiple, smaller individual mirror segments. This technique has already been put into practice by the large-aperture telescope community[ Reference Trumper, Hallibert, Arenberg, Kunieda, Guyon, Stahl and Kim 59 ]. The telescope tiled mirror segments have been produced at the meter scale with clear apertures of approximately 98%[ Reference Martin, Allen, Burge, Davis, Davison, Johns, Kim, Kingsley, Law, Lutz, Strittmatter, Su, Tuell, West and Zhou 106 ]. Each beamlet is focused by an individual mirror segment of modest f-number, that when tiled together produces a low f-number parabolic mirror. Phasing now becomes a three degree-of-freedom issue needing, in principle, approximately 100 nm of accuracy for alignment instead of the five degree-of-freedom problem with 10 nm of accuracy needed for tiling multiple gratings together[ Reference Cong, Qi, Xu, Qiao, Mi, Li, Yu, Zhahng, Yu and Bayanheshig 36 – Reference Cotel, Castaing, Pichon and Le Blanc 38 ].
(a) Near-field distribution of the 36 beamlets prior to focusing. (b) Rendering of the tiled parabolic focusing mirror for Nexawatt.
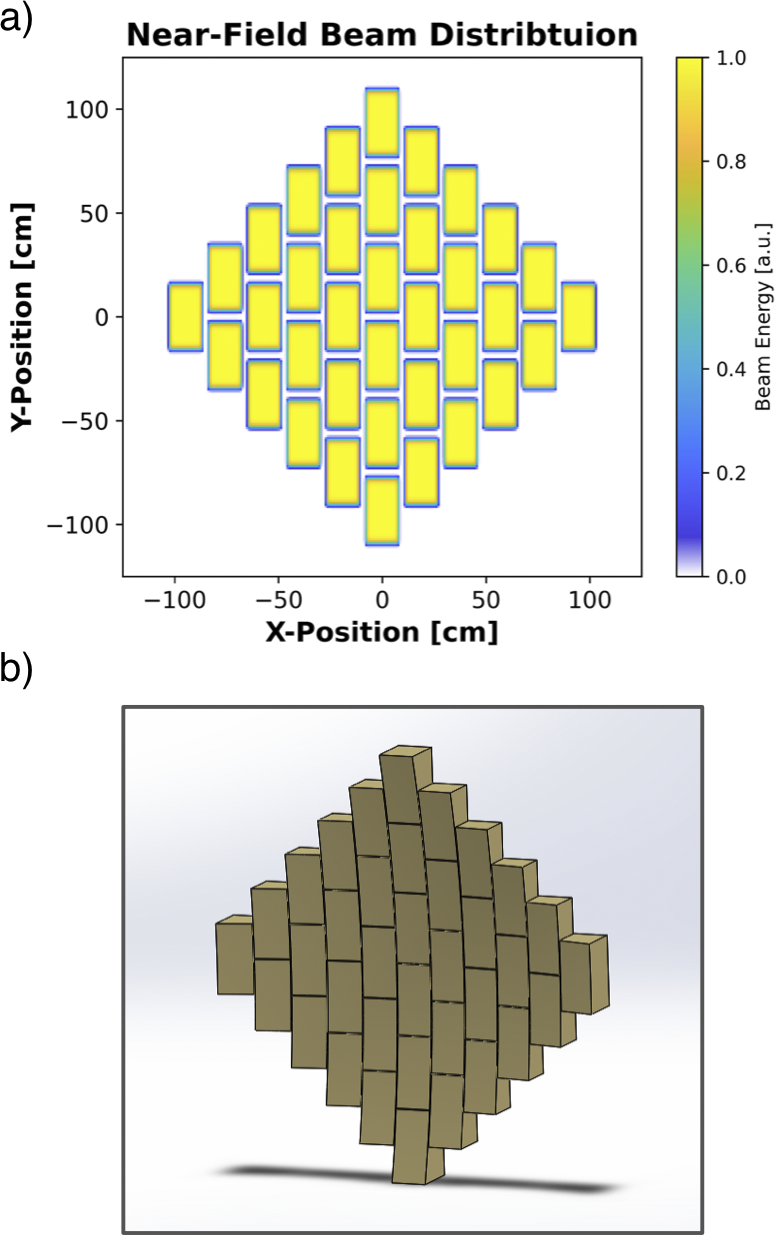
A custom beam propagation script was written in Python[ Reference Van Rossum and Drake 81 ] to evaluate the tiled parabolic mirror as a focusing system for the Nexawatt laser. The fields are defined before the focusing optic and propagated to the focus using Rayleigh–Sommerfeld propagation[ Reference Voelz 107 ]. The Bluestein method[ Reference Hu, Wang, Wang, Ji, Zhang, Li, Zhu, Wu and Chu 108 ] is used for calculating the numerical Fourier transforms, which allows for an arbitrarily sampled input and focal plane, relaxing the computational requirements for simulating very low f-number focusing systems. In this model the 36 mirror segments are spaced 5 mm apart, each with an aperture of 19 cm × 38.5 cm. The tiled parabolic mirror assembly is set to a focal length of 198.5 cm, giving an effective f-number of 0.95 in the horizontal dimension and 0.89 in the vertical dimension. The f-numbers of the individual segments are much more modest, with 10.6 in the horizontal dimension and 5.6 in the vertical dimension. This focusing system, with the input beam spatial profile shown in Figure 17(a), produces the far-field distribution shown in Figure 18(a). The focal spot has a 1/e2 width of 3.41 μm in both the x-axis and y-axis, and a peak intensity exceeding 1 × 1025 W/cm2 – two orders of magnitude beyond the current record.
Beam intensity at the focus of the tiled on-axis parabolic mirror showing the (a) far-field intensity distribution, (b) the cross-section at the center in the X-direction and (c) the cross-section at the center in the Y-direction.
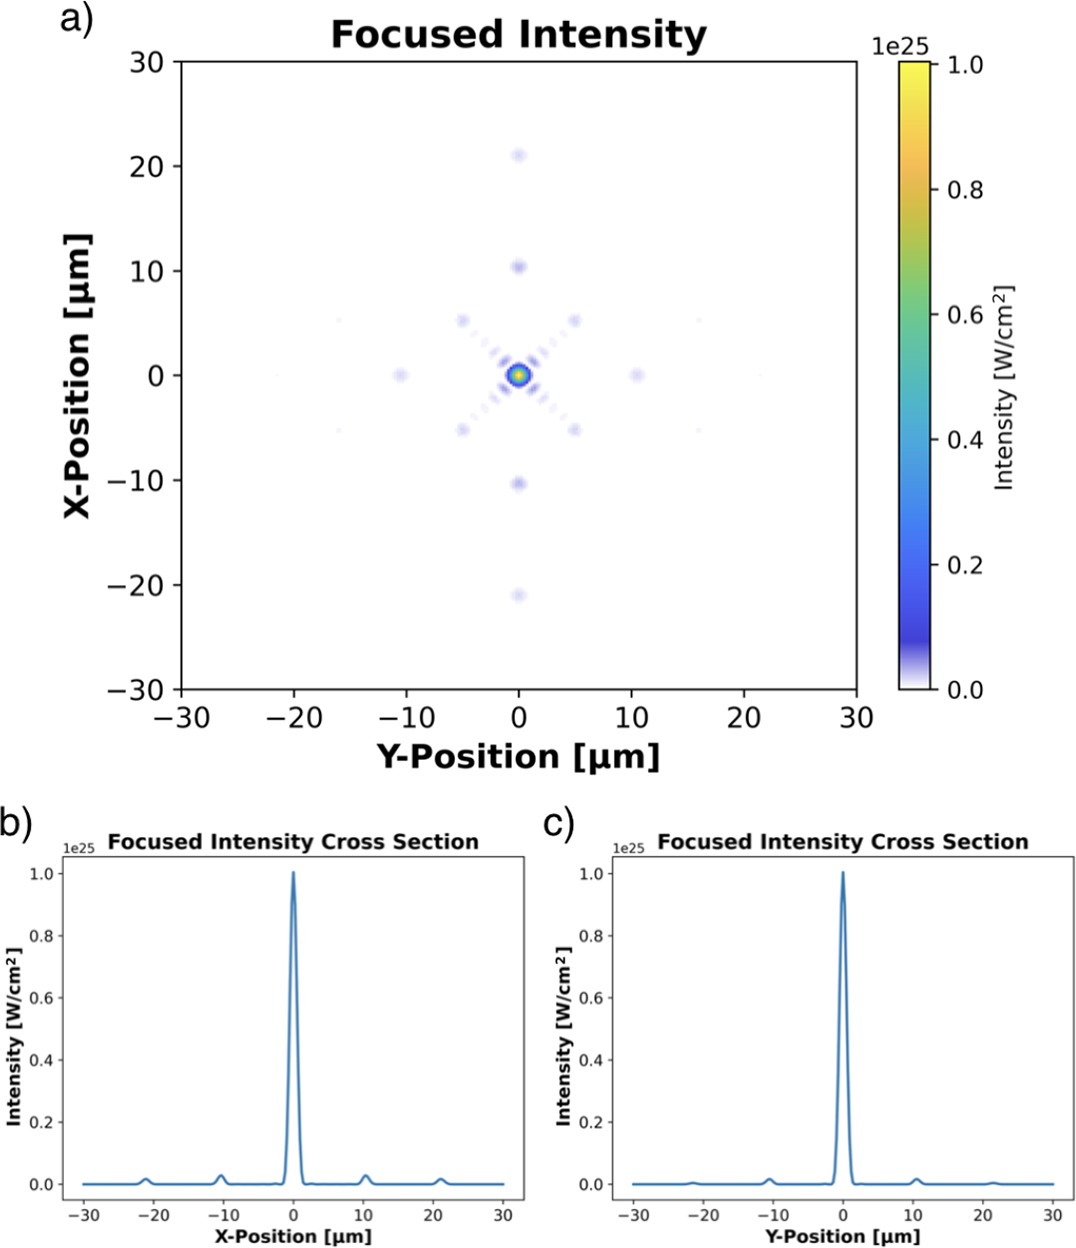
In laser–matter experiments, solid targets can begin generating a pre-plasma at intensities from 1010 to 1013 W/cm2, and some research suggests pre-pulses as low as 108–109 W/cm2 can have significant effects[ Reference Wharton, Boley, Komashko, Rubenchik, Zweiback, Crane, Hays, Cowan and Ditmire 109 ]. With a focused intensity of 1025 W/cm2 this calls for the temporal contrast of the pulse to be from 10–12 to 10–17 W/cm2. Considerable research into improving the temporal contrast of ultra-high-intensity lasers has resulted in current PW laser systems operating with a picosecond pedestal contrast of 1010–1012 W/cm2 [ Reference Chalus, Derycke, Charbonneau, Pasternak, Ricaud, Fischer, Scutelnic, Gaul, Korn, Norbaev, Popa, Vasescu, Toma, Cojocaru and Dancus 110 – Reference Kiriyama, Miyasaka, Kon, Nishiuchi, Sagisaka, Sasao, Pirozhkov, Fukuda, Ogura, Kondo, Nakanii, Mashiba, Dover, Chang, Kando, Bock, Ziegler, Püschel, Schlenvoigt, Zeil and Schramm 112 ]. Incorporation of a plasma mirror has improved the contrast of the J-KAREN-P PW laser to an estimated value 1015 [ Reference Kiriyama, Miyasaka, Kon, Nishiuchi, Sagisaka, Sasao, Pirozhkov, Fukuda, Ogura, Kondo, Nakanii, Mashiba, Dover, Chang, Kando, Bock, Ziegler, Püschel, Schlenvoigt, Zeil and Schramm 112 ], while the CoReLs 4-PW laser has reported a contrast of 1017 using a double plasma mirror[ Reference Choi, Jeon, Lee, Kim, Kim, Kim, Lee, Yoon, Sung, Lee and Nam 113 ]. Moving toward an exawatt-class laser will require careful consideration of all pre- and post-pulse sources, as well as an extension of existing, and new, temporal pulse contrast enhancement techniques.
In the tiled parabolic mirror array, each mirror segment will be positioned using three piezo-electric actuators on the rear allowing for adjustments to the tip, tilt and piston. The challenge of co-phasing the individual segments together to create the desired, ideal mirror shape is identical to that for large-aperture telescopes. To address this issue, multiple co-phasing techniques have been developed and employed[ Reference Chanan, Troy and Sirko 114 – Reference Cheetham, Tuthill, Sivaramakrishnan and Lloyd 116 ]. In particular, a technique called Fizeau interferometric co-phasing of segmented mirrors (FICSM) has numerically shown the potential to co-phase mirror segments with initial piston errors of 300 μm and tip–tilt error of 0.5 arcseconds to final state with a root mean square (RMS) wavefront error of 3.65 nm and a 0.99997 Strehl ratio for 4-μm light [ Reference Cheetham, Tuthill, Sivaramakrishnan and Lloyd 116 ]. In an experimental demonstration, Cheetham et al. [ Reference Cheetham, Cvetojevic, Norris, Sivaramakrishnan and Tuthill 117 ] co-phased 18 mirror segments to an RMS wavefront error of 25 nm and a Strehl ratio of 94%. These co-phasing procedures are considered in the active optics class and not the adaptive optics class, meaning they cannot quickly respond to misalignments. An error analysis on the tip, tilt and piston of the tiled parabolic mirror arrangement has been performed to better understand the sensitivity for ultra-high-intensity focusing.
Any random source of error will have a normal distribution. To simulate this, we generate a list of 36 different alignment errors from a Gaussian distribution, centered at zero, with a set error standard deviation. For the piston error this was done using a mirror displacement value, while for tip and tilt an angular error was used. Each of the 36 mirror segments is assigned a value from the error distribution in the ray trace model and the focused intensity is calculated. An example of an error distribution for a piston error with a standard deviation of 40 nm is shown in Figure 19(b). Each standard deviation value is repeated 10 times (i.e., 10 different actuator error lists per standard deviation) in the ray trace code, recording the peak-focused intensity each time, to account for the statistical nature of the error. Figure 19(a) shows the reduction in focused intensity with increasing piston error distribution standard deviation. A standard deviation of 40 nm, with an average RMS error of 38.1 nm, resulted in an average focused intensity error of 5%.
(a) Piston error effect on focused intensity. Error bars represent the standard deviation of the focused intensity for the 10 runs at a particular piston error standard deviation distribution. (b) Example of a randomly distributed piston actuator error for the 36 mirror segments with a 40-nm standard deviation.
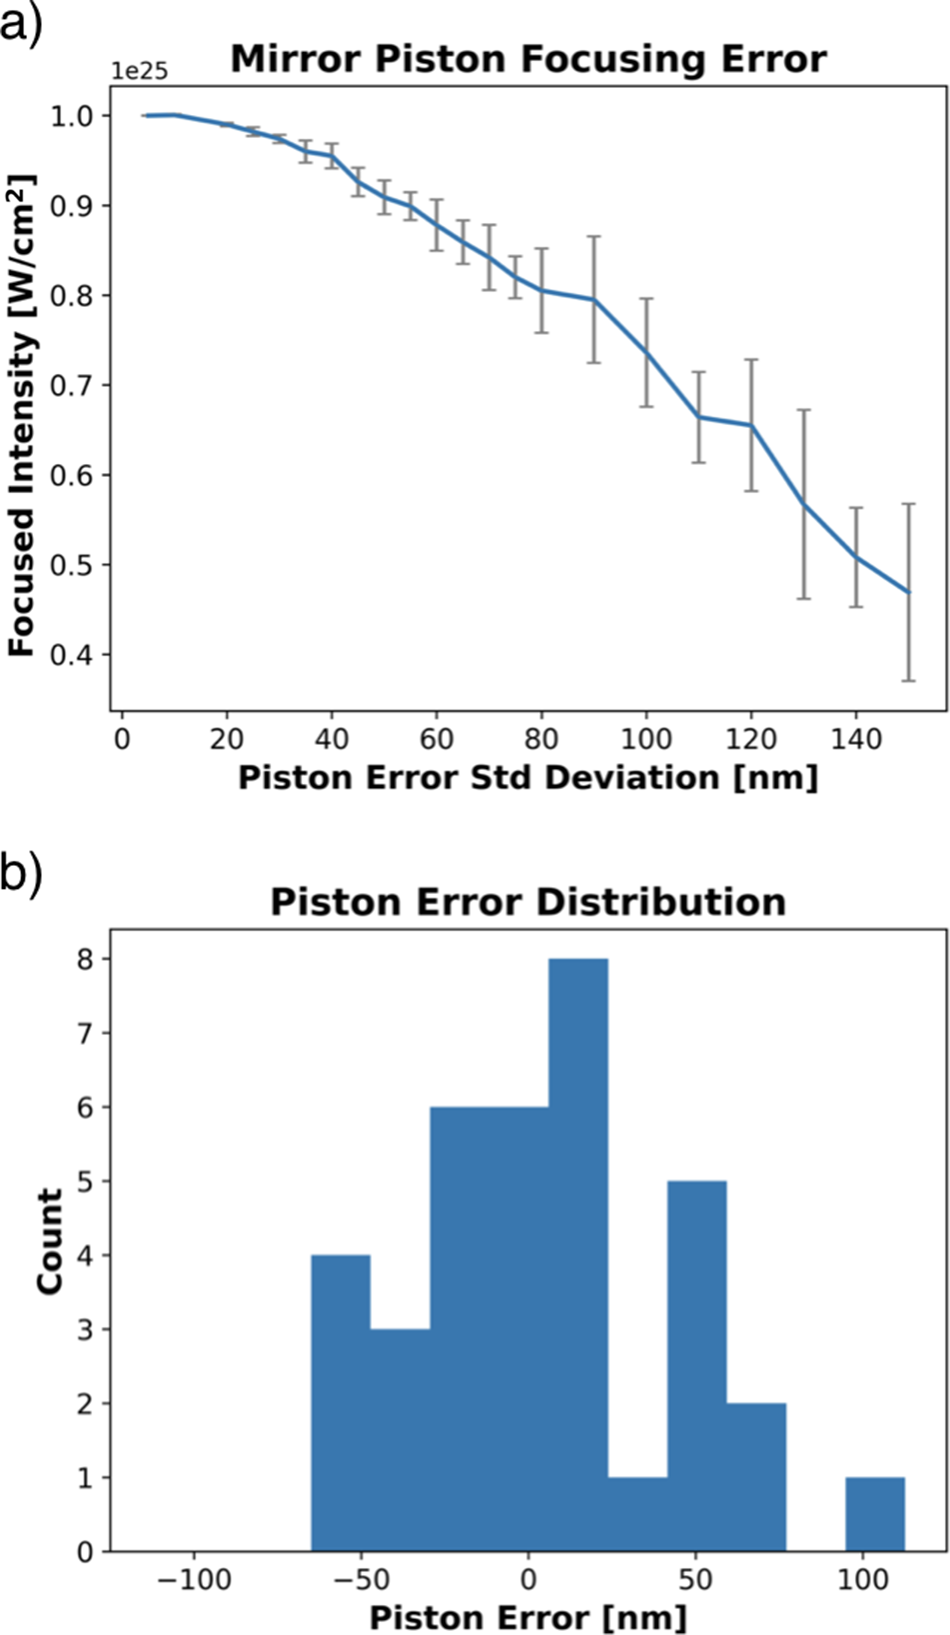
The tip–tilt error was analyzed using a similar method, except an angular error of the order of μrad was used. Here, the tip corresponds to rotation about the x-axis of the mirror (i.e., the longer dimension of the mirror is rotated) while the tilt corresponds to rotation about the y-axis of the mirror (i.e., the shorter dimension of the mirror was rotated). The effect of tip–tilt error on focused intensity is shown in Figure 20. For the tip error, an error standard deviation distribution of 0.4 μrad resulted in a 5% decrease in peak-focused intensity, while for the tilt error this was 0.9 μrad. The difference between the two is due to the f-number difference for the different mirror axes. However, if the pointing error is caused by actuator displacements this result should be the same for the two axes since the actuator displacement for the horizontal tilt will produce twice the angular deviation of the tip due to the length difference to the pivot point.
Tip–tilt error effect on the focused intensity. Error bars represent the standard deviation of the focused intensity for the 10 runs at a particular tip or tilt error standard deviation distribution.
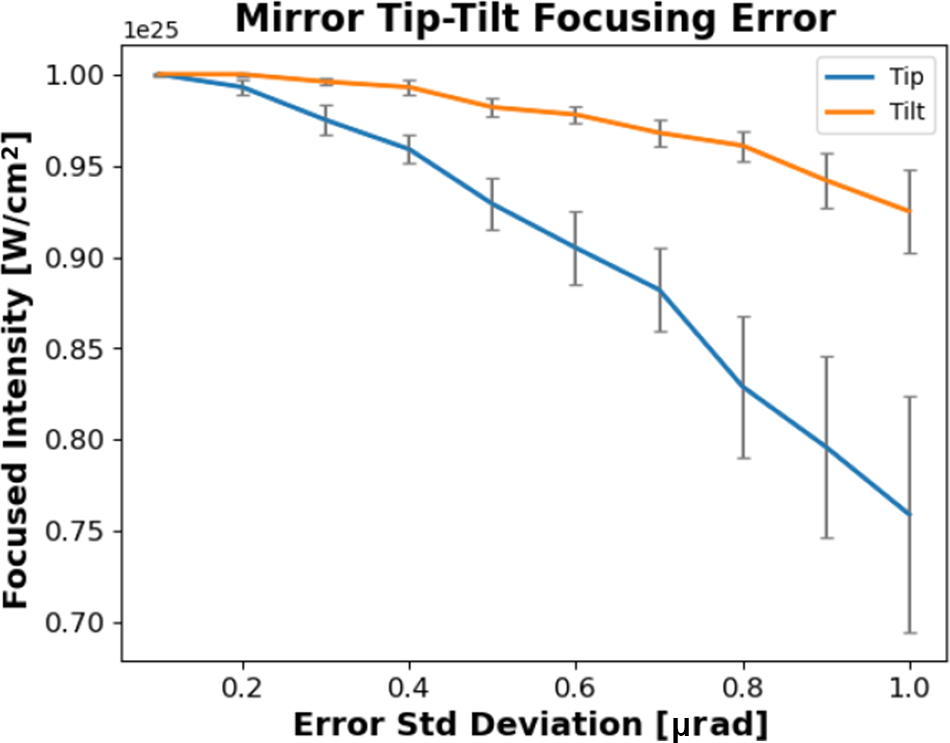
7 Conclusion
7.1 Technical challenges
Extending ultra-high power lasers into the exawatt-class regime poses a number of technical and economic challenges. With the current 10-PW bottleneck on single-aperture beamlines, any exawatt-class laser is likely to be a multi-beam, national-facility-scale system with cost of multi-billions of dollars. In this paper we have argued that the best route for an exawatt-class laser to achieve an ultra-high-intensity focus, in excess of 1025 W/cm2, is for the pulse to be amplified in a single-aperture beamline, split into multiple identical beamlets prior to final compression to avoid damage on the final optic, then focused using a tiled parabolic mirror – this is, in essence, CPJBA. While we believe this route has a number of advantages, there are a number of technical challenges that need to be addressed.
CPJBA is unique in its propagation and amplification of a spatially chirped beam, and there are several technical risks associated with that which will need to be resolved. Controlled amplification of a spatially chirped beam has not yet been demonstrated and is subject to further research. While spatial and spectral shaping of the input pulse to a large-aperture Nd:glass amplifier and spatial gain shaping via modification of the pump distribution have been demonstrated at the NIF[ Reference Spaeth, Manes, Kalantar, Miller, Heebner, Bliss, Spec, Parham, Whitman, Wegner, Baisden, Menapace, Bowers, Cohen, Suratwala, Di Nicola, Newton, Adams, Trenholme, Finucane, Bonanno, Rardin, Arnold, Dixit, Erbert, Erlandson, Fair, Feigenbaum, Gourdin, Hawley, Honig, House, Jancaitis, LaFortune, Larson, Le Galloudec, Lindl, MacGowan, Marshall, McCandless, McCracken, Montesanti, Moses, Nostrand, Pryatel, Roberts, Rodriguez, Rowe, Sacks, Salmon, Shaw, Sommer, Stolz, Tietbohl, Widmayer and Zacharias 67 , Reference Heebner, Borden, Miller, Hunter, Christensen, Scanlan, Hayman, Wegner, Hermann, Brunton, Tse, Awwal, Wong, Seppala, Franks, Marley, Williams, Budge, Henesian and Dinicola 72 ], the precision and depth of the sculpting called for in this paper need to be shown. In particular, there must be careful consideration of any spatio-temporal couplings that may occur from amplifying a spatially chirped pulse. Research has shown that spectral phase modulations, which form from a spatially chirped pulse interacting with an imperfect surface, can cause temporal pulse contrast degradation that scales with temporal chirp[ Reference Dorrer and Bromage 118 ]. This is particularly pronounced in CPA systems where the cumulative B-integral exceeds 3[ 119 ]. Relatedly, further investigation needs to be done on how a spatial filter would operate with a spatially chirped pulse.
The creation and dispersion management of 36 identical beamlets, through the cascading beam splitter arrangement and separate final grating pairs, requires a significant amount of optical engineering and design. The beam splitters demand large-aperture, high-LIDT, low-dispersion, MLD coatings of varying reflectivity on high-surface-quality substrates with excellent thickness uniformity. While manufacturing and aligning 36 separate meter-scale gratings pairs is a significant feat, it is likely easier than the timing and dispersion management of dozens of separate amplifier beamlines or the alignment of a large-scale tiled grating assembly as put forward in other exawatt-scale laser approaches. Co-phasing of a multi-segment parabolic mirror assembly has been demonstrated by the large-aperture telescope community[ Reference Cheetham, Cvetojevic, Norris, Sivaramakrishnan and Tuthill 117 ]; however, this technology, requiring nanometer-scale precision alignment of multiple large-aperture optics, has not yet been applied to ultrafast lasers. Given most exawatt-scale laser proposals use a multi-beam approach, small-scale demonstration of novel focusing arrangements for coherent beam combining would be very useful for the community.
7.2 Summary and outlook
In 2018 a report released by the National Academies of Sciences, Engineering, and Medicine titled Opportunities in Intense Ultrafast Lasers: Reaching for the Brightest Light [ Reference Falcone, Albert, Beg, Glenzer, Ditmire, Spinka and Zuegel 120 ], followed by a 2019 workshop by the US Department of Energy, sponsored a workshop called Brightest Light Initiative [ Reference Zaïm, Sainte-Marie, Fedeli, Bartoli, Huebl, Leblanc, Vay and Vincenti 121 ], which highlighted the significant next-generation applications and science enabled by intense ultrafast lasers. In particular, these reports emphasize the need to go beyond current 10-PW laser systems toward a user facility capable of 100-PW peak powers that is co-located with a high-energy particle source. This paper has presented an exawatt-class laser architecture, based on simultaneously spatially and temporally chirped-beam pulses, that could produce 200-PW pulses from a single beamline of a NIF-like laser amplifier and addresses the technology needed to achieve it.
Beyond technical feasibility, for exawatt-scale laser systems the economics becomes a major limiting factor. Here, the Nexawatt laser has several advantages over the other routes to exawatt peak power. Firstly, regarding energetics, the Nexawatt laser requires only a single direct-diode-pumped, multi-kJ amplifier beamline. This is contrasted with the multi-10-PW coherently combined Ti:sapphire and OPCPA approaches, which both require a multi-kJ, 1-μm laser that is frequency doubled ( $\sim$
60%–70% conversion efficiency) to pump the amplifier[
Reference Mourou, Georg, Sander and Collier
28
]. In the case of OPCPA, the optical-to-optical efficiency is further decreased due to the approximately 40% efficiency of the optical parametric amplification process. Single-aperture Nd:glass based on traditional CPA has significantly larger compressor requirements for equivalent stretched pulse durations; assuming the same grating design being used for the same damage-limited fluence, a 0.2-EW laser system compressing a 20-ns stretched pulse down to 100 fs based on traditional CPA requires a total grating area of 110,000,000 cm2, while the total grating area for CPJBA is 37,440,000 cm2.
$\sim$
60%–70% conversion efficiency) to pump the amplifier[
Reference Mourou, Georg, Sander and Collier
28
]. In the case of OPCPA, the optical-to-optical efficiency is further decreased due to the approximately 40% efficiency of the optical parametric amplification process. Single-aperture Nd:glass based on traditional CPA has significantly larger compressor requirements for equivalent stretched pulse durations; assuming the same grating design being used for the same damage-limited fluence, a 0.2-EW laser system compressing a 20-ns stretched pulse down to 100 fs based on traditional CPA requires a total grating area of 110,000,000 cm2, while the total grating area for CPJBA is 37,440,000 cm2.
In addition to the increase of material, scaling up to exawatt class, one must consider the increased system complexity and its inherent cost. A major component of this is the number of control points needed for adaptive optics to correct wavefront aberrations post-amplification; this scales with both the number of amplifier beamlines needed and aperture size. Here, CPJBA benefits from the use of a single amplifier aperture and the decreased number of gratings required compared to traditional CPA. For the tiled grating approach, each grating has five degrees-of-freedom requiring alignment precision of approximately 10 nm[ Reference Yang, Qi, Mi, Zhang, Yu, Yu, Li and Yang 37 , Reference Cotel, Castaing, Pichon and Le Blanc 38 ]. With an exawatt-scale laser requiring 110, 2-m aperture tiled gratings this equates to 550 control points for the compressor assembly alone. Contrast this with the chirped-beam compressor of Nexawatt, which contains a total of 76 gratings that do not need to be coherently tiled together. This setup only needs tip–tilt control on the gratings, requiring 152 control points, and inherently has a lower system complexity. For multi-10-PW coherently combined beamlines, each individual amplifier will need an independent wavefront correction. At ELI-NP’s 10-PW beamline this is accomplished using a 180-mm diameter deformable mirror with 58 actuators[ Reference Lureau, Matras, Chalus, Derycke, Morbieu, Radier, Casagrande, Laux, Ricaud, Rey, Pellegrina, Richard, Boudjemaa, Simon-Boisson, Baleanu, Banici, Gradinariu, Caldararu, Boisdeffre, Ghenuche, Naziru, Kolliopoulos, Neagu, Dabu, Dancus and Ursescu 17 ]; to reach 0.2 EW would require 20 of these beamlines for a total of 1160 control points. For the Nexawatt system there is a single amplifier, and a single deformable mirror is needed to correct for wavefront distortions accumulated during amplification. In addition, each beamline has a four-grating compressor for a total of 80 gratings with 160 control points associated.
The generalized architecture presented here illustrates how a single aperture NIF-like beamline, when combined with CPJBA, could possibly produce a 0.2-EW peak-power laser using currently available laser technology. Specifically, we have shown how to (i) create an approximately 20-ns stretched pulse from a 100-fs FTL seed pulse with a novel regenerative stretcher, (ii) amplify the approximately 20-ns chirped-beam pulse to more than or equal to 25 kJ while maintaining bandwidth and a B-integral of less than or equal to 5, (iii) compress the approximately 20-ns chirped-beam pulse to 100 fs using a maximum grating aperture of 2 m, (iv) split the chirped-beam pulse into 36 identical beam copies to avoid final optic damage and then (v) co-phase them together using a tiled parabolic mirror array. A numerical model of the direct amplification of a chirped-beam pulse in a large-aperture Nd:glass, NIF-like amplifier showcased the pulse distortions unique to CPJBA and a highly temporally stretched pulse. With this we were able to determine the sculpting required of both the input pulse spatio-temporal distribution and the spatial distribution of the stored energy fluence in the amplifier needed to achieve the ideal amplified spatio-temporal pulse distribution to be compressed by the novel six-grating chirped-beam compressor. A custom beam propagation script, based on the Bluestein method[ Reference Hu, Wang, Wang, Ji, Zhang, Li, Zhu, Wu and Chu 108 ], showed that a tiled parabolic mirror focusing arrangement could focus the approximately 0.2 EW output of this laser to an intensity in excess of 1025 W/cm2.
While this paper has focused on the large-aperture Nd:glass laser system, other amplifier systems can utilize the benefits of CPJBA as well. In particular, an OPCPA system pumped by a multi-ns, multi-kJ Nd:glass laser may be able to produce an amplified beam with a 2× spatial chirp and the necessary bandwidth for less than or equal to 100-fs pulse durations. Due to the different gain mechanism in OPCPA lasers this could possibly lessen the sculpting requirements on the input seed pulse. Another way to view the Nexawatt laser is as 36 separate identical, approximately 5.5-PW beamlines that can be coherently combined or arranged in a variety of focusing configurations. This system inherently lends itself to multi-beam focusing arrangements such as dipole focusing[ Reference Gonoskov, Bashinov, Gonoskov, Harvey, Ilderton, Kim, Marklund, Mourou and Sergeev 56 ], which represents the theoretical maximum of focused intensity for a given laser power. Flexibility in the far-field distribution should be required in any next-generation ultra-high-intensity laser system of this scale to enable new experimental designs and applications. One can envision a subset of the 36 beams used to drive a high-energy particle source, while the other subset generates an ultra-high-intensity field for interaction. Recently, significant theoretical and modeling work has examined multi-beam, multi-source experiments as a route to study strong-field QED and probe light–matter interaction near the Schwinger limit[ Reference Magnusson, Gonoskov, Marklund, Esirkepov, Koga, Kondo, Kando, Bulanov, Korn, Geddes, Schroeder, Esarey and Bulanov 57 , Reference Schimpf, Ruchert, Nodop, Limpert, Tünnermann and Salin 122 ].
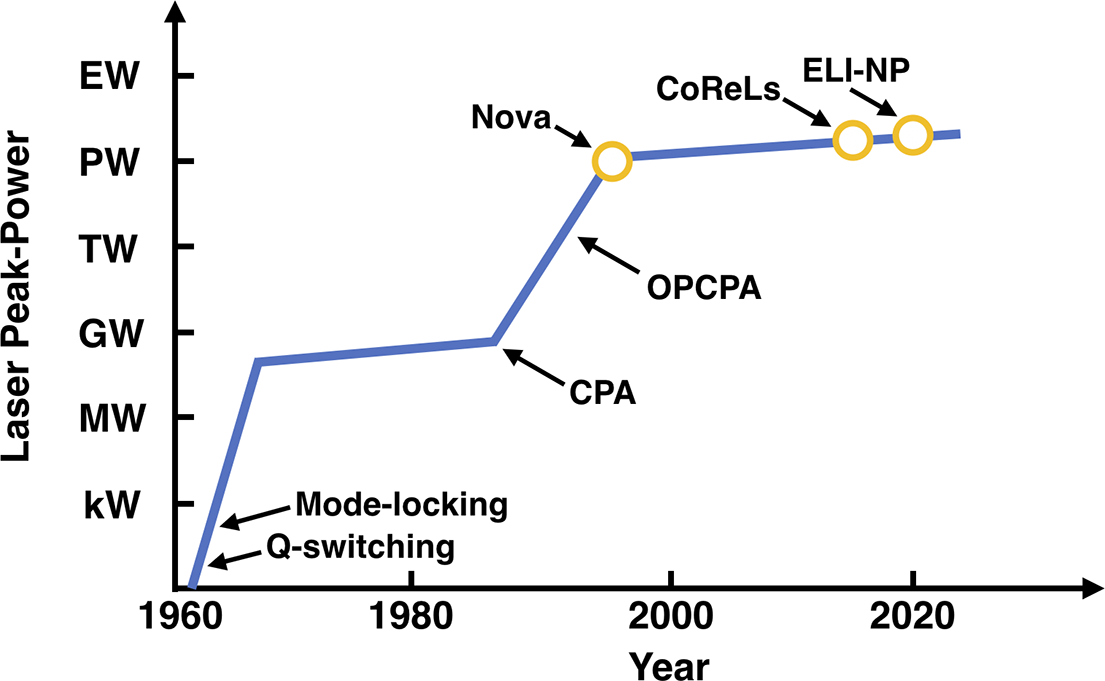
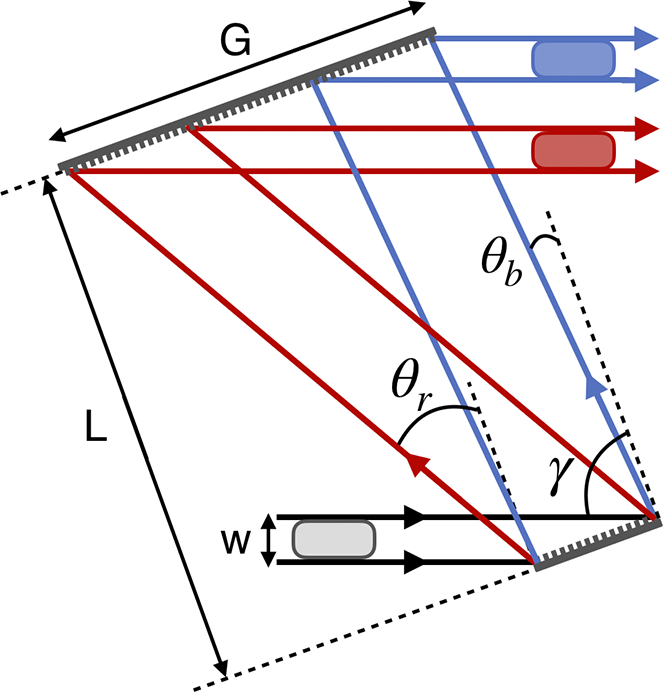
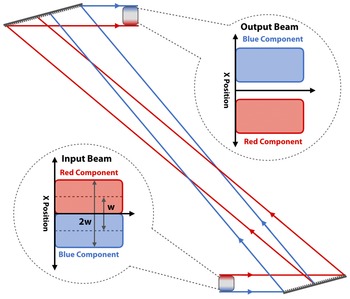

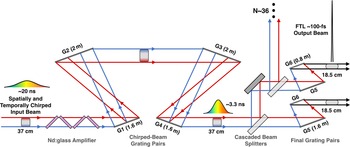
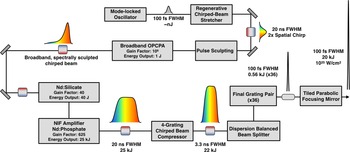

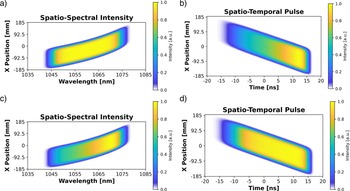
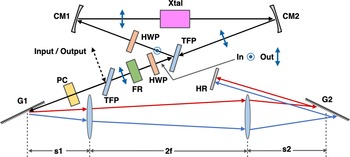
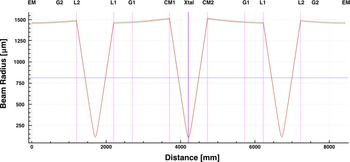
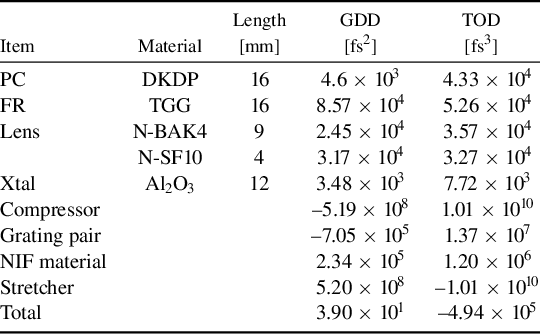


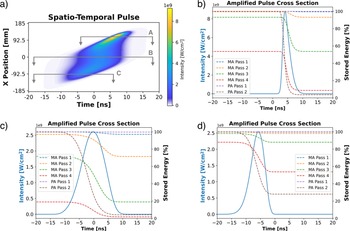


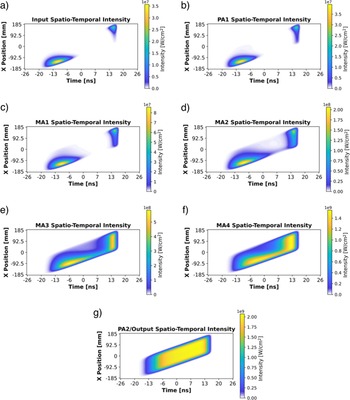
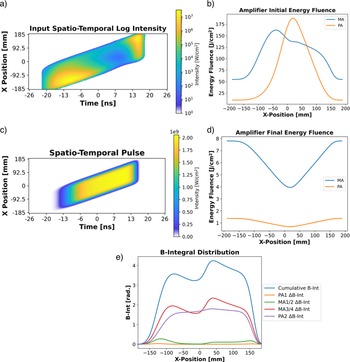
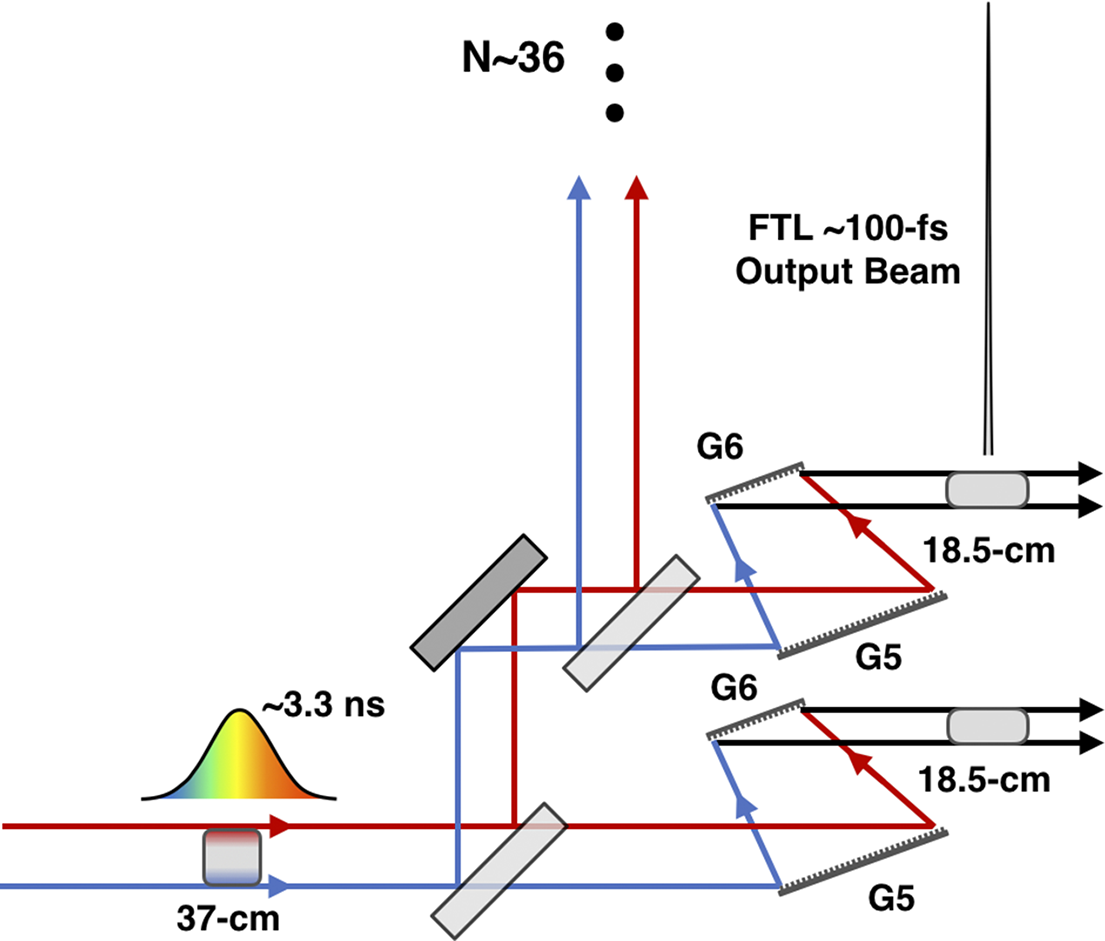
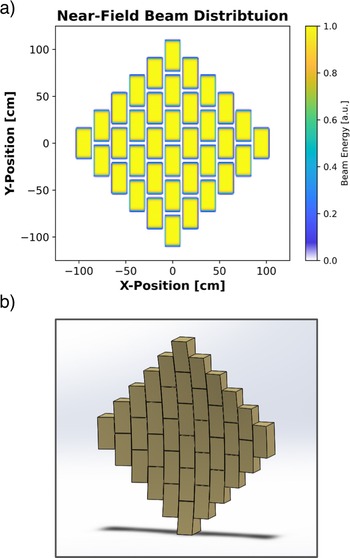
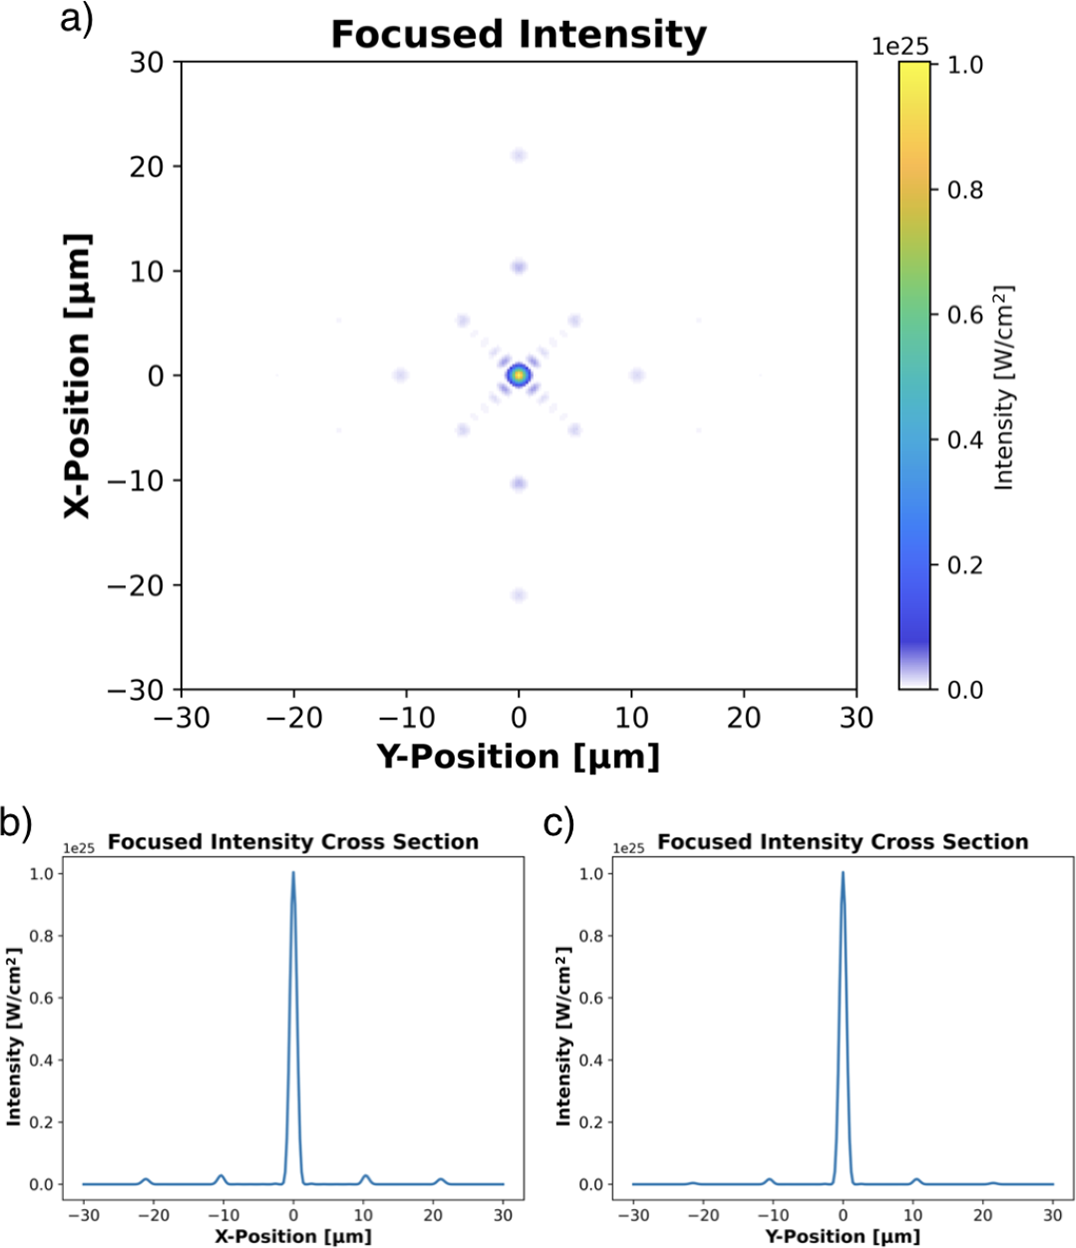
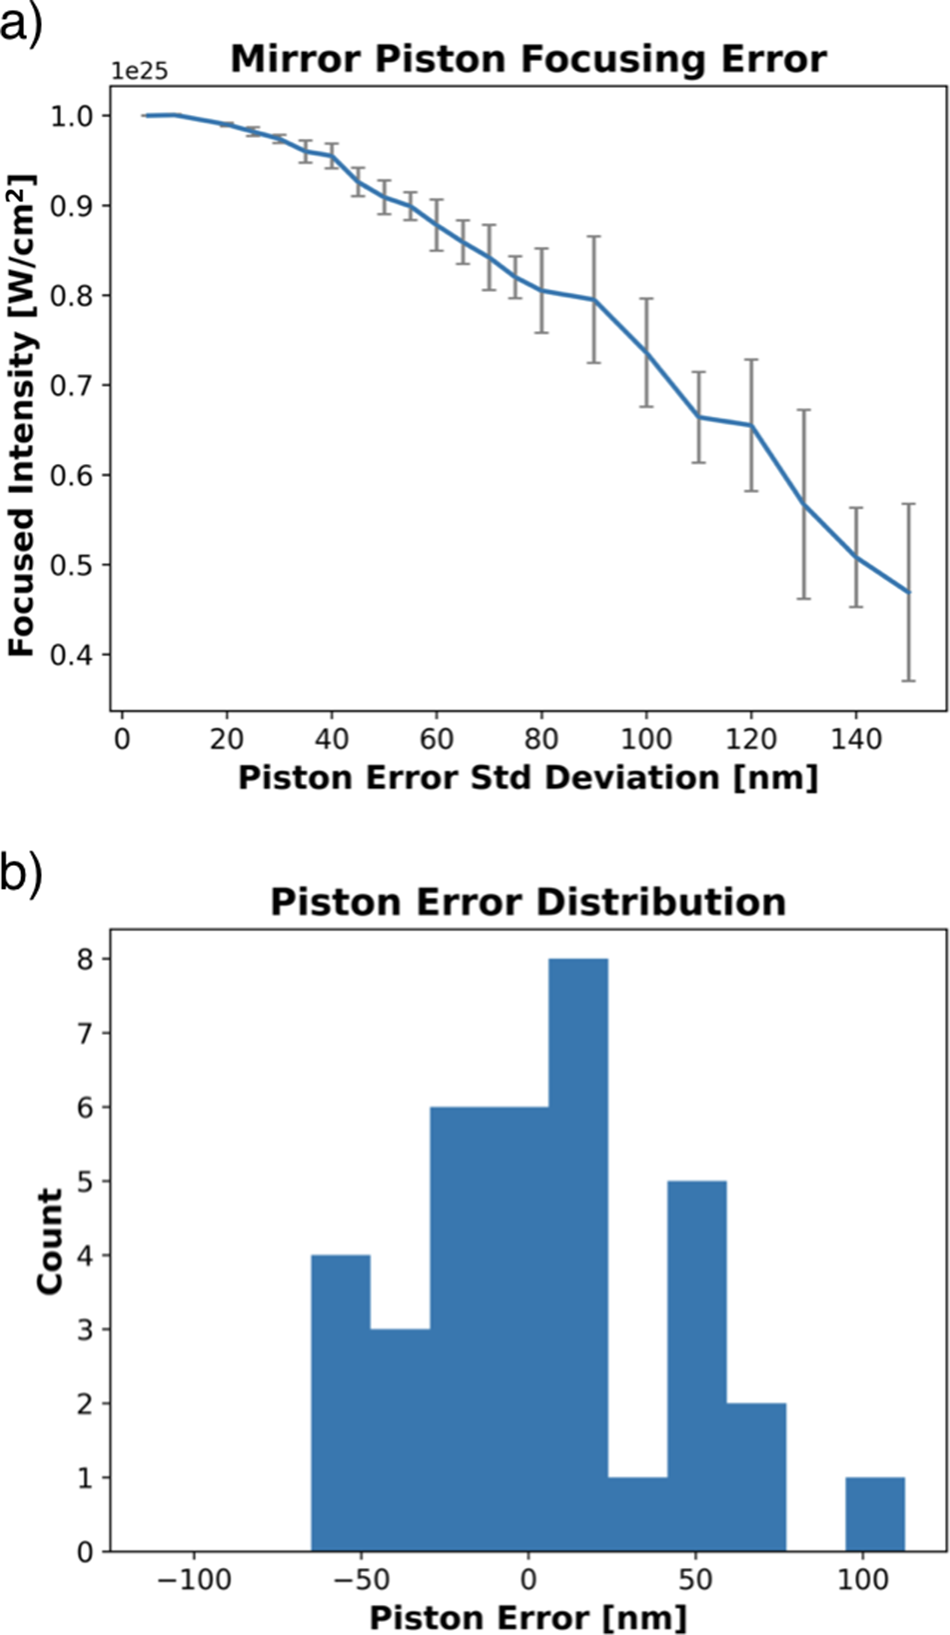
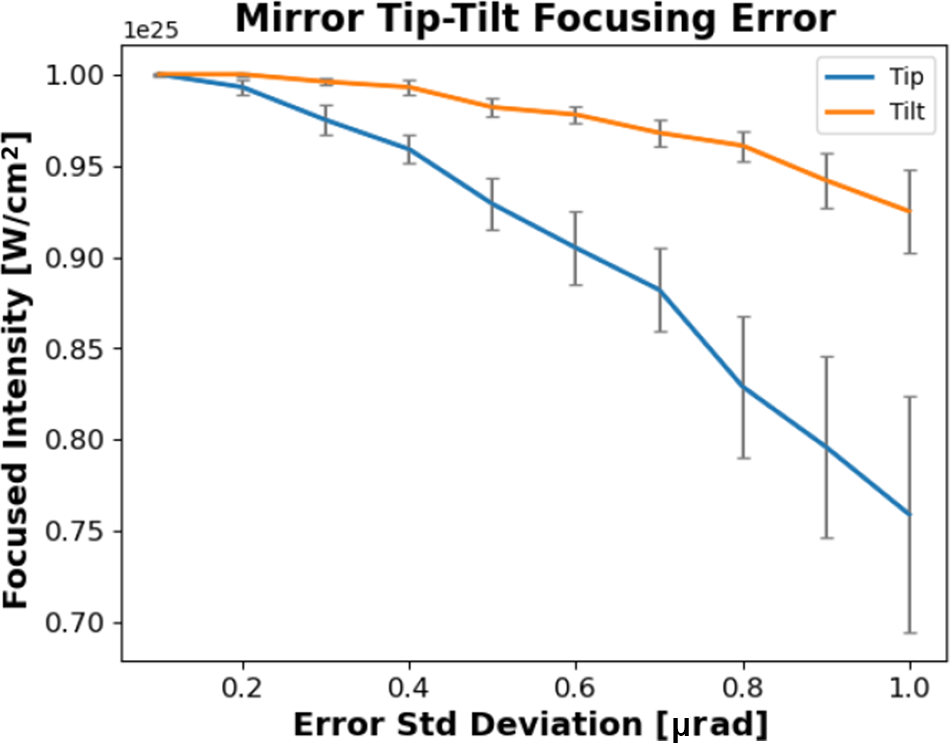

 Open access

