

Areal bone mineral density (aBMD) is known to temporarily decrease during lactation( Reference Drinkwater and Chesnut 1 – Reference Brembeck, Lorentzon and Ohlsson 11 ). About 200–400 mg Ca is required for breast milk production per day( Reference Laskey, Prentice and Hanratty 3 ). The largest decreases postpartum in aBMD (approximately 2–6 %) are found at the lumbar spine and femoral neck( Reference Drinkwater and Chesnut 1 – Reference Holmberg-Marttila, Sievanen and Tuimala 4 , Reference Karlsson, Obrant and Karlsson 7 , Reference Möller, Vieth Streym and Mosekilde 10 , Reference Brembeck, Lorentzon and Ohlsson 11 ). Previous studies have also demonstrated a relationship between longer duration of lactation and larger decreases in aBMD( Reference Sowers, Corton and Shapiro 2 , Reference Laskey, Prentice and Hanratty 3 , Reference Laskey and Prentice 5 , Reference Karlsson, Obrant and Karlsson 7 – Reference Brembeck, Lorentzon and Ohlsson 11 ). In addition, it has been found that the decrease in aBMD at the lumbar spine occurs early postpartum among lactating women, whereas for women with long duration of lactation the decrease has been observed in femoral neck aBMD a few months later( Reference Hopkinson, Butte and Ellis 6 , Reference Karlsson, Obrant and Karlsson 7 , Reference Möller, Vieth Streym and Mosekilde 10 , Reference Brembeck, Lorentzon and Ohlsson 11 ). This has led to the assumption that decreases in aBMD initially occur in the trabecular-rich bones. However, women with extended duration of lactation show a later decrease in aBMD in cortical-rich bones.
Most previous studies have used dual-energy X-ray absorptiometry (DXA) to study skeletal changes postpartum, and have thus reported aBMD( Reference Sowers, Corton and Shapiro 2 , Reference Laskey, Prentice and Hanratty 3 , Reference Karlsson, Obrant and Karlsson 7 , Reference Möller, Vieth Streym and Mosekilde 10 , Reference Brembeck, Lorentzon and Ohlsson 11 ). However, there are indications that high-resolution peripheral quantitative computed tomography (HR-pQCT) may detect small changes not detectable by DXA( Reference Melton, Riggs and van Lenthe 12 ). Furthermore, HR-pQCT measures volumetric bone mineral density (vBMD), distinguishes between cortical and trabecular bone and provides additional information about microstructural changes such as trabecular thickness and dimensional changes such as cortical thickness( Reference Melton, Riggs and van Lenthe 12 ). We have recently shown in the BUGA (Benmetabolism Under Graviditet och Amning; Bone Metabolism During Pregnancy and Lactation) study that in women lactating 4 months or longer cortical vBMD and cortical thickness at ultra-distal tibia decreased significantly during the first 12 months postpartum( Reference Brembeck, Lorentzon and Ohlsson 11 ). In women lactating for less than 4 months, no significant decreases were found in these bone variables during the first 18 months postpartum.
At the end of lactation or after weaning, most studies show a recovery of aBMD( Reference Krebs, Reidinger and Robertson 13 – Reference Polatti, Capuzzo and Viazzo 15 , Reference Möller, Vieth Streym and Mosekilde 10 , Reference Brembeck, Lorentzon and Ohlsson 11 ). However, it is still not clear whether the skeleton fully recovers at all skeletal sites, nor whether it fully recovers in women with extended lactation( Reference Affinito, Tommaselli and di Carlo 16 ). Affinito et al.( Reference Affinito, Tommaselli and di Carlo 16 ) reported incomplete recovery of aBMD at the lumbar spine at 6 months after lactation cessation. In the BUGA study, we have shown that for women lactating 9 months or longer, cortical vBMD and trabecular thickness at ultra-distal tibia were still significantly lower at 18 months postpartum compared with shortly after delivery( Reference Brembeck, Lorentzon and Ohlsson 11 ). Besides lactation, determinants of changes in aBMD postpartum have rarely been studied and determinants of changes in vBMD, microstructural and dimensional bone parameters postpartum have not been studied at all. Vitamin D is known to increase intestinal Ca uptake, Ca resorption from the skeleton and Ca resorption from the kidneys( Reference Holick 17 ). Investigations of associations between maternal vitamin D intake and aBMD postpartum are rare( Reference Krebs, Reidinger and Robertson 13 ). Krebs et al.( Reference Krebs, Reidinger and Robertson 13 ) found no association between dietary vitamin D intake and lumbar spine or mid-radius aBMD postpartum. We are unaware of any previous study that has investigated the relationship between vitamin D status (as assessed by the biochemical marker 25-hydroxyvitamin D (25OHD) in serum or plasma) and changes in aBMD, vBMD or microstructural and dimensional bone parameters during lactation.
Most studies investigating the relation between Ca intake and changes in aBMD postpartum found no relationship between these parameters( Reference Sowers, Corton and Shapiro 2 , Reference Kolthoff, Eiken and Kristensen 14 , Reference Laskey, Prentice and Hanratty 3 ). In contrast, Krebs et al.( Reference Krebs, Reidinger and Robertson 13 ) found a positive association between total dietary Ca intake and lumbar spine aBMD postpartum. Higher body weight has previously been associated with smaller changes in aBMD at various skeletal sites during pregnancy( Reference Olausson, Laskey and Goldberg 18 ). However, no association between body weight or change in body weight and changes in proximal femur and lumbar spine aBMD has been found postpartum( Reference Sowers, Corton and Shapiro 2 , Reference Kolthoff, Eiken and Kristensen 14 ). Serum oestradiol levels have, however, been positively associated with lumbar spine aBMD postpartum( Reference Krebs, Reidinger and Robertson 13 ). Other factors that have been reported to be inversely associated with decreases in aBMD at various skeletal sites postpartum include parity( Reference Krebs, Reidinger and Robertson 13 , Reference Hopkinson, Butte and Ellis 6 ), maternal height( Reference Laskey, Prentice and Hanratty 3 ) and maternal age( Reference Sowers, Kshirsagar and Crutchfield 19 , Reference Hopkinson, Butte and Ellis 6 ).
Thus, factors determining the skeletal changes postpartum are not fully elucidated. Moreover, there are no other studies investigating determinants of changes in vBMD, microstructural and dimensional parameters postpartum. Thus, within the BUGA study, we aim to investigate determinants of the observed significant changes in aBMD at the lumbar spine, and vBMD as well as microstructural and dimensional parameters at the ultra-distal tibia in women between 2 weeks and 18 months postpartum.
Methods
Subjects
In all, eighty-one pregnant women were recruited to the BUGA study from July 2008 to July 2011 using posters in maternity health care clinics and in public places near Gothenburg, Sweden, and through advertisements on a Swedish webpage addressing pregnant women in western Sweden, as previously described( Reference Brembeck, Winkvist and Bååth 20 ). Inclusion criteria were women within the age range of 25–40 years, and declaring oneself healthy. Exclusion criteria were intake of prescribed medicine known to affect Ca and bone metabolism, recent bone fractures, pregnancy during the past 1·5 years before current pregnancy, miscarriage after week 12 of pregnancy during the past 1·5 years, breast-feeding during the past year before current pregnancy, current twin pregnancy and current development of gestational diabetes or preeclampsia. This study was conducted according to the guidelines laid down in the Declaration of Helsinki( 21 ), and all procedures involving the subjects were approved by the Regional Ethics Committee in Gothenburg and the Swedish Radiation Safety Authority. Written informed consent was obtained from all women.
Study design
All women were invited to visit the Department of Internal Medicine and Clinical Nutrition, University of Gothenburg, Sweden, within 2 weeks after delivery (baseline) and 4, 12 and 18 months after delivery. Venous blood was drawn in the morning after an overnight fast at all visits. Body weight in underwear was measured (Tanita, BWB-800MA; Rex Frederiksbergs Vaegtfabrik) and height was assessed using a standardised wall stadiometer at all visits. At all visits, women were asked about their lactation habits, physical activity level (PAL) and use of oestrogen contraceptives. The changes in vitamin D status postpartum in these women( Reference Brembeck, Winkvist and Bååth 20 ) and the changes in bone variables postpartum( Reference Brembeck, Lorentzon and Ohlsson 11 ) have been reported previously, separately. In this paper, we analyse the determinants (including serum 25OHD and Ca intake) of the observed significant microstructural, dimensional and bone mineral changes postpartum in these women.
Methods
At all visits, bone status was measured at the Osteoporotic Unit at the Geriatric Medicine Clinic, Sahlgrenska University Hospital, Gothenburg, Sweden. Lumbar spine aBMD was measured by DXA (Lunar Prodigy, software version 11.400.004; GE Lunar Corp.). Cortical vBMD and cortical and trabecular thickness were measured at the ultra-distal tibia by HR-pQCT (XtremeCT, software version 5.3; Scanco Medical AG), as previously described( Reference Brembeck, Lorentzon and Ohlsson 11 ). If the woman was lactating, detailed information about lactation habits was collected at all study visits, including number of lactation sessions per day, number and amount of formula feedings per day, date of introduction of solid foods and daily amount of solid foods given. Women were asked to record the date of lactation cessation. Duration of total lactation refers to duration of any type of lactation (full and partial). Duration of full lactation was defined as when ≥90 % of the infants’ daily energy intake came from breast milk. At 4 months, lactation was categorised as full lactation (yes=1) or not (no=0). At 12 and 18 months postpartum, lactation was defined as the following continuous variables: duration of full lactation in months (at 12 months postpartum) and duration of total lactation in months (at 18 months postpartum).
Dietary Ca intake at 4 months postpartum was estimated using 4-d food diaries, as described elsewhere( Reference Brembeck, Winkvist and Olausson 22 ). In brief, women were asked to record all food and drink consumed as precisely as possible on 4 consecutive days with at least 1 non-working day, starting no later than 1 week after the study visit. Both oral and written information were given on how to fill in the food diary. Women were asked to report the amounts of consumed food items using household measures, weight (grams) or using photographs of different portion sizes used in the Swedish portion guide ‘Matmallen’( 23 ). Women were also asked not to change their diet. Women were contacted if any ambiguities were noted in their food diaries. Dietary intake was calculated using DietistXP, version 3.1 (The National Food Agency food database version 2009-11-10; Kost och näringsdata). Details of use, frequency, amount and brand of supplements containing Ca were also requested. For the statistical analyses, total dietary Ca intake was used, including both dietary Ca intake and intake of supplements containing Ca.
Each woman rated her physical activity on a scale between 1 and 10, as previously described( Reference Brembeck, Winkvist and Olausson 22 ). In brief, women were informed that 1 indicated a sedentary lifestyle, 5 a few long walks each week and 10 exercise several times a week. The answer was converted to PAL, where 1 corresponded to PAL 1·3 and 10 to PAL 2·2, respectively. Each step in between represented a 0·1 increase in PAL. In a validation study, PAL assessed using this scale was correlated (r 0·54; P=0·008) with corresponding estimates obtained using criterion methods (i.e. the doubly labelled water method in combination with indirect calorimetry) in twenty-two healthy Swedish pregnant women (Marie Löf, personal communication).
Laboratory analyses
Blood samples were protected from UVB light and centrifuged within 45 min of sampling at 5°C, 3800 g , for 9 min (Centrifuge CR3i; Jouan Quality System). Serum was then aliquoted and stored at −70°C until analysis. The analyses of serum concentrations of 25OHD3 at all visits postpartum were performed in batches using liquid chromatography-MS (Mass spectrometer API 4000) by Central Laboratory in Malmö, Sweden, which is affiliated to the Vitamin D External Quality Assessment Scheme( 24 ). The method has a measuring range of 6–450 nmol/l for 25OHD3. This method has an inter-CV of 6 % at 40 nmol/l.
Statistical analyses
Percentage change in bone variables compared with baseline was calculated by the difference in log-transformed data between two time points, using log e and multiplied by 100, as previously described( Reference Brembeck, Lorentzon and Ohlsson 11 ). This approximates the percentage change, as shown by Cole( Reference Cole 25 ).
Univariable linear regression analyses were first used to evaluate the relationships between percentage change in each bone parameter (lumbar spine aBMD, cortical vBMD, cortical thickness and trabecular thickness) at 4, 12 and 18 months postpartum, respectively, compared with baseline, and possible determinants. The possible determinants included body weight at baseline, change in body weight (time of measurement minus baseline), height, lactation, age, parity, serum 25OHD at baseline, total Ca intake at 4 months postpartum, PAL at 4 months postpartum, use of contraceptives containing oestrogen at 4 months postpartum and baseline bone value. All variables found to be significant in the univariable linear regression analyses were entered into a multivariable regression analysis also adjusted for lactation, body weight at baseline, change in body weight at the time of measurement minus baseline and height. At 4 months postpartum, lactation was used as a categorical variable (full lactation (yes=1) or not (no=0)), as at that time point a majority of the women were still fully lactating. At 12 months postpartum, lactation was used as a continuous variable with duration of full lactation in months, as at that time point a considerable number of the women were still lactating to some extent. At 18 months postpartum, lactation was used as the continuous variable duration of total lactation in months.
As bone variables were not normally distributed, these variables were log-transformed before further analysis. Percentage change in bone variables was calculated according to the method of Cole( Reference Cole 25 ) as the difference in log-transformed data at 4, 12 or 18 months postpartum minus baseline, using log e, and multiplied by 100. In the regression analyses, PAL and use of hormonal contraceptives containing oestrogen at 4 months postpartum were included in the analysis, as this time point probably more accurately reflects the actual situation during the first 4 months postpartum than do the baseline values.
Statistical analyses for comparisons between women fully lactating and women not fully lactating at 4 months postpartum was performed with Students’ t test.
Co-linearity was evaluated between serum 25OHD and season and a positive co-linearity was found. Therefore, season was not included as a possible determinant in the model. However, interactions between serum 25OHD at baseline, and lactation category at 4 months postpartum, as well as serum 25OHD and season at baseline, were analysed as combined variables in the multivariable regression analyses for lumbar spine aBMD at 4 months postpartum. In the same way, interactions between total Ca intake at 4 months postpartum and duration of total lactation was analysed in the multivariable regression analyses for cortical vBMD and cortical thickness at the ultra-distal tibia at 18 months postpartum. No such significant interactions were found.
A two-tailed P value<0·05 was considered statistically significant. All analyses were conducted using SPSS Statistics Software, version 22.0; IBM. Means and standard deviations were used, unless otherwise described.
Results
Descriptive characteristics of the participating women are shown in Table 1. The number of women participating in the study was eighty-one at baseline and at 4 months postpartum, seventy-nine women at 12 months postpartum and fifty-eight women at 18 months postpartum. Reasons for leaving the study were new pregnancy (n 14), time constraints (n 6) and development of disease (n 3).
Descriptive characteristics of the participating womenFootnote * (Mean values and standard deviations)
PAL, physical activity level; 25OHD, 25-hydroxyvitamin D.
* Statistical analyses for comparisons between women fully lactating and women not fully lactating at 4 months postpartum were performed with Students’ t test.
† Baseline; 2 weeks postpartum.
‡ Lactation; fully lactating at 4 months postpartum: no or yes.
§ PAL (range 1·3–2·2).
The mean age of the women was 32·9 (sd 3·4) years (range 25–40 years) and the mean height was 168·4 (sd 6·4) cm. All births were term births. Parity at recruitment prepartum ranged from 0 to 2. In all, 80 % of the women had studied for 3 years or more at university level. No women were smoking at baseline and only three (4 %) women were smoking at 12 months postpartum. Median duration (quartiles 1–3) of full lactation was 5·0 (3·0–6·1) months and median duration of total lactation was 8·1 (6·8–10·4) months. At 2 weeks postpartum, 90 % of the women were fully lactating and 98 % were lactating to some extent. At 4 months postpartum, 70 % of the women were fully lactating and 88 % were lactating to some extent. At 12 months postpartum, none of the women were fully lactating, but 16 % of the women were lactating to some extent. At 18 months postpartum, only one woman was still lactating to some extent. At 4 months postpartum, 5 % of the women were using oestrogen contraceptives, at 12 months postpartum 7 % of the women were using oestrogen contraceptives and at 18 months postpartum 9 % of the women were using oestrogen contraceptives. The majority of the women were feeding the infant at the breast, not expressing breast-milk to be fed to the infant, also during long lactation.
Mean dietary Ca intake was 1110 (sd 410) mg/d at 4 months postpartum. In all, 33 % of the women were taking supplements containing Ca at 4 months postpartum. Mean serum 25OHD was above 50 nmol/l at all time points postpartum. In all, 39 % of the women were taking supplements containing vitamin D at baseline and 31 % of the women at 4 months postpartum.
As previously reported, significant changes postpartum were found in aBMD at the lumbar spine and in cortical vBMD, cortical thickness and trabecular thickness at the ultra-distal tibia, in this population of women( Reference Brembeck, Lorentzon and Ohlsson 11 ). Determinants of these changes in bone variables postpartum are described below.
Determinants of changes in areal bone mineral density at the lumbar spine
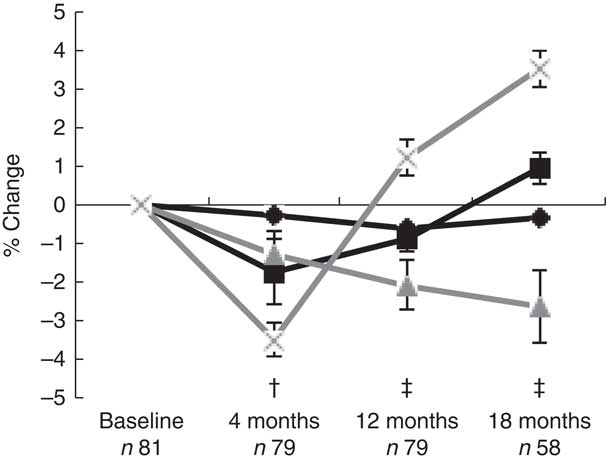
During the first 4 months postpartum, lumbar spine aBMD decreased significantly (−3·48 (sd 0·44) %, P<0·001)( Reference Brembeck, Lorentzon and Ohlsson 11 ), as shown in Fig. 1. At 4 months postpartum, baseline body weight (P=0·021) was positively associated with changes in lumbar spine aBMD, and serum 25OHD (P=0·003) and aBMD (P=0·012) were inversely associated with changes in lumbar spine aBMD (Table 2), as analysed with multivariable linear regression model.
Mean percentage change from baseline (standard errors) in log bone variables in women postpartum, as assessed with dual-energy X-ray absorptiometry and high-resolution peripheral quantitative computed tomography. † Significant change compared with baseline for areal bone mineral density (aBMD) at the lumbar spine and for cortical volumetric bone mineral density (vBMD) and cortical thickness at the ultra-distal tibia. ‡ Significant change compared with baseline for aBMD at the lumbar spine and for cortical vBMD, cortical thickness and trabecular thickness at the ultra-distal tibia. ![]() , Cortical vBMD;
, Cortical vBMD; ![]() , cortical thickness;
, cortical thickness; ![]() , trabecular thickness;
, trabecular thickness; ![]() , lumbar spine aBMD.
, lumbar spine aBMD.
Determinants for percentage change compared with baselineFootnote † in lumbar spine areal bone mineral density (aBMD) postpartum (β-Coefficients with their standard errors)
mo pp, months postpartum; 25OHD, 25-hydroxyvitamin D; PAL, physical activity level.
Units used are percentage change in the dependent variable per unit of the independent variable.
Percentage change in bone variables compared with baseline was calculated by the difference in log-transformed data between two time points, using log e and multiplied by 100.
Statistical analyses performed with univariable linear regression and adjusted multivariable linear regression.
Multivariable analyses always adjusted for lactation, body weight at baseline, change in body weight at time of measurement minus baseline and height.
* P<0·05, ** P<0·01, *** P<0·001.
† At baseline; at 2 weeks after delivery.
‡ Compared with baseline (2 weeks after delivery).
§ Lactation variables used, at 4 months postpartum if the women were fully lactating (0=no, 1=yes), at 12 months postpartum duration of full lactation (months), at 18 months postpartum duration of total lactation (months).
|| Number of births (n).
¶ Total daily Ca intake, including both dietary and supplemental intake (g/d).
†† At 4 months postpartum (scale 1·3–2·2).
‡‡ Use of oestrogen contraceptives (0=no, 1=yes).
At 12 months postpartum, lumbar spine aBMD had increased significantly compared with baseline (+1·21 (sd 0·45) %, P<0·001)( Reference Brembeck, Lorentzon and Ohlsson 11 ). Durations of full lactation (P=0·002) and baseline aBMD (P<0·001) were inversely associated with the changes in lumbar spine aBMD during the first 12 months postpartum (Table 2), as analysed with multivariable linear regression model.
At 18 months postpartum, lumbar spine aBMD had increased significantly with +3·51 (sd 0·47) % (P<0·001) compared with baseline( Reference Brembeck, Lorentzon and Ohlsson 11 ). A significant inverse relationship was still found between baseline aBMD at lumbar spine and changes in lumbar spine aBMD during the first 18 months postpartum (P<0·001) (Table 2), as analysed with multivariable linear regression model.
Determinants of changes in cortical volumetric bone mineral density at ultra-distal tibia
During the first 4 months postpartum, cortical vBMD at the ultra-distal tibia decreased significantly (−0·28 (sd 0·06) %, P<0·001) (Fig. 1)( Reference Brembeck, Lorentzon and Ohlsson 11 ). Both body weight at baseline (P=0·006) and use of oestrogen contraceptives at 4 months postpartum (P=0·046) were positively associated with changes in cortical vBMD during the first 4 months postpartum (Table 3), as analysed with multivariable linear regression model.
Determinants for percentage change compared with baselineFootnote † in cortical volumetric bone mineral density (vBMD) at ultra-distal tibia postpartum (β-Coefficients with their standard errors)
mo pp, months postpartum; 25OHD, 25-hydroxyvitamin D; PAL, physical activity level.
Units used are percentage change in the dependent variable per unit of the independent variable.
Percentage change in bone variables compared with baseline was calculated by the difference in log-transformed data between two time points, using log e and multiplied by 100.
Statistical analyses performed with univariable linear regression and adjusted multivariable linear regression.
Multivariable analyses always adjusted for lactation, body weight at baseline, change in body weight at time of measurement minus baseline and height.
*P<0·05, **P<0·01.
† At baseline; at 2 weeks after delivery.
‡ Compared with baseline (2 weeks after delivery).
§ Lactation variables used, at 4 months postpartum if the women were fully lactating (0=no, 1=yes), at 12 months postpartum duration of full lactation (months), at 18 months postpartum duration of total lactation (months).
|| Number of births.
¶ Total daily Ca intake, including both dietary and supplemental intake (g/d).
†† At 4 months postpartum (scale 1·3 to 2·2).
‡‡ Use of oestrogen contraceptives (0=no, 1=yes).
At 12 months postpartum, cortical vBMD at the ultra-distal tibia was still significantly lower than at baseline (−0·62 (sd 0·11) %, P<0·001)( Reference Brembeck, Lorentzon and Ohlsson 11 ). Body weight at baseline (P=0·015) was positively related to changes in cortical vBMD during the first 12 months postpartum, whereas an inverse relationship was found with duration of full lactation (P=0·013) (Table 3), as analysed with multivariable linear regression model.
At 18 months postpartum, a significant decrease compared with baseline was still evident for cortical vBMD (−0·32 (sd 0·13) %, P<0·01) at the ultra-distal tibia( Reference Brembeck, Lorentzon and Ohlsson 11 ). Ca intake at 4 months (P=0·029) was positively related to the changes in cortical vBMD during the first 18 months postpartum (Table 3), as analysed with multivariable linear regression model.
Determinants of changes in cortical thickness at ultra-distal tibia
For cortical thickness at the ultra-distal tibia, a significant decrease was observed during the first 4 months postpartum, compared with baseline (−1·72 (sd 0·84) %, P<0·05) (Fig. 1)( Reference Brembeck, Lorentzon and Ohlsson 11 ). No significant relationships were found between any of the investigated variables and changes in cortical thickness during the first 4 months postpartum (Table 4), as analysed with multivariable linear regression model.
Determinants for percentage change compared with baselineFootnote † in cortical thickness at ultra-distal tibia postpartum (β-Coefficients with their standard errors)
mo pp, months postpartum; 25OHD, 25-hydroxyvitamin D; PAL, physical activity level.
Units used are percentage change in the dependent variable per unit of the independent variable.
Percentage change in bone variables compared with baseline was calculated by the difference in log-transformed data between two time points, using log e and multiplied by 100.
Statistical analyses performed with univariable linear regression and adjusted multivariable linear regression.
Multivariable analyses always adjusted for lactation, body weight at baseline, change in body weight at time of measurement minus baseline and height.
*P<0·05, **P<0·01.
† At baseline; at 2 weeks after delivery.
‡ Compared with baseline (2 weeks after delivery).
§ Lactation variables used, at 4 months postpartum if the women were fully lactating (0=no, 1=yes), at 12 months postpartum duration of full lactation (months), at 18 months postpartum duration of total lactation (months).
|| Number of births.
¶ Total daily Ca intake, including both dietary and supplemental intake (g/d).
†† At 4 months postpartum (scale 1·3–2·2).
‡‡ Use of oestrogen contraceptives (0=no, 1=yes).
At 12 months postpartum, a significant decrease compared with baseline was still evident for cortical thickness (−0·87 (sd 0·33) %, P<0·01)( Reference Brembeck, Lorentzon and Ohlsson 11 ). Body weight at baseline (P=0·001) was positively related, and duration of full lactation (P=0·006) was inversely related, to the changes in cortical thickness (Table 4), as analysed with multivariable linear regression model.
At 18 months postpartum, cortical thickness at the ultra-distal tibia was significantly higher compared with baseline (+0·95 (sd 0·42) %, P<0·01)( Reference Brembeck, Lorentzon and Ohlsson 11 ). Positive relationships were evident for body weight at baseline (P=0·001) and Ca intake at 4 months postpartum (P=0·017), and changes in cortical thickness during the first 18 months postpartum (Table 4), as analysed with multivariable linear regression model.
Determinants of changes in trabecular thickness at ultra-distal tibia
For trabecular thickness at the ultra-distal tibia, a non-significant decrease of −1·29 (sd 0·62) % was observed during the first 4 months postpartum (Fig. 1)( Reference Brembeck, Lorentzon and Ohlsson 11 ). A significant inverse relation was found between baseline trabecular thickness and changes in trabecular thickness during the first 4 months postpartum (P=0·022) (Table 5), as analysed with multivariable linear regression model.
Determinants for percentage change compared with baselineFootnote † in trabecular thickness at ultra-distal tibia postpartum (β-Coefficients with their standard errors)
mo pp, months postpartum; 25OHD, 25-hydroxyvitamin D; PAL, physical activity level.
Units used are percentage change in the dependent variable per unit of the independent variable.
Percentage change in bone variables compared with baseline was calculated by the difference in log-transformed data between two time points, using log e and multiplied by 100.
Statistical analyses performed with univariable linear regression and adjusted multivariable linear regression.
Multivariable analyses always adjusted for lactation, body weight at baseline, change in body weight at time of measurement minus baseline and height.
*P<0·05, **P<0·01.
† At baseline; at 2 weeks after delivery.
‡ Compared with baseline (2 weeks after delivery).
§ Lactation variables used, at 4 months postpartum if the women were fully lactating (0=no, 1=yes), at 12 months postpartum duration of full lactation (months), at 18 months postpartum duration of total lactation (months).
|| Number of births.
¶ Total daily Ca intake, including both dietary and supplemental intake (g/d).
†† At 4 months postpartum (scale 1·3–2·2).
‡‡ Use of oestrogen contraceptives (0=no, 1=yes).
At 12 months postpartum, trabecular thickness at the ultra-distal tibia was significantly lower than baseline (−2·06 (sd 0·67) %, P<0·01)( Reference Brembeck, Lorentzon and Ohlsson 11 ). Significant inverse relationships were evident between baseline trabecular thickness (P=0·011) and changes in trabecular thickness during the first 12 months postpartum (Table 5), as analysed with multivariable linear regression model.
At 18 months postpartum, trabecular thickness at the ultra-distal tibia was still significantly lower compared with baseline (−2·62 (sd 0·94) %, P<0·01)( Reference Brembeck, Lorentzon and Ohlsson 11 ). At 18 months postpartum, only body weight at baseline (P=0·006) was positively related to the changes in trabecular thickness during the first 18 months postpartum (Table 5), as analysed using multivariable linear regression model.
Discussion
This is the first study investigating possible determinants, including Ca intake and serum 25OHD, of the compartmental changes in bone microstructural and dimensional parameters and vBMD postpartum. Associations between serum 25OHD and changes in aBMD have, to our knowledge, not been studied before in postpartum women. We have previously shown that there are significant postpartum changes in aBMD in the lumbar spine and volumetric, dimensional and microstructural bone parameters in the ultra-distal tibia( Reference Brembeck, Lorentzon and Ohlsson 11 ). We believe that by investigating determinants of these changes in volumetric, microstructural and dimensional bone parameters new and important information is added to the field. In this group of women, we found that lactation and body weight were the main determinants for skeletal changes during the first 18 months postpartum. These were the variables in the investigated spectra of possible determinants that were robust in almost all analyses, independent of skeletal site. The novel findings were that a high total Ca intake at 4 months postpartum may protect against decreases in cortical vBMD and thickness, but not trabecular thickness, during the first 18 months postpartum. In addition, higher serum concentration of 25OHD was related to larger decreases in the trabecular-rich lumbar spine aBMD during the first 4 months postpartum.
During pregnancy, there are indications that maternal vitamin D status may influence the changes in bone mineral status( Reference Javaid, Crozier and Harvey 26 ). Hypothetically, it is possible that also the recovery of bone minerals in the end of lactation or after weaning is less successful in women with low vitamin D status( Reference Specker 27 , Reference Kovacs 28 ). Thus, one may speculate that women with higher serum 25OHD have higher intestinal Ca uptake, and therefore are more able to supply the Ca needed for breast milk production. However, this was not supported by our study, as our results instead suggest that higher serum 25OHD was related to larger decreases in lumbar spine aBMD. Krebs et al.( Reference Krebs, Reidinger and Robertson 13 ) did not find a relationship between dietary vitamin D intake and aBMD at the lumbar spine or mid-radius postpartum at all. Similarly, Möller et al.( Reference Möller, Vieth Streym and Mosekilde 10 ) observed that vitamin D intake was not related to the decreases in aBMD at the whole-body, lumbar spine or total hip sites during the first 4 months postpartum. Neither of these two studies investigated the relationship between the serum concentrations of 25OHD and the postpartum changes in aBMD. Vitamin D status is, during the summer months, mainly influenced by sunlight exposure( Reference Brembeck, Winkvist and Olausson 22 , Reference Brembeck, Winkvist and Bååth 20 ). We are, to our knowledge, the first to use serum 25OHD as a measurement of vitamin D status, when studying the association between vitamin D and postpartum bone changes. No evidence of significant interactions of serum 25OHD at baseline and lactation category at 4 months postpartum or season at baseline on the decreases in lumbar spine aBMD during the first 4 months postpartum was found.
Most previous observational studies have found that Ca intake during lactation has no relation to the decreases in aBMD measured at various sites postpartum( Reference Sowers, Corton and Shapiro 2 , Reference Kolthoff, Eiken and Kristensen 14 , Reference Laskey, Prentice and Hanratty 3 ), except for Krebs et al.( Reference Krebs, Reidinger and Robertson 13 ) who reported that higher Ca intake was associated with higher lumbar spine aBMD postpartum. Also Ca intervention studies in lactating women( Reference Kalkwarf and Specker 29 , Reference Polatti, Capuzzo and Viazzo 15 , Reference Prentice 30 ) found either no effect of Ca supplementation on whole-body or lumbar spine aBMD during the first 6 months postpartum( Reference Kalkwarf and Specker 29 , Reference Prentice 30 ) or only a transient positive effect of Ca supplementation, preventing the decreases in radial and lumbar spine aBMD postpartum( Reference Polatti, Capuzzo and Viazzo 15 ). No previous studies have investigated the role of Ca intake and changes in bone microstructure or in cortical bone specifically. We found that a higher total Ca intake at 4 months postpartum was significantly related to smaller decreases in cortical vBMD and larger increases in cortical thickness at 18 months postpartum compared with baseline at the ultra-distal tibia. Hence, total Ca intake was found to be a determinant for the changes in cortical vBMD and cortical thickness, but not trabecular thickness or the trabecular-rich lumbar spine aBMD, at 18 months postpartum compared with baseline.
At recruitment of these women during pregnancy, we see that Ca intake is high also during the third trimester (1170 mg Ca/d in the third trimester and 42 % of the women were taking Ca supplements; data not previously published). Hence, the observed effect is probably not explained by a higher Ca intake postpartum than during pregnancy. Interaction between Ca intake at 4 months postpartum and duration of total lactation was checked, but no significant interaction was found.
The general recommendation from the Swedish Medical Agency is not to use hormonal contraceptives containing oestrogen while lactating, as oestrogen decreases breast milk production( 31 ). Therefore, it is not surprising that only a few women (5 % at 4 months and 7 % at 12 months postpartum) were using oestrogen contraceptives and that most of those were fully lactating for only a short period (not more than 1 month). Thus, the observed positive relation between use of oestrogen contraceptive and the changes in bone variables needs to be handled with caution. In our study, oestrogen contraceptive use could rather be a proxy for absence of lactation or lactation for a short period of time. During lactation and amenorrhoea, oestrogen levels are low, which has been suggested to contribute to the decreases in bone minerals postpartum( Reference McNeilly, Tay and Glasier 32 , Reference Kalkwarf and Specker 29 , Reference Krebs, Reidinger and Robertson 13 ). At the end of a period of long lactation or after weaning, oestrogen levels start to increase again, which also has been suggested to contribute to the recovery of the bone minerals( Reference Kalkwarf and Specker 29 , Reference Kolthoff, Eiken and Kristensen 14 ). Many previous studies have reported that longer duration of lactation is related to larger decreases in aBMD at several skeletal sites postpartum( Reference Sowers, Corton and Shapiro 2 , Reference Laskey, Prentice and Hanratty 3 , Reference Laskey and Prentice 5 , Reference Karlsson, Obrant and Karlsson 7 – Reference Möller, Vieth Streym and Mosekilde 10 ). We found that women who were fully lactating at 4 months postpartum were somewhat older than women who were not fully lactating at 4 months postpartum, but not significantly (33·4 v. 31·8 years). A possible influence of ageing on the observed bone changes therefore cannot be excluded.
Our finding of a relationship between a lower baseline body weight and larger decreases in cortical bone variables at the ultra-distal tibia, and to a lesser extent also in trabecular thickness, confirms previous findings( Reference Sowers, Kshirsagar and Crutchfield 19 , Reference Malpeli, Apezteguia and Mansur 33 ). The suggested explanation is that a lower body weight results in a lower mechanical load on the skeleton, in combination with a lower body fat content, which in turn may reduce the peripheral oestrogen production( Reference Sowers, Kshirsagar and Crutchfield 19 , Reference Lindsay, Cosman and Herrington 34 ). Both these factors may contribute to a decrease in bone minerals.
The women in this study may not be representative of the general population of postpartum women at northern latitudes. In all, 80 % of the women had 3 years or more of education at university level, compared with 37 % in the general Swedish population of women in the same age group( 35 ). Mean body weight at 12 months postpartum was 65·3 kg, which is lower than the weight in the same age group and sex in the general population of 67·0 kg( 36 ). Mean age at baseline was 32·9 years, which is slightly higher than comparable national data of pregnant women of 30·8 years( 37 ). At baseline, none of the women smoked, whereas national data show that 4·6 % of mothers of newborns smoke( 38 ). In all, 70 % of the women were fully lactating at 4 months postpartum, compared with national data of 52 %( 38 ). This difference might partly be due to the more strict definition of full lactation by the Swedish National Board of Health and Welfare than that used in this study( 38 ). However, 88 % of the women in this study were lactating to some extent at 4 months postpartum, compared with only 75 % of the women in the whole country. As the women in this study weigh less, have higher education, lactate to a larger extent and have actively chosen to participate in the study, they may be more health conscious than the general population. Thus, the results need to be handled with care.
Weaknesses in the study were the sample size and the homogeneous sample population, which makes it difficult to generalise the results. Another weakness was that no control group consisting of age-matched non-pregnant and non-lactating women was included. Further, only a few women were using oestrogen contraceptives, and therefore we cannot make any firm conclusions about this exposure. Strengths of the study included the broad spectra of possible determinants studied, including serum 25OHD, the longitudinal data with four time points, the long follow-up of 18 months postpartum and the inclusion of results from both DXA and HR-pQCT. As far as we know, this is the first study investigating the determinants of compartmental changes in bone microstructural and dimensional parameters and vBMD in women postpartum.
In conclusion, lactation and body weight at baseline were the main determinants of skeletal changes during the first 18 months postpartum. Longer duration of lactation was associated with larger decreases in bone variables postpartum, whereas a higher baseline body weight was associated with smaller decreases in bone variables postpartum. Ca intake and serum concentrations of 25OHD appear to have different associations with cortical and trabecular bone.
Acknowledgements
The authors thank research nurse Ulrika Hjertonsson and Daniel Sundh for performing bone measurements, technical assistants Elisabeth Gramatkovski and Birgitha Arvidsson and research nurse Anna Folino for help with data collection and handling and Dr Ann Laskey for valuable comments.
This study was supported by The Swedish Research Council Formas (no. 2007-398 and 2009-1504) (H. A.); the graduate School Environment and Health (H. A.); the Swedish Nutrition Foundation (P. B.); Willhelm & Martina Lundgrens Vetenskapsfond (P. B.); Magnus Bergvall foundation (H. A.); Fredrik and Ingrid Thuring foundation (H. A.); Olof Johannisson foundation (H. A.); The Swedish Society of Medicine (H. A.); Swedish Society for Medical Research (H. A.); Sahlgrenska University Hospital foundation (H. A.); Gustaf V and Queen Victoria’s Freemason Foundation (H. A.); and Kvinnor & Hälsa Foundation (H. A.). No funders had any role in the design, analysis or writing of this article.
H. A. designed the research, P. B. and H. A. conducted the research, C. O. and M. L. provided DXA and HR-pQCT methodology, P. B. performed statistical analyses, P. B. and H. A. wrote the paper and P. B. had primary responsibility for the final content. All authors have read and approved the final manuscript.
The authors have no conflicts of interest.


