


Milk is one of the best foods for babies. In lactating mammary gland tissue, mammary epithelial cells (MEC) use small molecules such as glucose, amino acids and fatty acids to synthesise milk components including lactose, milk protein and milk fat, which are secreted into milk ducts to form milk(Reference Slepicka, Somasundara and Dos Santos1). The contents of milk protein and milk fat are important indexes of milk quality, whereas the lactose content is relatively stable, which is related to maintaining the milk volume. Milk production in mammary gland depends on milk protein and fat synthesis ability of MEC, and the cell renewal ability of MEC is also a critical factor of the persistency of milk synthesis(Reference Capuco and Choudhary2).
The sterol-regulatory element binding protein 1c (SREBP-1c) is a master transcription factor for lipid homoeostasis, which is responsible for the transcription of many lipid synthase genes(Reference Eberlé, Hegarty and Bossard3). The mechanistic target of rapamycin (mTOR) is the well-known central signalling molecule that regulates milk protein synthesis in MEC and cell proliferation. mTOR can also stimulate SREBP-1 expression and maturation, leading to increased lipid synthesis. Glucose, amino acids and fatty acids can all stimulate mTOR activation (phosphorylation)(Reference Osorio, Lohakare and Bionaz4).
MEC can sense small nutrients through their membrane receptors and transporters including G protein-coupled receptors (GPCR), GLUT, amino acid transporters and fatty acid transporters, thereby activating the mTOR signalling. Some GPCR have been reported to be amino acid-sensing receptors. Previous reports have shown that the taste receptors (T1R) can sense some amino acids. In T1R, T1R1/T1R3 can sense different amino acids in different animals, and T1R2/T1R3 is a sweet receptor and glucose sensor(Reference Zheng, Zhang and Zhou5,Reference Nelson, Chandrashekar and Hoon6) . GPRC6A (GPCR, class C, group 6, subtype A) is a widely expressed GPCR and a master regulator of metabolic processes, which can be activated by basic amino acids(Reference Pi, Nishimoto and Quarles7,Reference Li, Li and Wang8) . The Ca sensing receptor can be activated by extracellular Ca2+ and also by amino acids(Reference Díaz-Soto, Rocher and García-Rodríguez9). Methionine (Met), lysine, leucine and taurine are the main key amino acids that can promote milk protein and fat synthesis in MEC(Reference Zheng, Zhang and Zhou5,Reference Li, Li and Wang8,Reference Luo, Yu and Li10,Reference Yu, Wang and Wang11) , and we previously found that GPR87 can mediate the stimulation of these amino acids on mTOR phosphorylation(Reference Luo, Yu and Li10,Reference Yu, Wang and Wang11) . The GPCR which are the ligands of these amino acids are largely unknown yet and need to be uncovered.
To date, several GPCR have been identified that can be activated by NEFA of various chain lengths. GPR41 and GPR43 can be activated by SCFA(Reference Kimura, Ichimura and Ohue-Kitano12). GPR40 and GPR120 have been characterised as receptors for long-chain unsaturated fatty acids(Reference Kimura, Ichimura and Ohue-Kitano12–Reference Hirasawa, Tsumaya and Awaji14). GPR84 is a de-orphanised member recognising medium-chain fatty acids and has been suggested to play important roles in inflammation(Reference Luscombe, Lucy and Bataille15). Long-chain FA including palmitic acid (PA) can enhance the mTOR and SREBP-1c signalling pathways and strongly stimulate milk protein and fat synthesis in MEC(Reference Osorio, Lohakare and Bionaz4,Reference Li, Li and Wang8) , but it is yet unknown the GPCR sensing these fatty acids.
The GPCR sensing amino acids such as Met and long-chain SFA such as PA need to be identified. In this study, we used transcriptome sequencing to analyse gene expression profiles of mouse mammary gland tissues of puberty, lactation and involution. We aim to discover differentially expressed genes (DEG) related to milk synthesis and new GPCR sensing Met or PA to regulate the mTOR and SREBP-1c signalling in MEC. Our research would help lay a deeper theoretical basis to direct human or dairy milk production.
Materials and methods
Ethic statement
All animal experiments were approved and conducted according to the regulation and guideline of Animal Experiment Committee of Yangtze University.
Collection of mouse mammary tissues
The healthy Institute of Cancer Research (ICR) female mice used in the experiments were purchased from Wuhan WQJX Biotechnology Co., Ltd. These mice were fed with the same diet and without water restrictions. All animals received humane care as outlined in the Institutional Guidelines of the Care and Use of Laboratory Animals in Yangtze University. Mice were kept in a temperature-controlled (21–25°C), light-controlled (12/12 h dark-light cycle), luminous intensity (16 lux) and humidity (50–60 %). Nine mice were randomly divided into three groups (n 3 in each group): three at puberty stage (8 weeks old, n 3), three at lactation stage (on the 15th day from lactating, n 3) and three at involution stage (at the 72 h after lactation, n 3). The mice were killed by decapitation, and mammary gland tissue samples were collected and stored in sterile and RNase-free freezing tubes for RNA extraction or total protein extraction.
Construction of cDNA library
Tissue samples were sent to APTBIO Technical Service Company for Illumina sequencing. The RNeasy Animal RNA Extraction Kit (Beyotime) was used to extract RNA. Agilent 4150 test showed that the RNA integrity number (Rin) was ≥ 7, OD260/280 was between 1·49 and 1·76, showing that the quality and total amount of sample RNA met the requirements of database building. Magnetic beads with Oligo (dT) were used to enrich mRNA, and the mRNA were then disrupted by the addition of fragmentation lysis buffer. The cleaved mRNA and random primers were used to synthesise the first strand cDNA by RT. Then the products were used to synthesise the second strand cDNA by DNA polymerase I and RNase H. The double strand cDNA were purified, and an end repair process was carried out, including a single ‘A’ base addition and ligation of the adapters. After selecting the fragment size with the AMPure XP beads, PCR amplification was performed to obtain the cDNA library. To ensure the quality of the library, the insert size and effective concentration of the library were tested.
RNA-Seq and data analysis
The Illumina HiSeq 4000 platform (Illumina) was used for sequencing. RNA-Seq raw reads were subjected to adapter trimming and quality filtering (Q-phred score > 20). The raw reads with base number less than 25 and the proportion of N (N indicates that the base information cannot be determined) greater than 5 % were filtered out for subsequent analysis. The quality of the original sequencing data of these nine samples met the requirements, and all of the Pearson’s correlations within the sample group were greater than 0·8, indicating that the sample repeatability was good. HISAT2 RNA-Seq alignment software was used to map the raw reads on genome. The feature Counts software was used to quantify the expression level of each gene (FPKM, fragments per kilobase of exon per million fragments mapped). The raw reads from RNA-Seq were deposited in the NCBI Database, and the record can be accessed by submission number: SUB11870097.
Analysis and functional enrichment of differentially expressed genes
DESeq2 software was used to analyse the DEG between lactation and other stages with a threshold of false discovery rate-adjusted P-value (Padj) < 0·05 and the difference significance criterion of fold change > 2 (log2 fold change > 1). Volcano Plot was exploited to intuitively display the distribution of DEG in two groups.
Gene ontology database (http://www.geneontology.org/) was used to analyse gene ontology enrichment of DEG. Kyoto Encyclopedia of Genes and Genomes pathway (http://www.genome.jp/kegg) was used to analyse Kyoto Encyclopedia of Genes and Genomes enrichment of DEG. The most significant twenty signalling pathway entries were selected and displayed.
qRT-PCR verification
Total RNA were extracted from mouse mammary tissue samples of puberty stage and lactation stage by RNeasy Animal RNA Extraction Kit (Beyotime), and cDNA first strand was synthesised from the total RNA using BeyoRT cDNA First-strand Synthesis Kit (RNase H-) (Beyotime) according to the manufacturer’s protocol. qRT-PCR reaction was performed using BeyoFast SYBR Green qPCR Mix (2×, Low ROX) (Beyotime) on the CFX96 thermocycler (Bio-Rad). Ten GPCR genes and housekeeping gene (β-actin) were selected for verification, and the primers sequences were designed by Primer5 software which were shown in online Supplementary Table S1. The relative mRNA expression levels were calculated by the 2–ΔΔCt method. The qRT-PCR results were logarithmically processed, and the correlation diagram was drawn with RNA-Seq results.
Cell culture and treatments
The MEC line HC11 was obtained from the Cell Bank of the Type Culture Collection, Chinese Academy of Sciences, Shanghai, China. HC11 cells were cultured in RPMI 1640 Medium (Gibco) supplemented with 1 % Gluta MAX (Gibco), 10 % fetal bovine serum (Gibco), 1 % sodium pyruvate and 0·1 mg/ml streptomycin and 100 U/L penicillin. HC11 cells were grown in a humidified atmosphere with 5% CO2 at 37°C. To reduce the effects of nutrients in the culture medium, cells were plated in 6-well plates and cultured in fetal bovine serum-free OPTI-MEMI medium (Gibco) for 12 h before treatment. Met and PA were dissolved in OPTI-MEMI medium and absolute alcohol, respectively, and added into the OPTI-MEMI culture medium at different concentrations, and the effects were detected post 24 h of addition.
siRNA transfection
The negative control small interfering RNA and three specific siRNA targeting different coding sequences of GPR110 gene were designed and synthesised by GenePharma, and the siRNA sequences are shown in online Supplementary Table S2. Transfection was performed according to the manufacturer’s protocol. Briefly, cells were plated in 6-well plates and cultured in fetal bovine serum-free OPTI-MEMI medium (Gibco) for 12 h before transfection. GP-transfect-Mate (G04008, GenePharma) (6 μl) was used to transfect the negative control or specific GPR110 siRNA (100 pmol/μl) into cells cultured in one cell of the 6-well plate. At 24 h post transfection, cells were harvested to determine the interfering efficiency and the most effective siRNA (siRNA3) of the three (> 70 % decrease of GPR110 protein level by Western blotting analysis) was selected for further assays.
Western blotting
Mammary tissue or cell samples were lysed with RIPA lysate and protein concentrations were determined with a BCA assay kit (Beyotime). The proteins (20 μg/lane) were separated on 8 % SDS-PAGE and analysed by Western blotting assay. Protein bands were detected by a chemiluminescence gel imaging system (Peiqing). Primary antibodies are GPR110 (bs-13513R, Bioss), β-casein (bs-10032R, Bioss), mTOR (bs-1992R, Bioss), p-mTOR (Ser2448) (#2971, CST), β-tubulin (#2128S, CST), SREBP-1c (14088-AP, Proteintech) and β-actin (sc-47778, Santa Cruz). Band intensities were quantified using ImageJ software and normalised to β-actin. Each experiment consisted of three sets of repetitions.
Detection of TAG synthesis
TAG in HC11 cells were measured using the TAG GPO-POD Assay Kit (Applygen) according to the manufacturer’s protocol.
Staining of lipid droplets
Lipid droplets formed in HC11 cells were observed by a fluorescence staining assay. Cells were fixed on coverslips with 4 % (w/v) paraformaldehyde for 20 min. Then cells were incubated with BODIPY 493/503 (Invitrogen) (1 μg/ml) for 20 min. Next, cells were counterstained with DAPI (4', 6-dimethylidene-2-phenylindole) (Beyotime) for 10 min in the dark. The fluorescent signals were observed under a fluorescence microscope (DLMB-2, Leica). Fifteen cells were analysed in each sample.
Cell Counting Kit-8 assay
Cell Counting Kit-8 assay (Beyotime) was used to detect the number of HC11 cells according to the manufacturer’s protocol. Cells in the culture bottle were mixed evenly and then transferred to a 96-well plate, and the cells in each well were counted (approximately 5 × 10³ cells/well) for further treatment. After treatment, 10 μ of Cell Counting Kit-8 reagent was added into each well and cells were further cultured for 2 h at 37°C. The absorbance at 450 nm was measured by a microplate reader (SpectraMax iD3, Molecular Devices).
EdU assay
BeyoClick EdU Cell Proliferation Kit (Beyotime) was used to detect the proliferation ability of HC11 cells according to the manufacturer’s protocol. Briefly, cells were transferred on the coverslips in a 6-well plate (approximately 1 × 10⁵ cells/well), and then cells were added with 1 × EdU buffer for 2 h at 37°C, and next fixed with 4 % (w/v) paraformaldehyde for 15 min. Cells were then incubated with the Click Reaction Buffer for 30 min in the dark and next incubated with 1 × Hoechst 33 342 Buffer to dye the nucleus for 10 min. The fluorescent signals were observed under a fluorescence microscope, and one hundred cells were analysed in each sample.
Statistical analysis
Each experiment consisted of at least three sets of repetitions, and data were expressed as means with their standard errors. Differences among data were evaluated by one-way ANOVA, and statistical significance was declared at P < 0·05.
Results
RNA-Seq data quality analysis of mammary gland tissue samples
RNA-Seq results showed 45 478 930–48 555 780, 43 360 998–60 115 402 and 45 084 842–79 380 096 reads in the puberty, lactation and involution stage library, respectively (online Supplementary Table S3). The range of sequencing quality value (Q-phred), Q20 (sequencing error rate P < 1 %) and Q30 (sequencing error rate P < 1‰) in the three stages were 96·06–96·78 % and 88·76–90·74 %, respectively (online Supplementary Table S3). The ratio of total mapped/total clean reads ranged from 93·72 % to 94·83 % in puberty, 93·52 % to 94·08 % in lactation and 94·04 % to 94·41 % in involution stage library (online Supplementary Table S4). Furthermore, the ratio of unique mapped to the reference genome/total clean reads were 89·51–89·90 % at puberty stage, 84·11–84·72 % at lactation stage and 89·84–90·33 % at involution stage, respectively (online Supplementary Table S4). All results showed that the RNA-Seq data were of high quality and could be used for subsequent analysis.
Transcriptome sequencing to analyse gene expression profiles of mouse mammary gland tissues of puberty, lactation and involution
The gene expression profiles of mouse mammary gland tissues of puberty, lactation and involution were analysed by transcriptome sequencing. The software HISAT2 was used to compare the sequencing data with the reference genome data to obtain the detailed location information of the sequencing data in the reference genome. Feature counts software was used to calculate the gene expression FPKM value of genes in the submitted samples. DESeq2 was used to analyse the differential expression of genes in these samples with three biological duplications.
The Volcano Plot of the DEG between puberty and lactation showed that a total of 3744 transcripts with differences were found in lactation compared with puberty, of which 1816 were up-regulated and 1928 were down-regulated in lactation (Fig. 1(a)). The Volcano Plot of the DEG between lactation and involution showed that there were 4485 transcripts with differences between lactation and involution, of which 1842 were up-regulated and 2643 were down-regulated during lactation (Fig. 1(b)).
Volcano Plot of DEG between expression libraries of mammary gland tissues at lactation and puberty or involution stages. (a) and (b) Volcano Plots of DEG between expression libraries of mammary gland tissues at lactation and puberty stage (a) and between that of lactation and involution (b). The abscissa represented the change of gene expression multiple, and the ordinate indicated the significance of gene expression differences. Blue dot indicated down-regulated DEG; red, up-regulated, and grey dot, genes without differential expression. In the panels, B v A, lactation v puberty; C v B, involution v lactation. DEG, differentially expressed gene.

Clustering of DEG showed difference between the gene expression of mRNA in samples in puberty and lactation (Fig. 2(a)) and between that of lactation and involution (Fig. 2(b)). Although there were differences in the expression of some genes between groups, the clustering results showed that these differences within groups did not affect the clustering of heat map data. The clustering grouping of heat map data was consistent with the grouping of experimental samples, indicating that the sequencing results had high repeatability, and there were great changes in the gene expression of samples between groups in different periods, suggesting that these differential genes might play an important role in mammary gland development or lactation.
Cluster analysis of DEG between expression libraries of mammary gland tissues at lactation and puberty or involution stages. (a) and (b) Cluster analysis of DEG between expression libraries of mammary gland tissues at lactation and puberty stage (a) and between that of lactation and involution (b). Each column represented a sample, and each row represented a gene. Red indicated up-regulated DEG and blue indicated down-regulated DEG. The upper part was the dendrogram of sample clustering, and on the left was the dendrogram of gene clustering. A1, A2 and A3 represented three mice at puberty; B1, B2 and B3, three mice at lactation; C1, C2 and C3, three mice at involution. DEG, differentially expressed gene.

Gene ontology function enrichment of differentially expressed genes
The gene ontology functional enrichment of DEG can reveal the overall functional enrichment characteristics of DEG. In this experiment, ten functional items with the most significant enrichment were selected.
The results showed that the biological processes of significant enrichment of DEG in puberty and lactation included intracellular localisation, growth and development of multicellular organisms, material transport, cell surface receptor signal pathways, etc. The significantly enriched cellular components included plasma membrane, extracellular substances, keratin fibres, cell surface, supramolecular polymers, etc., while the significantly enriched biological functions included the activity of transporters, the binding of signal molecules to receptors, protein binding, Ig receptor binding, antigen binding, etc. (Fig. 3(a)).
GO enrichment histogram of DEG between expression libraries of mammary gland tissues at lactation and puberty or involution stages. (a) and (b) GO enrichment histogram of DEG between expression libraries of mammary gland tissues at lactation and puberty stage (a) and between that of lactation and involution (b). The abscissa was the P value, and the ordinate was a simple description of the function entry. Function items were arranged in order of P value. Different colour columns represented different classifications of GO terms. Red represented cell components; green, biological processes; and blue, molecular functions. GO, gene ontology; DEG, differentially expressed gene.

The biological process of significant enrichment of DEG in the lactation and involution stage mainly included the phylogeny of multicellular organisms and their regulation, localisation, anatomical morphogenesis, etc. The significantly enriched cell components mainly included intracellular and extracellular matrix components and plasma membrane components, while the significantly enriched biological functions mainly included protein and ion binding, signal receptor binding, material transmembrane transport, etc. (Fig. 3(b)).
From these two comparisons, the genes with significantly increased expression during lactation were mainly involved in the biological processes such as material transport and phylogeny, and the binding of signal molecules to receptors. These genes were mainly involved in the formation of extracellular matrix, intimal system, cell surface, keratin fibres and other cell components. The biological functions involved were mainly the activity of transporters, the binding of signal molecules to receptors, protein binding, etc. Genes with decreased expression during lactation were mainly involved in some biological processes related to body immunity. These genes were mainly involved in the formation of intermediate fibres, Ig and other cellular components, and the biological functions involved were mainly the binding of Ig to receptors, antigen binding, etc.
Kyoto Encyclopedia of Genes and Genomes enrichment map of differentially expressed genes
The significantly enriched signalling pathways by Kyoto Encyclopedia of Genes and Genomes analysis of DEG in puberty and lactation included: mineral absorption, adipocytokine signal pathway, Ca signal pathway, cAMP signal pathway, AMPK signal pathway, PPAR signal pathway, glucagon signal pathway, metabolic pathway, regulation of adipolysis of adipocytes, HIF-1 signal pathway, amino acid and sugar metabolism, TNF signal pathway, and protein digestion and absorption (Fig. 4(a)).
KEGG enrichment map of DEG between expression libraries of mammary gland tissues at lactation and puberty or involution stages. (a) and (b) KEGG enrichment map of DEG between expression libraries of mammary gland tissues at lactation and puberty stage (a) and between that of lactation and involution (b). The ordinate represented the name of the signalling pathway, and the abscissa represented the P value of the signalling pathway. The colour of the dot represented the size of the rich factor. The size of the dot represented the number of differential genes contained in the signalling pathway. KEGG, Kyoto Encyclopedia of Genes and Genomes; DEG, differentially expressed gene

The significantly enriched signalling pathways by Kyoto Encyclopedia of Genes and Genomes analysis of DEG in lactation and involution included cell adhesion molecules, metabolic pathways, ECM–receptor interaction, IgA production of intestinal immune network, the PI3K-AKT signalling pathway, mineral absorption, PPAR signal pathway, cytokine–cytokine receptor interaction, phospholipase D signalling pathway, lipolysis regulation of adipocytes, ABC transporters, etc. Among these signalling pathways, the metabolic pathway contained the largest number of genes (Fig. 4(b)).
From these two comparisons, the signal pathways that significantly enhanced during lactation were mineral absorption, adipocytokine signal pathway, Ca signal pathway, cAMP signal pathway, metabolic pathway, amino acid and sugar metabolism, ECM receptor interaction, etc. The significantly decreased signal pathways mainly included the AMPK signal pathway, PPAR signal pathway, TNF signal pathway, regulation of adipolysis of adipocytes, IgA production of intestinal immune network, etc.
Screening of genes and candidate G protein-coupled receptors related to milk synthesis
The DEG identified by transcriptome analysis were compared with the database Animal QTLdb. According to the expression level of DEG in mammary gland tissues at different periods, a total of 113 genes related to lactation were screened out (online Supplementary Fig. S1). In these genes, sixty-eight genes were up-regulated and forty-five genes were down-regulated during lactation, including eight GPCR: GPR110, LGR4, GPR35, GPR156, LGR6, ADGRE4, ADGRL3 and GPR141b.
The mRNA expression of these eight GPCR plus GPRC5C and GPRC5D (selected as controls) from RNA-Seq results was further verified by qRT-PCR analysis. These genes detected by qRT-PCR and RNA-Seq had the same gene expression pattern during puberty and lactation, and the gene expression was highly correlated (R 2 = 0·9273) (Fig. 5(a) and (b)), indicating the reliability of RNA-Seq data in this study. Among them, three genes showed up-regulated mRNA expression during lactation, and the other five genes were down-regulated genes.
Comparison of RNA-Seq and qRT-PCR results of ten selected GPCR between mammary gland tissues at lactation and puberty stages. (a) The RNA-Seq and qRT-PCR results of ten selected GPCR between mammary gland tissues at lactation and puberty stages. (b) The correlation coefficient between these mRNA expression levels from qRT-PCR and RNA-Seq. GPCR, G protein-coupled receptor.

GPR110 positively regulates milk protein and fat synthesis in and proliferation of mammary epithelial cells
It is speculated that the function of genes with large changes in expression during lactation may be related to the milk synthesis ability of mammary gland. Therefore, GPR110, which was highly expressed during lactation, and had the highest expression level among the 8 GPCR, was selected as a candidate GPCR for function analysis in milk synthesis. The protein level of GPR110 at lactation stage was significantly higher than that at puberty and involution stage (Fig. 6(a) and (b)), indicating that GPR110 might play an important regulatory role in milk synthesis regulation. GPR110 knockdown by siRNA transfection in HC11 cells led to significantly decreased β-casein levels in cells (Fig. 6(c) and (d)), TAG in cells (Fig. 6(e)) and lipid droplet formation in cells (Fig. 6(f)). Cell Counting Kit-8 and EdU analysis showed that GPR110 knockdown also decreased cell proliferation (Fig. 6(g) and (h)). These above data suggest that GPR110 might be a positive regulator for milk protein and fat synthesis in and proliferation of MEC.
Effects of GPR110 on milk protein and fat synthesis in HC11 cells and cell proliferation. (a) Western blotting analysis of the protein levels of GPR110 in mouse mammary gland tissues at puberty, lactation and involution. (b) Relative folds of GPR110/β-actin from the Western blots in (A) were quantified by greyscale scan. (C) A GPR110 siRNA was transfected into HC11 cells. Western blotting analysis was performed to analyse the protein levels of β-casein. (D) Relative folds of β-casein/β-actin from the Western blots in (C) were quantified by greyscale scan. (E) The concentration of TAG in cells was determined by using a TAG detection kit. (F) Lipid droplet in cells was dyed with BODIPY (green), and cell nuclei were stained with DAPI (blue). Scale bar = 15 μm. Fifteen cells were analysed in each sample. (G) Cell number was determined by using a CCK-8 assay kit. (H) Cell proliferation ability was determined by using an EdU assay kit. Scale bar = 15 μm. One hundred cells were analysed in each sample. Data were expressed as mean values with their standard errors (n 3). Values with different superscripted lowercase letters indicate significant difference from each other (P < 0·05). CCK-8, Cell Counting Kit-8.

GPR110 positively regulates the mechanistic target of rapamycin and sterol-regulatory element binding protein 1c signalling pathway
The effects of GPR110 on the signalling pathways related to milk protein and fat synthesis and cell proliferation were further investigated. GPR110 knockdown (Fig. 7(a) and (b)) markedly decreased mTOR phosphorylation (Fig. 7(a) and (c)) and SREBP-1c expression (Fig. 7(a) and (d)). These data suggest that GPR110 positive regulates milk protein and fat synthesis and cell proliferation through the mTOR and SREBP-1c signalling pathways.
Effects of GPR110 knockdown on the signalling pathways related to milk synthesis. (a) Western blotting analysis of indicated protein levels in HC11 cells transfected with a GPR110 siRNA. (b)–(d) Relative folds of GPR110/β-actin (b), p-mTOR/mTOR (c) and SREBP-1c/β-actin (d) from the Western blots in (a) were quantified by greyscale scan. Data were expressed as mean values with their standard errors (n 3). Values with different superscripted lowercase letters indicate significant difference from each other (P < 0·05).

GPR110 mediates the stimulation of palmitic acid on the mechanistic target of rapamycin and sterol-regulatory element binding protein 1c signalling pathways
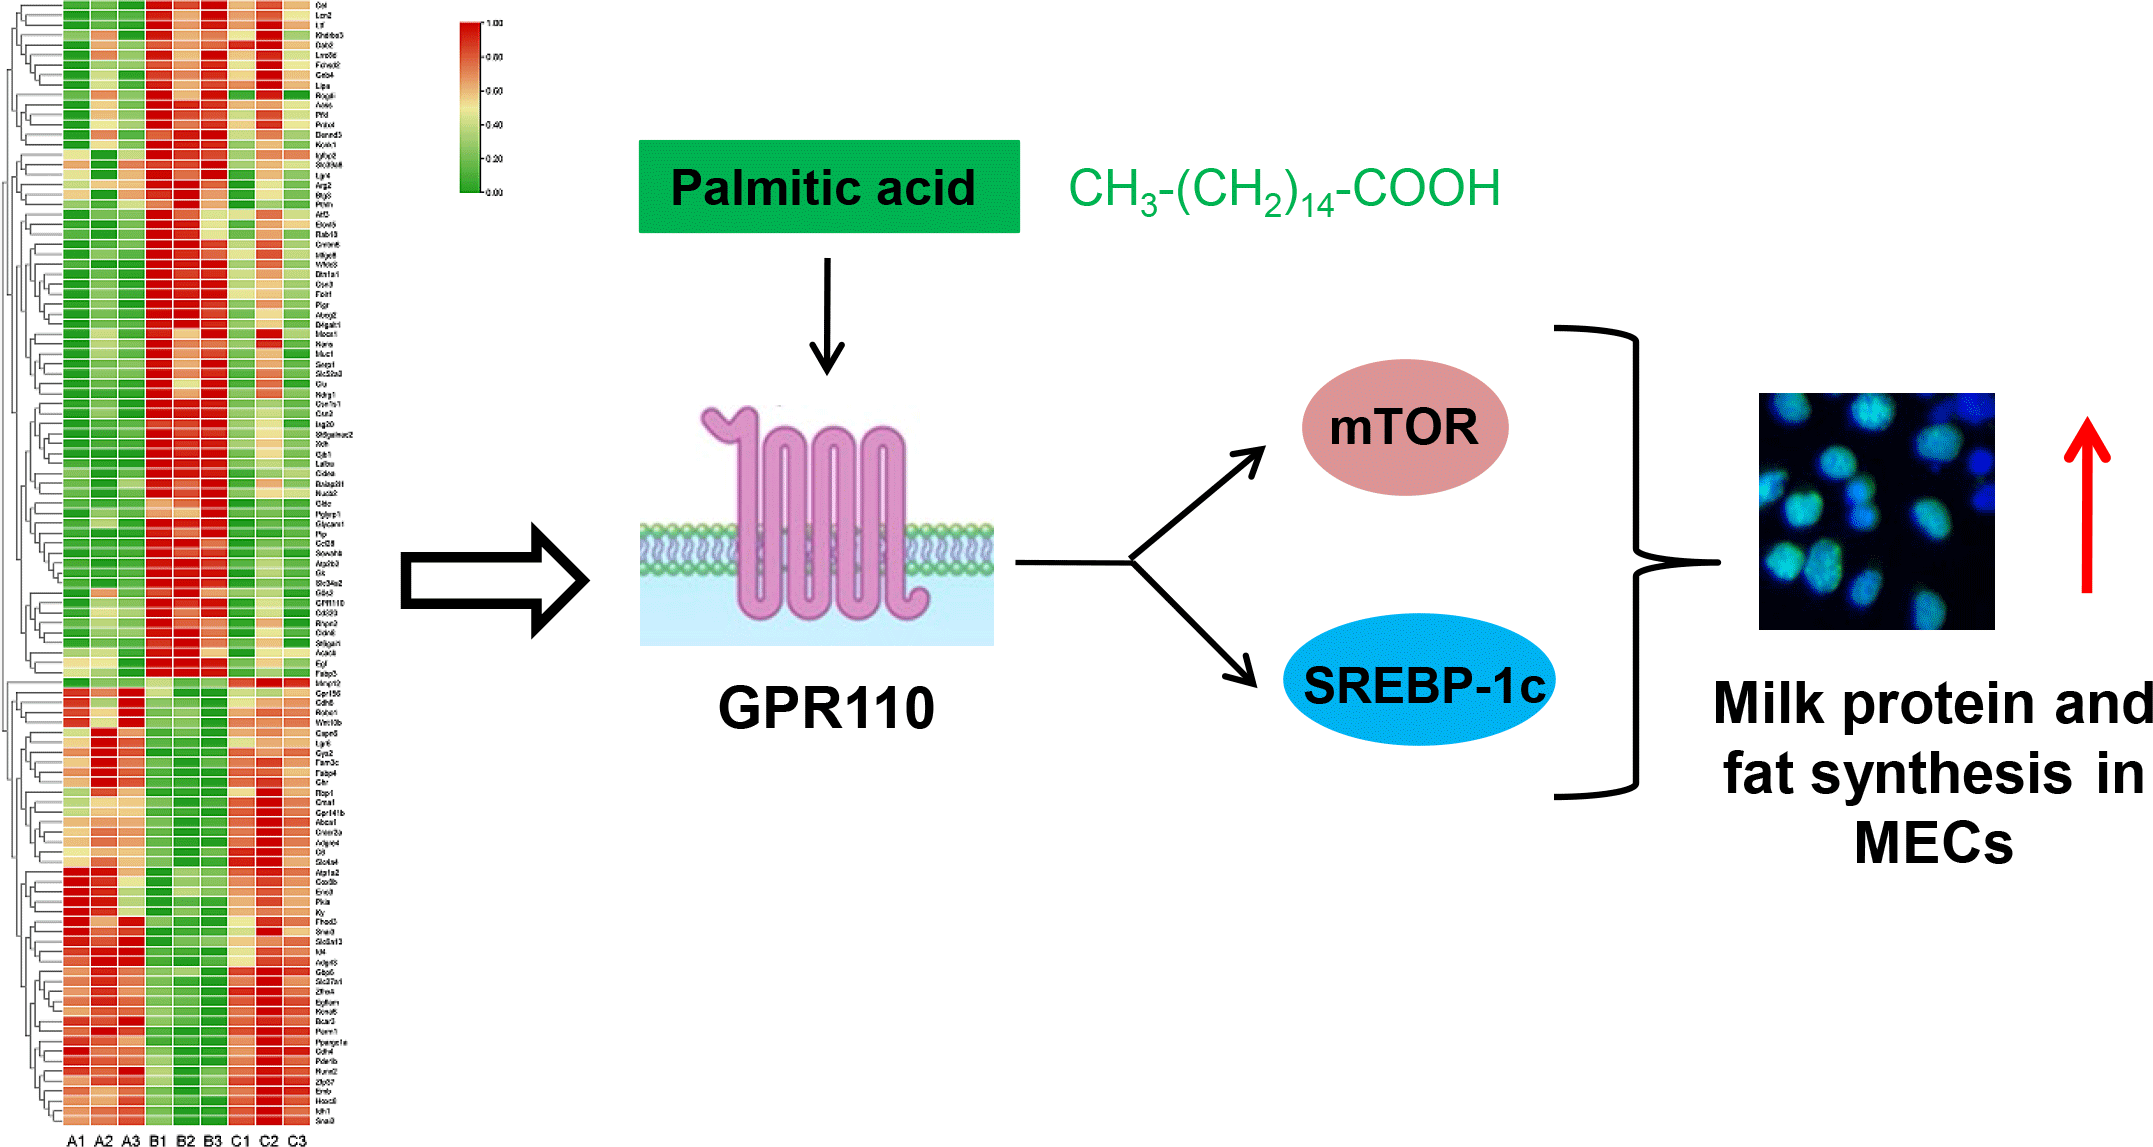
We further investigated whether GPR110 can sense amino acids or fatty acids to regulate milk protein and fat synthesis and cell proliferation. Met addition (0, 0·2, 0·4, 0·6, 0·8, 1·0 mM) affected mTOR phosphorylation in a dose-dependent manner (Fig. 8(a) and (b)), in consistent with our previous report(Reference Qi, Meng and Jin16). GPR110 protein level was not varied under Met treatment (Fig. 8(a) and (c)), suggesting that GPR110 might not response to Met to function in milk protein and fat synthesis and cell proliferation. PA addition (0, 40, 80, 120, 160, 200 μM) affected in a dose-dependent manner β-casein levels in cells (online Supplementary Fig. S2(a) and (b)), lipid droplet formation in cells (online Supplementary Fig. S2(c)), TAG secreted by cells into culture medium (online Supplementary Fig. S2(d)), cell proliferation ability (online Supplementary Fig. S2(e)) and cell number (online Supplementary Fig. S2(f)). These indexes were increased first and then decreased, reaching the peak at 120 μM PA concentration. Addition of different concentrations of PA led to changed mTOR phosphorylation in a dose-dependent manner as the same trend of milk protein and fat synthesis and cell proliferation (Fig. 8(d) and (e)). GPR110 protein level was also varied in the same trend (Fig. 8(d) and (f)). These data suggest that GPR110 might be related to the stimulation of PA on mTOR phosphorylation, milk protein and fat synthesis and cell proliferation. GPR110 knockdown (Fig. 8(g) and (h)) totally abolished the stimulation of PA (120 μM) on mTOR phosphorylation (Fig. 8(g) and (i)) and SREBP-1c expression (Fig. 8(g) and (j)). These above data reveal that GPR110 is a key mediator in the stimulation of PA on the mTOR and SREBP-1c signalling pathways.
Effects of Met and PA on GPR110 expression and GPR110 knockdown on PA-stimulated mTOR and SREBP-1c signalling. (a) HC11 cells were treated for 24 h with different concentrations of Met (0, 0·2, 0·4, 0·6, 0·8 and 1·0 mM). Western blotting was performed to analyse GPR110 protein level and mTOR phosphorylation. (b) and (c) Relative folds of p-mTOR/mTOR (B) and GPR110/β-actin (c) from the Western blots in (a) were quantified by greyscale scan. (d) HC11 cells were treated for 24 h with different concentrations of PA (0, 40, 80, 120, 160 and 200 μM). Western blotting was performed to analyse mTOR phosphorylation and GPR110 protein level. (e) and (f) Relative folds of p-mTOR/mTOR (E) and GPR110/β-actin (f) from the Western blots in (d) were quantified by greyscale scan. (g) HC11 cells were treated with PA (120 μM) and transfected with a GPR110 siRNA for 24 h. Indicated protein levels were detected by Western blotting. (h)–(j) Relative folds of GPR110/β-actin (H), p-mTOR/mTOR (i) and SREBP-1c/β-actin (j) from the Western blots in (g) were quantified by greyscale scan. Data were expressed as mean values with their standard errors (n 3). Values with different superscripted lowercase letters indicate significant difference from each other (P < 0·05). Each column represented a sample, and each row represented a gene. Red indicated up-regulated DEG and blue indicated down-regulated DEG. On the left was the dendrogram of gene clustering. A1, A2 and A3 represented three mice at puberty; B1, B2 and B3, three mice at lactation; C1, C2 and C3, three mice at involution. (a) HC11 cells were treated for 24 h with different concentrations of PA (0, 40, 80, 120, 160, and 200 μM). Western blotting was performed to analyse β-casein protein level. (b) Relative folds of β-casein/β-actin from the Western blots in (a) were quantified by greyscale scan. (c) Lipid droplet in cells was dyed with BODIPY (green), and cell nuclei were stained with DAPI (blue). Scale bar = 15 μm. (d) The concentration of TAG in cells was determined by using a TAG detection kit. (e) Cells proliferation ability was determined by using an EdU assay kit. Scale bar = 15 μm. (f) Cell number was determined by using a CCK-8 assay kit. Data were expressed as mean values with their standard errors (n 3). Values with different superscripted lowercase letters indicate significant difference from each other (P < 0·05). mTOR, mechanistic target of rapamycin; PA, palmitic acid; CCK-8, Cell Counting Kit-8.

Discussion
It is not fully understood how cells such as MEC sense nutrients for anabolism and proliferation; especially, it is almost unknown the GPCR sensing long-chain SFA. In this study, we used transcriptome sequencing to analyse gene expression profiles of mouse mammary gland tissues at puberty, lactation and involution stages. The DEG in lactation stage library compared with puberty and involution contained the largest number of genes in the metabolic pathway. We further screened out 113 lactation-related genes (sixty-five genes were up-regulated and forty-eight genes were down-regulated during lactation), including eight GPCR: GPR110, LGR4, GPR35, GPR156, LGR6, ADGRE4, ADGRL3 and GPR141b, which were verified by qRT-PCR analysis. We further identified that GPR110 is a positive regulator for milk fat and milk protein synthesis and proliferation of MEC, mTOR phosphorylation and SREBP-1c expression. PA but not Met affected GPR110 expression in a dose-dependent manner. GPR110 knockdown blocked the stimulation of PA on mTOR phosphorylation and SREBP-1c expression.
In the eight GPCR found in the transcriptome sequencing, the expression of GPR110, LGR4 and GPR35 was found up-regulated at the lactation stage, whereas GPR156, LGR6, ADGRE4, ADGRL3 and GPR141b were found down-regulated at the lactation stage. LGR4, frequently referred to as GPR48, is the GPCR for stem cell growth factor R-spondins(Reference Carmon, Gong and Lin17). LGR4 can activate the canonical Wnt signalling and play a crucial role in the survival of stem cells and development of multiple organs including mammary gland(Reference Yue, Yuan and Zeng18). GPR35 is a class A, rhodopsin-like GPCR and remains defined as an ‘orphan’ GPCR, though a diversity of ligands has been suggested as its presumptive agonists(Reference Quon, Lin and Ganguly19). These ligands include tryptophan-derived kynurenic acid, the chemokine CXCL17, phospholipid derivate lysophosphatidic acids, etc., and thus GPR35 can be considered as a metabolite-sensing GPCR(Reference Kaya, Melhem and Niess20). It has not been reported the role of LGR4 and GPR35 in amino acid and fatty acid sensing.
GPR156 is an orphan GPCR, with little reports on its function. A recent report suggested that GPR156 is a critical regulator of hair cell orientation(Reference Kindt, Akturk and Jarysta21). Another report suggested that the expression of GPR156 is related to immunity and inflammation(Reference Zarei Ghobadi, Emamzadeh and Teymoori-Rad22). LGR6 has been reported a high affinity receptor for the Wnt agonist R-spondins(Reference Gong, Carmon and Lin23). LGR6 has been reported to be related to the inflammatory process(Reference Chiang, Libreros and Norris24), tumour cell proliferation(Reference Kong, Ou and Li25) and osteoprogenisis(Reference Liu, Zhou and Tang26). ADGRE4, also named as EMR4, is an orphan adhesion GPCR, which is related to immune cell function, but there are yet few reports on its detailed role in cellular physiology(Reference Hamann, Hsiao and Lee27). ADGRL3, also named as latrophilin, is also an adhesion GPCR. It is still largely unknown the role of ADGRL3 in cell anabolism and proliferation. A previous report showed that ADGRL3 reduced cAMP levels in pancreatic β cells and decreased insulin secretion(Reference Röthe, Thor and Winkler28). GPR141b is a class A orphan receptor, and there are almost no reports on its role in cells. A sequence structure-based phylogeny of GPCR analysis suggests that n-arachidonylglycine is a potent ligand of GPR141(Reference Kakarala and Jamil29). n-Arachidonylglycine is related to cellular oxidation and inflammation(Reference Zaccagnino, Saltarella and D’Oria30). Basing on these previous reports, we speculate that the five down-regulated genes GPR156, LGR6, ADGRE4, ADGRL3 and GPR141b might mainly be associated with the immune and inflammation response in MEC. Gp130, a common receptor of cytokines, controls death of MEC and mammary gland involution(Reference Zhao, Hart and Cheng31). These above reports support the idea that, at lactation stage, MEC mainly carry out anabolism and proliferation and reduce immune and inflammatory reactions.
GPR110 is an adhesion GPCR, and previous reports showed that n-docosahexaenoylethanolamine (synaptamide), an endogenous metabolite of DHA, is an endogenous ligand of GPR110(Reference Lee, Huang and Kwon32,Reference Huang, Hu and Kwon33) . It has been established that GPR110 is an oncogene in various cancers(Reference Lum, Wang and Beck-Engeser34,Reference Nam, Kim and Kang35) , but it is yet largely unknown the role of GPR110 in normal cells. Recent reports showed that GPR110 activation promoted axon growth after nerve injury through the cAMP/protein kinase A signalling pathway(Reference Kwon, Kevala and Xin36). In this study, we found GPR110 was highly expressed in mammary gland at lactation stage. GPR110 positively regulated milk fat and milk protein synthesis and proliferation of MEC and mediated the stimulation of PA on mTOR phosphorylation and SREBP-1c expression. Our experimental data are in agreement with these previous reports and further uncover the critical role of GPR110 in PA-regulated mTOR and SREBP-1c signalling pathways.
PA is the main substrate for synthesis of TAG, which are the main component (∼98 %) of milk fat. In cells, PA is also an important component of cellular structures, precursor of signalling mediators and carrier of metabolic energy(Reference Offermanns37). Previous reports have pointed out that PA is an important extracellular stimuli and can stimulate the mTOR and SREBP-1c pathways(Reference Triki, Rinaldi and Planque38,Reference Bai, Wu and Deol39) , in consistent with our experimental data. We have previously shown that mTOR inhibition leads to decreased milk protein and fat synthesis in MEC(Reference Qiu, Qu and Zhen40–Reference Lin, Qi and Guo42). Thus, we consider that PA can promote milk protein and fat synthesis through the mTOR signalling. The concentration of PA selected in the present study is 120 μM. Previous studies have shown that the human serum concentration of PA ranges from 50 to 200 μM(Reference Sztefko and Panek43,Reference Moran, Basu and Milla44) , indicating that the 120 μM concentration of PA might be a physiological animal serum concentration that promotes milk synthesis in mammary gland. It is still largely unknown the GPCR sensing long-chain SFA including PA(Reference Kimura, Ichimura and Ohue-Kitano12,Reference Yonezawa, Kurata and Yoshida45) , though it has been reported that GPR40 and GPR120 can be weakly activated by long-chain SFA(Reference Kimura, Ichimura and Ohue-Kitano12,Reference Offermanns37) . Our experimental data suggest that GPR110 might be a receptor of PA, and it is worth to be studied in future the role of PA-GPR110 in regulating milk production in mice in vivo. It is yet unknown how GPR110 can stimulate mTOR phosphorylation and SREBP-1c expression. We have previously shown that PA can stimulate mTOR phosphorylation and SREBP-1c expression through activating PI3K(Reference Guo, Qi and Lin46,Reference Jin, Zhen and Wang47) , which is often a downstream signalling molecular of many GPCR such as GPCR6A(Reference Li, Li and Wang8,Reference Jin, Zhen and Wang47) . We thus speculate that GPR110 can stimulate mTOR phosphorylation through the PI3K signalling.
Conclusions
In summary, we identify that the DEG at lactation stage are mainly genes in the metabolic pathway, and screen out 113 lactation-related genes including eight new GPCR. We further reveal that GPR110 mediates PA to activate the mTOR and SREBP-1c pathways to promote milk protein and fat synthesis as well as cell proliferation. Our findings provide a new theoretical basis for using PA and other nutritional molecules to improve milk production and quality.
Acknowledgements
This study was supported by grants from the National Natural Science Foundation of China (No. 31700683).
M. Z. and X. G. designed the study and wrote the paper. Z. M. and H. Q. performed most experiments. X. C. and R. L. analysed the data.
The authors declare that they have no known competing financial interests or personal relationships that could have appeared to influence the work reported in this paper.


