



With between 27 and 41 % of the South Asian population underweight and 8 to 41 % overweight, accurate, affordable and appropriate methods for measuring dietary intake are needed( Reference Black, Allen and Bhutta 1 , 2 ). However, few dietary intake methods have been tailored to the South Asian context, where literacy rates are low( 3 , 4 ) and the burden of data collection falls on literate interviewers( Reference Gibson 5 ). Interviewer-led methods may be prospective, such as weighed food records, or retrospective, such as FFQ or 24 h dietary recalls that rely on respondent recall to quantify their intakes( Reference Cade, Thompson and Burley 6 , Reference Gibson and Ferguson 7 ). Prospective and retrospective methods have different sources of error, such as modified eating patterns for weighed methods or response bias for recall methods( Reference Bingham 8 ), but total levels of error are similar( Reference Poslusna, Ruprich and de Vries 9 ).
In the resource-constrained context of South Asia, recall methods are often chosen over weighed methods because they are cheaper, quicker and more feasible for large sample sizes, and they are less intrusive and so more culturally appropriate( Reference Margetts and Nelson 10 , Reference Thompson and Byers 11 ). For instance, recall methods take a short time whereas weighed methods take at least one full day and so recall methods are less burdensome on the (traditionally female) cook, who may have a high workload and pressure to fulfil her duties at home( Reference Panter-Brick 12 , Reference Bains, Kaur and Mann 13 ). Also, unlike weighed methods, recall methods do not require interviewers to come into contact with food. In many Hindu households leftover food is considered ritually unclean (jutho), so weighing leftover food may not be permitted( Reference Gittelsohn 14 ) and there might be issues with respondents perceiving that interviewers of certain castes are ‘polluting’ the kitchen( Reference Parry 15 , Reference Lüthi 16 ).
Despite the financial and practical benefits, a major limitation of recall methods is that they rely on respondent memory. Photographic atlases of graduated portion sizes, three-dimensional food models, utensils and new computer-based methods have all been used as aids for respondents to quantify their intakes( Reference Gibson and Ferguson 7 , Reference Cypel, Guenther and Petot 17 – Reference Lanerolle, Thoradeniya and Silva 19 ). Evidence suggests that there is little or no benefit of using food models instead of photographs. One study found limited benefit from using food models instead of photographs, with models performing better, equally and worse than two-dimensional images for various food types( Reference Godwin, Chambers and Cleveland 20 ). Another study found that photographs resulted in more accurate estimations than food models and measuring cups( Reference Bernal-Orozco, Vizmanos-Lamotte and Rodríguez-Rocha 21 ).
To our knowledge, no studies have tested the validity of a South Asian photographic atlas among adults in this context. One study tested a photographic atlas on eighty children in Sri Lanka( Reference Thoradeniya, de Silva and Arambepola 22 ). The authors reported that 57 % of portion size estimations using life-size photographs were estimated correctly (i.e. respondents selected the closest portion size image) and the ratio of estimated and actual weights was close to 1 but with a wide confidence interval. Another study from Pakistan reported that 76 to 100 % of twenty-one respondents selected the correct portion size( Reference Kulsoom, Mushtaq and Hakeem 23 ).
These studies, and numerous others not from South Asia( Reference Ovaskainen, Paturi and Reinivuo 24 – Reference Venter, MacIntyre and Vorster 33 ), have reported bias (percentage error), percentage of correct photographs selected, ratios between estimated and weighed portions and/or correlations between weighed and recall methods. These are important measures for tools that are developed to aid the estimation of group-level mean nutrient intakes and risks of nutrient deficiency( Reference Gibson 5 ). However, for studies aiming to assess diet at the individual level, these measures may mask large measurement errors between individuals, fail to account for image selection that would occur by chance and show association but not agreement between weighed and recalled estimates. This means that, for studies aiming to assess diet at the individual level, additional measures of validity are needed.
Globally, few studies have validated photographic atlases for individual dietary assessment using appropriate measures of agreement such as Bland–Altman limits of agreement (LOA) or Cohen’s weighted kappa (κ w). To illustrate this, a non-systematic review of studies that did report agreement between weighed and recalled methods is summarised in Table 1 ( Reference Huybregts, Roberfroid and Lachat 34 – Reference Turconi, Guarcello and Berzolari 39 ). No studies were available from South Asia and only one study reported LOA in terms of nutrient intakes. This step of converting portion sizes to nutrient intakes may be useful for showing the nutritional implications of bias associated with different food items.
Review of studies that have reported agreement between weighed and recalled portion estimations using a photographic atlas

* Respondents were only shown the portion and did not consume it.
† Multiple measurements per individual in these analyses mean that data assumption of non-independence of scores for Bland–Altman limits of agreement does not hold.
The present paper addresses these research gaps by assessing the validity of a South Asian photographic food atlas using measurements of agreement between weighed and estimated portion sizes in terms of grams and nutrient intakes. The paper also describes the cultural and practical challenges of creating and validating the atlas in the plains of Nepal.
Materials and methods
Study setting and population
The study was conducted in Dhanusha and Mahottari districts in the Terai (southern plains) region of Nepal. This site was chosen because the photographic atlas under test was intended for subsequent use in the same districts in a cluster randomised controlled trial. The Low Birth Weight South Asia Trial (LBWSAT; http://www.controlled-trials.com/ISRCTN75964374) was conducted by Mother and Infant Research Activities (MIRA) and University College London (UCL) Institute for Global Health, in partnership with the World Food Programme, Save the Children and the Institute of Fiscal Studies. It tested the effect of a pregnancy-focused behaviour change intervention, with or without food or cash transfers, on newborn weight and infant weight-for-age. The photographic atlas was intended for a sub-study using a 24 h dietary recall method to measure the trial effects on intra-household food distribution between pregnant women, their mothers-in-law and the male household heads. The main outcome of the sub-study is relative dietary energy adequacy ratio and secondary analyses refer to protein and Fe.
The study districts, located on the Indian border, have a predominantly Maithili-speaking population. Poor-quality roads, frequent flooding during the monsoon and high temperatures make travel difficult in the remoter parts of these districts. Being in the Gangetic plains, the land is flat and fertile and used mainly for production of rice, wheat, pulses and vegetables. Despite high food production, only 50 % of households in the Terai are classified as food secure and there is high (30 %) prevalence of underweight and anaemia in women( 40 ), so measurement of intra-household food allocation may help to explain the causes of undernutrition in this region.
Sampling strategy
From March to June 2014, three local, Maithili-speaking, female data collectors (M.K., N.M., J.T.) conducted a cross-sectional survey in forty-eight households. Our sampling frame of respondents matched that of the intra-household food allocation study for which the atlas was intended. That is, we sampled the pregnant woman and, if available, the mother-in-law and male household head. Given financial and time constraints, 101 respondents were interviewed and ninety-five used the photographic food atlas to estimate their intakes for at least one food item. In order to reach this sample size, we randomly sampled forty-eight households from a list of pregnant women in their third trimester of pregnancy who were already enrolled in our trial. We sampled households sequentially until we reached forty-eight households and 101 respondents. To avoid being too intrusive and to capture eating on ‘normal’ days, we did not sample on special celebratory feasting or fasting days where households ate more or less than usual, or ate special types of food.
Development of the photographic atlas
To develop the photographic food atlas, we followed guidance from Nelson and Haraldsdóttir( Reference Nelson and Haraldsdóttir 41 ). Working from a food list prepared for another study( Reference Akhter 42 ), photographs were taken of a range of commonly consumed foods, some of which were amorphous dishes (such as curry or rice), some of which were discrete items that vary in size (such as large and small mangoes) and some of which were volumes (such as spiced lentil soup, or dal). Local women and vendors from rural villages surrounding Janakpur town (Dhanusha district headquarters) prepared the dishes. We initially chose serving sizes using published data on median portion sizes from Nepal( Reference Sudo, Sekiyama and Maharjan 43 ), to find a midpoint portion size. Local colleagues deemed some of these values implausible in this context; so, for those implausible values, we chose a different midpoint and size of increment. Different midpoints and increments were selected by asking local community members from nearby villages what a ‘typical’, ‘small’ and ‘large’ portion looked like and corroborating their answers with responses from other community members. All portions were weighed accurately to 0·1 g using digital Tanita KD321 weighing scales. A study that tested which camera position was most effective (aerial or angled) showed no significant differences( Reference Subar, Crafts and Zimmerman 25 ); so, in the same way as Turconi et al.( Reference Turconi, Guarcello and Berzolari 39 ), pictures were taken at an approximate 45° angle to capture both the depth and width of the portion. The final photographic atlas contained forty different food items, with up to six different portion sizes per item; common or nutritionally important items such as rice had more options, whereas rare or small items like nuts or chutney had fewer.
Images were scaled to life size, according to findings from Thoradeniya et al.( Reference Thoradeniya, de Silva and Arambepola 22 ) that found more accuracy with life-size photographs than small photographs or household utensils. The background and utensil was removed and the food image was superimposed on to an image of a plain utensil to keep the images consistent and to minimise distraction from other non-food variation. Images were processed using Microsoft® Word, GNU Image Manipulation Programme (GIMP©) and Adobe Photoshop© and printed in colour. Figure 1 shows some examples of portion images, the sizes of these portions and the cut-offs within which a selected image would correctly represent a given portion.
Examples of portion size images (not to scale), their sizes (g) and the cut-offs (g) within which a selected image would correctly represent a given portion

Validation process
Female interviewers conducted the validation study over a 2 d period per household. In all households, the cook was a woman and it was essential that the data collectors were also female because they needed to spend prolonged periods of time together. Because the data collectors were high caste we experienced no problems entering and working in the kitchen, although they were careful to respect the kitchen space and would usually work near to (but just outside) the kitchen where possible.
On the first day, for each respondent, data collectors recorded food items consumed, portion sizes of all servings and the weights of any leftovers over one mealtime, using paper forms and weighing scales accurate to 0·1 g (Tanita KD321, Goldtech) and 0·5 g (Goldtech, ClaTronic). Weighing scales broke frequently, perhaps due to the hot and humid climate, so we gave interviewers calibration weights to check the scales before every interview and replaced scales when needed. We found that weighing a ritually unclean jutho plate, from which a person had already eaten, made the weighing scale jutho by transference and so it was not appropriate to weigh new portions on a scale that had previously weighed leftovers. Leftovers were weighed on a separate scale, although the process remained socially uncomfortable. Respondents also reported whether leftovers were mixed with other foods and to whom any leftovers were given.
On the second day, to reduce interviewer bias, a different data collector asked the same respondents to estimate how much they each ate the previous day using the photographic atlas. A full 24 h recall was obtained but the corresponding recalled portions that were weighed the previous day were matched for the validation analyses. To ensure that recall data were as accurate as possible, we used a ‘five-stage multi-pass’ method that has been shown to reduce under-reporting( Reference Moshfegh, Rhodes and Baer 44 ) in conjunction with the photographic atlas. In brief, respondents were probed to describe their food intake over the previous 24 h using these five different ‘passes’( Reference Moshfegh, Rhodes and Baer 44 , Reference Ferguson, Gadowsky and Huddle 45 ):
-
1. collect a free recall, using non-specific probes, starting from when the respondent woke up the previous morning;
-
2. probe using a standard list of commonly forgotten foods (such as supplements, alcoholic drinks and fruit);
-
3. ask for the time and place that each item was consumed;
-
4. collect portion size information using the atlas and clarify the exact food types; and
-
5. use a series of final probes (referring to snacks and food eaten outside the home) and recap all recorded foods in chronological order.
On both days, data collectors recorded the food items by entering a 4-digit food code (rather than the food name) on a paper form. Because of the large number of food items, food names and their corresponding codes were listed on an Android application (Open Data Kit, ODK Collect 1·4·3; an open-source, cloud-based platform)( Reference Hartung, Lerer and Anokwa 46 ) that the data collectors used to look up food items and find the correct code.
Data collectors were trained to put the respondents at ease and to be non-judgemental about food intake, and they were provided with a training manual with guidelines on how to minimise social desirability bias and examples of non-leading probes that they could use. Because anthropometric status is thought to be associated with response bias( Reference Johansson, Wikman and Åhrén 47 , Reference Heerstrass, Ocke and Bueno-de-Mesquita 48 ), mid-upper arm circumference of all respondents, and weight and height of non-pregnant respondents, were taken using Seca circumference tapes, Tanita solar scales 302 and Shorr Board stadiometers, respectively.
Energy intakes (in kilocalories; 1 kcal=4·184 kJ) were calculated using a food composition table that H.H.-F. compiled from multiple sources, including the US Department of Agriculture( 49 ), McCance and Widdowson’s The Composition of Foods Integrated Dataset 2015 ( 50 ), the Bangladesh food composition table( Reference Shaheen, Rahim and Mohiduzzaman 51 ), the Nepal food composition table( 52 ) and other peer-reviewed published sources for rare items. For a few items, such as supplements and some locally packaged foods, nutritional data on the packets were used.
For mixed dishes made with multiple ingredients, data collectors collected 174 local recipes during the creation of the atlas, piloting and the validation study. The number of recipes for each mixed dish depended on how common the dish was, ranging from between one and thirty-two recipes per dish. All raw ingredients and the final weight of the mixed dish were weighed, and the nutritional content was calculated by summing the nutritional contents from all raw ingredients and calculating the summed nutrients as a proportion of the final dish weight. This was then reported as nutrients per 100 g of the mixed dish. For food items with more than one recipe, the average nutritional composition was calculated. For items with no recipe (e.g. rare meat curries or out-of-season vegetable curries), the most similar recipe was used and the main ingredient was substituted. For example, to create a duck meat curry recipe, duck meat replaced goat meat and the rest of the curry ingredients were kept the same. A total of 127 dish recipes were analysed from 174 locally collected recipes, forty-five imputed recipes (based upon substitutions using locally collected recipes), three published recipes( Reference Shaheen, Rahim and Mohiduzzaman 51 , Reference Sharavathy, Urooj and Puttaraj 53 ) and six recipes from various online sources that were referenced in full in the food composition table.
The validation study method was modified iteratively during a series of pilot studies in sixteen households. Data collectors received 8 d of training in the office and then practised the validation seven times each in nearby villages. None of the pilot or practice data were included in the results because the method changed substantially during the piloting process and the practice data were expected to have high levels of error. Supervisors (H.H.-F. and P.P.) monitored 10 % of the interviews and completed an observation checklist to ensure adherence to protocol. The checklist items included: obtained consent, had all equipment in clean and working order, kept weighing scale on a flat surface, used the tare function on the scale correctly, reported leftover food, all sections of the form completed, non-judgemental interviewing technique. Supervisors also checked data and resolved any illogical or missing data by discussion with the data collectors. Data were then entered into a Microsoft® Excel database and checked for errors.
Analysis
The total weighed portion for a particular food was calculated as the sum of all servings, minus any leftover food. The total portion included any shared foods that were originally served to someone else. Weights of shared and leftover foods that were mixed with other foods (such as rice and spiced lentil soup mixed together) were estimated by assuming equal proportions of food items in the first serving as in leftovers or shared foods.
Bias was calculated as percentage error: [(recalled portion – weighed portion)/weighed portion] ×100. Cohen’s κ w was calculated to assess the agreement between the selection of portion size images and the portion size image that should have been selected according to the weighed portion( Reference Cohen 54 ). To do this, the weighed portion size was converted into an ordinal variable to represent the image number that the respondent should have chosen. The cut-off points were the midpoints (shown in Fig. 1) between each portion size in the atlas (Fig. 1 and Table 3). Respondents were allowed to choose in-between two portion sizes but, because few respondents used this option (and therefore the atlas was used without this option in a later study), these observations were excluded from the analyses. Analyses with these ‘in-between’ values produced similar results. The κ w statistic adjusts for agreement in selection of portion sizes that might occur due to chance, and quadratic weights allowed for partial agreement, giving proportionally larger penalties for greater distances between observed and selected images. For example, if a respondent ate a portion size of 10 g and had an option of three images depicting 10, 50 and 90 g, then image 1 would be the best option with perfect agreement (weighted 1), image 3 would show no agreement (weighted 0) and image 2 showing 50 g would be worse than image 1 but better than image 3 (weighted 0·75).
Bland–Altman plots for intakes of energy, protein and Fe were used to show the agreement between weights and recall estimates(
Reference Bland and Altman
55
). These show the differences in nutrient intake between recalled and weighed portions plotted against the mean intakes calculated by the two methods. LOA at 5 % significant level were calculated as the mean difference±1·96sd. Confidence limits for the mean difference were calculated as the mean±1·96se of the mean, and for the LOA as the limit±1·96se of the limits. se of the limits was approximated as $\scriptstyle {\sqrt {3{( \scale 70%{ \rm SD})}^{2} \,/\,n} }$
, where n is the sample size, because of the smaller number of scores at the limits(
Reference Bland and Altman
56
). Bland–Altman plots and LOA for portion size weights were not calculated for all 245 recalled portions because each respondent reported multiple portion sizes and so the assumption of independence does not hold.
$\scriptstyle {\sqrt {3{( \scale 70%{ \rm SD})}^{2} \,/\,n} }$
, where n is the sample size, because of the smaller number of scores at the limits(
Reference Bland and Altman
56
). Bland–Altman plots and LOA for portion size weights were not calculated for all 245 recalled portions because each respondent reported multiple portion sizes and so the assumption of independence does not hold.
Intraclass correlation coefficients (ICC) were used to assess the strength of possible within-household clustering expressed as a random effect. LOA for individual food items were not reported because the estimated portion sizes were ordinal, rather than continuous, and so Cohen’s κ w was deemed more appropriate. Non-parametric methods were used to measure associations between respondents and percentage error in energy estimation because percentage error was negatively skewed. Statistical significance was defined at 5 % level. All analyses were performed using the statistical software package Stata SE 14 (2015).
Results
Response rate
Figure 2 shows the response rate at the individual and household levels. We visited fifty-eight households to obtain our target of forty-eight households (83 % response rate). Seven households were empty and three refused. Within these forty-eight households we aimed to sample three household members: the pregnant woman, household head and mother-in-law. This gave a maximum of 144 potential respondents. However, in some cases, the pregnant woman or mother-in-law was also the head of the household (Fig. 2) and so only one or two household members could be sampled. For instance, if the mother-in-law was also the household head, she was sampled along with the pregnant woman, giving only two respondents. If the pregnant woman was the head of a nuclear household (i.e. was not living with her in-laws), then only the pregnant household head was sampled. Some household members were temporarily unavailable or not living in the home, and a few did not use the photographic atlas to estimate their portion sizes because they consumed discrete food items (such as bananas) for which no atlas images had been created. In total, we obtained dietary recalls from ninety-five individuals (58 % total response rate) and 245 validated portion size estimations.
Response rate of households that were randomly sampled in their homes

The total energy intake over one main meal from this sampled number of individuals (n 95) ranged from 377 to 9397 kJ (90 to 2246 kcal), with a mean of 3443 kJ (823 kcal) and se of 142 kJ (34 kcal). The mean and sd of the differences in energy intakes estimated from using the photographic atlas and the intakes calculated from weighed food portions were 577 kJ (138 kcal) and 1469 kJ (351 kcal). Following Bland and Altman( Reference Bland and Altman 55 ), these summary statistics and sample size ensure a confidence limit of LOA with length 259 kJ (62 kcal).
Study population and diet characteristics
Respondent characteristics are provided in Table 2. The average respondent age was 36 years and 76 % of respondents were women (all household heads were male). These variables have been described as possible determinants of recall estimates( Reference Nelson and Haraldsdóttir 41 ). Mid-upper arm circumference was used as a comparative anthropometric measure for all respondents because BMI is difficult to interpret during the third trimester of pregnancy. In most households the pregnant woman was the main cook (83 %).
Characteristics of respondents, a random sample of ninety-five adults in forty-eight rural households with a pregnant woman in southern Nepal, March–June 2014

* Response rate=83·2 %; all other variables had 100 % response rate.
The 245 portions, estimated by recall using the food atlas, came mainly from the six most frequently consumed items, plus twenty-five other portions for other food items. The mean bias associated with the six most frequently consumed items, and the overall mean bias from all 245 portions, is shown in Table 3. This overall mean bias shows that respondents tended to underestimate portion sizes by 4·5 (se 3·9) %. Rice and bhujiya (spiced fried potato) had the smallest bias (−11 % and −13 %, respectively) whereas sag (green leafy vegetables, cooked with salt and oil) had the largest (+40 %).
Bias (percentage error) between paired weighed and recalled portion sizes among a random sample of ninety-five adults in forty-eight rural households with a pregnant woman in southern Nepal, March–June 2014

Selection error and κ w for rice, dal (spiced lentil soup) and vegetable curry portion sizes are shown in Table 4. The selection error shows how close respondents were to choosing the correct portion size image. The portion sizes for rice, dal and vegetable curry depicted in the atlas and the cut-off points for the selection of each image are shown in Fig. 1. Over three-quarters of the respondents chose the correct portions to within one image larger or smaller. For rice and vegetable curry, selection of portion sizes was significantly better than chance (κ w=0·39 and 0·43, respectively), whereas for dal there was no significant agreement in choice of portion size.
Difference between the selected photograph number and the most closely matching image number, and agreement in selection of portion size images, among a random sample of ninety-five adults in forty-eight rural households with a pregnant woman in southern Nepal, March–June 2014
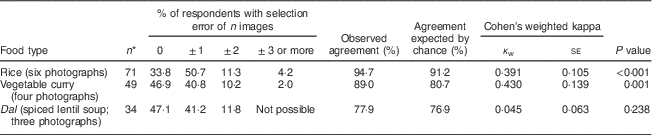
* Recalls were excluded if respondents used multiplication or division factors (e.g. if someone reported having two servings of a portion image) or if respondents recorded recalls that were in between two portion size images.
The correlation coefficient between energy intakes calculated from weighed and recalled portion sizes of individual dishes was 0·446 (P<0·001). The Bland–Altman plots showed agreement between weighed and recalled measures of energy, protein and Fe intakes (Figs 3, 4 and 5, respectively).
Bland–Altman plots assessing the validity of a photographic food atlas of common foods for assessing energy intake among a random sample of ninety-five adults ( , pregnant woman; ●, household head;
  , mother-in-law) in forty-eight rural households with a pregnant woman in southern Nepal, March–June 2014. The difference in energy intake (in kilocalories; 1 kcal=4·184 kJ) between the weighed method and the recall method is plotted v. the mean energy intake from the two methods. ——— represents the mean difference; — · — · — represent the upper and lower limits of agreement (LOA) and – – – – – represent the 95 % confidence interval of the mean difference/LOA. Upper LOA=3456 (95 % CI 2944, 3967) kJ (825·9 (703·6, 948·2) kcal); mean difference =576 (95 % CI 280, 871) kJ (137·6 (95 % CI 67·0, 208·2) kcal); lower LOA=–2304 (95 % CI –2815, –1792) kJ (–550·6 (95 % CI –672·9, –428·3) kcal)

Bland–Altman plots assessing the validity of a photographic food atlas of common foods for assessing protein intake among a random sample of ninety-five adults (, pregnant woman; ●, household head; , mother-in-law) in forty-eight rural households with a pregnant woman in southern Nepal, March–June 2014. The difference in protein intake (in grams) between the weighed method and the recall method is plotted v. the mean protein intake from the two methods. ——— represents the mean difference; — · — · — represent the upper and lower limits of agreement (LOA) and – – – – – represent the 95 % confidence interval of the mean difference/LOA. Upper LOA=22·7 (95 % CI 19·3, 26·1) g; mean difference =3·7 (95 % CI 1·7, 5·6) g; lower LOA=–15·3 (95 % CI –18·7, –12·0) g

Bland–Altman plots assessing the validity of a photographic food atlas of common foods for assessing iron intake among a random sample of ninety-five adults (, pregnant woman; ●, household head; , mother-in-law) in forty-eight rural households with a pregnant woman in southern Nepal, March–June 2014. The difference in iron intake (in milligrams) between the weighed method and the recall method is plotted v. the mean iron intake from the two methods. ——— represents the mean difference; — · — · — represent the upper and lower limits of agreement (LOA) and – – – – – represent the 95 % confidence interval of the mean difference/LOA. Upper LOA=4·8 (95 % CI 4·1, 5·6) mg; mean difference = 0·5 (95 % CI 0·1, 0·9) mg; lower LOA = –3·8 (95 % CI –4·6, –3·0) mg

Since Bland–Altman plots rely on independence of scores, we measured clustering of household members’ mealtime energy intakes within households. One-way random-effects regression models found very low ICC between pregnant women and their mothers-in-law (ICC=0·003; n 29), pregnant women and the household head (ICC=0·160; n 18) and mothers-in-law and household heads (ICC=−0·016; n 14).
Recalled measures of energy intakes per respondent (over the one mealtime that was validated) were under-reported by an average of 577 (95 % CI 280, 870) kJ (138 (95 % CI 67, 208) kcal). The 95 % LOA between weighed and recalled methods were –2305 and 3456 kJ (−551 and 826 kcal). Protein intakes were under-reported by 3·7 (95 % CI 1·7, 5·6) g and the 95 % LOA were −15·3 and 22·7 g. For Fe, intakes were under-reported by 0·5 (95 % CI 0·1, 0·9) mg and 95 % LOA were −3·8 and 4·8 mg. Unlike energy and protein plots, the Fe plot showed heteroscedasticity, with agreement decreasing as Fe intakes increased.
We checked for the plausibility of outliers and differences in respondent characteristics between outliers and non-outliers. The outlier in Fig. 4, where the respondent had much higher intakes of protein, was mainly due to consumption of a large portion of meat curry. Outliers were defined as percentage error in energy estimation of >75 % or <−75 % (n 8). They were not significantly associated with gender (Fisher’s exact test, P=0·675), age (OR=1·01; 9% CI 0·96, 1·20; P=0·735), years of education (OR=0·97; 95 % CI 0·96, 1·06; P=0·809) or mid-upper arm circumference (OR=1·35; 95 % CI 0·99, 1·86; P=0·055). Outliers were also evenly distributed between the three female interviewers.
Univariable analyses found no association between percentage error in energy estimation and gender (Wilcoxon rank-sum test, z=0·113, P=0·910), education category (any or no years of schooling; z=−0·175, P=0·861), age (Spearman’s correlation, ρ=0·062, P=0·551) or mid-upper arm circumference (ρ=−0·069, P=0·548). Multivariable quantile regression to adjust for possible confounding gave similarly non-significant results.
Discussion
The photographic atlas was a useful aid because it enabled the estimation of dietary intakes in populations with low literacy levels, using affordable, practical and culturally appropriate methods. The overall underestimation error of 4·5 % was small compared with the typical range of between 5 and 100 % error reported by Nelson and Haraldsdóttir( Reference Nelson and Haraldsdóttir 57 ).
The different directions and variance in error associated with different food items illustrated the importance of measuring agreement instead of only mean differences. About 85 % of respondents chose the correct portion to within one option bigger or smaller. Although agreement in image selection calculated from κ w results (0·43 and 0·39 for vegetable curry and rice, respectively) could be categorised as ‘modest’( Reference Sim and Wright 58 ), it is significantly better than random selection. The small bias for rice is important because it is the staple food and so the main source of energy. Only one other study measured agreement using κ w and it found better agreement than our study (κ w=0·60 compared with κ w=0·39)( Reference Huybregts, Roberfroid and Lachat 34 ).
One possible reason for the higher percentage error in our population is that respondents might be less able to conceptualise portion sizes and less practised in estimating measures. Also, there may have been more coding error from matching recalls with their corresponding weighed portions because recalls were collected over a full 24 h period whereas weights were collected only for a single meal. People often ate sequentially rather than together in one sitting, and the person eating would eat in private because it was considered rude to eat in front of others who were not eating. This meant that it was sometimes difficult for the data collector to see if all the food was eaten or if the cook had quickly served another portion on the respondent’s plate. The data collectors paid close attention to record any additions or leftovers as far as possible. Alternatively, the difference in agreements may be attributed to the comparative heterogeneity in our sample (we included pregnant women, older women and men rather than only women of reproductive age). Although no significant effects of respondent characteristics (such as age or gender) were found in our study, this may be due to insufficient statistical power rather than absence of a trend.
There is also an intrinsic, random error that exists from using any photographic atlas because it converts continuous portion sizes into ordinal portions. As actual portion sizes decrease, this error increases; for instance, a difference of 100 g in a large actual portion size of 900 g is 11·1 %, but in a small actual portion of 100 g the error is 100 %. This error approaches infinity as actual portion size approaches zero. Since intervals between portion size images are approximately equal, this intrinsic error will be larger (despite still selecting the closest portion image) if actual intake distributions are closer to the lower end of the atlas scale and depending on the intervals between portion sizes. Therefore, differences in percentage error between studies may exist if the respondents were equally discriminant and absolute differences in portion size estimation were equal, but respondents’ actual portion sizes were different. This variance in random error is complicated by the trend for agreement to decrease as portion sizes increase, as shown in the heteroscedasticity in agreement of Fe estimations (Fig. 5) and in agreement shown elsewhere( Reference Turconi, Guarcello and Berzolari 39 ).
LOA between estimated and weighed measurements were wide, although part of this will be explained by the intrinsic error of the ordinal portions in the atlas. Our 95 % LOA were wider than those in the one other study that reported limits (i.e. –2305 and 3456 kJ (−551 and 826 kcal), compared with 205 and 678 kJ (49 and 162 kcal))( Reference Lazarte, Encinas and Alegre 36 ). This was to be expected, however, since the other study tested a novel method using photographs taken by the respondents to assist respondents with their the portion size image selection( Reference Lazarte, Encinas and Alegre 36 ).
Strengths and limitations
The lack of agreement associated with dal (spiced lentil soup) may be because it is often spooned directly over rice and so images of ladles may have been more appropriate than images of bowls. Also, the recipes showed that the thickness of the dal varied and so the densities of dal in households may have been different from the density of dal depicted in the image. Therefore, respondents may have chosen the image that best represented the volume, but not the gram weight, of their portions.
Nutrient retention factors, used to correct for the change in nutritional value of foods that occurs when cooking, were not applied when calculating the nutrient composition of dishes. This was because it would not have affected the validity of the atlas and because the atlas was intended for comparisons of dietary intakes in relation to other household members or between trial arms, rather than for exact calculations of nutritional adequacy. However, if the recipes were to be used for other purposes, the recipes may need to be reanalysed to account for these factors.
Data collectors could only weigh intakes over one mealtime, due to the severe cultural challenges that they faced when they initially attempted a full 24 h weighed food record. It was not safe for the women to travel home in the dark after the respondents had eaten their evening meal, and they faced complaints and criticisms from their own communities and the respondents for spending nights and long periods away from home. This meant that 24 h weighed food records were not possible and evening meal validation was limited to 25 % of the sample. For this 25 %, the three data collectors sampled households that were near to each other and stayed overnight together, or were collected by a guardian or MIRA staff member.
Although we measured internal validity (i.e. the ability of the tool to measure what it should measure), we were unable to assess the external validity; further assessment is needed to know if the atlas is valid in other South Asian contexts.
The validation method bears international relevance for individual-level dietary assessment, because it is one of few studies that have used measures of agreement to test a photographic atlas for this purpose under ‘real’ field conditions that the atlas would be used in (e.g. in respondents’ homes, containing similar coding errors, estimating self-served portions of own-made food and collecting recalls 24 h after consumption). However, this approach gave the disadvantage that not all respondents ate the same foods. This meant that the number of observations for each food item was small and only three items in the atlas could be tested well. We must therefore rely on the assumption that people’s ability to recall common and rare items is similar.
The characterisation of agreement using Bland–Altman plots and Cohen’s κ w shows the full extent of the error associated with the atlas, rather than masking errors in both directions by simply reporting the mean bias. Nutrient analyses also add to a scarce body of literature describing the nutritional implications of these errors.
Future research
Future work to reassess the validity could test if edited images result in improved accuracy. In many studies, food atlases were tested during or immediately after serving( Reference Nelson and Haraldsdóttir 57 ), and so further research could test how bias changes with time delay between food consumption and recall.
It is hoped that this is the beginning of an effort to make the measurement of dietary intake more feasible, sources of bias better understood and that other researchers will use the atlas. The lack of recent evidence linking cultural factors (such as food taboos and gender discrimination) with inadequate diets and nutritional status indicates the need for culturally appropriate dietary assessment methods at the individual level( Reference Gittelsohn 14 ). The findings and context-appropriate images in the atlas will enable better understanding of nutritional adequacy and inequity on a large scale, particularly in Nepali and South Asian populations.
Acknowledgements
Acknowledgements: The authors thank Rinku Tiwari, Neha Sharma and Kabita Sah for their help with recipe collection; Sonali Jha for assisting with the training and editing of the food list; and all of the respondents and cooks for sharing their recipes and giving their time to participate in the study. Financial support: This study was funded by the Child Health Research Appeal Trust (CHRAT) and the UK Department for International Development (DFID) (grant number PO 5675). Neither donor had any role in the design, analysis or writing of this article. Conflict of interest: None. Authorship: H.H.-F. prepared the first draft of the manuscript and conducted data analysis. N.S. and M.C.-B. provided input on the analysis. H.H.-F. coordinated the methodological design, with input from P.P., V.P., M.K., N.M., J.T. and N.S. P.P. and V.P. trained data collectors (M.K., N.M. and J.T.) following a manual created by H.H.-F. T.H. processed the data and checked for consistency. D.S.M. and B.S. are project director and project manager, respectively, in Nepal and were responsible for day-to-day oversight and coordination of field activities, and P.P. managed logistics of data collection. A.C. and N.S. are principal investigators of the main trial. All authors read and approved the final manuscript. Ethics of human subject participation: Ethical approval was obtained from the Nepal Health Research Council (108/2012) and the UCL Ethical Review Committee (4198/001). Verbal informed consent was obtained from all subjects. Verbal consent was obtained and formally recorded on paper forms.



