


INTRODUCTION
Cognitive fatigue (also referred to as mental fatigue or brain fatigue) includes a spectrum of deficits affecting motivation, emotion, cognition, and behaviour. Mental exhaustion caused by sensory stimulation and/or prolonged cognitive tasks is a characteristic symptom (Johansson & Ronnback, Reference Johansson, Ronnback and Sadaka2014; Moller, Nordin, Bartfai, Julin, & Li, Reference Moller, Nordin, Bartfai, Julin and Li2017; Moller, Nygren de Boussard, Oldenburg, & Bartfai, Reference Moller, Nygren de Boussard, Oldenburg and Bartfai2014), as well as a specific diurnal pattern where performance decreases continuously during the day (Johansson, Berglund, & Ronnback, Reference Johansson, Berglund and Ronnback2009; Johansson & Ronnback, Reference Johansson and Ronnback2013; Johansson, Starmark, Berglund, Rodholm, & Ronnback, Reference Johansson, Starmark, Berglund, Rodholm and Ronnback2010). Amongst adults, cognitive fatigue is commonly associated with decreased processing speed (Ashman et al., Reference Ashman, Cantor, Gordon, Spielman, Egan, Ginsberg and Flanagan2008; Johansson et al., Reference Johansson, Berglund and Ronnback2009; Johansson, Wentzel, Andrell, Mannheimer, & Ronnback, Reference Johansson, Wentzel, Andrell, Mannheimer and Ronnback2015; Jonasson, Levin, Renfors, Strandberg, & Johansson, Reference Jonasson, Levin, Renfors, Strandberg and Johansson2018), as well as impairments in attention, memory, and executive functions (Boksem, Meijman, & Lorist, Reference Boksem, Meijman and Lorist2005; Cheung et al., Reference Cheung, Brinkman, Mulrooney, Mzayek, Liu, Banerjee and Krull2017; Lindqvist & Malmgren, Reference Lindqvist and Malmgren1993; Puhr et al., Reference Puhr, Ruud, Anderson, Due-Tonnesen, Skarbo, Finset and Andersson2019). Cognitive fatigue in adults is associated with acquired brain injuries, cancer, inflammatory or infectious diseases, and degenerative neurological disorders (Asher, Fu, Bailey, & Hughes, Reference Asher, Fu, Bailey and Hughes2016; de Jong, Candel, Schouten, Abu-Saad, & Courtens, Reference de Jong, Candel, Schouten, Abu-Saad and Courtens2005; Friedman et al., Reference Friedman, Brown, Comella, Garber, Krupp and Lou2007; Huang et al., Reference Huang, Daniels, Lembo, Hartog, O’Brien, Heymann and Sepsis Survivors Engagement2019; Johansson & Ronnback, Reference Johansson, Ronnback and Sadaka2014; Shah, Reference Shah2009).
Cognitive fatigue in children has been investigated in relation to multiple sclerosis (Goretti et al., Reference Goretti, Portaccio, Ghezzi, Lori, Moiola and Falautano2012), traumatic brain injuries (de Kloet et al., Reference de Kloet, Lambregts, Berger, van Markus, Wolterbeek and Vliet Vlieland2015), cancer (Meeske, Katz, Palmer, Burwinkle, & Varni, Reference Meeske, Katz, Palmer, Burwinkle and Varni2004; Varni, Burwinkle, Katz, Meeske, & Dickinson, Reference Varni, Burwinkle, Katz, Meeske and Dickinson2002), sickle cell disease (Panepinto et al., Reference Panepinto, Torres, Bendo, McCavit, Dinu, Sherman-Bien and Varni2014), and rheumatic diseases (Varni, Burwinkle, & Szer, Reference Varni, Burwinkle and Szer2004). Survivors of paediatric brain tumours have been shown to suffer from more cognitive fatigue compared to survivors of leukaemia (Irestorm, Tonning Olsson, Johansson, & Ora, Reference Irestorm, Tonning Olsson, Johansson and Ora2020; Meeske et al., Reference Meeske, Katz, Palmer, Burwinkle and Varni2004; Mulrooney et al., Reference Mulrooney, Ness, Neglia, Whitton, Green, Zeltzer and Mertens2008). While most follow-up protocols after cancer treatment do not yet include measurements of fatigue, there is an increased demand for including it in follow-up protocols for survivors of both paediatric and adult cancer (Berger, Mitchell, Jacobsen, & Pirl, Reference Berger, Mitchell, Jacobsen and Pirl2015; Irestorm et al., Reference Irestorm, Tonning Olsson, Johansson and Ora2020; Limond et al., Reference Limond, Thomas, Bull, Calaminus, Lemiere, Traunwieser and Chevignard2020; Tomlinson et al., Reference Tomlinson, Hinds, Ethier, Ness, Zupanec and Sung2013). Cancer-related fatigue has consistently been found to be one of the most prevalent and distressing symptoms in childhood cancer survivors (Kanellopoulos, Hamre, Dahl, Fossa, & Ruud, Reference Kanellopoulos, Hamre, Dahl, Fossa and Ruud2013; Meeske, Patel, Palmer, Nelson, & Parow, Reference Meeske, Patel, Palmer, Nelson and Parow2007; Spathis et al., Reference Spathis, Booth, Grove, Hatcher, Kuhn and Barclay2015). Despite this, cognitive fatigue is frequently overlooked as a long-term sequela to paediatric cancer diagnosis and treatment (Spathis et al., Reference Spathis, Booth, Grove, Hatcher, Kuhn and Barclay2015; Walter, Nixon, Davey, Downie, & Horne, Reference Walter, Nixon, Davey, Downie and Horne2015). Self-reported outcomes, such as questionnaires, are commonly used and recommended when assessing fatigue after both traumatic and non-traumatic brain injuries (Asher et al., Reference Asher, Fu, Bailey and Hughes2016; Johansson & Ronnback, Reference Johansson and Ronnback2013). Additionally, a multidimensional approach has been recommended in order to facilitate discrimination between different types of fatigue and comorbidities (Berger, Mitchell, et al., Reference Berger, Mitchell, Jacobsen and Pirl2015; Berger, Mooney, et al., Reference Berger, Mooney, Alvarez-Perez, Breitbart, Carpenter and Cella2015; Cramp & Byron-Daniel, Reference Cramp and Byron-Daniel2012).
In contrast to adults, little is known about the relationship between fatigue and cognition in children and adolescents. Cognitive deficits after treatment for paediatric brain tumours are common and well documented. Cranial radiotherapy is the most common risk factor for cognitive impairments (Brinkman et al., Reference Brinkman, Krasin, Liu, Armstrong, Ojha, Sadighi and Krull2016; Ellenberg et al., Reference Ellenberg, Liu, Gioia, Yasui, Packer, Mertens and Zeltzer2009; Scantlebury et al., Reference Scantlebury, Bouffet, Laughlin, Strother, McConnell, Hukin and Mabbott2016; Tonning Olsson, Perrin, Lundgren, Hjorth, & Johanson, Reference Tonning Olsson, Perrin, Lundgren, Hjorth and Johanson2014), but younger age at diagnosis has also been reported as a predictor for long-term deficits (Mulhern et al., Reference Mulhern, Palmer, Reddick, Glass, Kun, Taylor and Gajjar2001; Palmer et al., Reference Palmer, Armstrong, Onar-Thomas, Wu, Wallace, Bonner and Gajjar2013; Palmer et al., Reference Palmer, Gajjar, Reddick, Glass, Kun, Wu and Mulhern2003; Ris et al., Reference Ris, Walsh, Wallace, Armstrong, Holmes, Gajjar and Packer2013; Tonning Olsson et al., Reference Tonning Olsson, Perrin, Lundgren, Hjorth and Johanson2014). Impairment in processing speed is especially common (Kahalley et al., Reference Kahalley, Conklin, Tyc, Hudson, Wilson, Wu and Hinds2013; Palmer et al., Reference Palmer, Armstrong, Onar-Thomas, Wu, Wallace, Bonner and Gajjar2013; Scantlebury et al., Reference Scantlebury, Bouffet, Laughlin, Strother, McConnell, Hukin and Mabbott2016; Tonning Olsson et al., Reference Tonning Olsson, Perrin, Lundgren, Hjorth and Johanson2014), but survivors usually perform significantly poorer than controls or age-adjusted norms on most neuropsychological tests. Impaired performance has been reported regarding attention, working memory, long-term memory, executive functions, and full-scale intelligence quotient (Brinkman et al., Reference Brinkman, Krasin, Liu, Armstrong, Ojha, Sadighi and Krull2016; Ehrstedt et al., Reference Ehrstedt, Kristiansen, Ahlsten, Casar-Borota, Dahl, Libard and Stromberg2016; Krull et al., Reference Krull, Okcu, Potter, Jain, Dreyer, Kamdar and Brouwers2008; Palmer et al., Reference Palmer, Armstrong, Onar-Thomas, Wu, Wallace, Bonner and Gajjar2013; Tonning Olsson et al., Reference Tonning Olsson, Perrin, Lundgren, Hjorth and Johanson2014). The relationship between fatigue and neurocognitive impairments in adult long-term survivors of childhood cancer has been investigated (Cheung et al., Reference Cheung, Brinkman, Mulrooney, Mzayek, Liu, Banerjee and Krull2017; Clanton et al., Reference Clanton, Klosky, Li, Jain, Srivastava, Mulrooney and Krull2011; Meeske, Siegel, Globe, Mack, & Bernstein, Reference Meeske, Siegel, Globe, Mack and Bernstein2005; Puhr et al., Reference Puhr, Ruud, Anderson, Due-Tonnesen, Skarbo, Finset and Andersson2019), but the same associations in children and adolescents have not previously been studied. The aim of the present study was to investigate the relationship between fatigue and impairments in cognition in a paediatric sample of survivors of brain tumours, as this patient group is at risk for both types of deficits.
For clinical neuropsychologists, it is of importance to better understand the association and overlap between fatigue and cognition, in order to avoid misdiagnosis and to offer appropriate interventions.
In line with previous studies on adult survivors of childhood leukaemia (Cheung et al., Reference Cheung, Brinkman, Mulrooney, Mzayek, Liu, Banerjee and Krull2017), we hypothesised general and cognitive fatigue, but not sleep/rest fatigue, to be associated with cognitive measures. Likewise, we expected poorer scores on neurocognitive measures to be associated with more fatigue.
METHODS
Participants
Data were collected as part of a larger clinical project aiming to identify survivors with cognitive impairments to investigate the impact of late effects, and to engage the child and the family with rehabilitative services. All patients were diagnosed with and treated for paediatric brain tumours at Skåne University Hospital in southern Sweden (serving 1.8 million inhabitants). The clinical project includes a baseline testing before the start of treatment and a neuropsychological follow-up assessment.
Inclusion and Exclusion Criteria
Data were extracted from the registry for survivors who completed the neuropsychological follow-up between 2017 and 2019, and survivors 8–18 years of age at assessment were included in the study. A total of 56 survivors in the age group underwent a follow-up testing during that time period. Survivors diagnosed with either autism (n = 1) or intellectual disability (n = 2) prior to treatment were excluded, likewise if they had severe visual impairment (n = 1) or were on cancer therapy for relapse (n = 5). Candidates for epilepsy surgery (n = 2) were also excluded, due to assessment with a different test battery. No survivors were excluded because of low verbal skills nor low full-scale intelligence quotient at follow-up. A total of 45 survivors were eligible for inclusion in the study. The neuropsychological protocol for this patient group includes a baseline testing whenever possible. If a baseline testing was available, it was included in the study, but the lack of baseline cognitive measurements was not an exclusion criterion.
Neuropsychological Tests
Four different cognitive domains were assessed, and nine different cognitive variables were registered. Executive function was measured with the subtests Tower and Trail-Making-Test (TMT) from the Delis–Kaplan Executive Function System (D-KEFS) (Delis, Kaplan, & Kramer, Reference Delis, Kaplan and Kramer2001). For TMT, the scale score equivalent for Item 4 (Number-Letter Switching), time to completion was used. For the Tower test, the total achievement score was used. Processing speed was measured with the Coding and Symbol Search subtests, and the composite Processing Speed Index (PSI) from the age-appropriate Wechsler scale (Wechsler, Reference Wechsler2008, Reference Wechsler2014). Working memory was measured with the Digit Span subtest from the age-appropriate Wechsler scale. Executive function, processing speed, and working memory were assessed at both baseline and follow-up. Additionally, the computer-based Conners’ Continuous Performance Test 3rd Edition (CPT-3) (Conners, Reference Conners2014) was used to measure attention deficits. Due to time constraints before surgery, it was administered only at follow-up.
Measures of Fatigue
The Pediatric Quality of Life (PedsQL™) self-report and parent-proxy versions of the Multidimensional Fatigue Scale were used as a measurement of fatigue and administered at follow-up. The questionnaire provides three different subscales: (1) the general fatigue subscale covers problems due to lack of energy (including specific executive difficulties); (2) the sleep/rest fatigue subscale focuses on quality and amount of sleep; and (3) the cognitive fatigue subscale focuses on problems with memory, attention, and processing speed. This instrument measures fatigue in children and teenagers, and high validity and reliability have been demonstrated across age groups from 2 to 25 years (Varni, Beaujean, & Limbers, Reference Varni, Beaujean and Limbers2013; Varni et al., Reference Varni, Burwinkle, Katz, Meeske and Dickinson2002; Varni & Limbers, Reference Varni and Limbers2008). The questions cover the frequency of different symptoms of fatigue and are scored on a 5-point Likert scale from 0 to 4 (i.e., 0 = ‘never’, 1 = ‘almost never’, 2 = ‘sometimes’, 3 = ‘often’, 4 = ‘almost always’). The answers are reversed and linearly transformed into a scale from 0 to 100, where higher scores indicate less problems. As the impact of fatigue is individual and a subjective experience, it is recommended to use self-reports for the assessment of fatigue in cancer patients (Asher et al., Reference Asher, Fu, Bailey and Hughes2016; Berger, Mooney, et al., Reference Berger, Mooney, Alvarez-Perez, Breitbart, Carpenter and Cella2015). Only the self-reports were therefore used in order to explore the hypothesis.
Statistical Analysis
SPSS Version 26 was used for statistical analyses. All scores were transformed to Z scores (M = 0, SD = 1) using national norms and the scores from CPT-3 were reversed, so that higher scores on all scales indicated less problems. Regression analysis, adjusted for cranial radiotherapy and age at onset, were used to investigate the associations between the nine cognitive variables and the three self-report fatigue subscales. Cranial radiotherapy and younger age at diagnosis are known risk factors for cognitive impairments in survivors of paediatric brain tumours (Brinkman et al., Reference Brinkman, Krasin, Liu, Armstrong, Ojha, Sadighi and Krull2016; Ellenberg et al., Reference Ellenberg, Liu, Gioia, Yasui, Packer, Mertens and Zeltzer2009; Mulhern et al., Reference Mulhern, Palmer, Reddick, Glass, Kun, Taylor and Gajjar2001; Palmer et al., Reference Palmer, Armstrong, Onar-Thomas, Wu, Wallace, Bonner and Gajjar2013; Palmer et al., Reference Palmer, Gajjar, Reddick, Glass, Kun, Wu and Mulhern2003; Ris et al., Reference Ris, Walsh, Wallace, Armstrong, Holmes, Gajjar and Packer2013; Scantlebury et al., Reference Scantlebury, Bouffet, Laughlin, Strother, McConnell, Hukin and Mabbott2016; Tonning Olsson et al., Reference Tonning Olsson, Perrin, Lundgren, Hjorth and Johanson2014), and these variables were therefore adjusted for in the regression analysis, with age at diagnosis in years and radiotherapy coded as yes or no. P-values were adjusted using the Benjamini–Hochberg procedure, with the false discovery rate set to 0.05. The partial correlation coefficient was used to denote the strength of significant associations between neuropsychological variables and fatigue measures. Cognitive variables with a significant association with fatigue were subsequently exploratively examined through graphs and visual analysis. A score of more than 1.5 SD below the normative mean was applied as an indicator of impairment. The main analysis was cross-sectional, with a focus on data from follow-up visits, while baseline data were included in the explorative evaluation. A majority of the survivors (82.2%, n = 37) had undergone a pretreatment neuropsychological assessment, and the difference in test scores between pretreatment tests and follow-up were examined in this analysis. The purpose of the explorative analysis was to investigate symptom manifestation and to identify clinical profiles in survivors with and without fatigue. Furthermore, one-sample t tests were used to compare the results from these cognitive variables with the national norms, in order to determine the magnitude of the impairment.
RESULTS
Participant Demographics
The clinical characteristics of the study group are presented in Table 1. Mean age at diagnosis was 9.40 years (SD = 3.56), and mean age at follow-up was 13.41 (SD = 2.74), which means that the participants were assessed on average 4 years after diagnosis. Treatment had included cranial radiotherapy for 12 (26.7%) of the participants. Tumour types were classified in accordance with the World Health Organization: International Classification of Childhood Cancer, 3rd Edition (Steliarova-Foucher, Stiller, Lacour, & Kaatsch, Reference Steliarova-Foucher, Stiller, Lacour and Kaatsch2005). The distribution of tumour types in the sample was as expected when considering the national incidence and survival rates for each type (Lannering et al., Reference Lannering, Sandstrom, Holm, Lundgren, Pfeifer, Samuelsson and Swedish Childhood2009). Astrocytoma was the most frequent tumour type (44.67%).
Study cohort characteristics (n = 45)

Tumour types were classified in accordance with the World Health Organization: International Classification of Childhood Cancer, 3rd Edition (Steliarova-Foucher et al., Reference Steliarova-Foucher, Stiller, Lacour and Kaatsch2005).
Neurocognitive Variables and Measures of Fatigue
The results from the neurocognitive tests are shown in Table 2. The subtests with the largest group of impaired survivors (defined as a score of more than 1.5 SD below the normative mean) were coding, TMT, and hit reaction time from CPT-3. The results from the questionnaires together with internal consistency are shown in Table 3. Survivors rated themselves to have more cognitive fatigue as compared to general fatigue and sleep/rest fatigue (M = 48.43, SD = 26.80). Cognitive fatigue scores were poor when compared to those reported in healthy controls in Swedish (M = 76.04, SD = 14.75) and Dutch (M = 76.46, SD = 14.53) samples (Gordijn, Cremers, Kaspers, & Gemke, Reference Gordijn, Cremers, Kaspers and Gemke2011; Irestorm et al., Reference Irestorm, Tonning Olsson, Johansson and Ora2020). Impairment on the fatigue subscales was defined as a score below the 10th percentile of healthy children and adolescents. Out of the fatigue subscales, cognitive fatigue was the one affecting the largest group of survivors, with 68.89% scoring below this cut-off. The parent-proxy reports showed a similar profile, with cognitive fatigue being the most affected fatigue domain. Internal consistency was similar to what has previously been reported for the instrument (Gordijn et al., Reference Gordijn, Cremers, Kaspers and Gemke2011; Irestorm et al., Reference Irestorm, Tonning Olsson, Johansson and Ora2020; Varni et al., Reference Varni, Burwinkle, Katz, Meeske and Dickinson2002).
Test results at follow-up
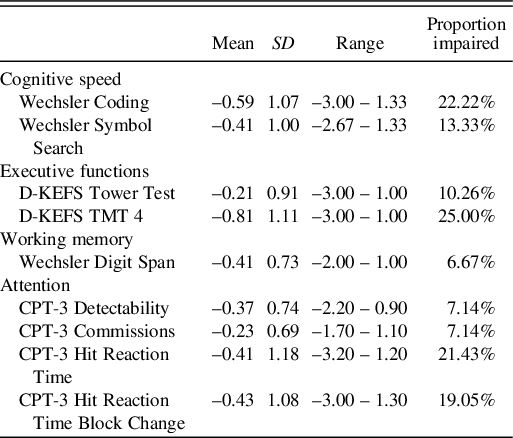
D-KEFS, Delis–Kaplan Executive Function System; TMT, Trail-Making Test; CPT-3, The Conners’ Continuous Performance Test 3rd Edition. Results for neurocognitive outcomes are presented with Z scores (normative M = 0, SD = 1). Results for fatigue subscales are on a scale of 0–100. Higher results on both fatigue subscales and neurocognitive tests indicate less problems. Impairment was defined as a score of more than 1.5 SD below the normative mean for neuropsychological subtests.
Fatigue measurements at follow-up

α, Cronbach’s coefficient alpha. Impairment was defined as a score below the 10th percentile of healthy children and adolescents for fatigue subscales.
Associations Between Neurocognition and Fatigue
The results from the regression analysis of the associations between neurocognitive outcomes and self-report fatigue measures are presented in Table 4, with confidence intervals and Benjamini–Hochberg-adjusted p-values. Significant associations were found for measures of cognitive processing speed and the cognitive fatigue self-rate subscale; Coding: p = .003, r = .583, 95% CI [9.61; 22.83] and Symbol Search: p = .001, r = .585, 95% CI [10.54; 24.87]. A slow processing speed was associated with more fatigue. An increase with 1 Z score in processing speed indicates that the survivors rate their quality of life for cognitive fatigue 16.22 scores higher, which corresponds to more than 1 SD for healthy children and adolescents. Non-significant associations were also found between D-KEFS TMT and cognitive fatigue, p = .126, r = .348, 95% CI [1.89; 16.52], and CPT-3 hit reaction time, p = .278, r = .301, 95% CI [0.33; 15.15]. More fatigue was associated with slower performance on TMT as well as slower hit reaction time.
Cognition related to fatigue in children and adolescents after treatment for brain tumours

D-KEFS, Delis–Kaplan Executive Function System; TMT, Trail-Making Test; CPT-3, The Conners’ Continuous Performance Test 3rd Edition. Non-standardised coefficients for all the neurocognitive outcomes with the self-rating fatigue subscales as dependent variables were adjusted for age at diagnosis and radiotherapy. Results on neurocognitive tests are in Z scores (Mean = 0, SD = 1) and scores on fatigue subscales are on a scale of 0–100. Higher results on both fatigue subscales and neurocognitive tests indicate better performance and less fatigue. Benjamini–Hochberg-adjusted significant p-values are indicated in boldface font.
Explorative Analysis
As both Wechsler processing speed subtests were associated with cognitive fatigue, the composite score PSI (M = 100, SD = 15) was used for the explorative analysis when plotting performance against cognitive fatigue (Figure 1). For PSI, a score of more than 1.5 SD below the normative mean was used as an indicator of impairment. For cognitive fatigue, a score below 55, corresponding to the 10th percentile for healthy children and adolescents, was used as an indicator of fatigue (Irestorm et al., Reference Irestorm, Tonning Olsson, Johansson and Ora2020). All survivors with impaired processing speed also indicated substantial problems with cognitive fatigue, with no survivor in this group scoring above 55. The survivors experiencing the least cognitive fatigue had the best processing speed (r2 = 0.45). While some survivors expressed problems with cognitive fatigue with no impairment in processing speed, the opposite was not observed in this study.
Scatterplot of processing speed in standard scores (M = 100, SD = 15) against Pediatric Quality of Life (PedsQL) cognitive fatigue quality of life scores (n = 45). Higher scores indicate better performance and less fatigue. The dotted lines indicate impaired performance with impairment defined as cognitive scores more than 1.5 SD below the normative mean and cognitive fatigue scores below 55, corresponding to the 10th percentile of healthy controls.

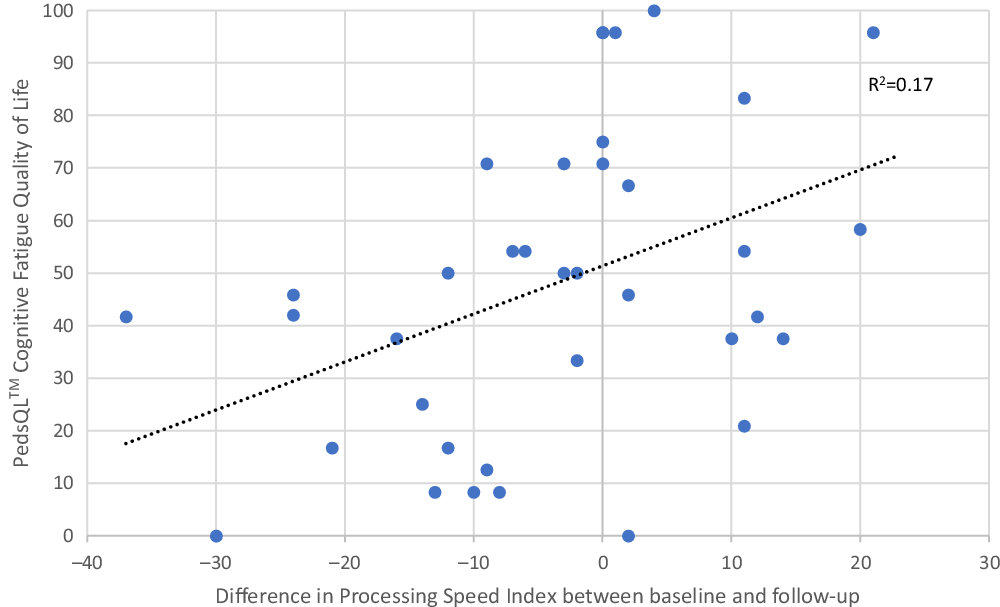
PSI scores (standard scores, M = 100, SD = 15) from the baseline testing were included in the explorative analysis (Figure 2). Mean PSI was 95.78 (SD = 11.61) at baseline and 91.93 (SD = 16.19) at follow-up. One-sample t tests were used to compare these results to the national norms, and were significant for both the baseline testing, p = .034, 95% CI [−0.35; −8.09], and the follow-up, p = .002, 95% CI [−3.20; −12.93] The change in PSI between baseline and follow-up was plotted against the score in cognitive fatigue and shows that survivors with the largest decrease in processing speed also experienced more cognitive fatigue (r² = 0.17). Mean difference between the test at baseline and follow-up was –3.03 (SD = 14.32), and the median difference was –2.00.
Comparisons between cognitive fatigue (higher scores indicate less problems) and change in Processing Speed Index (PSI) (M = 100, SD = 15) from baseline to follow-up (sub-cohort, n = 37).
DISCUSSION
We here present, to our knowledge, the first study investigating the association between fatigue and cognition in children and adolescents treated for paediatric brain tumours. Several studies have investigated the relationship between cognition and fatigue in adults, but the area is understudied in children and adolescents. We found an association between cognitive processing speed and cognitive fatigue, but no associations with the other two measures of fatigue nor between fatigue and other measures of cognition. In the explorative analysis, we found a distinct clinical profile, where all survivors with impaired processing speed also experience cognitive fatigue. Moreover, survivors with the largest decrease in processing speed between baseline and follow-up also expressed the highest levels of cognitive fatigue.
Cognitive processing speed was associated with cognitive fatigue, which is commonly reported in adults following traumatic brain injuries (Ashman et al., Reference Ashman, Cantor, Gordon, Spielman, Egan, Ginsberg and Flanagan2008; Johansson et al., Reference Johansson, Berglund and Ronnback2009, Reference Johansson, Wentzel, Andrell, Mannheimer and Ronnback2015, , Reference Jonasson, Levin, Renfors, Strandberg and Johansson2018). While studies on adult survivors of childhood cancers reported associations between cognitive fatigue and impairments in attention, memory, and executive functions (Cheung et al., Reference Cheung, Brinkman, Mulrooney, Mzayek, Liu, Banerjee and Krull2017; Clanton et al., Reference Clanton, Klosky, Li, Jain, Srivastava, Mulrooney and Krull2011; Puhr et al., Reference Puhr, Ruud, Anderson, Due-Tonnesen, Skarbo, Finset and Andersson2019), we observed no such associations in children and adolescents. The lack of associations between executive functions and fatigue could be caused by a non-representative sample in this aspect, while the associations found between processing speed and fatigue are more likely to be generalisable. We did not find the relationship between general fatigue and cognition that we hypothesised based on research on adult survivors of childhood leukaemia. Small study samples in combination with different aetiologies and the use of different measurements inflates the risk of type II errors. Hence, this hypothesis needs to be further investigated in future studies.
The association between cognitive fatigue and cognitive processing speed presented in the current study was previously demonstrated in adults after stroke or traumatic brain injury (Johansson et al., Reference Johansson, Berglund and Ronnback2009, Reference Johansson, Wentzel, Andrell, Mannheimer and Ronnback2015, Reference Jonasson, Levin, Renfors, Strandberg and Johansson2018). A study on acquired brain injuries in children and adolescents showed that participants reported more cognitive fatigue after non-traumatic brain injuries (including brain tumours) compared to traumatic brain injuries (van Markus-Doornbosch et al., Reference van Markus-Doornbosch, de Kloet, Berger, Lambregts, Wolterbeek and Vliet Vlieland2016). This could be caused by the additional impact of chemotherapy, radiotherapy, and/or brain surgery. A recent study on cognitive fatigue in adult survivors of paediatric brain tumours showed that surgery in combination with chemotherapy and radiotherapy increased the risk for severe fatigue (Puhr et al., Reference Puhr, Ruud, Anderson, Due-Tonnesen, Skarbo, Finset and Andersson2019), while another study on fatigue in childhood cancer survivors reported that radiotherapy – but not chemotherapy – increased the risk for fatigue (Mulrooney et al., Reference Mulrooney, Ness, Neglia, Whitton, Green, Zeltzer and Mertens2008). While the effect of different treatments on fatigue in survivors of childhood cancer remains to be elucidated, previous research has shown that survivors of paediatric brain tumours suffer more fatigue than survivors of acute lymphoblastic leukaemia (Irestorm et al., Reference Irestorm, Tonning Olsson, Johansson and Ora2020; Meeske et al., Reference Meeske, Katz, Palmer, Burwinkle and Varni2004; Mulrooney et al., Reference Mulrooney, Ness, Neglia, Whitton, Green, Zeltzer and Mertens2008). One possible explanation for this is the impact of brain surgery in combination with higher radiation dosages. Thus, it is evident that survivors of paediatric brain tumours are at risk for experiencing fatigue and they should therefore be clinically monitored. While cranial radiotherapy has been shown to have a negative impact on cognitive processing speed (Kahalley et al., Reference Kahalley, Conklin, Tyc, Hudson, Wilson, Wu and Hinds2013; Palmer et al., Reference Palmer, Armstrong, Onar-Thomas, Wu, Wallace, Bonner and Gajjar2013; Scantlebury et al., Reference Scantlebury, Bouffet, Laughlin, Strother, McConnell, Hukin and Mabbott2016; Tonning Olsson et al., Reference Tonning Olsson, Perrin, Lundgren, Hjorth and Johanson2014), in a large study from the Childhood Cancer Survivor Study, Clanton et al. (Reference Clanton, Klosky, Li, Jain, Srivastava, Mulrooney and Krull2011) reported that the impact of fatigue on neurocognitive outcomes in adult survivors of childhood cancer was independent of the effects of both cranial radiotherapy and chemotherapy. Hence, cognition in long-term survivors of childhood cancers seems to be vulnerable to the effects of fatigue, which makes fatigue an important target for both further research and clinical management. In adults, fatigue has been associated with disabilities in personal life, altered ability to gain and maintain employment, and socio-economic effects (Engberg, Segerstedt, Waller, Wennberg, & Eliasson, Reference Engberg, Segerstedt, Waller, Wennberg and Eliasson2017; Huang et al., Reference Huang, Daniels, Lembo, Hartog, O’Brien, Heymann and Sepsis Survivors Engagement2019; Johansson & Ronnback, Reference Johansson, Ronnback and Sadaka2014).
Cognitive fatigue was the only fatigue subscale to be associated with cognition and was furthermore the subscale where the survivors scored the lowest results. The average result for the study sample was approximately 2 SD below that of healthy children and adolescents (Gordijn et al., Reference Gordijn, Cremers, Kaspers and Gemke2011; Irestorm et al., Reference Irestorm, Tonning Olsson, Johansson and Ora2020). While the scales are not standardised, this is still an apparent difference compared to the other two subscales, where the mean scores were approximately 1 SD below the mean of healthy children and adolescents. If fatigue had been measured with a unidimensional instrument, this difference would most likely have been masked and the high prevalence of cognitive fatigue might not have been detected. Multidimensional instruments are recommended in order to facilitate discrimination between depression and fatigue (Berger, Mitchell, et al., Reference Berger, Mitchell, Jacobsen and Pirl2015; Berger, Mooney, et al., Reference Berger, Mooney, Alvarez-Perez, Breitbart, Carpenter and Cella2015), and for evaluating the impact of interventions (Cramp & Byron-Daniel, Reference Cramp and Byron-Daniel2012). Additionally, multidimensional scales are reported to have better accuracy (Brand, Chordas, Liptak, Manley, & Recklitis, Reference Brand, Chordas, Liptak, Manley and Recklitis2016). Our results further support that fatigue is a multidimensional concept, which should be measured accordingly.
In the explorative analysis, all survivors with impaired processing speed also experienced cognitive fatigue. At the same time, those experiencing the least cognitive fatigue had the fastest processing speed. The results indicate that there are three clinically disparate groups of survivors that experience different constellations of symptoms. While impaired processing speed and cognitive fatigue seem to co-exist in many survivors, the relationship between the two is unclear. There could be a causal relationship, but the impairments can also be co-existing, or there is an overlap either in symptoms or in assessment tools. While the fact that all survivors with impaired processing speed also experienced cognitive fatigue supports overlapping, the existence of survivors experiencing cognitive fatigue without impaired processing speed, as revealed by the explorative analysis, supports the opposite. Future research efforts should be directed towards elucidation of possible explanations for the latter group’s subjective deficits.
As demonstrated in the explorative analysis, not all PSI scores declined although survivors with the largest decrease in processing speed experienced more cognitive fatigue. The participants in the current study scored below the normative mean at baseline and the mean score had further decreased at follow-up. This is in line with previous research showing that processing speed can be reduced already at baseline (Irestorm, Perrin, & Tonning Olsson, Reference Irestorm, Perrin and Tonning Olsson2018). Hence, a reduction in processing speed is associated with cognitive fatigue. Even though the mean results were statistically lower than normative means both at baseline and follow-up, the magnitude of this difference is within 1 SD and it is therefore not indicative of impairment in the group as total. However, these results are in line with previous research demonstrating that cognitive deficits after paediatric brain tumours are typically progressive (De Ruiter, Van Mourik, Schouten-van Meeteren, Grootenhuis, & Oosterlaan, Reference De Ruiter, Van Mourik, Schouten-Van Meeteren, Grootenhuis and Oosterlaan2013; Merchant et al., Reference Merchant, Conklin, Wu, Lustig, Xiong, Merchant and Xiong2009; Mulhern, Merchant, Gajjar, Reddick, & Kun, Reference Mulhern, Merchant, Gajjar, Reddick and Kun2004). In summary, the overlap between impaired processing speed scores and cognitive fatigue implies that reduced processing speed could either be considered a symptom of cognitive fatigue or viewed as a possible explanation thereof.
As fatigue can be one of the most distressing and disabling symptoms in childhood cancer survivors (Kanellopoulos et al., Reference Kanellopoulos, Hamre, Dahl, Fossa and Ruud2013; Meeske et al., Reference Meeske, Patel, Palmer, Nelson and Parow2007; Spathis et al., Reference Spathis, Booth, Grove, Hatcher, Kuhn and Barclay2015), the current results have clinical implications for neuropsychologists working within a paediatric setting. While there was an association between cognitive fatigue and impairments in processing speed, the explorative analysis also revealed the presence of survivors that experience cognitive fatigue without exhibiting impaired cognition. The results indicate discrepancies between self-report measures and neuropsychological test scores of this patient cohort. Neuropsychological testing alone might not fully reveal the extent of cognitive fatigue, and the survivors’ subjective view of the symptoms should also be considered. Self-rating measurements of fatigue would improve assessments and should therefore be included in follow-up protocols. Aetiology and type of cancer treatment should also be considered when conducting the assessments, as treatment might affect both the type and severity of fatigue.
The diagnosis distribution of brain tumours in the study cohort was in accordance with national data (Lannering et al., Reference Lannering, Sandstrom, Holm, Lundgren, Pfeifer, Samuelsson and Swedish Childhood2009), while the number of participants treated with radiotherapy was lower compared to studies with non-population-based samples (Brinkman et al., Reference Brinkman, Krasin, Liu, Armstrong, Ojha, Sadighi and Krull2016). Since radiotherapy is a known risk factor for decreased processing speed (Kahalley et al., Reference Kahalley, Conklin, Tyc, Hudson, Wilson, Wu and Hinds2013; Palmer et al., Reference Palmer, Armstrong, Onar-Thomas, Wu, Wallace, Bonner and Gajjar2013; Scantlebury et al., Reference Scantlebury, Bouffet, Laughlin, Strother, McConnell, Hukin and Mabbott2016), this must be taken into account when interpreting the results. Both PSI and working memory at follow-up was in line with previous research (Brinkman et al., Reference Brinkman, Krasin, Liu, Armstrong, Ojha, Sadighi and Krull2016; Scantlebury et al., Reference Scantlebury, Bouffet, Laughlin, Strother, McConnell, Hukin and Mabbott2016), while the sample had a poorer performance for mean hit reaction time than previously reported (De Ruiter et al., Reference De Ruiter, Van Mourik, Schouten-Van Meeteren, Grootenhuis and Oosterlaan2013), and better scores for executive measures than described in other studies (Brinkman et al., Reference Brinkman, Krasin, Liu, Armstrong, Ojha, Sadighi and Krull2016; Scantlebury et al., Reference Scantlebury, Bouffet, Laughlin, Strother, McConnell, Hukin and Mabbott2016). Regarding fatigue, both cognitive fatigue and general fatigue were prevalent in a large number of survivors. This is in line with previous reports demonstrating that survivors experience cancer-related fatigue as one of the most prevalent and distressing symptoms after treatment for childhood cancer (Kanellopoulos et al., Reference Kanellopoulos, Hamre, Dahl, Fossa and Ruud2013; Meeske et al., Reference Meeske, Patel, Palmer, Nelson and Parow2007; Spathis et al., Reference Spathis, Booth, Grove, Hatcher, Kuhn and Barclay2015). All in all, this supports that the results are generalisable to other population-based samples of survivors of paediatric brain tumours.
The relatively small study cohort of survivors also leads to low statistical power which may limit the identification of the associations between cognitive fatigue and the cognitive domains reported for adults. Since the association between cognitive fatigue and cognitive processing speed has not been previously described in children and adolescents, the results require verification in another cohort. As the results are based on a cross-sectional observation longitudinal studies are required and in order to reach causal conclusions on fatigue and to examine the impact of different treatment modalities as well as to investigate potential changes in fatigue over time.
In conclusion, there is an association between cognitive fatigue and cognitive processing speed, and survivors who are most impaired in processing speed also express the most severe cognitive fatigue. The study supports that fatigue is a multidimensional concept, and that appropriate measurements of fatigue should be included in follow-up protocols for survivors of paediatric brain tumours.
ACKNOWLEDGEMENTS
This work was supported by the Swedish Childhood Cancer Fund (E.I., KF2017–0012, I.Ø., KF2018–0011), the Jonas Foundation (E.I., 2017), and Skåne University Hospital Psychology Research and Development Grant (E.I., 2020).
ETHICS STATEMENT
Participation in the screening was voluntary and the study was conducted in accordance with the Helsinki declaration. All data were anonymised and approval for the study was received fromthe Lund regional ethics committee (Nr 500/2007).
CONFLICTS OF INTERESTS
H.L. has co-founded and is part-time employed by a start-up company (Concidera Health) that develops decision support tools for childhood cancer survivorship. The company has no specific interest in the tests used in this study. The remaining authors report no conflicts of interest.


 Open access