

Weight faltering, a relatively common growth pattern in infancy, is a term used to describe slow weight gain in children( Reference Skuse 1 , Reference Wright, Waterston and Matthews 2 ). Previous research has shown that familial factors, such as parental height and parity( Reference Blair, Drewett and Emmett 3 ), and postnatal factors, such as infant sucking and health( Reference Emond, Blair and Drewett 4 ), as well as problematic mother–child relationships( Reference Olsen, Skovgaard and Weile 5 ), are strongly associated with early weight faltering. Poor infant weight gain, at least in the UK, is, however, not associated with traditional markers of socio-economic deprivation( Reference Blair, Drewett and Emmett 3 , Reference Emond, Blair and Drewett 4 ). Early weight faltering is associated with outcomes such as developmental delay( Reference Black, Hutcheson and Dubowitz 6 – Reference Wilensky, Ginsberg and Altman 8 ), intelligence quotient deficits( Reference Rudolf and Logan 9 , Reference Emond, Blair and Emmett 10 ) and insecure attachment( Reference Ward, Lee and Lipper 11 ). Therefore, identification of factors that could aid in the prevention of weight faltering in infancy is of crucial importance.
It is well known that dietary intake and nutrition throughout childhood are key determinants of growth and development and have a strong relationship with body size and composition. A Canadian cohort study( Reference Kramer, Guo and Platt 12 ), for example, has reported accelerating effects of formula and other milks (v. breast milk) on weight and length gain throughout infancy and displacement of milk feeding by cereals early on to adversely affect growth (also see Durmuş et al. ( Reference Durmuş, van Rossem and Duijts 13 , Reference van Rossem, Kiefte-de Jong and Looman 14 ) and van Rossem et al. ( Reference van Rossem, Kiefte-de Jong and Looman 14 )). Many recent studies have focused on diet- and feeding-related risk factors for rapid weight gain in infancy and subsequent childhood obesity, in particular, the potential protective effect of breast-feeding( Reference Armstrong and Reilly 15 , Reference Schack-Nielsen, Sorensen and Mortensen 16 ), whereas far fewer studies have focused on detailed diet intake and feeding practices associated with slow weight gain( Reference Emond, Blair and Drewett 4 , Reference Wright, Parkinson and Drewett 17 ). The identification of feeding-related predictors that might increase the risk of slow weight gain in infancy may inform health professionals about potential preventive strategies to help mothers adopt appropriate infant feeding practices.
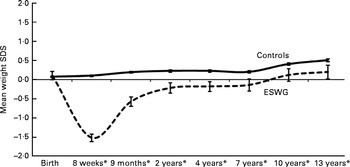
In the present study, we used data from the Avon Longitudinal Study of Parents and Children (ALSPAC)( Reference Golding, Pembrey and Jones 18 , 19 ), one of the few ongoing studies carried out in the developed world with detailed measurements of weight and dietary intake from infancy to childhood and into adolescence and adequate measures of confounding variables. Infants with early weight faltering have already been identified in the ALSPAC( Reference Blair, Drewett and Emmett 3 , Reference Emond, Blair and Drewett 4 , Reference Din, Emmett and Steer 20 ). ALSPAC infants who gained weight slowly between birth and 8 weeks (period of weight faltering) exhibited an increased weight velocity compared with controls between 8 weeks and 2 years (recovery phase), resulting in their weight returning to the reference mean (British 1990 growth reference( Reference Boyd, Golding and Macleod 21 )) for that age( Reference Din, Emmett and Steer 20 ). After 2 years, this group gained weight at a rate similar to that of the control group, but remained slightly lighter and shorter than the control group at the age of 13 years (Fig. 1). Only 5·7 % of the infants exhibiting early weight faltering continued to gain weight slowly after 8 weeks of age, whereas the rest recovered. In the present study, we investigated whether diet and/or feeding behaviours differ between the two groups gaining weight at different rates in the first 2 months and between 2 months and 2 years. As a child's ability or eagerness to feed may be affected by the environment in which he or she lives (e.g. parenting ability and physical environment) and/or his or her personal/temperamental traits, we also investigated whether these variables differ between the two weight gain groups.
Cross-sectional mean weight standard deviation scores (SDS) for early slow-weight gain (ESWG) and normal-weight gain (control) children from birth to 13 years in comparison with the UK 1990 reference (SDS = 0). * Means of groups are different from each other (P< 0·01) at these ages (n 11 499–5115; 100–44 %). This graph was adapted from a version first published in Din et al. ( Reference Din, Emmett and Steer 20 ).
Subjects and methods
Subjects
The ALSPAC is a longitudinal prospective cohort study that recruited pregnant mothers in the former Avon Health Authority area with an expected date of delivery between 1 April 1991 and 31 December 1992, resulting in a cohort of 14 062 live births. Details of the recruitment and representativeness of the ALSPAC cohort have been described elsewhere( 19 , Reference Boyd, Golding and Macleod 21 ). ALSPAC website( 19 ) contains details of all available data through a fully searchable data dictionary (http://www.bristol.ac.uk/alspac/researchers/data-access/data-dictionary/). Ethical approval was obtained from the ALSPAC Law and Ethics Committee and the Local Research Ethics Committees.
Details regarding the identification of infants with early weight faltering in the ALSPAC cohort have also been described elsewhere( Reference Blair, Drewett and Emmett 3 , Reference Emond, Blair and Drewett 4 , Reference Emond, Blair and Emmett 10 ). Briefly, weights recorded at birth and 8 weeks (range 1–3 months) by health professionals as part of the routine child health surveillance were extracted from the Avon Child Health Computer System and standardised to z- scores (standard deviation score) adjusting for differences in sex and age (gestational age in weeks for weight at birth and infant age in weeks for weight at 8 weeks) using the British 1990 growth reference( Reference Freeman, Cole and Chinn 22 ). Weight gain was assessed by calculating the difference in z- scores between birth and 8 weeks, adjusting for regression towards the mean using correlates from within the cohort and Cole's equation( Reference Cole 23 ). Such conditional weight gain provides a more accurate measure of infant growth, as it accounts for the smaller infants who tend to grow faster and the larger infants who tend to grow slower( Reference Heffer and Kelly 24 ). It is also considered to be a more sensitive criterion for identifying children with weight faltering( Reference Edwards, Halse and Parkin 25 ). Infants with early weight faltering were defined as those below the 5th centile for weight gain (standard deviation score < − 1·645) between the two time points, and hereafter they are referred to as the early slow-weight gain (ESWG) group.
Data
The various time points at which variables used in the present study were obtained are summarised in Table 1.
Overview of Avon Longitudinal Study of Parents and Children (ALSPAC) data collection for variables used in the present study
Subsample CIF, subsamples from Children in Focus.
Diet and feeding behaviours
Parent-reported questionnaires
After birth, parents were asked to fill in detailed questionnaires regarding their child's health and behaviour including a section on the child's eating habits (designed by an experienced dietitian; see Emmett( Reference Emmett 26 ) for details). Parents were asked about feeding methods (breast-fed or bottle-fed), age at the introduction of milk/solids, consumption frequency, and feeding behaviours. In the present study, we used questionnaires at ages 4 weeks, 6 months and 15 months. The questionnaire used at 4 weeks mainly included information on feeding methods and feeding behaviours, including difficulties. The questionnaire used at 6 months included questions about feeding behaviours referring to two time periods: those occurring between 0 and 3 months and those occurring between 4 and 6 months. The 0–3-month data fall within the weight-faltering period, and they were, therefore, used to compare findings from the 4-week questionnaire. Questions asked at 15 months regarding feeding behaviours reflected problems occurring between 6 and 15 months. We also included a question about a mother's worry about her child's weight development extracted from a questionnaire at 18 months.
Diet diaries
Detailed dietary intake was assessed using diet diaries for a 10 % subsample of the children (known as Children in Focus) at 4, 8 and 18 months. The carer completed the diaries by recording everything the child ate and drank in household measures for three 24 h periods (only one at 4 months). These data were used to calculate mean daily energy and nutrient intakes and amounts of various groups of foods consumed (details provided in Noble & Emmett( Reference Noble and Emmett 27 , Reference Noble and Emmett 28 ) and Cowin & Emmett( Reference Cowin and Emmett 29 )). To assess differences in dietary intake, we compared average intakes of protein, fat, carbohydrates, intrinsic/milk sugars and non-milk extrinsic sugars (intrinsic and extrinsic sugars at only 8 and 18 months) of the weight gain groups. The intake of non-milk extrinsic (added) sugars was calculated from that of total sugars by deducting that of all the sugars from fresh fruit, vegetables and milk and of part of those from tinned fruit, baked beans, tinned pasta, tomato-based sauces, yogurt and fromage frais. Intrinsic/milk sugars were the remainder of total sugars. Energy intakes of ninety different foods and beverages obtained from the dietary records were averaged, and these food sources were categorised into four main groups: solids (sum of all solid food groups; all ages); formula milk (at 4 and 8 months); other milks (cow, soya and goat; at 8 and 18 months); other non-milk drinks (fruit juices, water, soft drinks and ready-made baby drinks; at 18 months). The number of babies fed only breast milk in the ESWG group was too low to analyse them separately at any of the ages (n 7 at 4 months). We compared mean intakes of energy from these different sources in the two weight gain groups for consumers only.
Home environment and temperamental traits
To measure the mother's and partner's parenting style, questions such as the frequency with which they played with their child and participated in a variety of activities such as singing, showing books and playing with toys were asked in the parent-reported questionnaire at 6 months. Questions regarding home environment, for example, language stimulation, physical environment and punishment, were adapted from the validated HOME inventory (Home Observation for Measurement of the Environment( Reference Bradley and Caldwell 30 )). We used a combined ‘parents and home’ score (mother's parenting score, partner's parenting score and home score summed). The child's temperament was measured using the Carey Infant Temperament Scale( Reference Carey and McDevitt 31 ), which generates several subscales, each measuring a temperamental trait. We summed scores on mood, intensity, activity, rhythmicity, approach, adaptability, persistence, distractibility and threshold subscales to generate a continuous measure of ‘temperament’( Reference Thomas, Chess and Birch 32 ), where higher scores reflect more difficult temperament.
Statistical analyses
To investigate whether feeding behaviours, duration of breast-feeding (0–3 weeks and >3 weeks) and proportion of infants given supplementary water (all extracted from the 4-week questionnaire; Table 2) differed between the two weight gain groups, we used a categorical principal component analysis using CATPCA in SPSS for Windows version 18 (SPSS, Inc.). Principal component analysis as a statistical method is used to reduce the original set of variables to a smaller set of uncorrelated components that represent most of the variance found in the original data( Reference Kline 33 ). In categorical principal component analysis, an optimal scaling approach is used to allow variables to be scaled at different levels; categorical variables are optimally quantified in the specified dimensionality (nominal or ordinal) and, as a result, non-linear relationships between variables are modelled. The number of components to be retained was chosen based on a scree plot and the eigenvalues (all retained components have eigenvalues >1). Variables with loadings above ± 0·4 were considered to have a strong association with that component (variables with loadings below 0·2 were excluded). For each child, individual component scores were created, which were then used in subsequent analyses (all further analyses were conducted using STATA version 12; StataCorp). All component scores were approximately normally distributed and had a mean of 0 and a standard deviation of 1. The extracted principal component scores were then used in binomial logistic regressions with the dependent variable indicating whether the infant was in the slowest-growing 5 % of the cohort (ESWG) or not (controls). OR, 95 % CI and P values (two-sided) are reported. The Hosmer and Lemeshow test was conducted for determining goodness of fit, using a 5 % significance level. Depending on data distribution, other univariate analyses on questionnaire data were conducted using the χ2 test, unpaired t tests or Mann–Whitney U tests (z-statistic). Analyses were carried out at a significance level of 0·01.
Variables for feeding behaviour and feeding methods at 4 weeks (from parent-reported questionnaires) that were included in the categorical principal component analysis and the resulting components on which they were loaded (% variance explained)
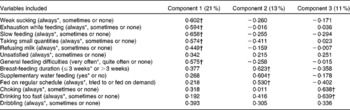
* Indicates reference category within each variable.
† Variables with loadings above 0·4 for the component with which they exhibited the strongest association.
As familial, socio-economic and other parental factors (also obtained by parent-reported questionnaires) could affect the choices of foods and drinks that are given to a child( Reference Smithers, Brazionis and Golley 34 ) and have been shown to be associated with slow weight gain in ALSPAC infants( Reference Blair, Drewett and Emmett 3 , Reference Emond, Blair and Drewett 4 ), we included the following confounders in our analyses on questionnaire data: parity (single or multiple); maternal height (1st quintile, middle quintiles or 5th quintile); maternal age ( < 24, 24–32 or >32 years); maternal education level (none, vocational, academic qualification at 16 years, academic qualification at 18 years or degree); ethnicity (White, Asian or other); car use (yes or no). As boys and girls grow at different rates and sex differences in dietary intake and food preferences have been widely reported in the literature( Reference Wardle, Haase and Steptoe 35 ), sex was controlled for in all analyses. Where appropriate, we also included infant health up to 8 weeks (healthy, minor problems or generally unwell) as a potential confounder. Although we suffered a loss of about 20 % of the data when controlling for confounders, there were no differences in the proportion of missing data between the ESWG and control groups.
For the subsample with diet diaries, all diet variables were standardised to a mean of 0 and a standard deviation of 1 before analysis. Mean macronutrient intakes were adjusted for the current body weight of the children and analysed for differences between weight gain groups with multivariate multiple linear regressions controlling for total energy intake and sex (the sample size for the ESWG group was too low to include other confounders). Depending on data distribution, differences in mean energy intake from solids, formula, other milks and other drinks (also adjusted for current body weight) in consumers only were analysed using unpaired t tests or Mann–Whitney U tests.
Results
Ascertainment
Of the 14 062 live births, ninety-two (0·7 %) were lost to follow-up mainly because of family relocation. We also excluded 1292 infants who had missing weight data in the first year of infancy, eighty-nine children with major congenital disorders (e.g. cerebral palsy, Down's syndrome, cleft palate and congenital heart disease), 871 pre/post-term infants, 184 twins and thirty-five infants with standard deviation score above +4 and below − 4 for birth weight or weight at 8 weeks (assumed as data entry mistakes), leaving 11 499 infants for analysis. Of these, 507 were classed as exhibiting slow weight gain in the first 8 weeks of life and the remaining 10 992 infants were used as controls (all above the 5th centile). There was no difference in birth weight (ESWG: mean 3481 (se 22·8) g; control: mean 3470 (se 4·5) g; t(11 387) = − 0·53, P= 0·60) or length at birth (crown–heel length) (ESWG: mean 50·6 (se 0·16) cm; control: mean 50·5 (se 0·03) cm; t(5681) = − 0·59, P= 0·56) between the ESWG and controls groups.
Diet diaries were collected from 853, 1131 and 1026 children at 4, 8 and 18 months, respectively (83, 86 and 83 %, respectively, of those seen at that clinic). Of these, 812 normal-growing children (421 boys and 391 girls) and forty-one slow-growing children (twenty-six boys and fifteen girls) at 4 months, 1023 normal-growing children (552 boys and 471 girls) and forty-eight slow-growing children (twenty-eight boys and twenty girls) at 8 months, and 868 normal-growing children (468 boys and 400 girls) and forty slow-growing children (twenty-two boys and eighteen girls) at 18 months were included in the study. A total of twenty-six of the slow-growing children and 566 of the normal-growing children had diet diaries completed at all three ages.
Period of weight faltering
Principal component analysis of data obtained from the questionnaire used at 4 weeks yielded three components explaining 45 % of the variance in the original data (Table 2). Most variables related to feeding problems were most strongly loaded on principal component 1; breast-feeding duration, supplementary water feeding and being fed on a regular schedule were most strongly loaded on component 2, whereas choking and drinking too fast were most strongly loaded on component 3 (Table 2). Scores for all components differed between ESWG infants and controls (Table 3). At 4 weeks, ESWG infants were more likely than controls to exhibit feeding behaviours positively loaded on component 1 (weak sucking, exhaustion while feeding, slow feeding, taking small quantities, refusing milk and general feeding difficulties), but less likely to exhibit those positively loaded on component 2 (shorter breast-feeding duration, water supplement and being fed on a regular schedule) and component 3 (choking and drinking too fast; Table 3). All effects remained after controlling for confounders and after stratifying by current feeding method (breast-fed or bottle-fed at 4 weeks; Table 3). The results of univariate analysis of data obtained for the 0–3-month questions asked in the 6-month questionnaire (within the weight-faltering period) confirmed our findings from the 4-week questionnaire; ESWG infants were more likely than controls to feed slowly, take small quantities and refuse milk (Table 4).
Adjusted associations between 4-week principal component scores (Table 2) and the probability of being in the early slow-weight gain (ESWG) group* (Odds ratios and 95 % confidence intervals)

* The first analysis included infants who were breast-fed, bottle-fed or both (all feeding methods – not stratified). The second analysis was stratified by feeding method (breast-fed or bottle-fed at 4 weeks). Mixed feeders were included only in the group comprising all feeding methods as sample size was too low for ESWG infants.
† Model 1: adjusted for sex and infant health.
‡ Model 2: model 1+adjustment for maternal height and maternal age.
§ Model 3: model 1+model 2+adjustment for maternal education, car use, ethnicity and parity.
∥ After full adjustment.
Associations between measures of feeding behaviour in the 0–3 months after birth and the probability of being in the early slow-weight gain (ESWG) group* (Odds ratios and 95 % confidence intervals)
* In the 6-month questionnaire, parents were asked about problems occurring during 0–3 months (weight-faltering period).
† Model 1: adjusted for sex and infant health.
‡ Model 2: model 1+adjustment for maternal height and maternal age.
§ Model 3: model 1+model 2+adjustment for maternal education, car use, ethnicity and parity.
∥ After full adjustment.
Recovery phase
How infants feed
The association between slow feeding, taking small quantities and refusing milk between 0 and 3 months and being in the ESWG group was not apparent at 4–6 months of age (Table 5). Also, a derived feeding difficulty score combining five measures of feeding problems between 6 and 15 months (not eating enough, choosy, overeating, refusing food and lack of routine) did not differ between the groups (ESWG: median 2 (interquartile range (IQR) 3), n 398; control: median 2 (IQR 3), n 9077; z= − 1·18, P= 0·24). Even so, the proportion of mothers who were worried about their child's weight development for the ESWG group was twice as high as that for the control group at 18 months (ESWG: 37/407 = 9 %; control: 402/9163 = 4 %; χ2 19·7, P< 0·001).
Associations between measures of feeding behaviour in the 4–6 months after birth and the probability of being in the early slow-weight gain (ESWG) group* (Odds ratios and 95 % confidence intervals)
* In the 6-month questionnaire, parents were asked about problems occurring during 4–6 months (recovery phase).
† Model 1: adjusted for sex and infant health.
‡ Model 2: model 1+adjustment for maternal height and maternal age.
§ Model 3: model 1+model 2+adjustment for maternal education, car use, ethnicity and parity.
∥ After full adjustment.
What infants eat
In the 4th week after birth, mothers of the ESWG group were more likely than those of the control group to stop breast-feeding at the beginning of the recovery phase (ESWG: 49/162 = 30 %; control: 615/2697 = 23 %; χ2 21·6, P= 0·001). Although 96 % of all children in the ALSPAC had started consuming solids by 4 months of age, slow-weight gain children started slightly later than controls. For every 1-month increase in the age at which solid foods started being consumed, infants were 1·21 (95 % CI 1·08, 1·35) times more likely to be in the ESWG group (P< 0·001). This association remained after adjusting for all potential confounders (n ESWG= 378; n Control= 8379; 1·25 (1·11, 1·41)). We found no difference between the groups in the number of breast-feeds (ESWG: median 4 (IQR 2), n 112; control: median 4 (IQR 2), n 2659; z= 0·52, P= 0·60) or solid meals (ESWG: median 3 (IQR 0), n 422; control: median 3 (IQR 0), n 9424; z= − 0·57, P= 0·57) a child had per day at 6 months.
In the subsample with diet diaries (for details, supplementary Table S1, available online), the average energy intake at 4 months was 2858 (95 % CI 2653, 3063) kJ/d (683 (95 % CI 634, 732) kcal/d) and 2674 (95 % CI 2632, 2711) kJ/d (639 (95 % CI 629, 648) kcal/d) for the ESWG (n 40) and control (n 812) groups, respectively. The respective values were 3594 (95 % CI 3381, 3807) kJ/d (859 (95 % CI 808, 910) kcal/d) and 3389 (95 % CI 3343, 3435) kJ/d (810 (95 % CI 799, 821) kcal/d) at 8 months (n ESWG= 41; n Control= 1023) and 4510 (95 % CI 4263, 4761) kJ/d (1078 (95 % CI 1019, 1138) kcal/d) and 4586 (95 % CI 4527, 4648) kJ/d (1096 (95 % CI 1082, 1111) kcal/d) at 18 months (n ESWG= 40; n Control= 868). Adjusted for body weight, the ESWG group had, on average, higher overall daily energy intake of 67 kJ/kg (16 kcal/kg) body weight at 4 months (P< 0·001) and 54 kJ/kg (13 kcal/kg) body weight/d (P= 0·006) higher energy intake from formula milk compared with the control group (consumers only: n ESWG= 34; n Control= 556). This difference persisted at 8 months for both overall energy intake (54 kJ/kg (13 kcal/kg) body weight/d; P< 0·001) and formula milk (29 kJ/kg (7 kcal/kg) body weight/d; only consumers: n ESWG= 40; n Control= 755; P= 0·006). At 8 months, the ESWG group also had a 29 kJ/kg (7 kcal/kg) body weight/d higher energy intake from solid foods compared with the control group (P= 0·01). As a result, the group had a higher intake of macronutrients (protein, fat, carbohydrates and intrinsic/milk sugar) at 4 and 8 months (P< 0·001 for all).
Home environment, parenting and temperament
The combined ‘parents and home’ score did not differ between the ESWG and control groups (ESWG: median 10 (IQR 3), n 426; control: median 10 (IQR 3), n 9518; z= 0·45, n ESWG= 426, n Control= 9518, P= 0·65). The ‘temperament’ score also did not differ between the two weight gain groups (ESWG: mean 179 (95 % CI 176, 182); control: mean 181 (95 % CI 180, 181); t(9293) = 1·18, P= 0·24).
Discussion
In the present prospective population-based study, it was found that slow-weight gain infants were more likely than controls to exhibit feeding problems during the weight-faltering period immediately after birth. Weak sucking, slow feeding, taking small quantities, exhaustion while feeding, refusing milk and having more general feeding difficulties were more likely to be found in infants with slow weight gain regardless of being breast-fed, bottle-fed or both. All feeding problems were substantially reduced by 6 months of age, when differences between the weight gain groups were no longer apparent. Slow-weight gain infants were introduced slightly later to solids compared with control infants. During the recovery phase, the detailed diet diaries collected from the subsample at 4 and 8 months revealed a difference in overall energy intake and intake from formula milk and solids with slow-weight gain infants exhibiting slightly higher intakes of 29–67 kJ/kg body weight per d.
Feeding problems in infants seem to be relatively common in the UK. The UK Infant Feeding Survey 2010( 36 ) revealed that about three in ten mothers had experienced some kind of feeding problem in the early weeks after delivery, with the most commonly reported problems being that their baby was not feeding sufficiently well, the baby being ill or not having enough breast milk. An earlier ALSPAC analysis( Reference Emond, Blair and Drewett 4 ) also found that weak sucking was the most important symptom for both breast-fed and bottle-fed slow-weight gain infants in the first 8 weeks of life (30 % in slow-growing infants compared with 15 % in controls). There are a number of reasons for feeding problems occurring. There is a known association between a mother's mental health (depression and anxiety) and feeding difficulties, where children of depressed mothers are more likely to exhibit problems with feeding( Reference Stein, Woolley and Cooper 37 – Reference Micali, Simonoff and Stahl 40 ). However, another ALSPAC analysis has shown no difference in the prevalence of maternal depression in the weight-faltering group compared with controls( Reference Drewett, Blair and Emmett 41 ). Relationship problems between mother and child could potentially also affect feeding and have been shown to be associated with the onset of weight faltering in the first 4 months of life in a Danish cohort( Reference Olsen, Skovgaard and Weile 5 ). However, in the present study, we found no difference in the score combining parenting ability and home environment between the slow-weight gain and control infants. Another possibility is that a child's temperament affects feeding( Reference Micali, Simonoff and Stahl 40 , Reference Lindberg, Bohlin and Hagekull 42 ). It has been shown previously that ALSPAC infants with difficult temperament have more feeding difficulties at both 1 and 6 months( Reference Micali, Simonoff and Stahl 40 ), but the present results indicated no difference in temperamental traits between the ESWG and control groups. Finally, feeding problems and associated slow weight gain in the early weeks could be a marker of neurological impairment or oromotor dysfunction( Reference Sullivan, Lambert and Rose 43 ). A slightly lower intelligence quotient at the age of 8 weeks in ESWG children compared with controls has been found previously in the ALSPAC( Reference Emond, Blair and Emmett 10 ). Therefore, data from the ALSPAC overall suggest that the feeding behaviours associated with ESWG in these infants are more likely to be a marker of biological vulnerability, especially in terms of neurological impairment, than to be driven by parental factors such as depression and parenting, home environment or infant's temperament.
While we do not have detailed dietary data during the weight-faltering period, we found some evidence that diet may be important in recovery from slow growth. Mothers of slow weight gainers were more likely to stop breast-feeding and change to formula milk at the start of recovery, and in the subsample with diet diaries, we found a difference in formula and solid food intakes between the weight gain groups relatively early in the recovery phase. The differences we found, i.e. 54 kJ/kg (13 kcal/kg) body weight/d at 4 months and 29 kJ/kg (7 kcal/kg) body weight/d at 8 months, equate to 331 and 243 kJ (79 and 58 kcal) higher intake per day for slow-weight gain infants (based on the average weight of a slow-weight gain infant at 4 and 8 months, respectively), representing 7–12 % of these infants' total energy intake per day at that age. These differences in energy intake are reflected in the higher intakes of protein, fat, carbohydrates and intrinsic and milk sugars we found in slow weight gainers at 4 and 8 months. Although we cannot say for sure, it is possible that the higher overall energy intake was enough to contribute to the increased growth rate (Fig. 1) observed in the ESWG group during the recovery phase.
Although we do not present and discuss results regarding specific effects of confounders herein, they do conform to previous research( Reference Blair, Drewett and Emmett 3 , Reference Emond, Blair and Drewett 4 , Reference Din, Emmett and Steer 20 ) showing that slow weight gain in the first few weeks of life is independently associated with maternal height (shorter mothers), maternal age (older mothers), use of a car (no use of a car in the household), infant health (less healthy) and sex (dietary intakes of food, energy and many nutrients higher in boys than in girls( Reference Emmett, Rogers and Symes 44 )), whereas other socio-economic markers such as maternal education and ethnicity have no independent effects on slow weight gain. Although the amount of missing data on certain confounders was quite large (between 6 and 20 %), there were no differences in the proportion of missing data between the ESWG and control groups.
We investigated the association between diet and feeding behaviours and ESWG in infancy using a large representative cohort and prospectively collected feeding data, thus avoiding the biases inherent in clinically referred samples of children with weight faltering. The findings from the questionnaire used when children were 4 weeks of age were confirmed by the separate questionnaire used 5 months later, thus increasing confidence in these data. There was inevitably loss to follow-up as the children grew up, although every effort was made by the ALSPAC team to minimise this. Furthermore, we had only limited information about dietary intake during the weight-faltering period and so cannot comment on differences in energy and nutrient intakes occurring in this period. Detailed measures of dietary intake started being collected only at 4 months of age when growth recovery had started and were available only for a subsample of ALSPAC children who had been invited to research clinics at this age. This means that the dietary assessment data were available only for a very small group of slow-weight gain infants, thus limiting the power of the analyses to detect differences. Although diet diaries are considered as one of the best methods for self-reported dietary assessment( Reference Bingham, Cassidy and Cole 45 ), we had to rely on untrained parental report of the foods/drinks being consumed by children. For infants aged 4 months, dietary intake was recorded for only 1 d. Although recording for further days may have been preferred, infants at this age exhibit little day-to-day variation in the types of food eaten( Reference Paul, Black and Evans 46 ). As a decision was made to not overburden parents, we emphasised that they keep a shorter but accurate food record. Other biases would have been introduced during staff interpretation of the written records, the estimation of portion sizes and amounts of breast milk consumed, and the use of standard food tables for nutrient intake analysis. Nevertheless, these biases were the same for both groups of infants compared in the present study. Currently, we do not have information about any intervention from health professionals that may have changed feeding practices in these slow-weight gain infants; however, these data may be available in the future through linkage to health service records. It is worth noting that the findings of the present study may not be relevant to slow weight gain occurring later in the first year as investigated by many others. Although a group of infants with weight faltering between 8 weeks and 9 months have been identified in the ALSPAC, this group is the subject of another paper.
In conclusion, it seems that feeding problems after birth are the most likely predictors of ESWG. Once these problems are resolved, these infants gain weight at a slightly faster rate than controls up to the age of 2 years, potentially fulfilling their genetic potential( Reference Emmett, Rogers and Symes 44 ). Being smaller, and therefore maybe relatively slower in their oromotor development, may explain why slow-weight gain infants were introduced to solids slightly later than controls. At the time the present study was carried out, mothers were advised to commence feeding solid foods to their children at about 3–4 months of age( 47 ) and very few infants in the study were introduced to solid foods after this. In light of current recommendations to exclusively breast-feed and to delay the introduction of solid foods to about 6 months of age( 48 ), health professionals in contact with infants in the first few months after birth should be aware of various feeding problems and focus on helping mothers establish adequate feeding practices. Although the proportion of worried mothers was relatively low, mothers of slow-weight gain infants were more worried about their child's weight gain compared with those of controls. To avoid such worry causing mothers to give up on breast-feeding or causing any other issues, mothers will need individualised advice and support if feeding problems persist and some reassurance can be given that children usually catch up in growth over time.
Supplementary material
To view supplementary material for this article, please visit http://dx.doi.org/10.1017/S0007114513004182
Acknowledgements
The authors are extremely grateful to all the families who took part in the present study, the midwives for their help in recruiting them and the whole ALSPAC team, including interviewers, computer and laboratory technicians, clerical workers, research scientists, volunteers, managers, receptionists and nurses.
The UK Medical Research Council (grant ref: 74882), the Wellcome Trust (grant ref: 076467) and the University of Bristol provided core support for the ALSPAC. The present study was supported by a grant from Wyeth Nutrition, UK. Wyeth Nutrition, UK, had no role in the study design and analysis or in the writing of this article.
The authors' contributions are as follows: L. I. H. prepared data for analyses, carried out the statistical analyses and wrote the manuscript; Z. D. prepared data for analyses; P. E. formulated the research questions and edited the manuscript; L. R. J. edited the manuscript; A. M. E. designed the ALSPAC weight faltering study and edited the manuscript.
P. E. has received research and consultancy funding from Pfizer Nutrition, Wyeth Nutrition, Danone and Plum Baby. Other authors declare no conflicts of interest.


