

A number of studies have established a positive association between short stature in adulthood and the prevalence of obesity(Reference Gunnell, Whitley and Upton1–Reference Hermanussen, Sunder and Voigt4), cardiovascular risk or disease(Reference Hebert, Rich-Edwards and Manson5–Reference Lawlor, Taylor and Davey Smith11), insulin resistance(Reference Guerrero-Igea, Lepe-Jimenez and Garrido-Serrano2, Reference Smith, Greenwood and Gunnell9, Reference Asao, Kao and Baptiste-Roberts12) and glucose intolerance(Reference Jang, Min and Lee13–Reference Moses and Mackay22). The relationship between short stature and cardiometabolic risk might be due to obesity and socio-economic factors. However, even after accounting for BMI, lifestyle and socio-economic status, short height or leg length was independently associated with a greater likelihood of insulin resistance, type 2 diabetes(Reference Lawlor, Ebrahim and Davey3) and CHD(Reference Forsen, Eriksson and Qiao7, Reference Smith, Greenwood and Gunnell9). BMI was also shown to be a less sensitive tool for the detection of high-risk cases in short-stature subjects when compared with taller subjects, because short stature modifies the relationship between BMI and obesity-associated co-morbidities(Reference Lara-Esqueda, Aguilar-Salinas and Velazquez-Monroy23). Mortality risk is known to increase with increasing percentage of fat mass (%FM) as well as decreasing lean mass (normalised by height as lean BMI (LBMI); kg/m2)(Reference Allison, Zhu and Plankey24, Reference Bigaard, Frederiksen and Tjønneland25). Because BMI is only an indirect parameter of body composition, differences in body composition, for example, a higher %FM and a lower LBMI per BMI might contribute to the higher metabolic and cardiovascular risk in short stature. The first evidence for a higher body fat mass per BMI in short stature came from data obtained from a small Mexican population with short stature who were compared with taller subjects, matched for sex, age and BMI(Reference Lopez-Alvarenga, Montesinos-Cabrera and Velazquez-Alva26). However, there are a lack of population data.
In children, BMI is known to moderately correlate with height(Reference Fung, Lee and Lau27–Reference Hattori and Hirohara29), a fact that raised concern about the preferential classification of taller children as overweight. However, contrary to the findings in adult Mexicans, adiposity (assessed by skinfold thickness) and height were positively correlated in children(Reference Himes and Roche30–Reference Freedman, Khan and Serdula32). Also, in contrast to epidemiological evidence in adults, recent trends in height and BMI of children showed that obese children were taller than their lean counterparts(Reference Kain, Uauy and Lera33, Reference Buchan, Bundred and Kitchiner34). Longitudinal data from the Bogalusa Heart Study provided evidence that tall-stature-associated childhood obesity is maintained in adulthood(Reference Freedman, Khan and Serdula32). As compared with short children, tall girls and boys aged 3–13 years had higher mean skinfold thickness in adulthood, a higher BMI and a 2- to 3-fold higher prevalence of obesity. In contrast to children, these associations were less strong or absent in 14- to 17-year-old adolescents(Reference Freedman, Khan and Serdula32).
The purpose of the present study was to (i) compare the prevalence of obesity between percentiles of height as well as between sexes and generations and (ii) investigate whether short or tall stature is associated with an adverse body composition. We analysed databases of Caucasian children, adolescents and adults with a wide range of age and BMI and hypothesised that shorter adults and taller children have a higher %FM and a lower LBMI per BMI.
Subjects and methods
The databases used in the present study have been described previously(Reference Bosy-Westpahl, Danielzik and Dörhöfer35, Reference Bosy-Westpahl, Danielzik and Dörhöfer36). Adults were recruited from 524 commercial weight-management facilities (Precon® centres) over a period of 14 years (from June 1990 to August 2003). Data of children and adolescents were taken from the Kiel Obesity Prevention Study assessed over a period of 11 years (1996–2006)(Reference Danielzik, Pust and Landsberg37). The study group consisted of 183 982 women (42·5 (sd 13·2) years, 18–102 years), 30 750 men (44·6 (sd 13·5) years, 18–100 years), 6240 girls (9·8 (sd 3·4) years, 5–17 years) and 6171 boys (9·8 (sd 3·4 years), 5–17 years). Data of 928 adults were excluded due to severe obesity (BMI >50 kg/m2). After exclusions, 30 628 men and 183 176 women (age range 18–102 years) remained eligible. All subjects were Caucasians, non-pregnant, non-lactating and healthy (defined as absence of a clinical condition that influences fluid balance). Body weight was measured to the nearest 0·1 kg and standing height to the nearest 0·5 cm with the subject in underwear and without shoes. BMI (in kg/m2) was calculated with weight (kg) and height (m) measurements. In adults, underweight, normal weight, overweight and obesity (grade I, II and III) were classified according to the World Health Organization(38). In children and adolescents, the 90th and 97th age- and sex-specific percentiles were applied for overweight and obesity using the actual German reference database(Reference Kromeyer-Hauschild, Wabitsch and Kunze39). A single tetrapolar body impedance analysis measurement of resistance and reactance was taken at a fixed frequency of 50 kHz between the right wrist and ankle (standard placement of surface electrodes) whilst in a supine position on a non-conductive surface with a body impedance analyser (BIA 2000-S; Data Input, Frankfurt, Germany; see Bosy-Westpahl et al. (Reference Bosy-Westpahl, Danielzik and Dörhöfer36) for a detailed description of the measurement procedure). In adults, lean body mass was calculated by the formula of Sun et al. based on a multicompartment model(Reference Sun, Chumlea and Heymsfield40). In children and adolescents, lean body mass was calculated from a population-specific algorithm generated and cross-validated by the use of air-displacement plethysmography in 158 children and adolescents aged 5–18 years(Reference Bosy-Westphal, Becker and Geisler41). LBMI was derived as lean body mass in kg divided by height squared in m2. Fat mass was calculated from weight – lean body mass. In children and adolescents, socio-economic status was defined according to parental education (highest level attained by either parent: ‘low’ = 9 school years; ‘middle’ = 10 school years, ‘high’ = 12 school years or more). Informed consent was obtained from all volunteers before participation. The study was approved by the Ethical Committee of the Christian-Albrechts-University of Kiel.
Men and women were grouped according to percentiles of height ( < 10th, 10th– < 25th, 25th– < 50th, 50th– < 75th, 75th– < 90th, ≥ 90th percentile), defined for males and females as 169 and 157 cm, 173 and 161 cm, 178 and 165 cm, 183 and 170 cm and 187 and 173 cm, respectively. In children and adolescents, sex- and age-specific German reference percentiles for height were applied ( ≤ 10th, >10th to ≤ 50th, >50th to < 90th, ≥ 90th to < 97th, ≥ 97th percentile)(Reference Kromeyer-Hauschild, Wabitsch and Kunze39). All data are given as mean values and standard deviations. Statistical analyses were performed using SPSS 13.0 for Windows (SPSS, Inc., Chicago, IL, USA). LBMI and %FM were adjusted for age by regression analysis. Comparison within BMI categories and between percentiles of height was performed by trend test using linear regression analysis. The statistical significance level was set at a two-tailed type I error of 0·05.
Results
Characteristics of the study population grouped according to sex and percentiles of height are shown in Table 1 (for adults) and Table 2 (for children and adolescents). The prevalence of underweight, normal weight, overweight and obesity was 0·2, 16·3, 37·8 and 45·7 % in women and 0·2, 7·6, 34·0 and 58·2 % in men, respectively. Of the girls, 9·1 and 5·9 % were classified as overweight and obese as well as 8·5 and 5·9 % of the boys, respectively. In men and women, there was a negative association between stature and age. Weight, lean body mass and fat mass were lower in those with short stature (Table 1). This was also observed in girls and boys, although the effect of age was less pronounced than in adults (Table 2).
(Mean values and standard deviations)

LBM, lean body mass; FM, fat mass.
(Mean values and standard deviations)

LBM, lean body mass; FM, fat mass.
Age-adjusted means for %FM and LBMI within each category of BMI and height are presented in Tables 3 and 4 (adults) and Table 5 (children and adolescents, including results for waist:hip ratio). Within all BMI categories (underweight, normal weight and obesity grade I, grade II and grade III), short-stature women had a lower %FM than tall women (differences between − 2·5 and − 0·8 %FM; P < 0·01). Stature was also positively associated with %FM in girls within each BMI group, except for overweight subjects (Table 5). In contrast, there was no significant trend for %FM with height in males, except for an increase in %FM with height in boys between BMI >10th and ≤ 50th percentile and a slight decrease in %FM with height in normal-weight men. In normal-weight, overweight and obese men as well as in obese women, LBMI was lower in short-stature subjects below the 10th percentile of height when compared with tall subjects above the 90th percentile (differences for LBMI between − 0·2 and − 0·6 kg/m2; P < 0·05; Tables 3 and 4). In contrast, there was no significant trend for LBMI in children and adolescents, with the exception of overweight boys who had a higher LBMI at a shorter stature (Table 5). Comparing waist:hip ratios between percentiles of height revealed a non -significant trend for a higher waist:hip ratio in shorter normal-weight girls and boys as well as obese boys (P for trend < 0·09).
(Mean values and standard deviations)

(Mean values and standard deviations)

(Mean values and standard deviations)
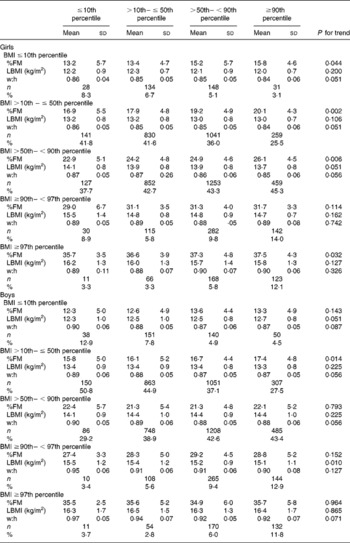
The prevalence of underweight, normal weight, overweight and obesity is summarised in Tables 3 and 4 (adults) and Table 5 (children and adolescents), grouped according to height and sex. The prevalence of obesity (grade I to grade III) was inversely associated with height. This was more pronounced in women than in men and in the morbidly obese subjects with BMI ≥ 40 kg/m2. When compared with tall subjects ( ≥ 173 cm in women and ≥ 187 cm in men), shorter women ( < 157 cm) had a 1·4-, 1·8- and 1·9-fold higher prevalence of obesity grade I, II and III and shorter men ( < 169 cm) had a 1·1-, 1·3- and 1·1-fold higher prevalence, respectively. In contrast, the prevalence of underweight was doubled in tall women above the 90th percentile of height when compared with short-stature women below the 10th percentile. Figure 1 shows the relationship between stature and weight status in women and men.
(a) Prevalence of underweight ( < 18·5 kg/m2), normal weight (18·5– < 25 kg/m2), overweight (25– < 30 kg/m2) and obesity grade I–III (30– < 35, 35– < 40 and ≥ 40 kg/m2 respectively) in women grouped by category of height percentile: (■), < 157 cm, < 10th percentile; (![]() ), < 161 cm, 10th– < 25th percentile; (
), < 161 cm, 10th– < 25th percentile; (![]() ), < 165 cm, 25th– < 50th percentile; (
), < 165 cm, 25th– < 50th percentile; (![]() ), < 170 cm, 50th– < 75th percentile; (
), < 170 cm, 50th– < 75th percentile; (![]() ), < 173 cm, 75th– < 90th percentile; (□), >173 cm, ≥ 90th percentile. (b) Prevalence of underweight ( < 18·5 kg/m2), normal weight (18·5– < 25 kg/m2), overweight (25– < 30 kg/m2) and obesity grade I–III (30– < 35, 35– < 40 and ≥ 40 kg/m2 respectively) in men grouped by category of height percentile: (■), < 169 cm, < 10th percentile; (
), < 173 cm, 75th– < 90th percentile; (□), >173 cm, ≥ 90th percentile. (b) Prevalence of underweight ( < 18·5 kg/m2), normal weight (18·5– < 25 kg/m2), overweight (25– < 30 kg/m2) and obesity grade I–III (30– < 35, 35– < 40 and ≥ 40 kg/m2 respectively) in men grouped by category of height percentile: (■), < 169 cm, < 10th percentile; (![]() ), < 173 cm, 10th– < 25th percentile; (
), < 173 cm, 10th– < 25th percentile; (![]() ), < 178 cm, 25th– < 50th percentile; (
), < 178 cm, 25th– < 50th percentile; (![]() ), < 183 cm, 50th– < 75th percentile; (
), < 183 cm, 50th– < 75th percentile; (![]() ), < 187 cm, 75th– < 90th percentile; (□), >187 cm, ≥ 90th percentile.
), < 187 cm, 75th– < 90th percentile; (□), >187 cm, ≥ 90th percentile.

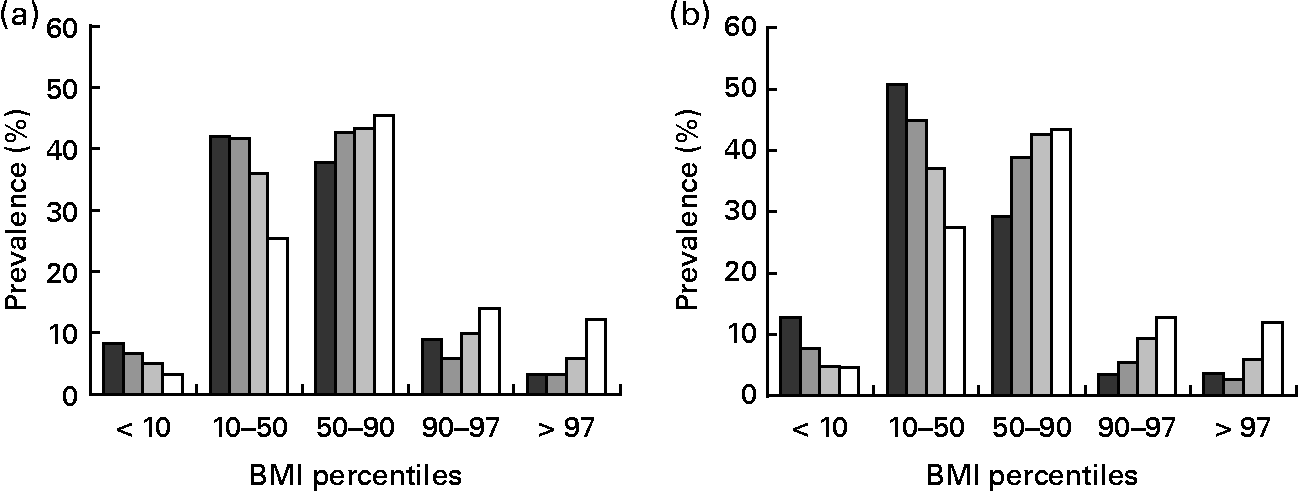
In contrast to adults, in both boys and girls there was a positive association between stature and obesity status. This trend was most pronounced in the obese group, with a 3·2- to 3·7-fold lower prevalence of obesity in short-stature boys and girls, when compared with taller subjects. Figure 2 illustrates the relationship between stature and weight status in girls and boys.
Prevalence of weight status according to BMI percentiles in girls (a) and boys (b) grouped by category of height percentile: (■), ≤ 10th percentile; (![]() ), 10th–50th percentile; (
), 10th–50th percentile; (![]() ), 50th–90th percentile; (□), ≥ 90th percentile.
), 50th–90th percentile; (□), ≥ 90th percentile.
Discussion
We found an increasing prevalence of obesity with decreasing stature in adults (Fig. 1). When compared with tall subjects, shorter women had a 1·3-, 1·8- and 1·9-fold higher prevalence of obesity grade I, II and III and shorter men had a 1·1-, 1·3- and 1·1-fold higher prevalence, respectively (Tables 3 and 4). In contrast, in tall girls and boys, the prevalence of overweight was 1·6- and 2·8-fold higher and the prevalence of obesity was 2·7- and 2·2-fold higher, when compared with short-stature children and adolescents (Table 5).
The present results in adults confirm previous data of other authors(Reference Gunnell, Whitley and Upton1–Reference Hermanussen, Sunder and Voigt4, Reference Velasquez-Melendez, Martins and Cervato42). Hermanussen et al. used data from German men born between 1974 and 1978 and pregnant women from the German birth statistics 1995–7 and found that morbidly obese subjects were shorter than average(Reference Hermanussen, Sunder and Voigt4). In line with the present results, other authors have also shown that obese children tend to be taller than their lean counterparts(Reference Freedman, Khan and Serdula32, Reference Kain, Uauy and Lera33), and BMI has risen more steeply from 1988 to 2003 in tall than in short 3-year-old British children(Reference Buchan, Bundred and Kitchiner34). However, in a sample of 6029 Flemish girls aged 6–16 years Beunen et al. found that size differences between fat and lean girls were primarily due to maturity differences(Reference Beunen, Malina and Lefevre43). It was concluded that during childhood and adolescence, fatness is associated with advanced and leanness with delayed biological maturity status. Since skeletal maturation thus occurs earlier in obese children, the positive association between stature and obesity in children and adolescents does not mean that the obesity epidemic will increase the mean height of the population. In fact, inverse causation may be deduced and preterm skeletal maturity in obese children may limit growth and final height in adults. In line with this idea, countries with the tallest adults have the lowest rates of obesity(Reference Hauspie, Vercauteren and Susanne44, Reference Garcia and Quintana-Domeque45).
A second possible explanation for the association between short stature and obesity in adults might be the large and standardised serving sizes of meals eaten at restaurants, supermarkets and canteens. Highly energy-dense foods and beverages are ubiquitous in many parts of the world. Since shorter individuals require lower energy intake, this may be especially burdensome to shorter individuals and could partly explain our findings. In fact, serving a larger portion of beverage has been shown to result in increased beverage consumption, and increased energy intake(Reference Flood, Roe and Rolls46). Comparing resting energy expenditure predicted according to age, sex and body composition(Reference Müller, Bosy-Westphal and Klaus47) between short- and tall-stature subjects ( < 10th v. >90th percentile of height) and disregarding a difference in physical activity energy expenditure, basal energy requirement in obese short-stature subjects is 1420–1760 kJ/d (340–420 kcal/d) lower (depending on sex and BMI group) when compared with tall-stature subjects of our adult study population. This difference resembles the energy content of a medium French fries (about 1460 kJ (350 kcal)) or a quarter-pounder burger (about 1760 kJ (420 kcal)). Thus we can speculate that lower energy requirements result in involuntary overconsumption of energy and thus a higher prevalence of overweight and obesity in short individuals. These data argue in favour of smaller portion sizes for short individuals.
Comparing body composition in short v. tall stature ( < 10th v. >90th percentile of height) revealed a lower %FM per BMI in short females and a normal %FM per BMI in short males (Tables 3, 4 and 5). Therefore, with the same BMI, cardiometabolic risk should be lower in short females. The results in women are in contrast to our hypothesis and the findings of Lopez-Alvarenga et al. (Reference Lopez-Alvarenga, Montesinos-Cabrera and Velazquez-Alva26), who showed a 1·4 % higher %FM in fifty-eight Mexicans with short stature when compared with sex-, age- and BMI-matched fifty-eight individuals with tall stature. These authors even reported a 4·2 % higher %FM in short v. tall overweight and obese subjects. However, our findings of a lower %FM in short v. tall girls are supported by previous studies that reported a positive association between adiposity and height in children(Reference Himes and Roche30–Reference Freedman, Khan and Serdula32). In the present study population LBMI was also lower in normal-weight, overweight and obese men as well as in obese women characterised by short stature as compared with those of taller stature (Tables 3 and 4). However, the observed differences were small ( − 0·2 to − 0·6 kg/m2) and are therefore unlikely to explain the higher cardiometabolic risk independent of BMI in individuals with short stature.
There are at least three alternative explanations for the elevated health risk in short stature independent of BMI. The first of these are genetic causes, either by a common inheritance of separate genes influencing height and disease risk (linkage), or by one gene influencing more than one phenotype trait, such as height or disease risk (i.e. pleiotropy). There are two very recent examples for pleiotropic effects: Wegner et al. have found a common variant in the LMNA gene, increasing the susceptibility to type 2 diabetes, fasting hyperglycaemia, serum cholesterol, body fat and short stature in a Danish population(Reference Wegner, Andersen and Sparsö48). In addition, Weedon et al. reported a common variant of HMGA2 to be associated with adult and childhood height in the general population. It may also increase cancer risk in tall individuals, because high-mobility group (HMG) proteins are DNA-binding proteins. These may alter chromatin structure for regulation of gene expression(Reference Weedon, Lettre and Freathy49).
Second, epigenetic causes could explain the elevated health risk in short stature. Short stature, due to malnutrition in early childhood, may lead to sustained alteration in gene expression. Thus, besides a thrifty phenotype that predisposes to obesity, adverse changes can occur in fat or glucose metabolism. However, up to now this hypothesis has not been proved.
Third, irrespective of fat mass and LBMI, fat distribution closely predicts cardiometabolic risk(Reference Bosy-Westphal, Geisler and Onur50, Reference Shen, Punyanitya and Chen51). We found a non-significant trend for a higher waist:hip ratio in shorter children and adolescents (P < 0·09; Table 5). Body composition analysis at the two-compartment level (fat mass and lean body mass) may not therefore be sufficient to explain the higher cardiometabolic risk in short stature. At present there is only one report of a more central body fat distribution in women with short stature(Reference Velasquez-Melendez, Martins and Cervato42). Additional studies are needed.
In conclusion, the higher prevalence of obesity in shorter adults may result from preterm skeletal maturation in obese children and adolescents limiting final height. Alternatively, shorter adults may be at increased risk for obesity, because at the same BMI, there are noticeable differences in energy requirements for short and tall adults, with short subjects being more susceptible to energy overconsumption due to standardised serving sizes of meals. It is a limitation of the present study that we only have cross-sectional data. Thus we may only speculate about the underlying reasons of the associations we found but must not infer causality.
Short and tall individuals do not differ much with respect to relative fat or lean body mass per BMI. Measurements of body fat distribution such as waist circumference and imaging technology may thus add to our understanding of the higher cardiometabolic risk, independent of BMI in short stature.
Acknowledgements
The authors' contributions were as follow: A. B.-W. and M. J. M. designed the study; R.-P. D. and S. P.-D. collected the data; A. B.-W. and S. P.-D. analysed the data; A. B.-W., M. J. M. and S. P.-D. discussed the data; A. B.-W. and M. J. M. wrote the manuscript.
The study was funded by Precon®, Darmstadt, Germany.
R.-P. D. as an author responsible for data collection between 1990 and 2003 was an employee of Data Input® company, which in 2001 merged with Precon®, Darmstadt.


