


One-third of all deaths globally are attributed to CVD(Reference Joseph, Leong and McKee1). In Australia, in 2017, 27 % deaths were attributed to CVD, making it a leading cause of death and disability(2). Key modifiable risk factors for CVD include smoking, physical inactivity and unhealthy diet (including high Na intake)(Reference Joseph, Leong and McKee1,Reference Weaver3) .
There is an abundance of evidence linking high Na intake to poor health outcomes with the most notable being increased blood pressure throughout life(Reference He and MacGregor4–Reference Hanneman6), which can result in premature stroke, heart attack and kidney disease(Reference Lim, Vos and Flaxman7). Findings from meta-analyses of randomised controlled trials show that reducing Na intake leads to significant reductions in blood pressure(Reference He, Li and Macgregor8). The majority of Na is consumed as salt – as a seasoning or a food additive in processed foods. The WHO recommends salt consumption to be limited to <5 g/d in adults(9). Australia’s Suggested Dietary Target echoes this(10). However, the global estimate of daily salt consumption is 10·1 g/d(Reference Powles, Fahimi and Micha11). In Australia, a systematic review estimated a mean salt intake of 8·7 g/d(Reference Land, Neal and Johnson12).
The WHO has made a recommendation to all Member States that population salt consumption be reduced by 30 % as part of an effort to reduce premature mortality from non-communicable diseases by one quarter by 2025(Reference Beaglehole, Bonita and Horton13,Reference Kontis, Mathers and Rehm14) . As a WHO member state, Australia has committed to reducing average salt intake by 30 % by 2025 (Reference Beaglehole, Bonita and Horton13,Reference Webster, Dunford and Kennington15–Reference McNamara, Knight and Livingston17) . In Australia, the National Health and Medical Research Council of Australia (NHMRC) suggests limiting intake of food and drinks with added salt(10,18) . Despite national recommendations, efforts to deliver salt reduction in Australia have been limited(Reference Jones, Magnusson and Swinburn19). To date, a collective Healthy Food Partnership (built upon the previous Food and Health Dialogue(Reference Jones, Magnusson and Swinburn19)) has been initiated between government, the public health sector and food industry to improve dietary habits of Australians(20). This initiative includes a specific focus on Na intake and includes setting voluntary Na content reformulation targets for processed foods(20).
In 2015, the Victorian Health Promotion Foundation (VicHealth) launched a statewide salt reduction initiative across Victoria, Australia(21). Victoria is a state in Australia where about 25 % of the national population resides(22). To guide this work, the Victorian Salt Reduction Partnership was formed, a group comprising stakeholders from health-related non-government organisations, state government and the academic sector. The initiative’s goal is to drive salt reduction action from government, industry and the general public and aims to reduce salt intake of Victorians (adults and children) by 1 g/d. The comprehensive initiative is described elsewhere(Reference Trieu, Jan and Woodward23) but includes five key intervention strategies – forming a strategic partnership, raising consumer awareness to improve attitudes and change behaviours, strengthening policy initiatives, supporting food industry innovation, and ongoing rigorous research, monitoring and evaluation(24).
The aims of the present study were to assess Na intake, food sources of Na (including level of processing, purchase origin of these foods) and discretionary salt use in a cross section of Victorian adults prior to the salt reduction initiative.
The outcome will act as a baseline measure for which future measurements can be compared against to determine whether strategies employed by the Victorian Salt Reduction Partnership are effective in reducing the amount of salt Victorians are eating. The information regarding sources of Na in the diet can also be used to inform intervention development.
Methodology
Participant recruitment
Participant recruitment quotas aimed to have a sample reflective of the distribution of the age and sex within the Victorian adult population(25). To do this, continual tracking of response rates by age group and sex was conducted and, as required, invitation across sub-groups was modified. Participants in the present study were drawn from three sources. First, all participants from a previous study conducted in 2014(Reference Nowson, Lim and Grimes26) who had consented to be contacted for future follow-up studies were invited to participate in October 2016. These participants were originally part of a Victorian statewide cross-sectional, population-health measurement survey, the Victorian Health Monitor survey and were randomly selected from fifty metropolitan and rural Victorian areas(27). Second, participants were randomly selected from the Victorian electoral roll by randomising the electoral list for each age group and sending out invitation letters (about 1000 per mail out (five mail outs total)) with the expectation of a 5 % response rate based upon previous studies(Reference Land, Wu and Selwyn28) in November 2016. Due to the low number of responses from participants aged 18–34 years recruited from these two methods, additional participants were recruited by holding a stall during university orientation week held in February 2017 across two Deakin University campuses (one urban, one regional).
All participants provided written informed consent. Participants were excluded if they were not aged between 18 and 65 years old at the time of consent, were currently undergoing chemotherapy or did not live close to a Dorevitch Pathology centre (an Australian accredited commercial pathology service centre). A $20 supermarket voucher was offered as an incentive for participants completing the urine collection.
Sample size
The sample size calculation for this study is based upon a pre-/post-design and the need to test for differences at the end of the study. Follow-up data will be collected in late 2019/early 2020. Evaluation of urinary Na excretion in adults indicated that a sample size of 400 individuals was required such that there was >90 % power at α = 0·05 to detect a 1 g or greater difference in average salt consumption from baseline to follow-up. This estimate assumes mean salt intake in adults of 9 g/d (sd 3·6 g/d)(Reference Land, Webster and Christoforou29).
Demographic, anthropometric and discretionary salt use data
A self-reported survey collecting basic demographic information, anthropometry, medications, supplements and discretionary salt use was mailed out to consenting participants with a reply paid envelope.
Three survey questions were used to assess salt use: (1) whether the participant usually adds salt to their food at the table; (2) whether the participant usually adds salt to food when cooking and (3) whether the participant was doing anything on a regular basis to control their salt or Na intake. BMI was calculated from self-reported height and weight (weight (kg)/height (m2)), and participants were grouped according to WHO BMI classifications(30).
Collection of 24-h urine data
Urine was collected over a 24-h period. Participants could collect their urine on any day of the week. The instructions included a timesheet to record the date, the start and finish times of urine collection, and whether any urine was missed (and the quantity of urine that was missed). A spot urine was also collected within the 24-h urine collection period for a separate validation study. Participants transported their collections to a local Dorevitch Pathology centre, and the urine volume and Na for the 24-h and spot samples were determined using Ion Selective Electrode methodology; and creatinine concentrations were determined (using Jaffe, alkaline picrate, kinetic with black rate correction methodology) in a Siemens ADVIA 2400 autoanalyser. The length of 24-h urine collections times was 16·8–38 h, and all urinary results were standardised to a 24-h period. The volume (50 ml) and biochemical data from the spot urine collection were added to the 24-h urine collection data to quantify total volume and excretion in 24-h. Creatinine excretion was used as an indicator of urine collection completeness(Reference Forni Ogna, Ogna and Vuistiner31). The 24-h urine samples were excluded based upon previously published criteria which indicate probably under or over collection of urine(Reference Nowson, Lim and Grimes26,Reference Land, Webster and Christoforou29,Reference Cogswell, Loria and Terry32) . The exclusion criteria were if: females had a creatinine <4 mmol/24-h or extreme outliers (>3 sd from female mean); males with creatinine <6 mmol/24-h or extreme outliers (>3 sd from male mean); urine volume <500 ml; more than one reported void missing of >300 ml. The molecular weights of Na (23 g/mol) and sodium chloride (58·5 g/mol) were used to convert mmol to mg.
Comparison of sodium intake to dietary guidelines
Na intake was based on 24-h urinary excretion values. The proportion (%) of adults exceeding the WHO guideline of <2000 mg/d Na (salt equivalent 5 g/d) per d was calculated. For comparison with the NHMRC Suggested Dietary Target for Na of 86 mmol/d (2000 mg/d Na), the sample’s median Na intake is reported. This Suggested Dietary Target reflects the median intake of the population that may help in the prevention of chronic disease(33).
Collection and analysis of 24-h dietary recall data
The telephone-administered five-pass 24-h dietary recall took approximately 20–30 min to complete. The diet recall was conducted within 2 weeks of the urine collection. The aim was 200 diet recalls (100 males, 100 females) with a sex and age distribution reflective of the Victorian population as detailed above. To target our sampling for the diet recall, participants were stratified by age and sex and assigned ID numbers which were randomly assorted for selection and invitation to complete a diet recall. Participants on the list were contacted until the target number was achieved for each age group and sex. Dietary intake was attempted to be captured across a spread of weekdays and weekends, dependent on participant availability. Due to research staff unavailability, no interviews were conducted on Sundays; therefore, diet intake was not captured for a Saturday. Most of the diet recalls were related to dietary intake between Monday and Friday (79 %) and the remainder on a Sunday (21 %).
The five-pass method included: (i) quick list, (ii) forgotten foods, (iii) time and occasion, (iv) detail cycle and (v) final probe, based upon the method used in the 2011–2012 National Nutrition and Physical Activity Survey(34). Participants estimated portion sizes using the Australian Health Survey food model booklet(35).
To determine the source of the foods listed during the diet recall, the following question was asked ‘Where did you get this/most of the ingredient for this (food name)?’(36). The responses for this question were based on those used in the US National Health and Nutrition Examination dietary interview(36), but response options were modified for the Australian context. Response categories in the current survey included: (1) store (e.g. grocery, supermarket, convenience, specialty); (2) fresh food market (e.g. butcher, local/farmers/fruit vegetable market, green grocer); (3) quick service restaurant or takeout/delivery (e.g. fast food chains or takeaway); (4) full service restaurant (e.g. sit-down restaurant, café); (5) bar or tavern; (6) vending machine; (7) sport, recreation or entertainment facility (e.g. sporting clubs, movies, music venue); (8) grown or caught; (9) from someone else/gift; (10) water from tap; (11) don’t know; (12) other, please specify.
Data were entered into FoodWorks version 8 (Xyris). When recording mixed dishes (e.g. bolognaise sauce), as much detail as possible was collected about each disaggregated ingredient contained within the mixed dish (including quantity). If the participant reported a recipe to feed more than one, information on the portion of the recipe consumed was also recorded. In addition to this, all participants quantified the total quantity of the mixed dish consumed. At the data entry stage, one of the two approaches was taken for handling mixed dishes. In the first instance, the dietitian entering recalls examined all reported ingredients of mixed dishes and mapped this to a best match mixed dish equivalent food code available in the AUSNUT 2011–2013 food composition database. For example, in the case of a home-made bolognaise sauce, this could be matched to an existing AUSNUT food item code for home-made bolognaise sauce and the quantity of this consumed was recorded. When a best match AUSNUT food item could not be found for the reported mixed dish, the dietitian entered a recipe into FoodWorks using the participant’s reported information on disaggregated ingredients and serving size consumed. At the stage of analysis, no further disaggregation of AUSNUT matched mixed dish food codes was undertaken. Information reported by participants on salt added to foods at the table or during cooking was not entered into FoodWorks. This is because of the inherent difficulties in accurately quantifying and recording this information. This aligns with the way that home-made recipes are compiled within the AUSNUT 2011–2013 food composition database by Food Standards Australia New Zealand(37). Nutrient intake was calculated using the Australian nutrient composition database AUSNUT (2011–2013), and Na and energy intakes were reported(38). The Schofield equation(Reference Schofield39) was utilised to estimate BMR, and the Goldberg method was utilised to identify under-reporters (i.e. ratio of energy intake:estimated BMR) with the appropriate cut-off value for the sample size (energy intake:estimated BMR < 1·49 for n 200)(Reference Gibson40). Prior to excluding those with an energy intake:estimated BMR < 1·49, plausibility of the 24-h dietary record was assessed by examining the individual dietary records to review the amounts and types of foods eaten across the day and any notes entered by the researcher conducting the recall. This includes the participant’s response to the question ‘Was the amount of food that you ate yesterday much more than usual, usual, or much less than usual?’ Based on this additional information and professional judgement of the team (which included two dietitians), a consensus was met regarding whether dietary intake was plausible; and if not, the data were excluded.
Each food item consumed was matched to a code in the AUSNUT food composition database(38). These food group codes were used to determine the contribution of Na from sub-major food groups.
Categorising the level of processing in foods using NOVA classification system
To categorise the level of processing in foods, the NOVA classification system was used(Reference Moubarac, Parra and Cannon41). The NOVA system categorises foods into four categories based upon their level of processing: unprocessed and minimally processed category; processed culinary ingredient category; the processed food category and the ultra-processed category(Reference Moubarac, Parra and Cannon41). As previously described(Reference O’Halloran, Lacy and Woods42), the NOVA processing classification system was applied to the food items in the Australian nutrient composition database AUSNUT database (2011–2013). A full list of corresponding AUSNUT 2011–2013 food codes and categorisation as minimally processed, processed culinary ingredient, processed food or ultraprocessed can be found within the published paper(Reference O’Halloran, Lacy and Woods42).
Classifying foods into core and discretionary
Using methods previously described(Reference Grimes, Riddell and Campbell43), individual foods were also classified as being a core or discretionary food as defined by the Australian Guide to Healthy Eating(18,44) . Core foods include the five food groups: grain (cereal) foods; vegetables, legumes/beans; fruit; milk, yogurt, cheese and/or alternatives; lean meats, poultry, fish eggs, tofu, nuts, sees, legumes/beans, water, polyunsaturated and monounsaturated spreads and oils(18). Discretionary foods are foods that are not within these five food groups and should be consumed occasionally and in small amounts as they are high in kJ, saturated fat, added sugars and salt or alcohol(18). Examples of discretionary foods include sweet biscuits and cakes, pastries, processed meats, confectionery, fried foods and sugar-sweetened beverages(18).
Data analysis
Participants’ level of disadvantage was estimated using participant postcode and the Socioeconomic Index for Areas Index of Relative Socioeconomic Disadvantage(45). Deciles of Socioeconomic Index for Areas data were combined to make quintiles in analysis.
Data were analysed using Stata version 15.0 (StataCorp LLC). Due to the under-representation of younger aged males and females, particularly in ages 25–34 years old, a post-stratification weight was created. This weight was created based upon the age and sex distribution of the Victorian adult (18–65 years) population(25). For analysis, the probability weight (pweight) was applied in Stata. A P value of <0·05 was considered statistically significant in all cases and based on weighted data. Unweighted estimates are also presented. Descriptive statistics (mean, standard deviation, 95 % CI, n, proportion (%)) were calculated. Differences in urinary electrolyte excretion by sex were examined using a t test. The contribution of Na from the different food categories and each of the food origins (e.g. store, fresh food market, vending machine) was determined using the population proportion method(Reference Krebs-Smith, Kott and Guenther46). To help with interpretation of results, we computed the contribution of energy. This was completed for food groups based on level of processing, core and discretionary foods and food origin; it was not completed for the AUSNUT food group classification as these data are already available(47).
Ethical approval
Ethics approval was obtained from the Faculty of Health Human Ethics Advisory Group, Deakin University (HEAG-H 71_2016).
Results
All data presented are weighted estimates.
Sample demographics
The number of participants invited to the study was 6169 (271 from 2014 study; 5694 from the electoral roll, 204 O-week participants); however, six did not meet the study inclusion criteria, one was deceased and fourteen invitations were returned to sender with an incorrect address. There were 462 participants in total who consented to participate in the study; however, ninety-three dropped out of the study (i.e. formally withdrew or did not provide any data or were no longer contactable); four were not required as we had reached the age group quota (refer to online Supplementary Fig. S1 for flow chart depicting final sample).
A further ten were excluded as they did not provide complete data (i.e. they did not complete urine collection (n 1), did not complete the demographic and discretionary salt survey (n 1) or did not complete the urine collection and the survey (n 8)). The combined response rate for completed data was 7·5 % (refer to online Supplementary Table S1 for individual recruitment arm response rates).
Regarding urine collection, urine samples were lost (n 5), collections were returned to the wrong pathology laboratory and subsequently lost (n 5). Of the 345 urine samples analysed, seven were excluded from analysis (e.g. females with creatinine <4 mmol/24-h (n 0) or outliers (>3 sd from female mean, n 3); males with creatinine <6 mmol/24-h (n 1) or outliers (>3 sd from male mean, n 0); urine volume <500 ml (n 1); more than one reported void missing of >300 ml (n 2)). Therefore, the final sample size of participants with a urine collection was 338 participants. Demographic data for adults with a complete urine collection are presented in Table 1 (for unweighted sample demographics refer to online Supplementary Table S2).
Demographic characteristics of a sample of Victorian adults aged 18–65 years (weighted)
(Percentages; mean values and standard deviations)

* Data taken from Australian census(25).
† Data taken from Australian Bureau of Statistics 2017(48). Note this statistic includes 15–24 years olds living in Victoria.
‡ Data from Victorian Population Health Survey 2016 (note proportion does not add to 100 % due to responses such as ‘don’t know’ or ‘refused’(49).
A total of 155 participants (sixty-five males, ninety females) completed a 24-h dietary recall. Ten participants were identified as potential under-reporters using Schofield/Goldberg cut-offs; and after further examination of individual 24-h diet recalls, it was determined that diet intake was plausible for six participants; therefore, only four participants were excluded. Nine participants did not have body weight data, and therefore, under-reporting status could not be determined and they were excluded. Once these under-reporters were excluded, the final sample for diet recall was 142 participants (Table 1).
Sodium and salt from urine collection and diet recall data
Mean 24-h Na and salt equivalent (by both urinary excretion and diet recall) were significantly higher for males compared with females (P < 0·05) (Table 2). The majority of participants (79 %) exceeded the WHO’s recommended limit of 5 g of salt per d (90 % of males, 70 % of females). The median Na excretion of 124 mmol/d was above the NHMRC Suggested Dietary Target of 86 mmol/d. For unweighted 24-h urinary excretion and dietary recall data refer to online Supplementary Table S3.
Urinary electrolyte excretion and dietary intake in a sample of Victorian adults aged 18–65 years (weighted)*
(Mean values and 95 % confidence intervals; median values and interquartile ranges (IQR))
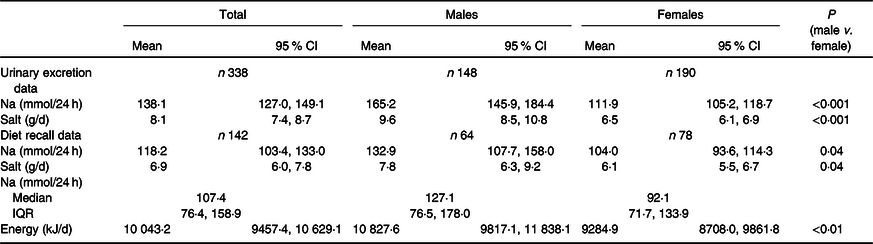
* Diet recall by 24-h dietary recall.
Food sources of sodium
The contributions of Na by sub-major food groups are presented in Fig. 1. The largest contributors to Na intake were regular cereal-based mixed dishes (12 %), English style muffins, flat breads, savoury and sweet breads (9 %), regular breads, bread rolls (9 %), gravies and savoury sauces (7 %), processed meat (7 %), home-made soup (5 %), cheese (3 %), and cakes, muffins, scones, cake-type desserts (3 %). When foods were categorised as either core or discretionary (Fig. 2), just over two-thirds of all Na came from core foods. When foods were categorised by level of food processing (Fig. 3), the largest contributor to Na intake was the ultra-processed category.
Contribution (%) of sodium (weighted) from sub-major food groups (if contribution ≥1 %) in a sample of Victorian adults aged 18–65 years (n 142).

Daily contribution (%) of sodium and energy (weighted) from core and discretionary foods among a sample of Victorian adults aged 18–65 years (n 142).  , Core;
  , discretionary.

Daily contribution (%) of sodium and energy (weighted) by level of food processing in a sample of Victorian adults aged 18–65 years (n 142).  , Sodium;
  , energy.

Sources of sodium and energy (weighted, if contribution ≥1 %) in a sample of Victorian adults aged 18–65 years (n 142).  , Na;
, Na;  , energy. Note: store includes grocery/supermarket, convenience store, specialty; quick service restaurant includes fast food chains, takeaway, delivery; fresh food market includes the butcher, local/farmers/fruit and vegetable markets, green grocers; full service restaurant includes sit-down restaurant, café.

Fig. 4 presents the contribution of Na and energy obtained from each food source location. Just over half (51 %) of all Na consumed derived from foods sourced from food stores (e.g. grocery/supermarket/convenience). The remainder came from foods sourced at quick service restaurants/takeaways (19 %), fresh food markets (e.g. butcher, local/farmers/fruit vegetable market, green grocer) (9 %) and full service restaurants (9 %). Note that 3 % of Na consumed was missing a source location. The contribution of energy obtained from each food source followed a similar pattern to Na.
Analysis of survey data: discretionary salt use
The majority of participants reported that they rarely/never added salt to their food at the table (68 %); however, two-thirds (61 %) of participants added salt frequently (sometimes, often, always) whilst cooking (Fig. 5). The majority (74 %) of participants reported that they were not doing anything regularly to control their salt intake. The remainder either reported that they were doing something on a regular basis to control their salt intake (22 %) or that they did not know (4 %).
Discretionary salt use (weighted) in a sample of Victorian adults aged 18–65 years (n 338). (a) Reported use of table salt; (b) reported use of cooking salt.

Discussion
Findings revealed that in this population of Victorian adults in 2016/2017, participants were over-consuming Na. The average salt intake as determined by 24-h urinary salt excretion was 8·1 g/d which equates to an intake of about 8·9 g/d after 10 % adjustment for non-urinary losses (10·6 g/d males (10 % adjustment); 7·2 g/d females (10 % adjustment))(Reference McLean, Farmer and Nettleton50,Reference Lerchl, Rakova and Dahlmann51) ; and 79 % of participants exceeded the WHO’s limit of 5 g of salt per d. The findings of this study also provide information on where Na (food sources and location of origin) is derived from in the diet. Taken together, these findings provide a robust baseline measure and have been used to inform intervention strategies for the statewide salt reduction in Victoria.
High levels of Na/salt consumption are consistent with other studies in Australia(Reference Nowson, Lim and Grimes26), the UK(Reference He, Pombo-Rodrigues and Macgregor52) and USA(Reference Cogswell, Loria and Terry32). Despite the present study having a smaller sample size, and a younger mean participant age, the study findings are very similar to Na intake previously reported in Victorian adults in 2014(Reference Nowson, Lim and Grimes26). The present study findings are also consistent in demonstrating a disparity in Na intake by sex. Males have typically been shown to have higher Na intakes compared with females(Reference Powles, Fahimi and Micha11,Reference Cogswell, Loria and Terry32) .
In this Victorian sample, the top three sources of Na intake were cereal-based mixed dishes, bread products, gravies and sauces. This is consistent with other studies in Australia showing bread and cereals were the main contributors to dietary Na intake (29 %(Reference Charlton, Yeatman and Houweling53); 38 %(Reference Margerison, Riddell and Wattanapenpaiboon54) and similar to studies from the USA(Reference Quader, Zhao and Gillespie55)). These findings have also been replicated in Australian children(Reference O’Halloran, Lacy and Woods42,Reference Grimes, Campbell and Riddell56) . The findings from the present study and others(Reference Charlton, Yeatman and Houweling53) demonstrate that highly consumed products such as breads and cereals should be priority targets for Na reduction(Reference Charlton, Yeatman and Houweling53). The Healthy Food Partnership is currently engaging and supporting industry to lower the Na content of their food products by reformulation(20).
Whilst research exists showing the main contributors of dietary salt within current diets, the source of where these food items were obtained (purchased) is scarce(Reference Drewnowski and Rehm57) and not available for Australia, yet is crucial to know to support the development of salt reduction strategies(Reference Jaworowska, Blackham and Stevenson58). The present study revealed the majority of food items (51 %) contributing to Na consumption were obtained from stores, for example, supermarkets, grocery and convenience stores. Another important source was the food service sector (e.g. full service restaurant and quick service restaurant), foods obtained from here accounted for 28 % of all Na consumed in the present study. This is similar to National Health and Nutrition Examination data in the USA which revealed in adults aged 20–50 years, 58 % of Na consumed was derived from stores, 13 % from full service restaurants and 19 % from quick service restaurants(Reference Drewnowski and Rehm57). These key settings, that is, supermarket, restaurants, cafés, fast food outlets and takeaways, represent promising environments for salt reduction action with good reach to the wider population. Reducing Na intake at a population level will involve reformulation of lower Na foods available within supermarkets as well as action to modify food purchase behaviours at these retail settings(Reference Drewnowski and Rehm57).
Current diets are heavily reliant on packaged and processed foods(Reference Monteiro, Moubarac and Cannon59). Whilst the Australian Guide to Healthy Eating recommends limiting discretionary food choices(18), over one-third of Na consumed in the present study stemmed from these types of discretionary foods. While not specific for Na, it has previously been reported in an Australian national representative survey (National Nutrition and Physical Activity Survey 2011–2012) that about one-third of energy intake derived from discretionary foods(Reference Sui, Wong and Louie60).
Globally ultra-processed foods have been found to be prominently consumed in a Western diet(Reference Baraldi, Martinez Steele and Canella61–Reference Adams and White67). In the present study, overall, the majority of Na (51 %) was consumed from ultra-processed foods. Given the link between the consumption of ultra-processed foods and the increased risk of developing obesity and diet-induced chronic disease(Reference Monteiro, Moubarac and Levy65,Reference Martinez Steele, Juul and Neri68,Reference Juul, Martinez-Steele and Parekh69) , this information advocates for salt reduction initiatives to not only reduce Na content via reformulation in processed and ultra-processed products(Reference Scrinis and Monteiro70) but also discover how to encourage consumers to choose healthier, fresh options. Reformulation of processed and ultra-processed products should not be the only focus as reformulation may promote consumption of these products rather than improve the quality of individuals’ diets by increasing consumption of minimally processed foods(Reference Scrinis and Monteiro70).
In the present study, about one-third (32 %) of participants reported that they added salt at the table either always, often or sometimes. This is aligned with previous estimates on reported table salt use within a nationally representative sample(71) as well as a Victorian study(Reference Nowson, Lim and Grimes26). Specifically, findings from the Australian Health Survey 2011–2012 showed that 39 % of Australian adults added salt at the table either very often or occasionally(71). The present study also revealed that almost two-thirds (61 %) of participants added salt (sometimes/often/always) whilst cooking. This is higher than previous studies of 48 % among Victorian adults in 2014(Reference Nowson, Lim and Grimes26) and 50 % among an Australian national sample(71). The addition of salt whilst cooking presents an education opportunity for discretionary salt reduction.
Implications
Taken together, these data provide a robust baseline to compare against when examining the effectiveness of the statewide salt reduction initiative, and strong evidence for salt reduction action in supermarket, restaurant, café, takeaway settings. Salt reduction should be a multi-pronged approach with strategies being implemented across multiple levels and settings. It is also crucial that evaluation is a key part of the salt reduction initiatives, with the need for systematic, standardised and repeated monitoring of a national sample of the population in order to determine the effectiveness of salt reduction strategies, tracking this progress against the ultimate goal of reducing salt intake at a population level by 30 % by 2025(Reference Land, Neal and Johnson12,16) .
In 2004, the UK Food Standards Agency implemented a national salt reduction programme and, over 7 years, there was a 15 % reduction in population salt intake from 9·5 g/d to 8·1 g/d(Reference He, Pombo-Rodrigues and Macgregor52,72) . Building upon the success in the UK, in Victoria, the Victorian Salt Reduction Partnership(Reference Trieu, Jan and Woodward23) aims to leverage existing federal and state-level healthy eating policies relating to salt reduction and advocate for stronger government action – including (1) Na reformulation targets for foods; (2) surveillance systems be established to monitor Na composition in foods and population consumption; (3) implement a national healthy eating campaign focusing on reducing salt intake. Follow-up evaluation collected at the end of 2019 will reveal the effectiveness of salt reduction action on Na consumption behaviours.
Key strengths of this study include using the gold standard, objective measure of Na intake. Validated tools and methodologies have been used, including diet recall methodology(34), food classification systems(38) and the NOVA level of processing classification system(Reference Moubarac, Batal and Martins73). However, there are some study limitations. Despite best efforts and various recruitment methodologies, there was an overall low response rate, and in particular among younger male adults; however, the data were weighted by the age and sex distribution of the Victorian population to help adjust for this. Regarding the 24-h diet recall, there may be recall and social desirability bias(48) and a small degree of under reporting whereby ultra-processed foods could be underestimated(Reference Baraldi, Martinez Steele and Canella61). It is recognised that the 24-h recall does not capture Na added from discretionary salt use(Reference McLean, Farmer and Nettleton50,Reference Freedman, Commins and Moler74) and that participants may under report their food intake which may also impact on Na intake(Reference McLean, Farmer and Nettleton50). Whilst the sample was made up of previous study participants, randomised electoral roll participants and university students, these results should not be generalised as the previous study participants might have an interest in health. Additionally, only one 24-h dietary recall and one 24-h urine sample were collected; therefore, these may not be reflective of usual Na intake(Reference Loria, Obarzanek and Ernst75). However, a single 24-h urine or 24-h diet recall is adequate to estimate group means in large populations(Reference Drewnowski and Rehm57), and numerous 24-h urine collections would add to a participant’s burden. As only 1 d of 24-h urine data was available, we could not adjust the distribution of salt intake for within-person variation; this may lead to an overestimation of the proportion of adults exceeding the 5 g/d limit for salt consumption. Ideally, it would be preferable to collect both the 24-h urine collection and the 24-h dietary recall at the same time; however, this was not possible for logistic reasons. Additionally, whilst origin of purchase of each food product was collected, the actual eating location was not, which will have implications for interpreting how individuals interact with the food environment they purchase from(Reference Drewnowski and Rehm57). Despite this, these data are useful to estimate group means in this sample population and understand the Na intake, food sources and origin of sources contributing to Na intake among Victorian adults.
Conclusion
In this Victorian sample of adults, Na intake was higher than recommendations. This has suboptimal health consequences such as increasing the risk of chronic disease, particularly CVD. This study has revealed settings to leverage from regarding salt reduction interventions, particularly in supermarkets and the food service sector. The present study findings will inform salt reduction intervention development and act as a baseline indicator to determine whether strategies employed by the Victorian Salt Reduction Partnership are effective in reducing the amount of salt Victorians consume.
Acknowledgements
The authors would like to acknowledge Madi West for assistance with data collection and data management. The authors would also like to thank all individuals who participated in this study.
This study is funded by the NHMRC, funds awarded: $536 446·80, ($374 742·00 awarded to the Deakin University research team). NHMRC ID: APP1111457. Project Title: Reducing population salt consumption in Victoria. Type: Partnership Projects with additional funding from the Victorian Health Promotion Foundation.
J. W. was supported by a National Heart Foundation Future Leaders Fellowship APP102039. K. T. was supported by an Early Career Fellowship (APP1161597) from the NHMRC and a Postdoctoral Fellowship (Award ID 102140) from the National Heart Foundation of Australia.
All co-authors contributed to the design of the study. K. A. B. conducted the analysis of the data and led the writing of the manuscript with support from C. G. All authors provided input into interpretation of the data and have read and approved the final manuscript.
The authors declare that there are no conflicts of interest.
Supplementary material
For supplementary material referred to in this article, please visit https://doi.org/10.1017/S000711452000032X


